


Characterizing zonulin and par2 Expression in Zonulin Transgenic and Zonulin Inhibition Mouse Models of Motility and Inflammation
 ,
, 
Abstract
1. Introduction
2. Results
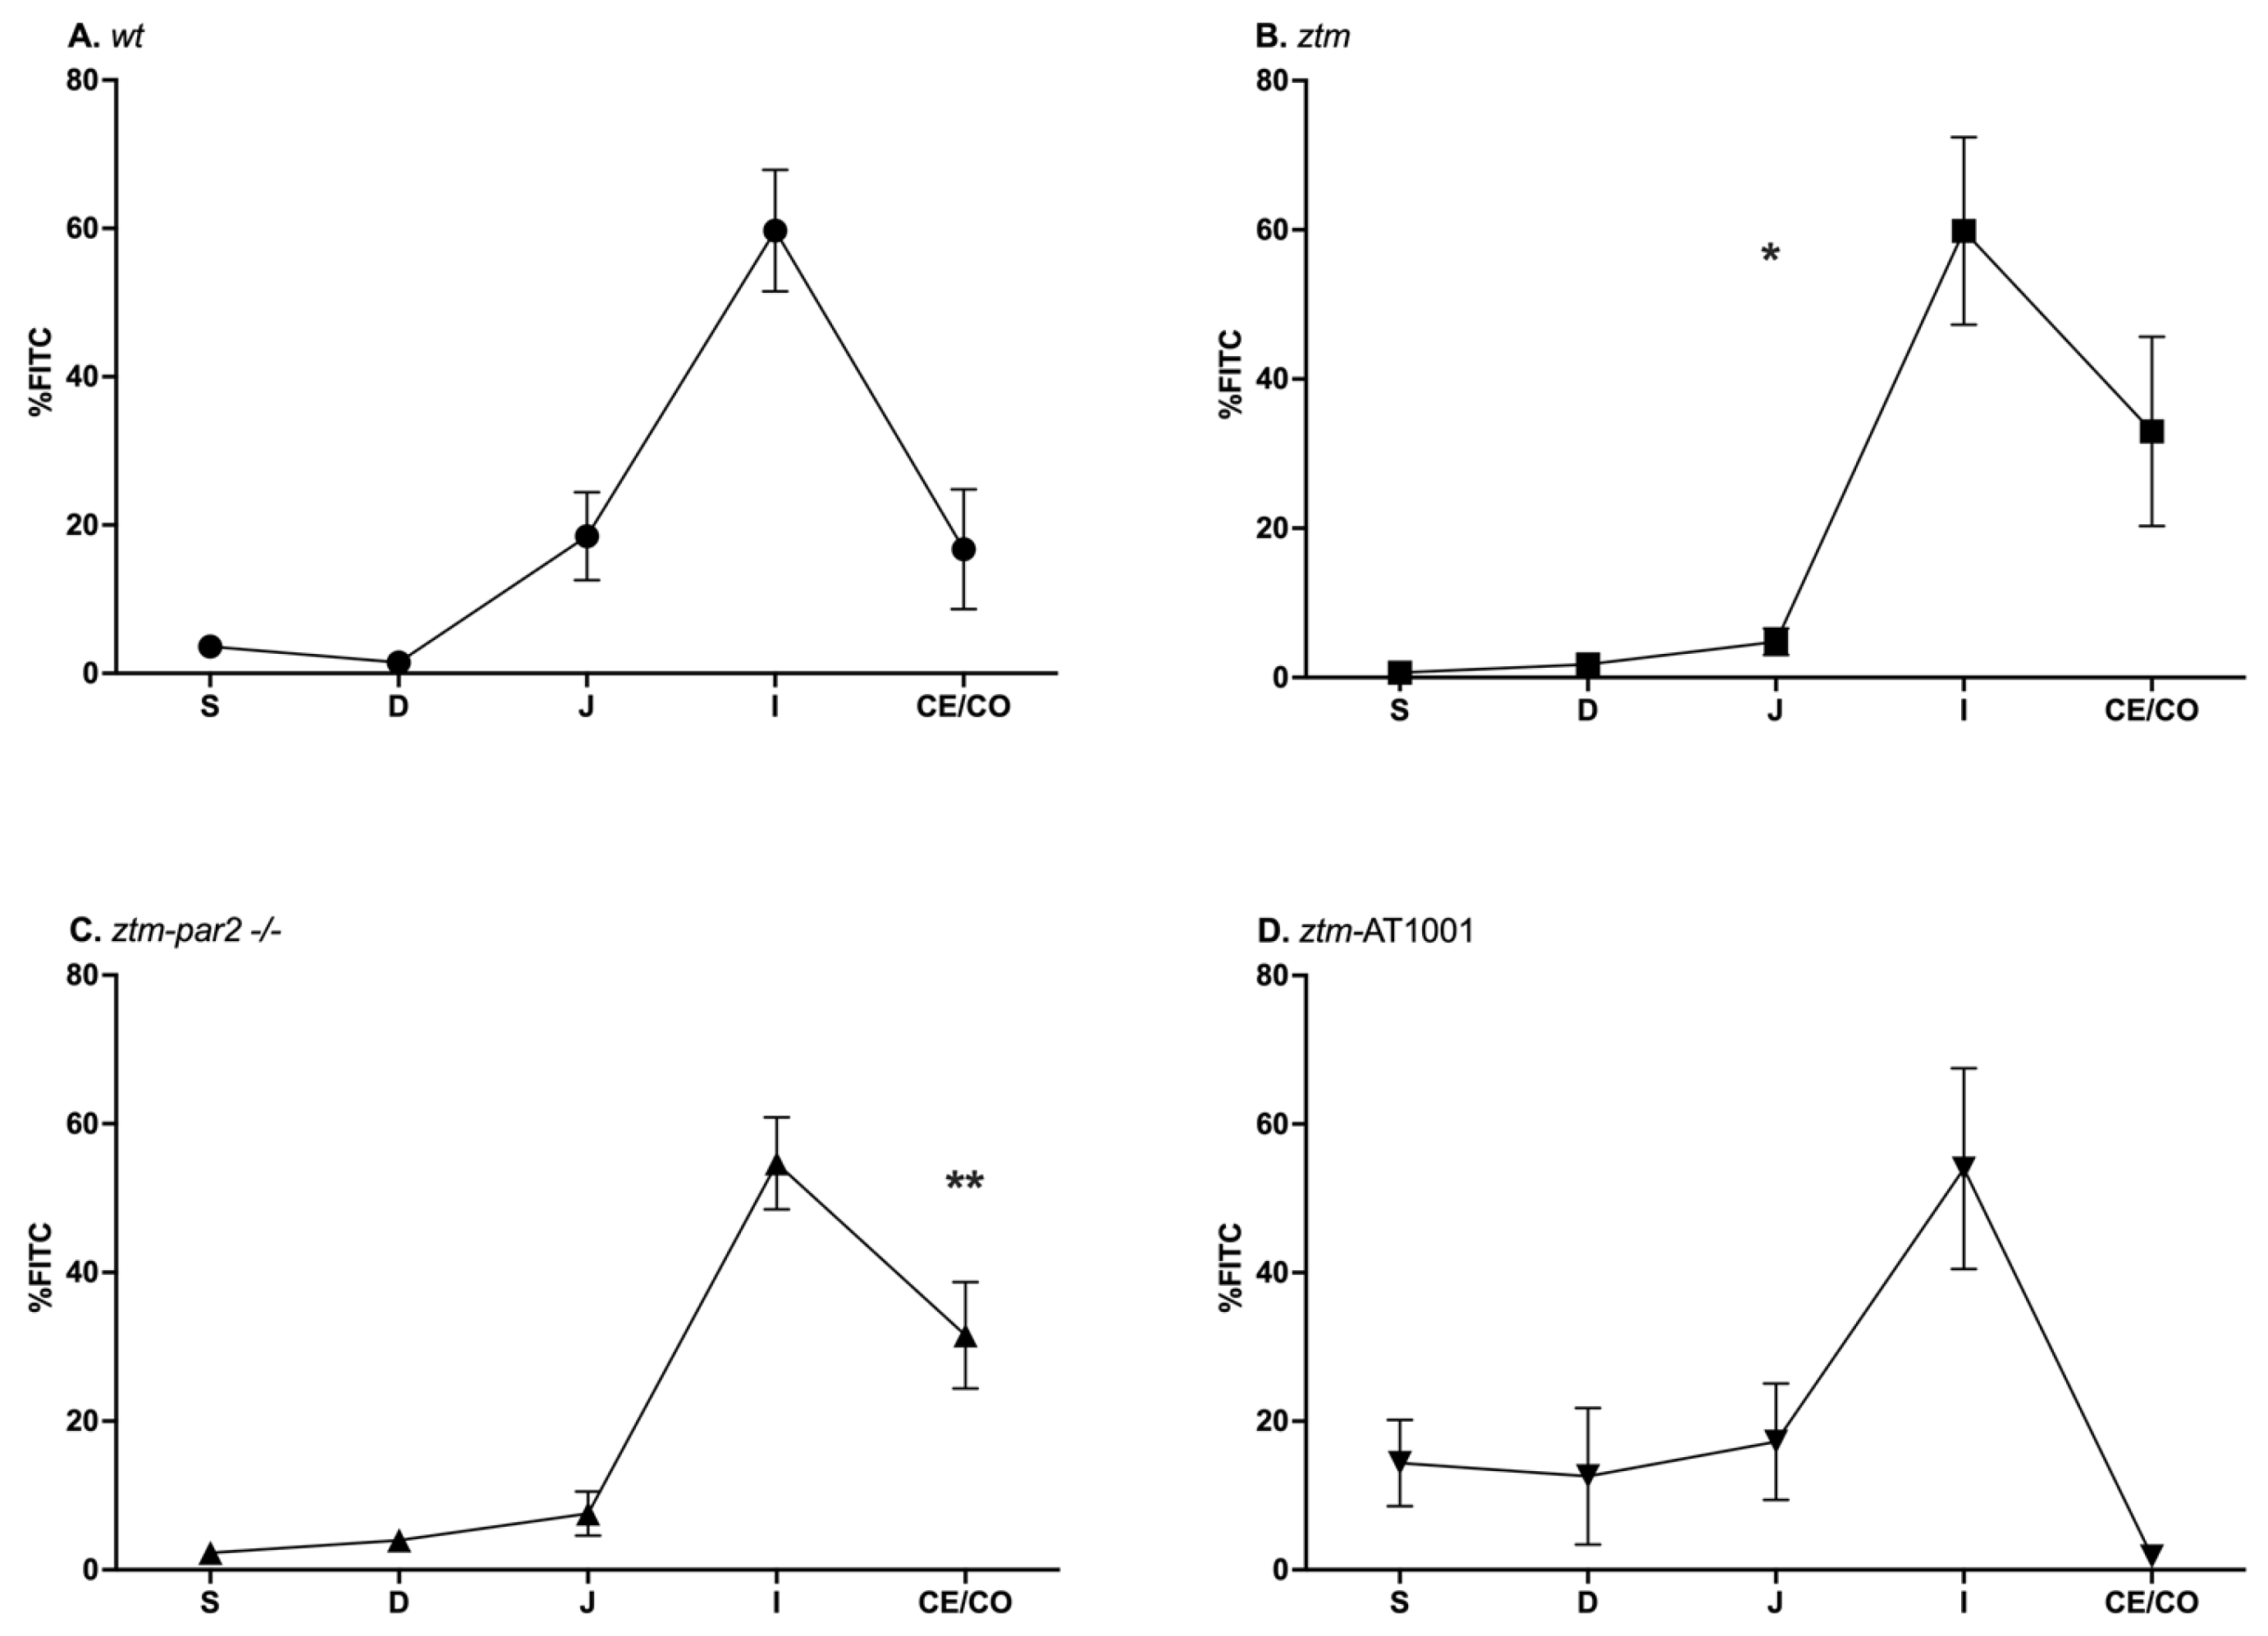
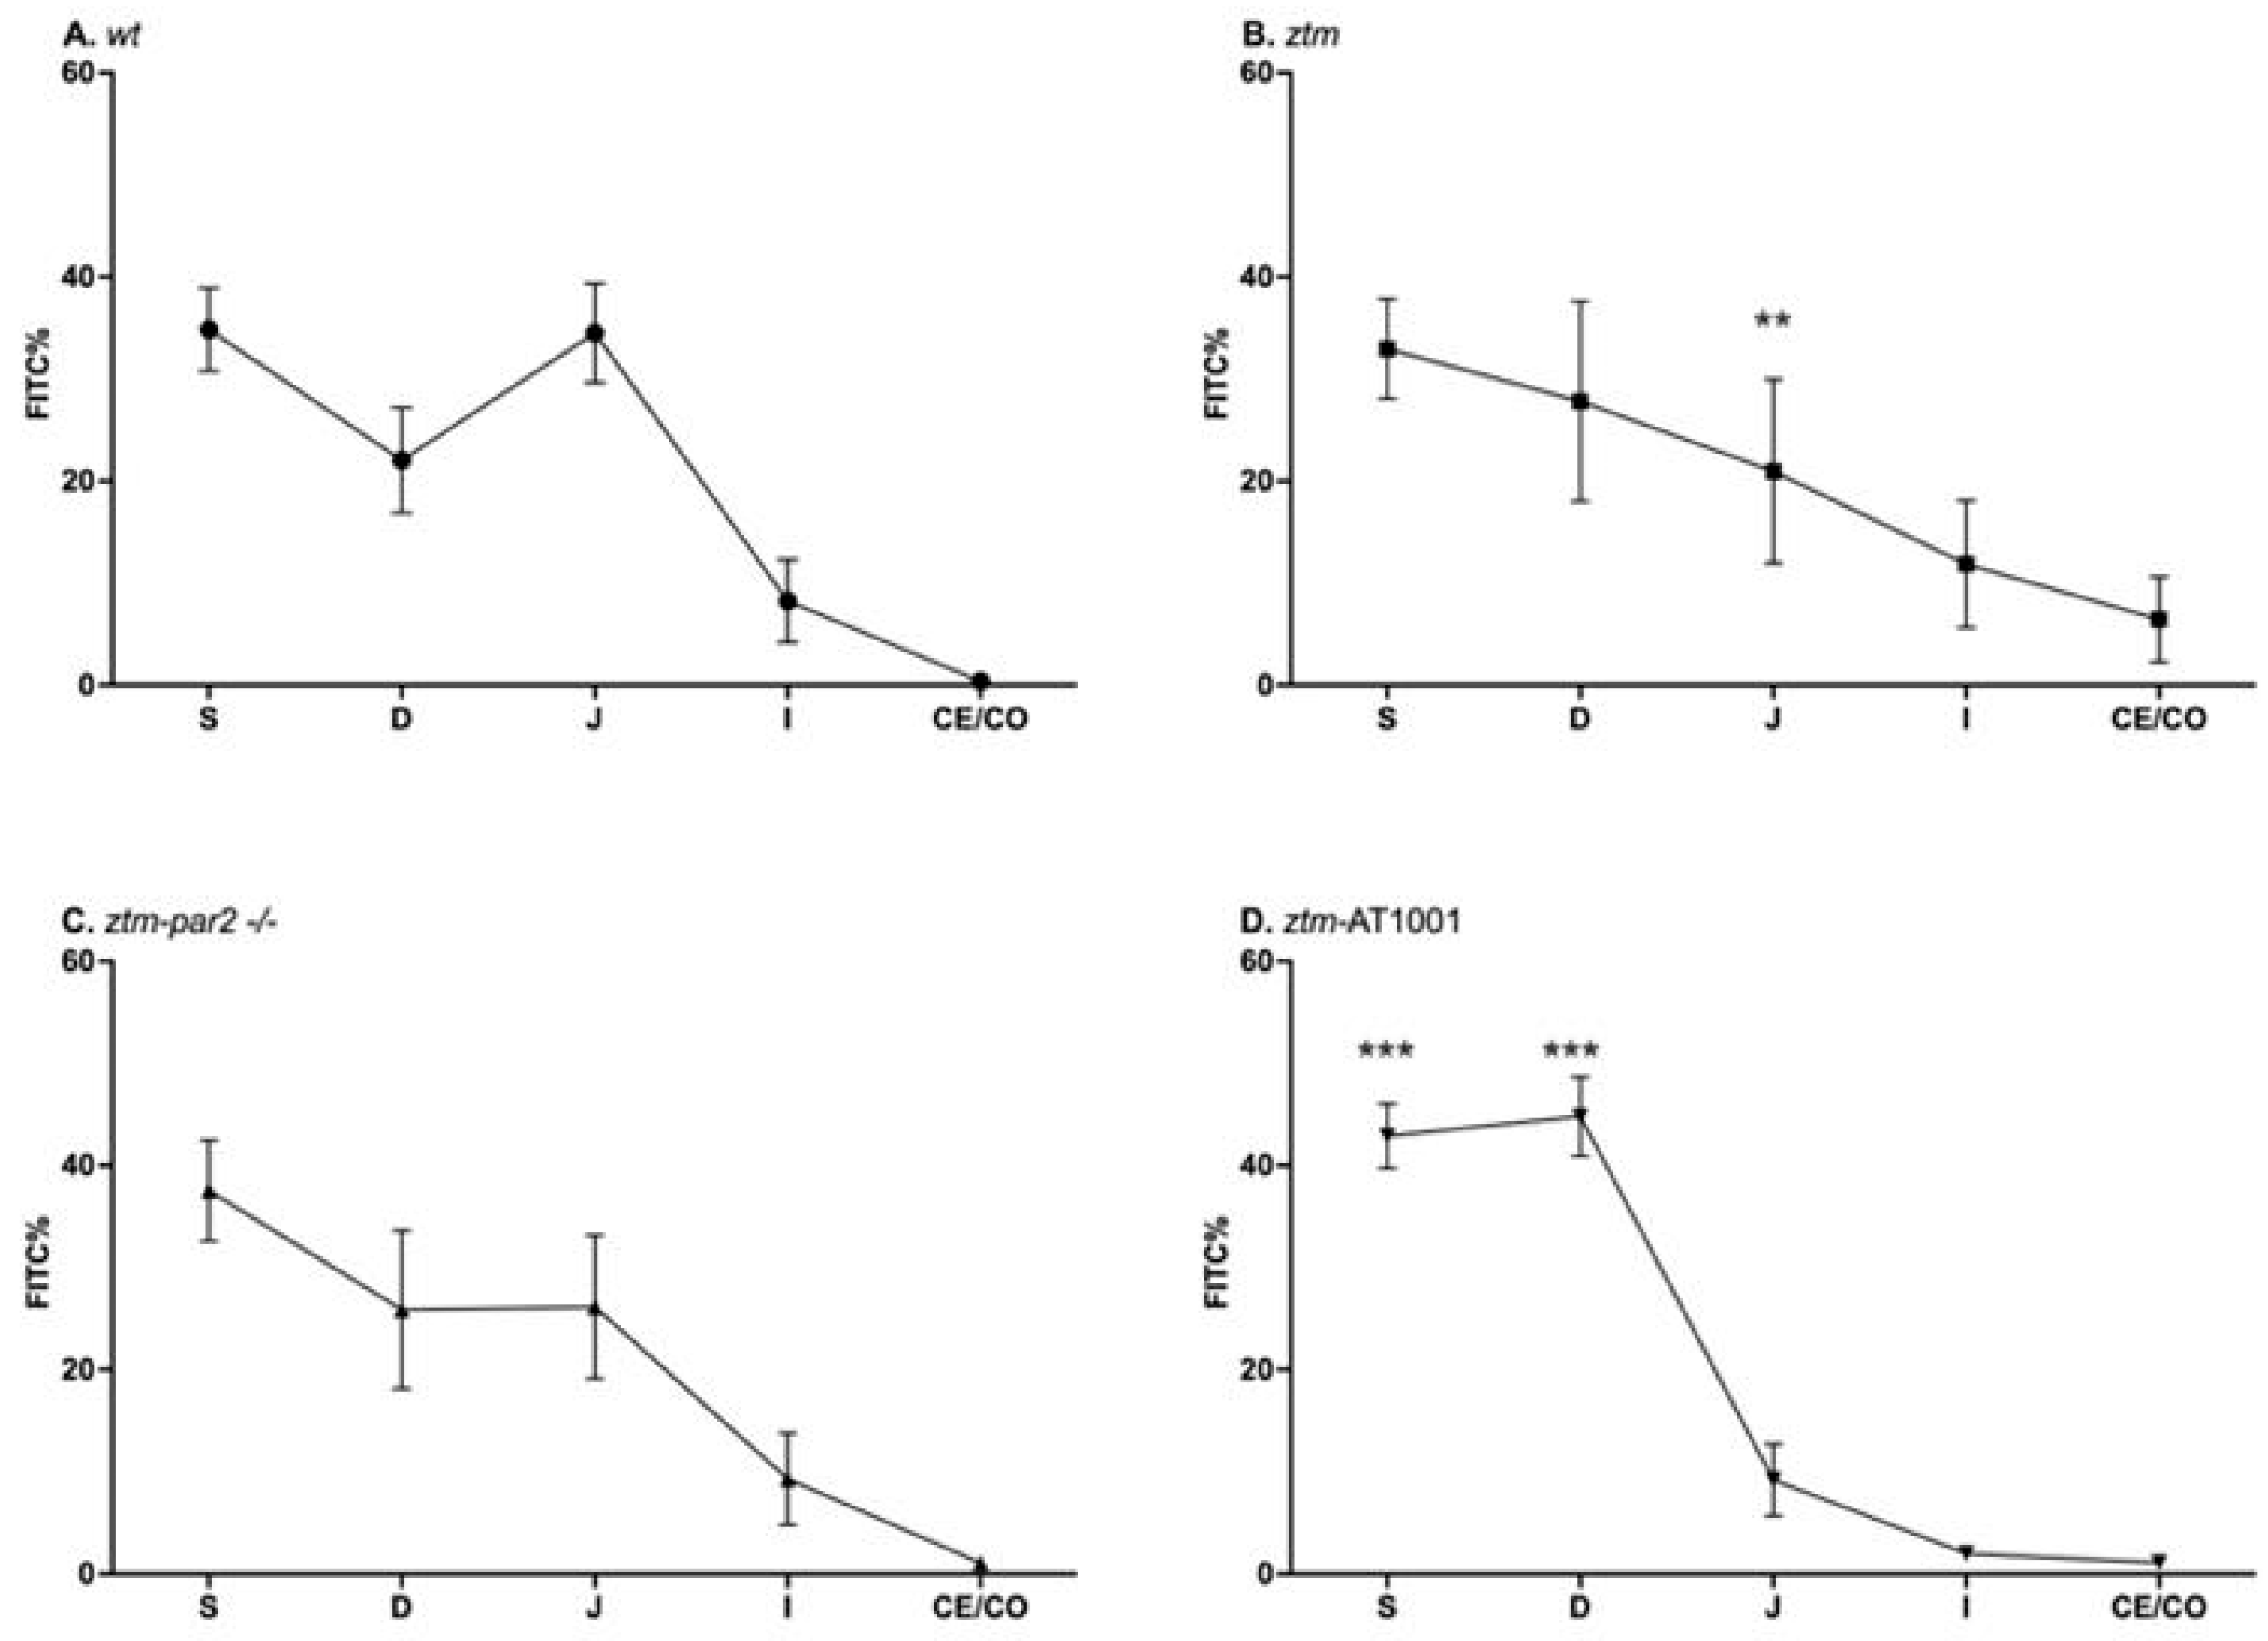
2.1. GI Motility
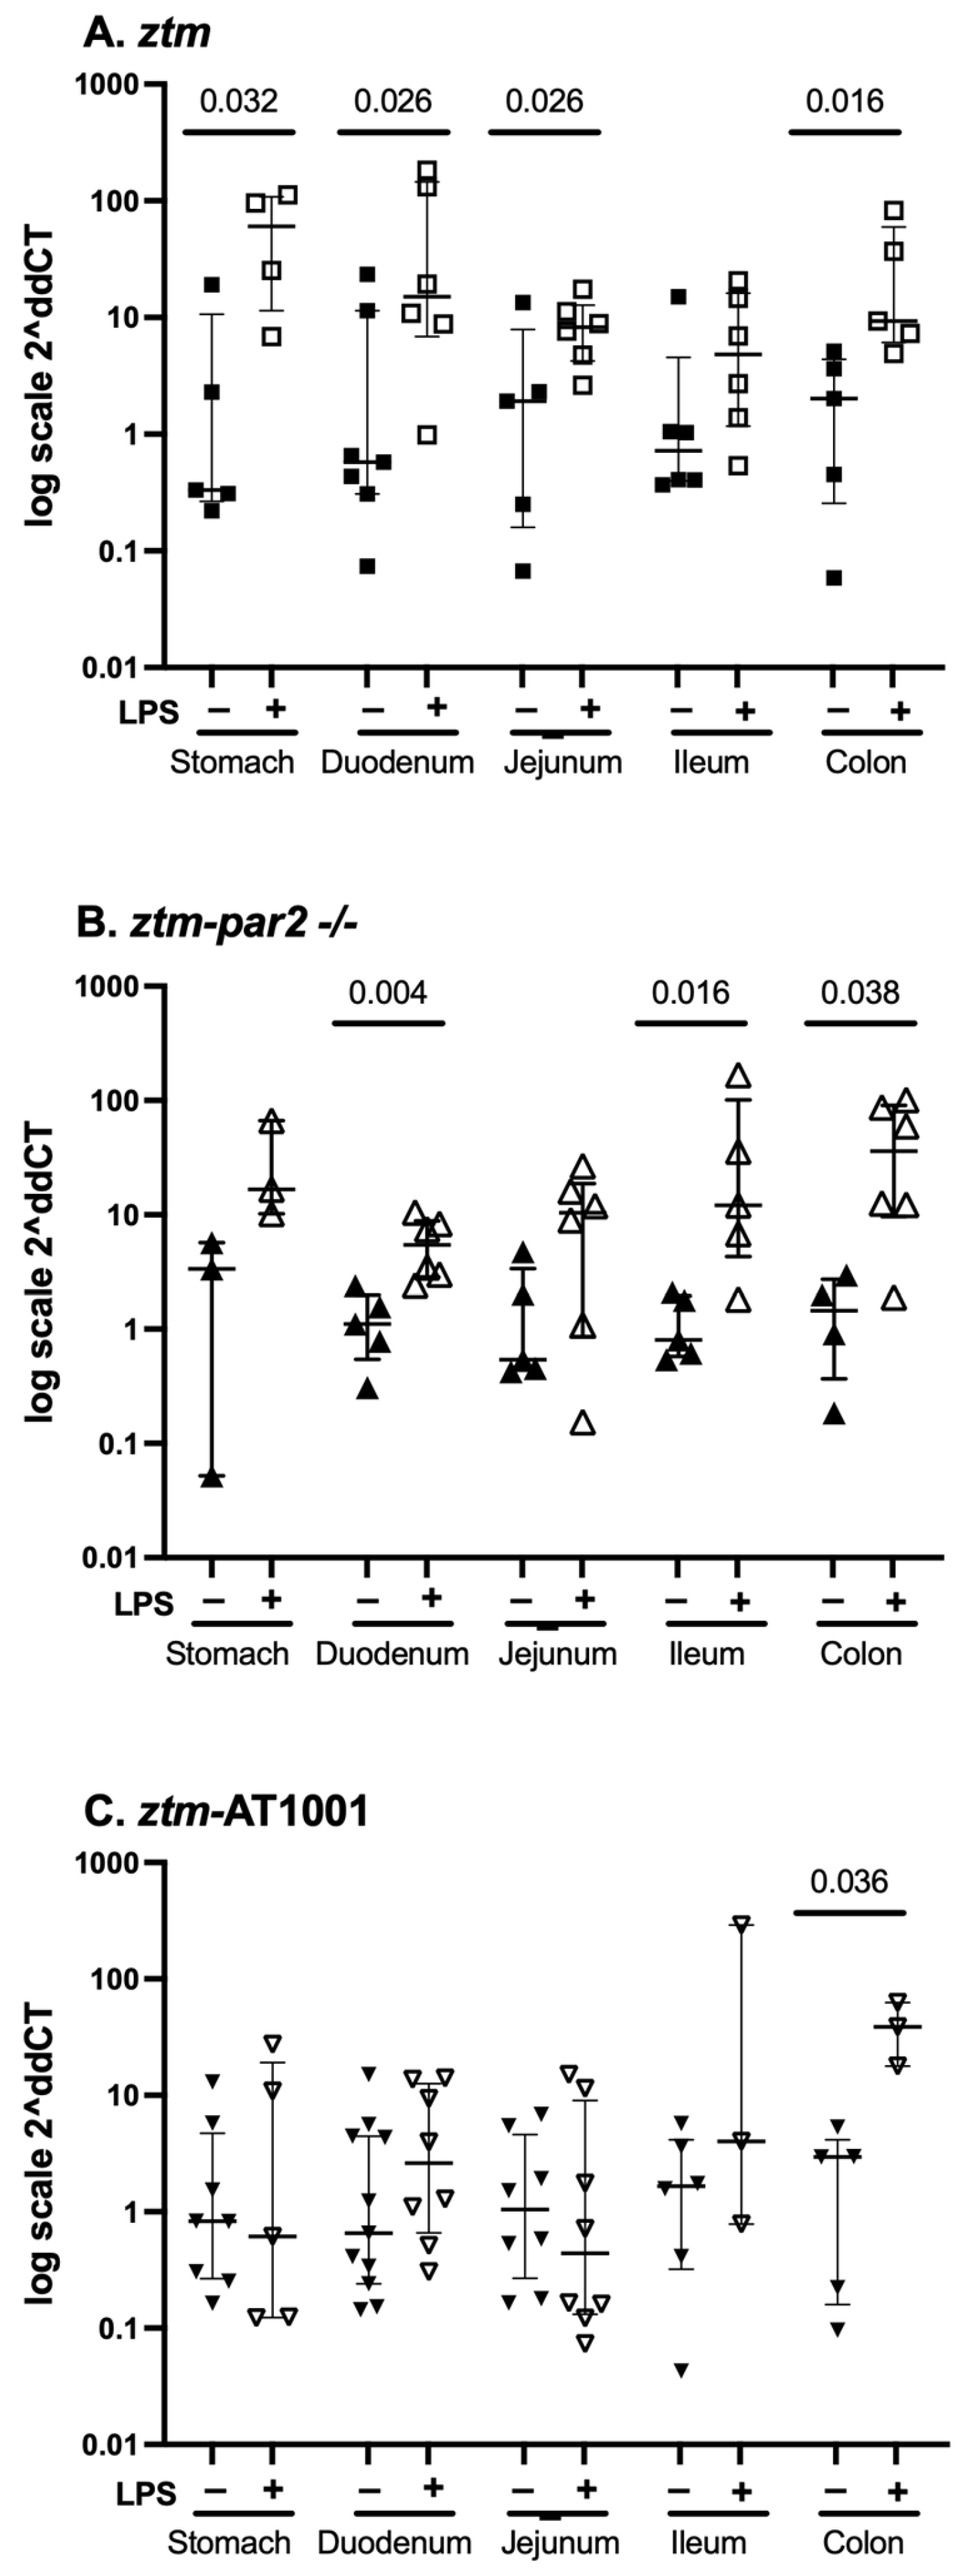
2.2. zonulin mRNA Expression—Whole Tissue
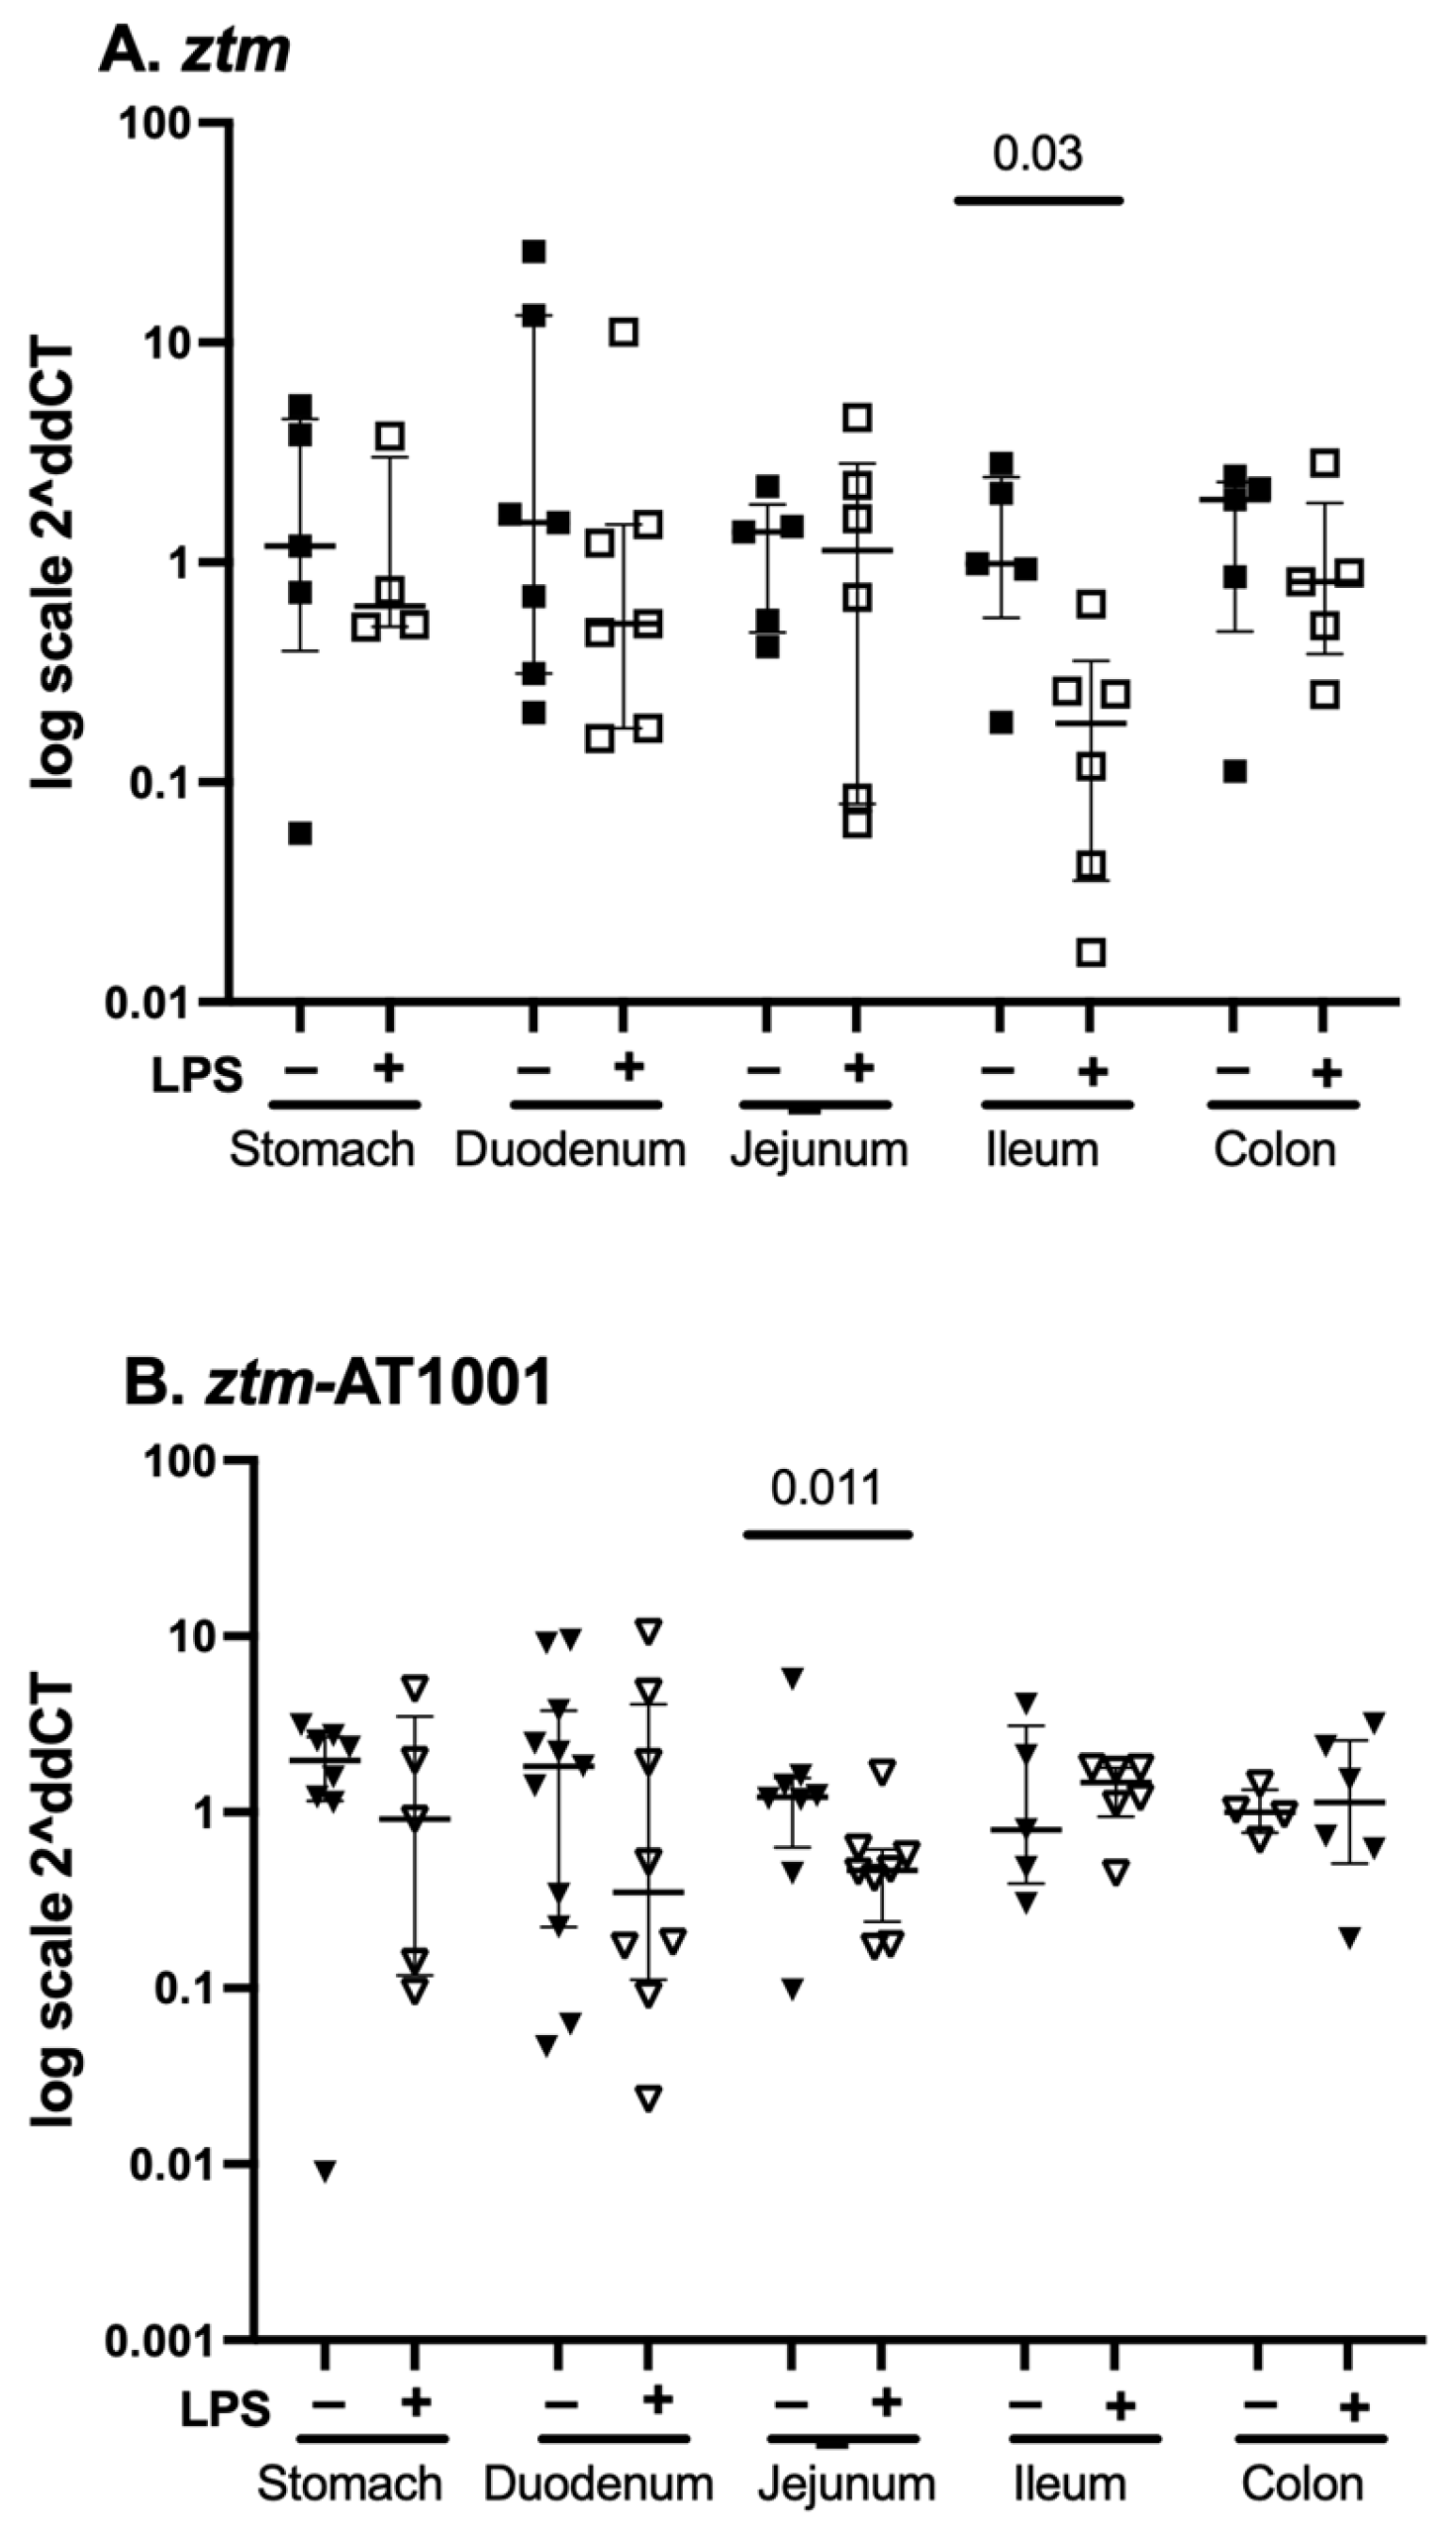
2.3. par2 mRNA Expression—Whole Tissue
2.4. zonulin mRNA Expression in Epithelial Versus Non-Epithelial Compartments
2.4.1. Baseline Conditions
2.4.2. Inflammatory Conditions
2.5. par2 mRNA Expression in Epithelial Versus Non-Epithelial Compartment
2.5.1. Baseline Conditions
2.5.2. Inflammatory Conditions
3. Discussion
4. Materials and Methods
4.1. Animals
4.2. Experimental Conditions
4.2.1. Inflammation
4.2.2. Zonulin Inhibition by AT1001
4.3. Gastrointestinal Transit Testing
4.4. Real-Time Quantitative-Polymerase Chain Reaction (q-PCR)
4.5. Statistical Analysis
5. Conclusions
Supplementary Materials
Author Contributions
Funding
Institutional Review Board Statement
Informed Consent Statement
Data Availability Statement
Conflicts of Interest
Abbreviations
References
- Peterson, L.W.; Artis, D. Intestinal epithelial cells: Regulators of barrier function and immune homeostasis. Nat. Rev. Immunol. 2014, 14, 141–153. [Google Scholar] [CrossRef] [PubMed]
- Bubeck, M.; Becker, C.; Patankar, J.V. Guardians of the gut: Influence of the enteric nervous system on the intestinal epithelial barrier. Front. Med. 2023, 10, 1228938. [Google Scholar] [CrossRef] [PubMed]
- Colgan, S.P.; Curtis, V.F.; Lanis, J.M.; Glover, L.E. Metabolic regulation of intestinal epithelial barrier during inflammation. Tissue Barriers 2015, 3, e970936. [Google Scholar] [CrossRef] [PubMed]
- Philpott, J.D.; Hovnanian, K.M.R.; Stefater-Richards, M.; Mehta, N.M.; Martinez, E.E. The enteroendocrine axis and its effect on gastrointestinal function, nutrition, and inflammation. Curr. Opin. Crit. Care 2024, 30, 290–297. [Google Scholar] [CrossRef]
- Martinez, E.E.; Mehta, N.M.; Fasano, A. The Zonulin Pathway as a Potential Mediator of Gastrointestinal Dysfunction in Critical Illness. Pediatr. Crit. Care Med. 2022, 23, e424–e428. [Google Scholar] [CrossRef]
- Buckley, A.; Turner, J.R. Cell Biology of Tight Junction Barrier Regulation and Mucosal Disease. Cold Spring Harb. Perspect. Biol. 2018, 10, a029314. [Google Scholar] [CrossRef]
- Michielan, A.; D’Inca, R. Intestinal Permeability in Inflammatory Bowel Disease: Pathogenesis, Clinical Evaluation, and Therapy of Leaky Gut. Mediat. Inflamm. 2015, 2015, 628157. [Google Scholar] [CrossRef]
- Antoni, L.; Nuding, S.; Wehkamp, J.; Stange, E.F. Intestinal barrier in inflammatory bowel disease. World J. Gastroenterol. 2014, 20, 1165–1179. [Google Scholar] [CrossRef]
- Sugita, K.; Kabashima, K. Tight junctions in the development of asthma, chronic rhinosinusitis, atopic dermatitis, eosinophilic esophagitis, and inflammatory bowel diseases. J. Leukoc. Biol. 2020, 107, 749–762. [Google Scholar] [CrossRef]
- Pellegrini, C.; Fornai, M.; D’Antongiovanni, V.; Antonioli, L.; Bernardini, N.; Derkinderen, P. The intestinal barrier in disorders of the central nervous system. Lancet Gastroenterol. Hepatol. 2023, 8, 66–80. [Google Scholar] [CrossRef]
- Baudry, B.; Fasano, A.; Ketley, J.; Kaper, J.B. Cloning of a gene (zot) encoding a new toxin produced by Vibrio cholerae. Infect. Immun. 1992, 60, 428–434. [Google Scholar] [CrossRef] [PubMed]
- Tripathi, A.; Lammers, K.M.; Goldblum, S.; Shea-Donohue, T.; Netzel-Arnett, S.; Buzza, M.S.; Antalis, T.M.; Vogel, S.N.; Zhao, A.; Yang, S.; et al. Identification of human zonulin, a physiological modulator of tight junctions, as prehaptoglobin-2. Proc. Natl. Acad. Sci. USA 2009, 106, 16799–16804. [Google Scholar] [CrossRef] [PubMed]
- Goldblum, S.E.; Rai, U.; Tripathi, A.; Thakar, M.; De Leo, L.; Di Toro, N.; Not, T.; Ramachandran, R.; Puche, A.C.; Hollenberg, M.D.; et al. The active Zot domain (aa 288–293) increases ZO-1 and myosin 1C serine/threonine phosphorylation, alters interaction between ZO-1 and its binding partners, and induces tight junction disassembly through proteinase activated receptor 2 activation. FASEB J. 2011, 25, 144–158. [Google Scholar] [CrossRef]
- Sapone, A.; de Magistris, L.; Pietzak, M.; Clemente, M.G.; Tripathi, A.; Cucca, F.; Lampis, R.; Kryszak, D.; Carteni, M.; Generoso, M.; et al. Zonulin upregulation is associated with increased gut permeability in subjects with type 1 diabetes and their relatives. Diabetes 2006, 55, 1443–1449. [Google Scholar] [CrossRef]
- Yonker, L.M.; Gilboa, T.; Ogata, A.F.; Senussi, Y.; Lazarovits, R.; Boribong, B.P.; Bartsch, Y.C.; Loiselle, M.; Rivas, M.N.; Porritt, R.A.; et al. Multisystem inflammatory syndrome in children is driven by zonulin-dependent loss of gut mucosal barrier. J. Clin. Investig. 2021, 131, e149633. [Google Scholar] [CrossRef]
- Sturgeon, C.; Lan, J.; Fasano, A. Zonulin transgenic mice show altered gut permeability and increased morbidity/mortality in the DSS colitis model. Ann. N. Y. Acad. Sci. 2017, 1397, 130–142. [Google Scholar] [CrossRef]
- Drago, S.; El Asmar, R.; Di Pierro, M.; Grazia Clemente, M.; Tripathi, A.; Sapone, A.; Thakar, M.; Iacono, G.; Carroccio, A.; D’Agate, C.; et al. Gliadin, zonulin and gut permeability: Effects on celiac and non-celiac intestinal mucosa and intestinal cell lines. Scand. J. Gastroenterol. 2006, 41, 408–419. [Google Scholar] [CrossRef]
- Klaus, D.A.; Motal, M.C.; Burger-Klepp, U.; Marschalek, C.; Schmidt, E.M.; Lebherz-Eichinger, D.; Krenn, C.G.; Roth, G.A. Increased plasma zonulin in patients with sepsis. Biochem. Medica 2013, 23, 107–111. [Google Scholar] [CrossRef]
- Martinez, E.E.; Lan, J.; Konno, T.; Miranda-Ribera, A.; Fiorentino, M.; Mehta, N.M.; Fasano, A. Novel role of zonulin in the pathophysiology of gastro-duodenal transit: A clinical and translational study. Sci. Rep. 2021, 11, 22462. [Google Scholar] [CrossRef]
- Heuberger, D.M.; Schuepbach, R.A. Protease-activated receptors (PARs): Mechanisms of action and potential therapeutic modulators in PAR-driven inflammatory diseases. Thromb. J. 2019, 17, 4. [Google Scholar] [CrossRef]
- Peach, C.J.; Edgington-Mitchell, L.E.; Bunnett, N.W.; Schmidt, B.L. Protease-activated receptors in health and disease. Physiol. Rev. 2023, 103, 717–785. [Google Scholar] [CrossRef] [PubMed]
- Vergnolle, N. Review article: Proteinase-activated receptors—Novel signals for gastrointestinal pathophysiology. Aliment. Pharmacol. Ther. 2000, 14, 257–266. [Google Scholar] [CrossRef] [PubMed]
- Kawabata, A.; Kuroda, R.; Nagata, N.; Kawao, N.; Masuko, T.; Nishikawa, H.; Kawai, K. In vivo evidence that protease-activated receptors 1 and 2 modulate gastrointestinal transit in the mouse. Br. J. Pharmacol. 2001, 133, 1213–1218. [Google Scholar] [CrossRef] [PubMed]
- Kawabata, A.; Matsunami, M.; Sekiguchi, F. Gastrointestinal roles for proteinase-activated receptors in health and disease. Br. J. Pharmacol. 2008, 153 (Suppl. S1), S230–S240. [Google Scholar] [CrossRef]
- Sekiguchi, F.; Hasegawa, N.; Inoshita, K.; Yonezawa, D.; Inoi, N.; Kanke, T.; Saito, N.; Kawabata, A. Mechanisms for modulation of mouse gastrointestinal motility by proteinase-activated receptor (PAR)-1 and -2 in vitro. Life Sci. 2006, 78, 950–957. [Google Scholar] [CrossRef]
- Di Pierro, M.; Lu, R.; Uzzau, S.; Wang, W.; Margaretten, K.; Pazzani, C.; Maimone, F.; Fasano, A. Zonula occludens toxin structure-function analysis. Identification of the fragment biologically active on tight junctions and of the zonulin receptor binding domain. J. Biol. Chem. 2001, 276, 19160–19165. [Google Scholar] [CrossRef]
- Watts, T.; Berti, I.; Sapone, A.; Gerarduzzi, T.; Not, T.; Zielke, R.; Fasano, A. Role of the intestinal tight junction modulator zonulin in the pathogenesis of type I diabetes in BB diabetic-prone rats. Proc. Natl. Acad. Sci. USA 2005, 102, 2916–2921. [Google Scholar] [CrossRef]
- Miranda-Ribera, A.; Ennamorati, M.; Serena, G.; Cetinbas, M.; Lan, J.; Sadreyev, R.I.; Jain, N.; Fasano, A.; Fiorentino, M. Exploiting the Zonulin Mouse Model to Establish the Role of Primary Impaired Gut Barrier Function on Microbiota Composition and Immune Profiles. Front. Immunol. 2019, 10, 2233. [Google Scholar] [CrossRef]
- Cattaruzza, F.; Cenac, N.; Barocelli, E.; Impicciatore, M.; Hyun, E.; Vergnolle, N.; Sternini, C. Protective effect of proteinase-activated receptor 2 activation on motility impairment and tissue damage induced by intestinal ischemia/reperfusion in rodents. Am. J. Pathol. 2006, 169, 177–188. [Google Scholar] [CrossRef]
- Muller, P.A.; Koscso, B.; Rajani, G.M.; Stevanovic, K.; Berres, M.L.; Hashimoto, D.; Mortha, A.; Leboeuf, M.; Li, X.M.; Mucida, D.; et al. Crosstalk between muscularis macrophages and enteric neurons regulates gastrointestinal motility. Cell 2014, 158, 300–313. [Google Scholar] [CrossRef]
- Selleri, S.; Palazzo, M.; Deola, S.; Wang, E.; Balsari, A.; Marincola, F.M.; Rumio, C. Induction of pro-inflammatory programs in enteroendocrine cells by the Toll-like receptor agonists flagellin and bacterial LPS. Int. Immunol. 2008, 20, 961–970. [Google Scholar] [CrossRef] [PubMed]
- Levy, A.P.; Levy, J.E.; Kalet-Litman, S.; Miller-Lotan, R.; Levy, N.S.; Asaf, R.; Guetta, J.; Yang, C.; Purushothaman, K.R.; Fuster, V.; et al. Haptoglobin genotype is a determinant of iron, lipid peroxidation, and macrophage accumulation in the atherosclerotic plaque. Arterioscler. Thromb. Vasc. Biol. 2007, 27, 134–140. [Google Scholar] [CrossRef] [PubMed]
- Pawlinski, R.; Pedersen, B.; Schabbauer, G.; Tencati, M.; Holscher, T.; Boisvert, W.; Andrade-Gordon, P.; Frank, R.D.; Mackman, N. Role of tissue factor and protease-activated receptors in a mouse model of endotoxemia. Blood 2004, 103, 1342–1347. [Google Scholar] [CrossRef] [PubMed]
- Shrum, B.; Anantha, R.V.; Xu, S.X.; Donnelly, M.; Haeryfar, S.M.; McCormick, J.K.; Mele, T. A robust scoring system to evaluate sepsis severity in an animal model. BMC Res. Notes 2014, 7, 233. [Google Scholar] [CrossRef]

| Condition | Control | p-Value, Kruskal–Wallis Test Between Mouse Groups Within GI Segment * | Condition | LPS | p-Value, Kruskal–Wallis Test Between Mouse Groups Within GI Segment * | ||||
|---|---|---|---|---|---|---|---|---|---|
| Mouse Group | ztm | ztm- par2 −/− | ztm-AT1001 | Mouse Group | ztm | ztm- par2 −/− | ztm-AT1001 | ||
| GI Segment | Stomach | Stomach | |||||||
| Median Ct | 17.70 | 15.46 | 13.23 | NS | Median Ct | 9.90 | 13.14 | 13.66 | NS |
| IQR | 12.80, 17.46 | 14.68, 21.47 | 10.90, 14.87 | IQR | 8.77, 12.28 | 11.14, 13.85 | 8.85, 15.98 | ||
| GI Segment | Duodenum | Duodenum | |||||||
| Median Ct | 20.26 | 19.88 | 18.10 | NS | Median Ct | 15.61 | 17.68 | 14.89 | NS |
| IQR | 15.95, 21.17 | 19.08, 21.06 | 15.33, 19.54 | IQR | 12.07, 16.26 | 16.89, 18.52 | 13.71, 17.19 | ||
| GI Segment | Jejunum | Jejunum | |||||||
| Median Ct | 18.36 | 18.52 | 14.23 | Z vs. ZA, p = 0.021 | Median Ct | 14.62 | 14.26 | 15.68 | NS |
| IQR | 15.99, 21.52 | 16, 20.98 | 12.07, 16.23 | IQR | 12.96, 15.79 | 13.44, 18.21 | 11.30, 17.08 | ||
| GI Segment | Ileum | Ileum | |||||||
| Median Ct | 14.77 | 17.59 | 16.01 | Z vs. ZP, p = 0.013 | Median Ct | 12.04 | 13.68 | 14.73 | NS |
| IQR | 13.12, 15.49 | 16.33, 18.08 | 14.71, 18.83 | IQR | 10.16, 14.02 | 11.01, 15.46 | 8.55, 17.08 | ||
| GI Segment | Colon | Colon | |||||||
| Median Ct | 16.23 | 17.23 | 15.54 | NS | Median Ct | 14.01 | 12.88 | 11.82 | NS |
| IQR | 15.13, 19.86 | 16.23, 18.08 | 15.10, 19.87 | IQR | 11.45, 14.65 | 11.15, 14.72 | 11.12, 12.94 | ||
| p-value, Kruskal–Wallis test between GI segments within mouse group * | Duodenum vs. Ileum, p = 0.042 | NS | Stomach vs. Duodenum, p = 0.0081 | p-value, Kruskal–Wallis test between GI segments within mouse group * | NS | Duodenum vs. Colon, p = 0.041 | NS | ||
| Condition | Control | p-Value, Mann–Whitney U Test Between Mouse Groups Within GI Segment * | Condition | LPS | p-Value, Mann–Whitney U Test Between Mouse Groups Within GI Segment * | ||
|---|---|---|---|---|---|---|---|
| Mouse Group | ztm | ztm-AT1001 | Mouse Group | ztm | ztm-AT1001 | ||
| GI Segment | Stomach | GI Segment | Stomach | ||||
| Median Ct | 12.50 | 11.26 | NS | Median Ct | 13.43 | 12.34 | NS |
| IQR | 10.60, 15.02 | 10.79, 12.00 | IQR | 11.42, 13.72 | 10.56, 15.32 | ||
| GI Segment | Duodenum | GI Segment | Duodenum | ||||
| Median Ct | 11.58 | 13.43 | NS | Median Ct | 13.11 | 16.00 | NS |
| IQR | 8.45, 13.86 | 12.38, 16.46 | IQR | 11.61, 14.68 | 12.36, 17.52 | ||
| GI Segment | Jejunum | GI Segment | Jejunum | ||||
| Median Ct | 12.47 | 10.10 | p = 0.011 | Median Ct | 12.87 | 11.49 | NS |
| IQR | 12.09, 14.01 | 9.74, 11.19 | IQR | 11.52, 16.59 | 11.09, 12.57 | ||
| GI Segment | Ileum | GI Segment | Ileum | ||||
| Median Ct | 10.28 | 17.59 | p = 0.008 | Median Ct | 12.80 | 16.71 | p = 0.0022 |
| IQR | 8.99, 11.52 | 15.69, 18.63 | IQR | 11.88, 15.17 | 16.41, 17.42 | ||
| GI Segment | Colon | GI Segment | Colon | ||||
| Median Ct | 8.92 | 16.16 | p = 0.016 | Median Ct | 10.16 | 16.07 | p = 0.004 |
| IQR | 8.66, 11.56 | 15.74, 16.56 | IQR | 9.20, 11.35 | 14.81, 17.27 | ||
| p-value, Kruskal–Wallis test between GI segments within mouse group * | NS | Duodenum vs. Jejunum, p = 0.023 Jejunum vs. Ileum, p = 0.0015 Jejunum vs. Colon, p = 0.018 | p-value, Kruskal–Wallis test between GI segments within mouse group * | NS | Jejunum vs. Ileum, p = 0.0046 Jejunum vs. Colon, p = 0.046 | ||
| Condition | Epithelial Compartment | p-Value, Kruskal–Wallis Test Between Mouse Groups Within GI Segment * | Condition | Non-Epithelial Compartment | p-Value, Kruskal–Wallis Test Between Mouse Groups Within GI Segment * | ||||
|---|---|---|---|---|---|---|---|---|---|
| Mouse Group | ztm | ztm- par2 −/− | ztm-AT1001 | Mouse Group | ztm | ztm- par2 −/− | ztm-AT1001 | ||
| GI Segment | Stomach | GI Segment | Stomach | ||||||
| Median Ct | 18.01 | 15.90 | 21.66 | ZP vs. ZA, p = 0.028 | Median Ct | 16.15 | 15.03 | 18.17 | NS |
| IQR | 16.52, 18.60 | 15.17,18.08 | 20.26, 22.25 | IQR | 13.81, 19.22 | 10.88, 16.41 | 16.63, 19.33 | ||
| n | 5 | 3 | 4 | n | 7 | 4 | 4 | ||
| GI Segment | Duodenum | GI Segment | Duodenum | ||||||
| Median Ct | 19.97 | 22.05 | 21.42 | NS | Median Ct | 17.73 | 19.11 | 19.29 | NS |
| IQR | 18.46, 22.69 | 21.43, 22.68 | 21.11, 22.37 | IQR | 15.50, 20.54 | 18.47,19.74 | 17.64, 20.97 | ||
| n | 4 | 2 | 4 | n | 6 | 2 | 3 | ||
| GI Segment | Jejunum | GI Segment | Jejunum | ||||||
| Median Ct | 21.70 | 24.29 | 23.11 | NS | Median Ct | 18.03 | 17.26 | 17.89 | NS |
| IQR | 20.91, 21.88 | 20.94, 24.55 | 23.02, 23.92 | IQR | 14.98, 18.99 | 15.95, 20.31 | 15.36, 21.55 | ||
| n | 7 | 5 | 3 | n | 7 | 3 | 4 | ||
| GI Segment | Ileum | GI Segment | Ileum | ||||||
| Median Ct | 20.13 | 20.06 | 23.00 | NS | Median Ct | 18.25 | 16.15 | 20.99 | NS |
| IQR | 18.19, 21.06 | 17.84, 22.28 | 21.47, 24.43 | IQR | 15.17, 19.90 | 15.44, 19.83 | 17.60, 22.52 | ||
| n | 9 | 2 | 4 | n | 6 | 4 | 4 | ||
| GI Segment | Colon | GI Segment | Colon | ||||||
| Median Ct | 19.97 | 18.23 | 22.29 | NS | Median Ct | 15.36 | 16.81 | 19.60 | NS |
| IQR | 19.65, 20.30 | 17.15, 19.72 | 21.22, 23.36 | IQR | 13.77, 15.94 | 15.62, 18.70 | 14.94, 20.40 | ||
| n | 2 | 4 | 2 | n | 3 | 4 | 4 | ||
| p-value, Kruskal–Wallis test between GI segments within mouse group * | Stomach vs. Jejunum, p = 0.005 | Stomach vs. Jejunum, p = 0.048 | NS | p-value, Kruskal–Wallis test between GI segments within mouse group * | NS | NS | NS | ||
| Condition | Epithelial Compartment | p-Value, Kruskal–Wallis Test Between Mouse Groups Within GI Segment * | Condition | Non-Epithelial Compartment | p-Value, Kruskal–Wallis Test Between Mouse Groups Within GI Segment * | ||||
|---|---|---|---|---|---|---|---|---|---|
| Mouse Group | ztm | ztm- par2 −/− | ztm-AT1001 | Mouse Group | ztm | ztm- par2 −/− | ztm-AT1001 | ||
| GI Segment | Stomach | GI Segment | Stomach | ||||||
| Median Ct | 14.29 | 13.68 | 18.08 | NS | Median Ct | 14.08 | 11.54 | 13.09 | NS |
| IQR | 12.62, 17.56 | 13.51,17.19 | 15.03, 19.80 | IQR | 11.87, 16.07 | 10.71, 14.15 | 12.79, 14.65 | ||
| n | 5 | 3 | 5 | n | 6 | 5 | 5 | ||
| GI Segment | Duodenum | GI Segment | Duodenum | ||||||
| Median Ct | 19.88 | 20.93 | 20.23 | NS | Median Ct | 17.90 | 17.44 | 16.62 | NS |
| IQR | 18.97, 21.45 | 19.60, 23.82 | 19.88, 22.64 | IQR | 14.34, 20.27 | 16.36,19.48 | 16.18, 17.06 | ||
| n | 10 | 4 | 5 | n | 5 | 4 | 2 | ||
| GI Segment | Jejunum | GI Segment | Jejunum | ||||||
| Median Ct | 19.70 | 22.79 | 21.02 | NS | Median Ct | 15.00 | 14.69 | 15.69 | NS |
| IQR | 17.49, 21.30 | 22.79, 22.79 | 17.37, 22.43 | IQR | 11.15, 16.59 | 14.16, 16.67 | 14.15, 17.18 | ||
| n | 9 | 1 | 5 | n | 6 | 3 | 5 | ||
| GI Segment | Ileum | GI Segment | Ileum | ||||||
| Median Ct | 18.76 | 17.96 | 18.31 | NS | Median Ct | 15.91 | 13.04 | 16.44 | NS |
| IQR | 15.86, 20.79 | 17.96, 17.96 | 12.64, 20.71 | IQR | 13.74, 17.92 | 12.35, 16.55 | 14.06, 17.82 | ||
| n | 7 | 1 | 4 | n | 4 | 5 | 5 | ||
| GI Segment | Colon | GI Segment | Colon | ||||||
| Median Ct | 15.64 | 17.65 | 18.29 | NS | Median Ct | 15.73 | 13.60 | 14.09 | NS |
| IQR | 14.41, 18.25 | 17.65, 17.65 | 17.54, 19.97 | IQR | 12.57, 18.41 | 13.15, 14.23 | 13.50, 16.09 | ||
| n | 9 | 1 | 5 | n | 4 | 5 | 5 | ||
| p-value, Kruskal–Wallis test between GI segments within mouse group * | Stomach vs. Duodenum, p = 0.012 Duodenum vs. Colon, p = 0.016 | NS | NS | p-value, Kruskal–Wallis test between GI segments within mouse group * | NS | Stomach vs. Duodenum, p = 0.016 | NS | ||
| Condition | Epithelial Compartment | p-Value, Mann–Whitney U Test Between Mouse Groups Within GI Segment * | Condition | Non-Epithelial Compartment | p-Value, Mann–Whitney U Test Between Mouse Groups Within GI Segment * | ||
|---|---|---|---|---|---|---|---|
| Mouse Group | ztm | ztm-AT1001 | Mouse Group | ztm | ztm-AT1001 | ||
| GI Segment | Stomach | GI Segment | Stomach | ||||
| Median Ct | 12.66 | 13.86 | p = 0.016 | Median Ct | 13.99 | 13.79 | NS |
| IQR | 11.79, 13.16 | 13.52, 13.98 | IQR | 12.73, 17.23 | 12.91, 14.66 | ||
| n | 5 | 4 | n | 7 | 4 | ||
| GI Segment | Duodenum | GI Segment | Duodenum | ||||
| Median Ct | 14.20 | 16.86 | NS | Median Ct | 16.64 | 16.69 | NS |
| IQR | 12.79, 16.21 | 15.45, 18.78 | IQR | 15.05, 19.79 | 16.31, 17.78 | ||
| n | 6 | 4 | n | 6 | 3 | ||
| GI Segment | Jejunum | GI Segment | Jejunum | ||||
| Median Ct | 15.54 | 14.77 | NS | Median Ct | 12.62 | 13.97 | NS |
| IQR | 14.11, 16.35 | 12.82, 17.99 | IQR | 11.15, 12.80 | 12.82, 15.75 | ||
| n | 9 | 4 | n | 7 | 4 | ||
| GI Segment | Ileum | GI Segment | Ileum | ||||
| Median Ct | 11.84 | 12.30 | NS | Median Ct | 16.47 | 19.38 | NS |
| IQR | 11.25, 14.27 | 11.10, 12.66 | IQR | 13.45, 19.54 | 17.27, 20.48 | ||
| n | 10 | 4 | n | 6 | 4 | ||
| GI Segment | Colon | GI Segment | Colon | ||||
| Median Ct | 13.04 | 13.17 | NS | Median Ct | 11.07 | 11.08 | NS |
| IQR | 11.51, 15.16 | 11.51, 14.84 | IQR | 9.60, 15.23 | 10.98, 13.04 | ||
| n | 3 | 2 | n | 3 | 4 | ||
| p-value, Kruskal–Wallis test between GI segments within mouse group * | NS | Duodenum vs. Ileum, p = 0.012 | p-value, Kruskal–Wallis test between GI segments within mouse group * | Duodenum vs. Jejunum, p = 0.026 | NS | ||
| Table | Epithelial Compartment | p-Value, Mann–Whitney U Test Between Mouse Groups Within GI Segment * | Condition | Non-Epithelial Compartment | p-Value, Mann–Whitney U Test Between Mouse Groups Within GI Segment * | ||
|---|---|---|---|---|---|---|---|
| Mouse Group | ztm | ztm-AT1001 | Mouse Group | ztm | ztm-AT1001 | ||
| GI Segment | Stomach | GI Segment | Stomach | ||||
| Median Ct | 13.07 | 13.41 | NS | Median Ct | 14.89 | 14.12 | NS |
| IQR | 11.76, 13.45 | 12.95, 14.28 | IQR | 11.36, 19.02 | 13.88, 17.35 | ||
| n | 5 | 5 | n | 6 | 5 | ||
| GI Segment | Duodenum | GI Segment | Duodenum | ||||
| Median Ct | 12.98 | 15.38 | NS | Median Ct | 14.74 | 14.93 | NS |
| IQR | 12.30, 16.27 | 14.84, 17.80 | IQR | 12.28, 16.69 | 13.16, 16.70 | ||
| n | 10 | 5 | n | 3 | 2 | ||
| GI Segment | Jejunum | GI Segment | Jejunum | ||||
| Median Ct | 16.16 | 16.28 | NS | Median Ct | 13.00 | 13.43 | NS |
| IQR | 13.22, 17.19 | 13.27, 17.41 | IQR | 12.01, 13.88 | 12.41, 15.53 | ||
| n | 9 | 5 | n | 6 | 5 | ||
| GI Segment | Ileum | GI Segment | Ileum | ||||
| Median Ct | 11.15 | 12.60 | NS | Median Ct | 16.13 | 15.71 | NS |
| IQR | 10.38, 18.94 | 11.64, 13.95 | IQR | 12.91, 18.12 | 13.81, 18.07 | ||
| n | 6 | 4 | n | 5 | 5 | ||
| GI Segment | Colon | GI Segment | Colon | ||||
| Median Ct | 12.51 | 10.18 | NS | Median Ct | 13.50 | 11.75 | NS |
| IQR | 9.70, 14.24 | 8.50, 13.08 | IQR | 12.20, 16.63 | 11.11, 13.50 | ||
| n | 9 | 5 | n | 4 | 5 | ||
| p-value, Kruskal–Wallis test between GI segments within mouse group * | NS | Duodenum vs. Colon, p = 0.015 | p-value, Kruskal–Wallis test between GI segments within mouse group * | NS | NS | ||
Disclaimer/Publisher’s Note: The statements, opinions and data contained in all publications are solely those of the individual author(s) and contributor(s) and not of MDPI and/or the editor(s). MDPI and/or the editor(s) disclaim responsibility for any injury to people or property resulting from any ideas, methods, instructions or products referred to in the content. |
© 2025 by the authors. Licensee MDPI, Basel, Switzerland. This article is an open access article distributed under the terms and conditions of the Creative Commons Attribution (CC BY) license (https://creativecommons.org/licenses/by/4.0/).
Share and Cite
Martinez, E.E.; Philpott, J.D.; Lan, J.; Rodriguez Hovnanian, K.M.; Fasano, A. Characterizing zonulin and par2 Expression in Zonulin Transgenic and Zonulin Inhibition Mouse Models of Motility and Inflammation. Int. J. Mol. Sci. 2025, 26, 6381. https://doi.org/10.3390/ijms26136381
Martinez EE, Philpott JD, Lan J, Rodriguez Hovnanian KM, Fasano A. Characterizing zonulin and par2 Expression in Zonulin Transgenic and Zonulin Inhibition Mouse Models of Motility and Inflammation. International Journal of Molecular Sciences. 2025; 26(13):6381. https://doi.org/10.3390/ijms26136381
Chicago/Turabian StyleMartinez, Enid E., Jordan D. Philpott, Jinggang Lan, K. Marco Rodriguez Hovnanian, and Alessio Fasano. 2025. "Characterizing zonulin and par2 Expression in Zonulin Transgenic and Zonulin Inhibition Mouse Models of Motility and Inflammation" International Journal of Molecular Sciences 26, no. 13: 6381. https://doi.org/10.3390/ijms26136381
APA StyleMartinez, E. E., Philpott, J. D., Lan, J., Rodriguez Hovnanian, K. M., & Fasano, A. (2025). Characterizing zonulin and par2 Expression in Zonulin Transgenic and Zonulin Inhibition Mouse Models of Motility and Inflammation. International Journal of Molecular Sciences, 26(13), 6381. https://doi.org/10.3390/ijms26136381