
Kinetics of Phase Transitions in Amorphous Carbamazepine: From Sub-Tg Structural Relaxation to High-Temperature Decomposition


Abstract
1. Introduction
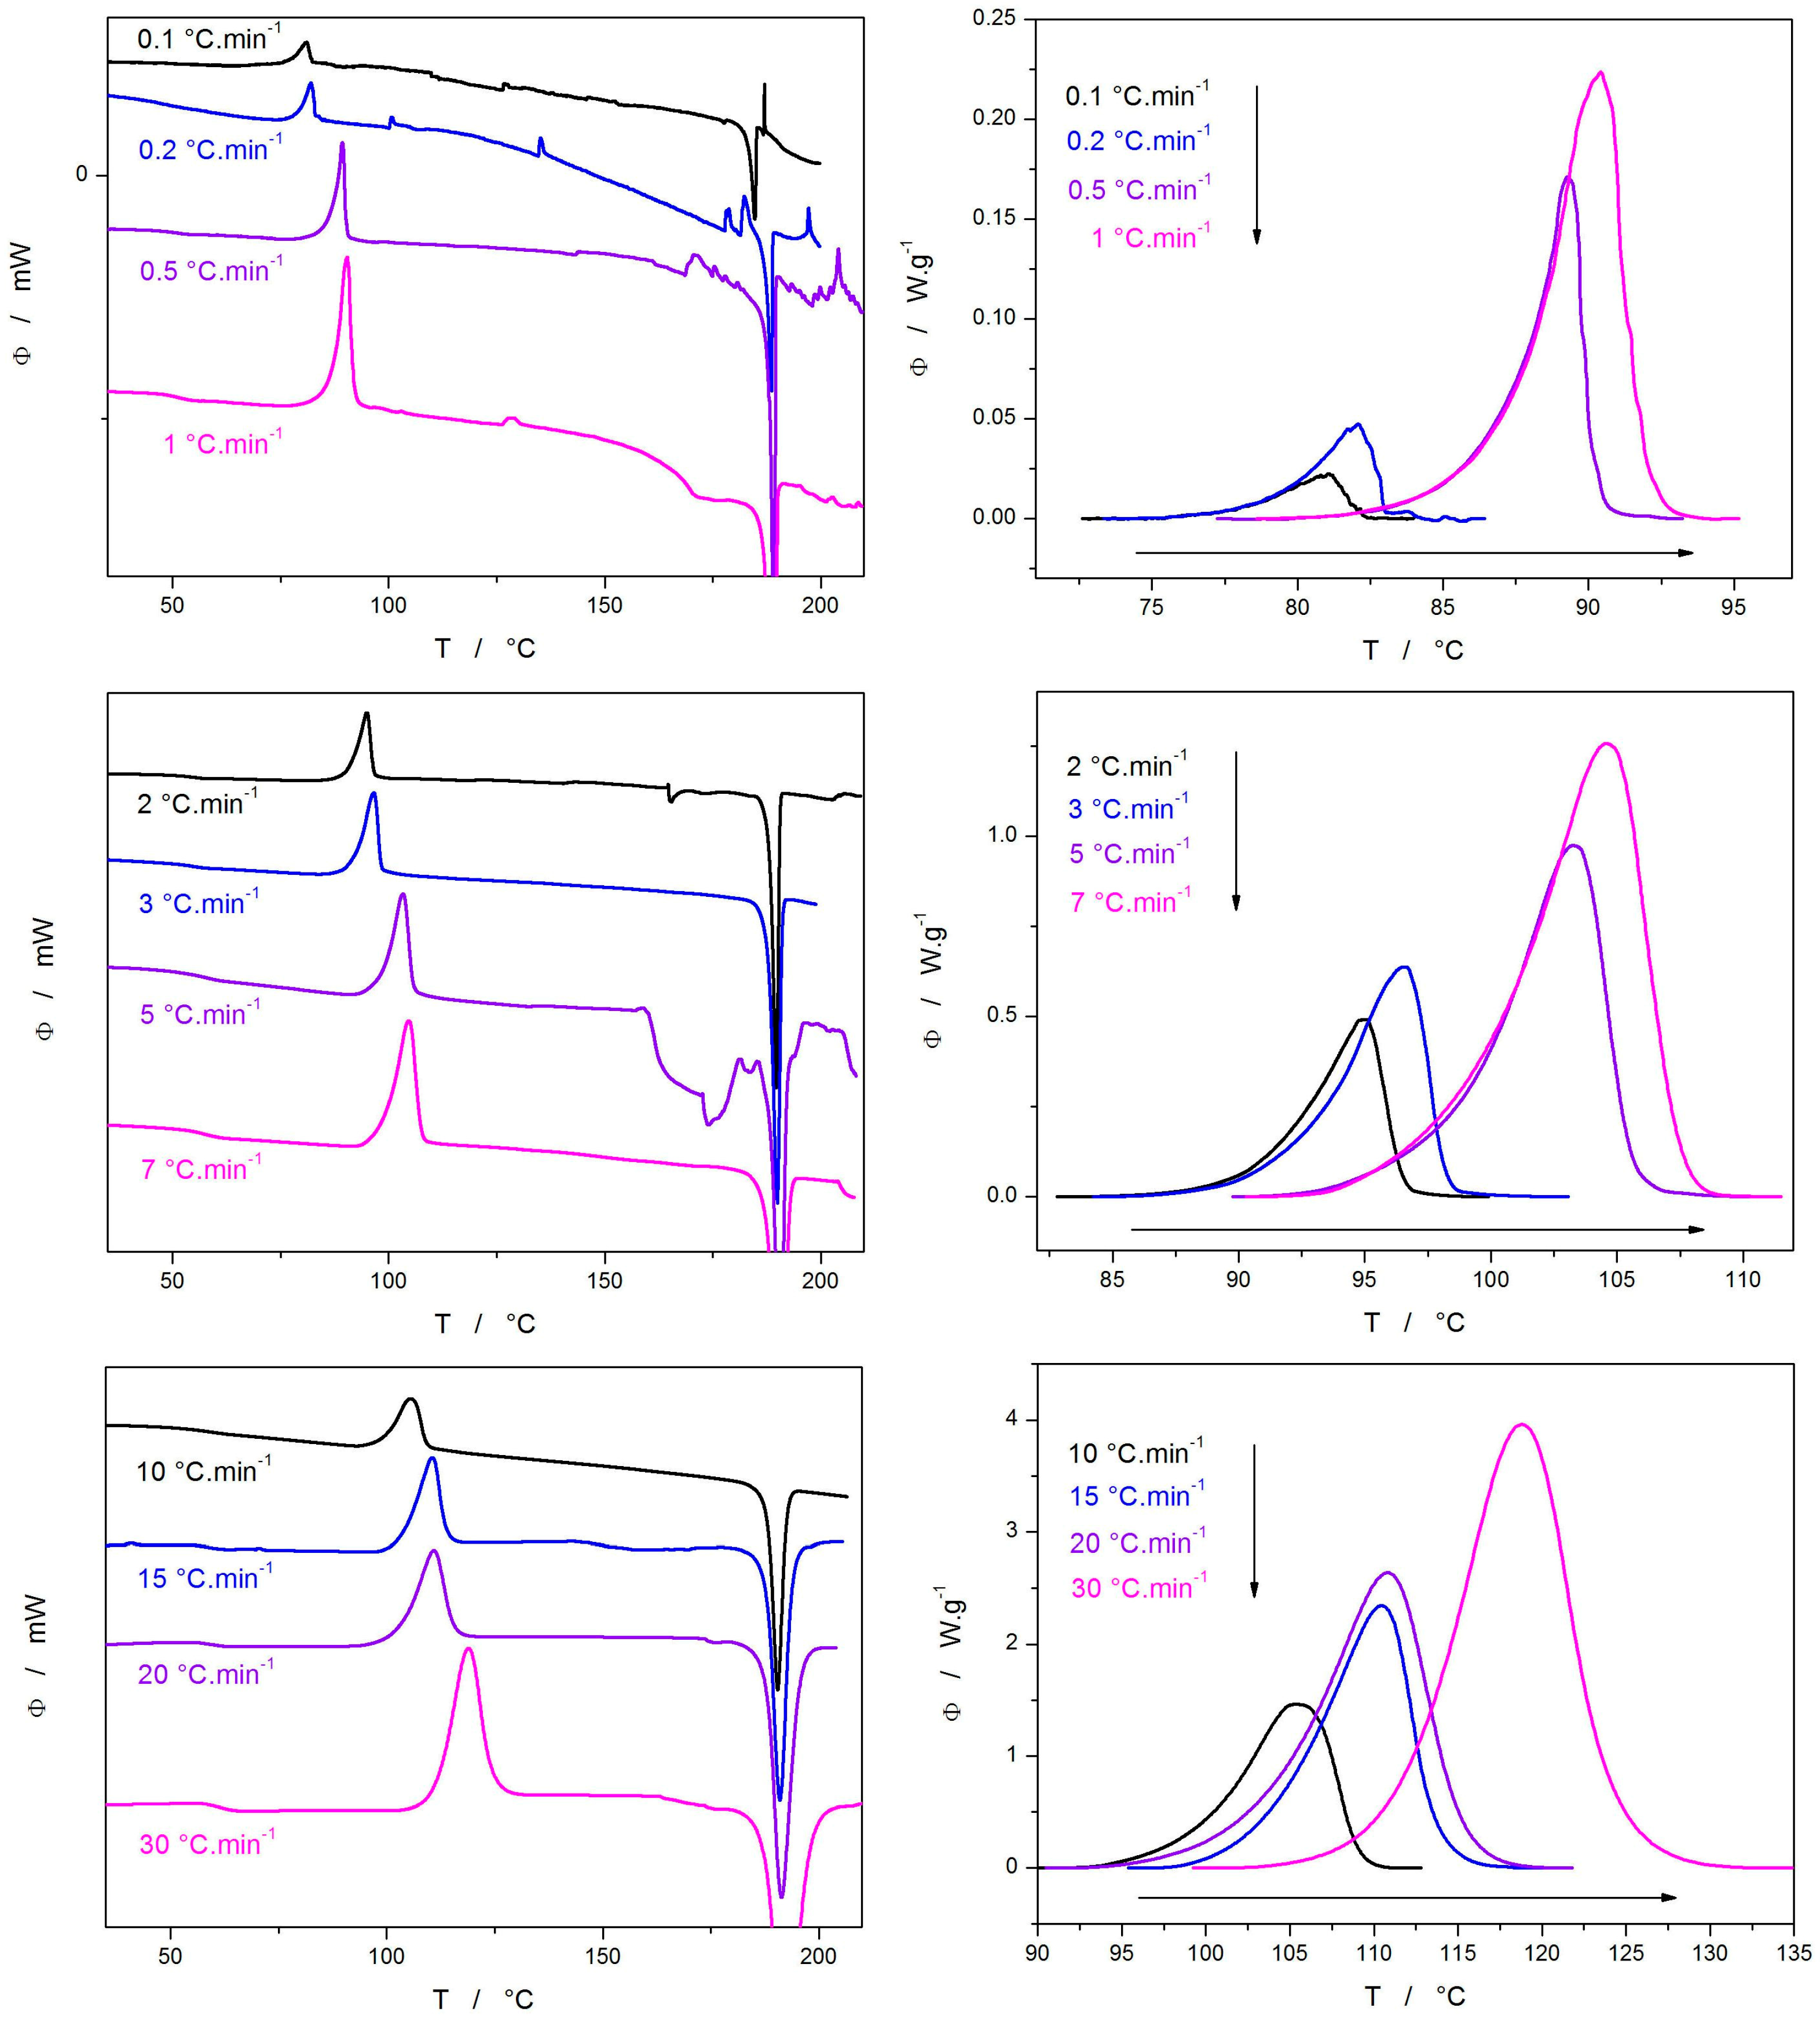
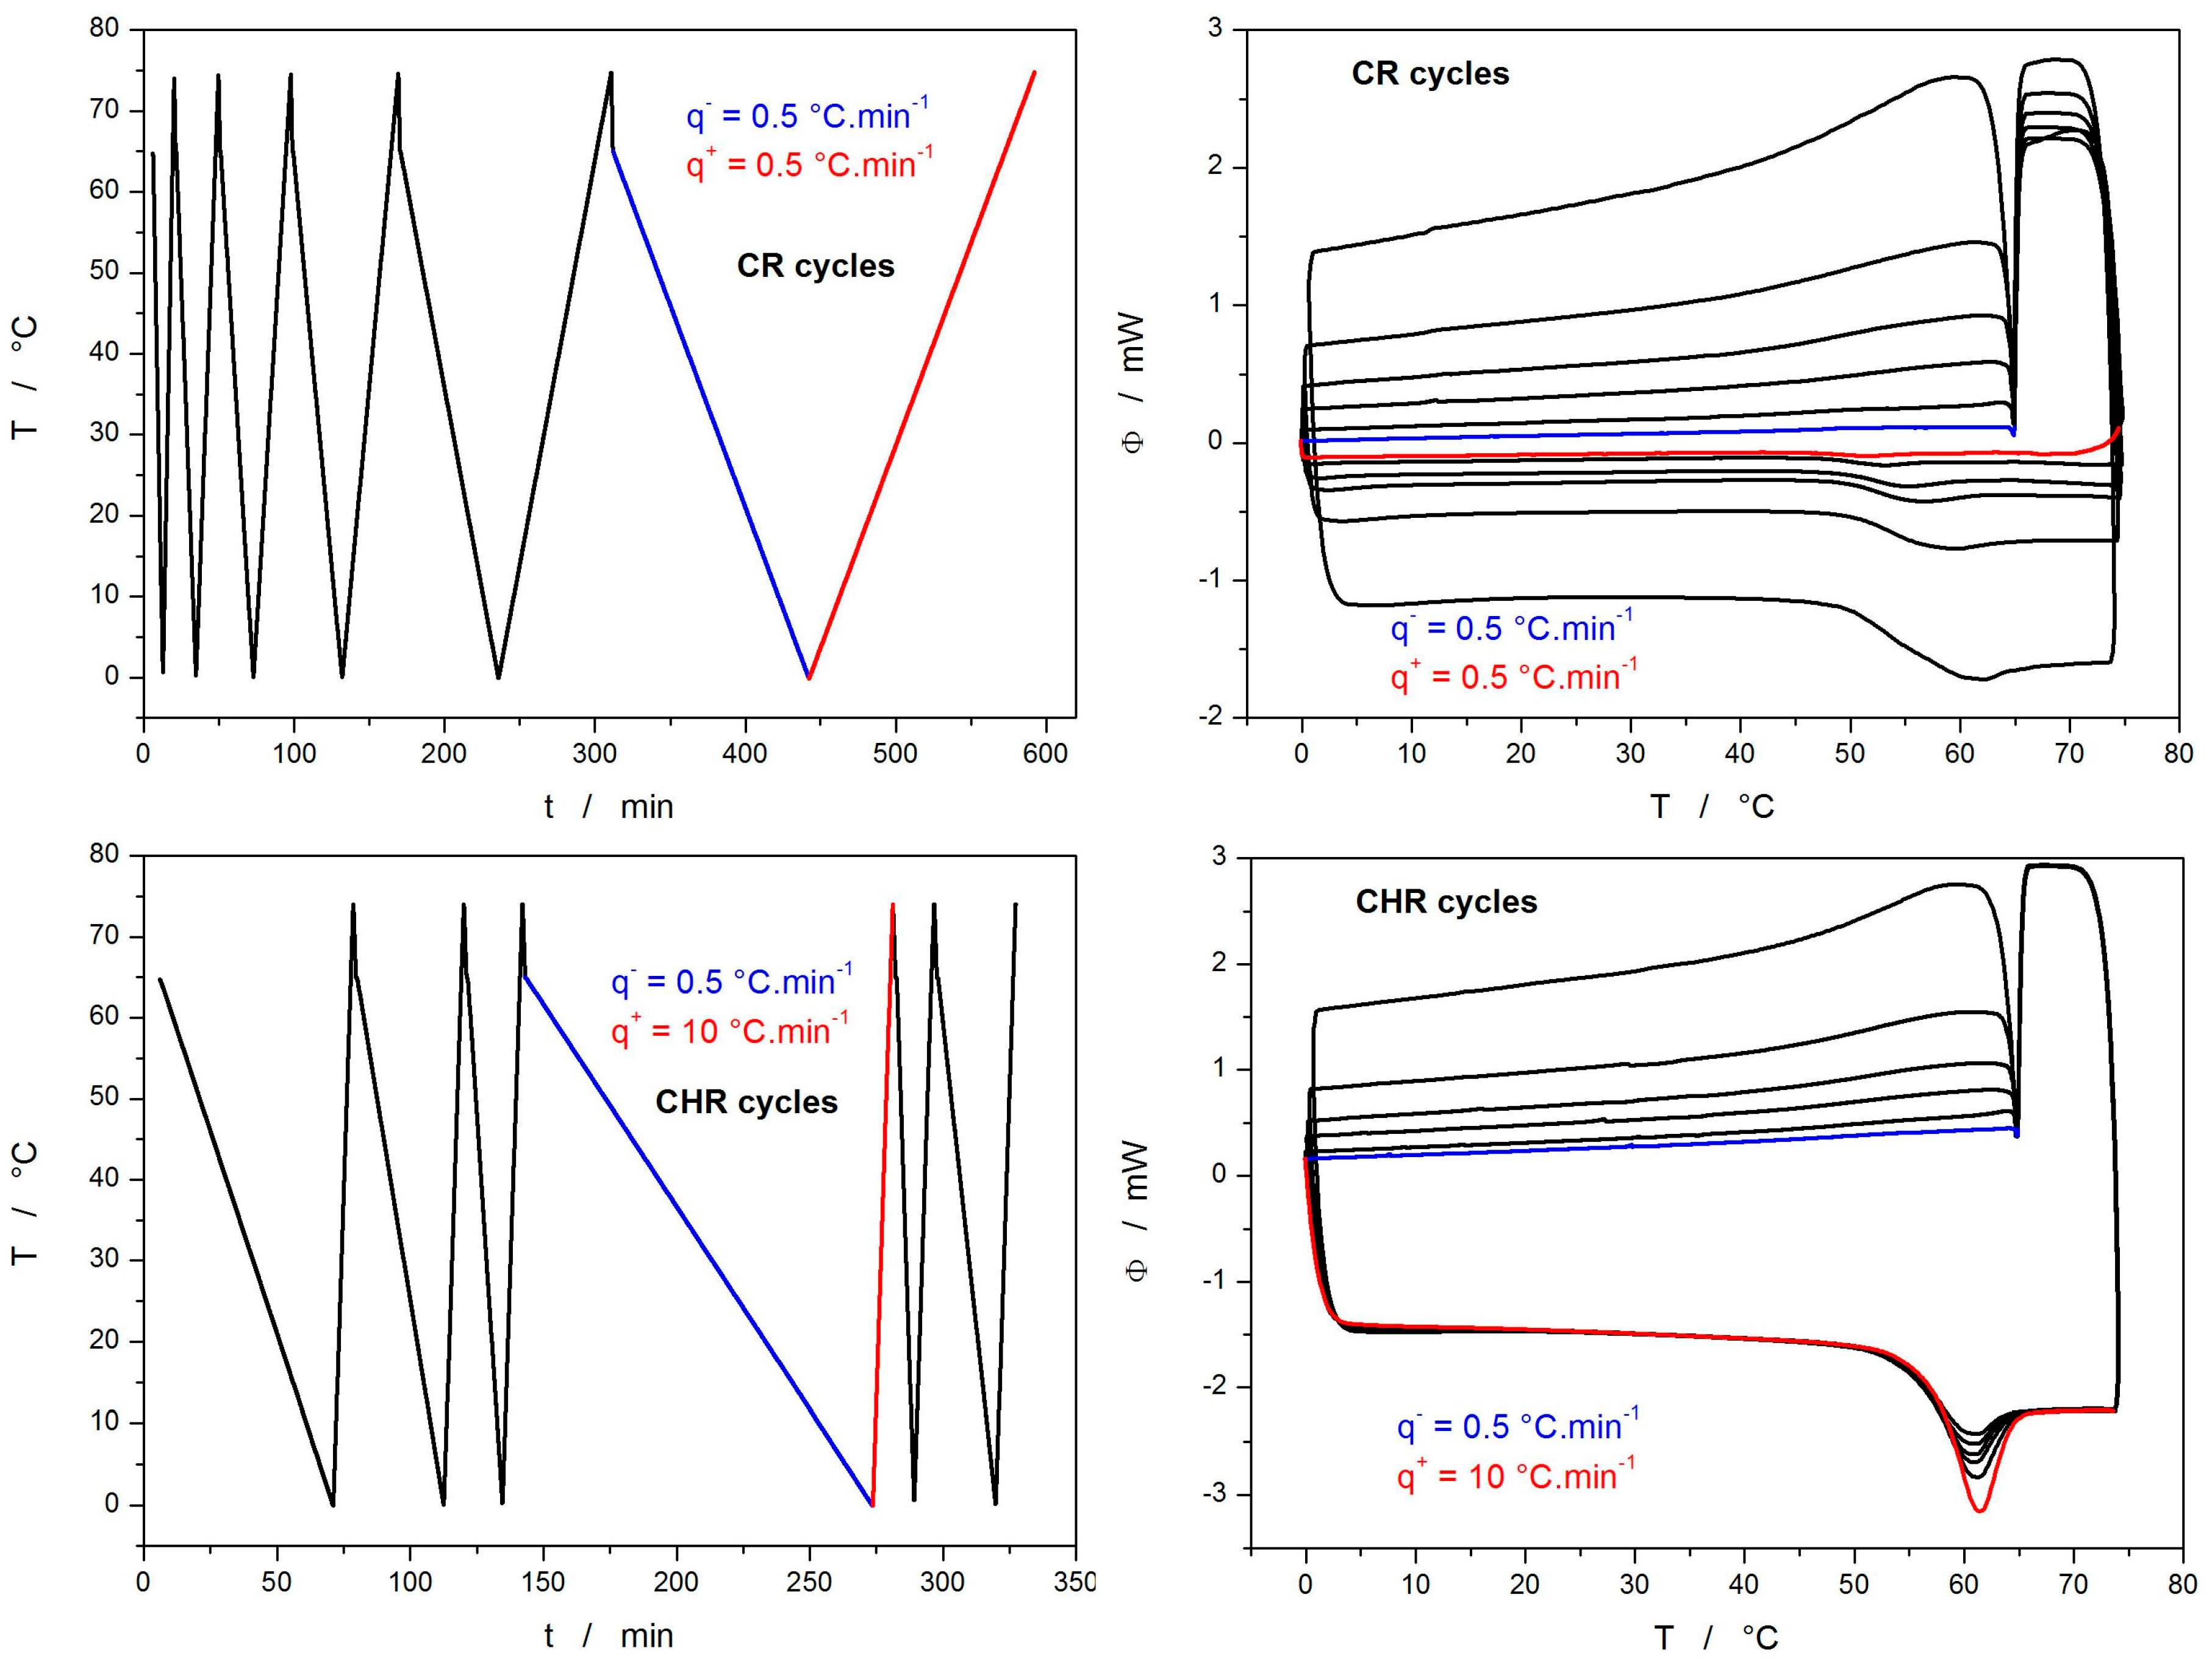
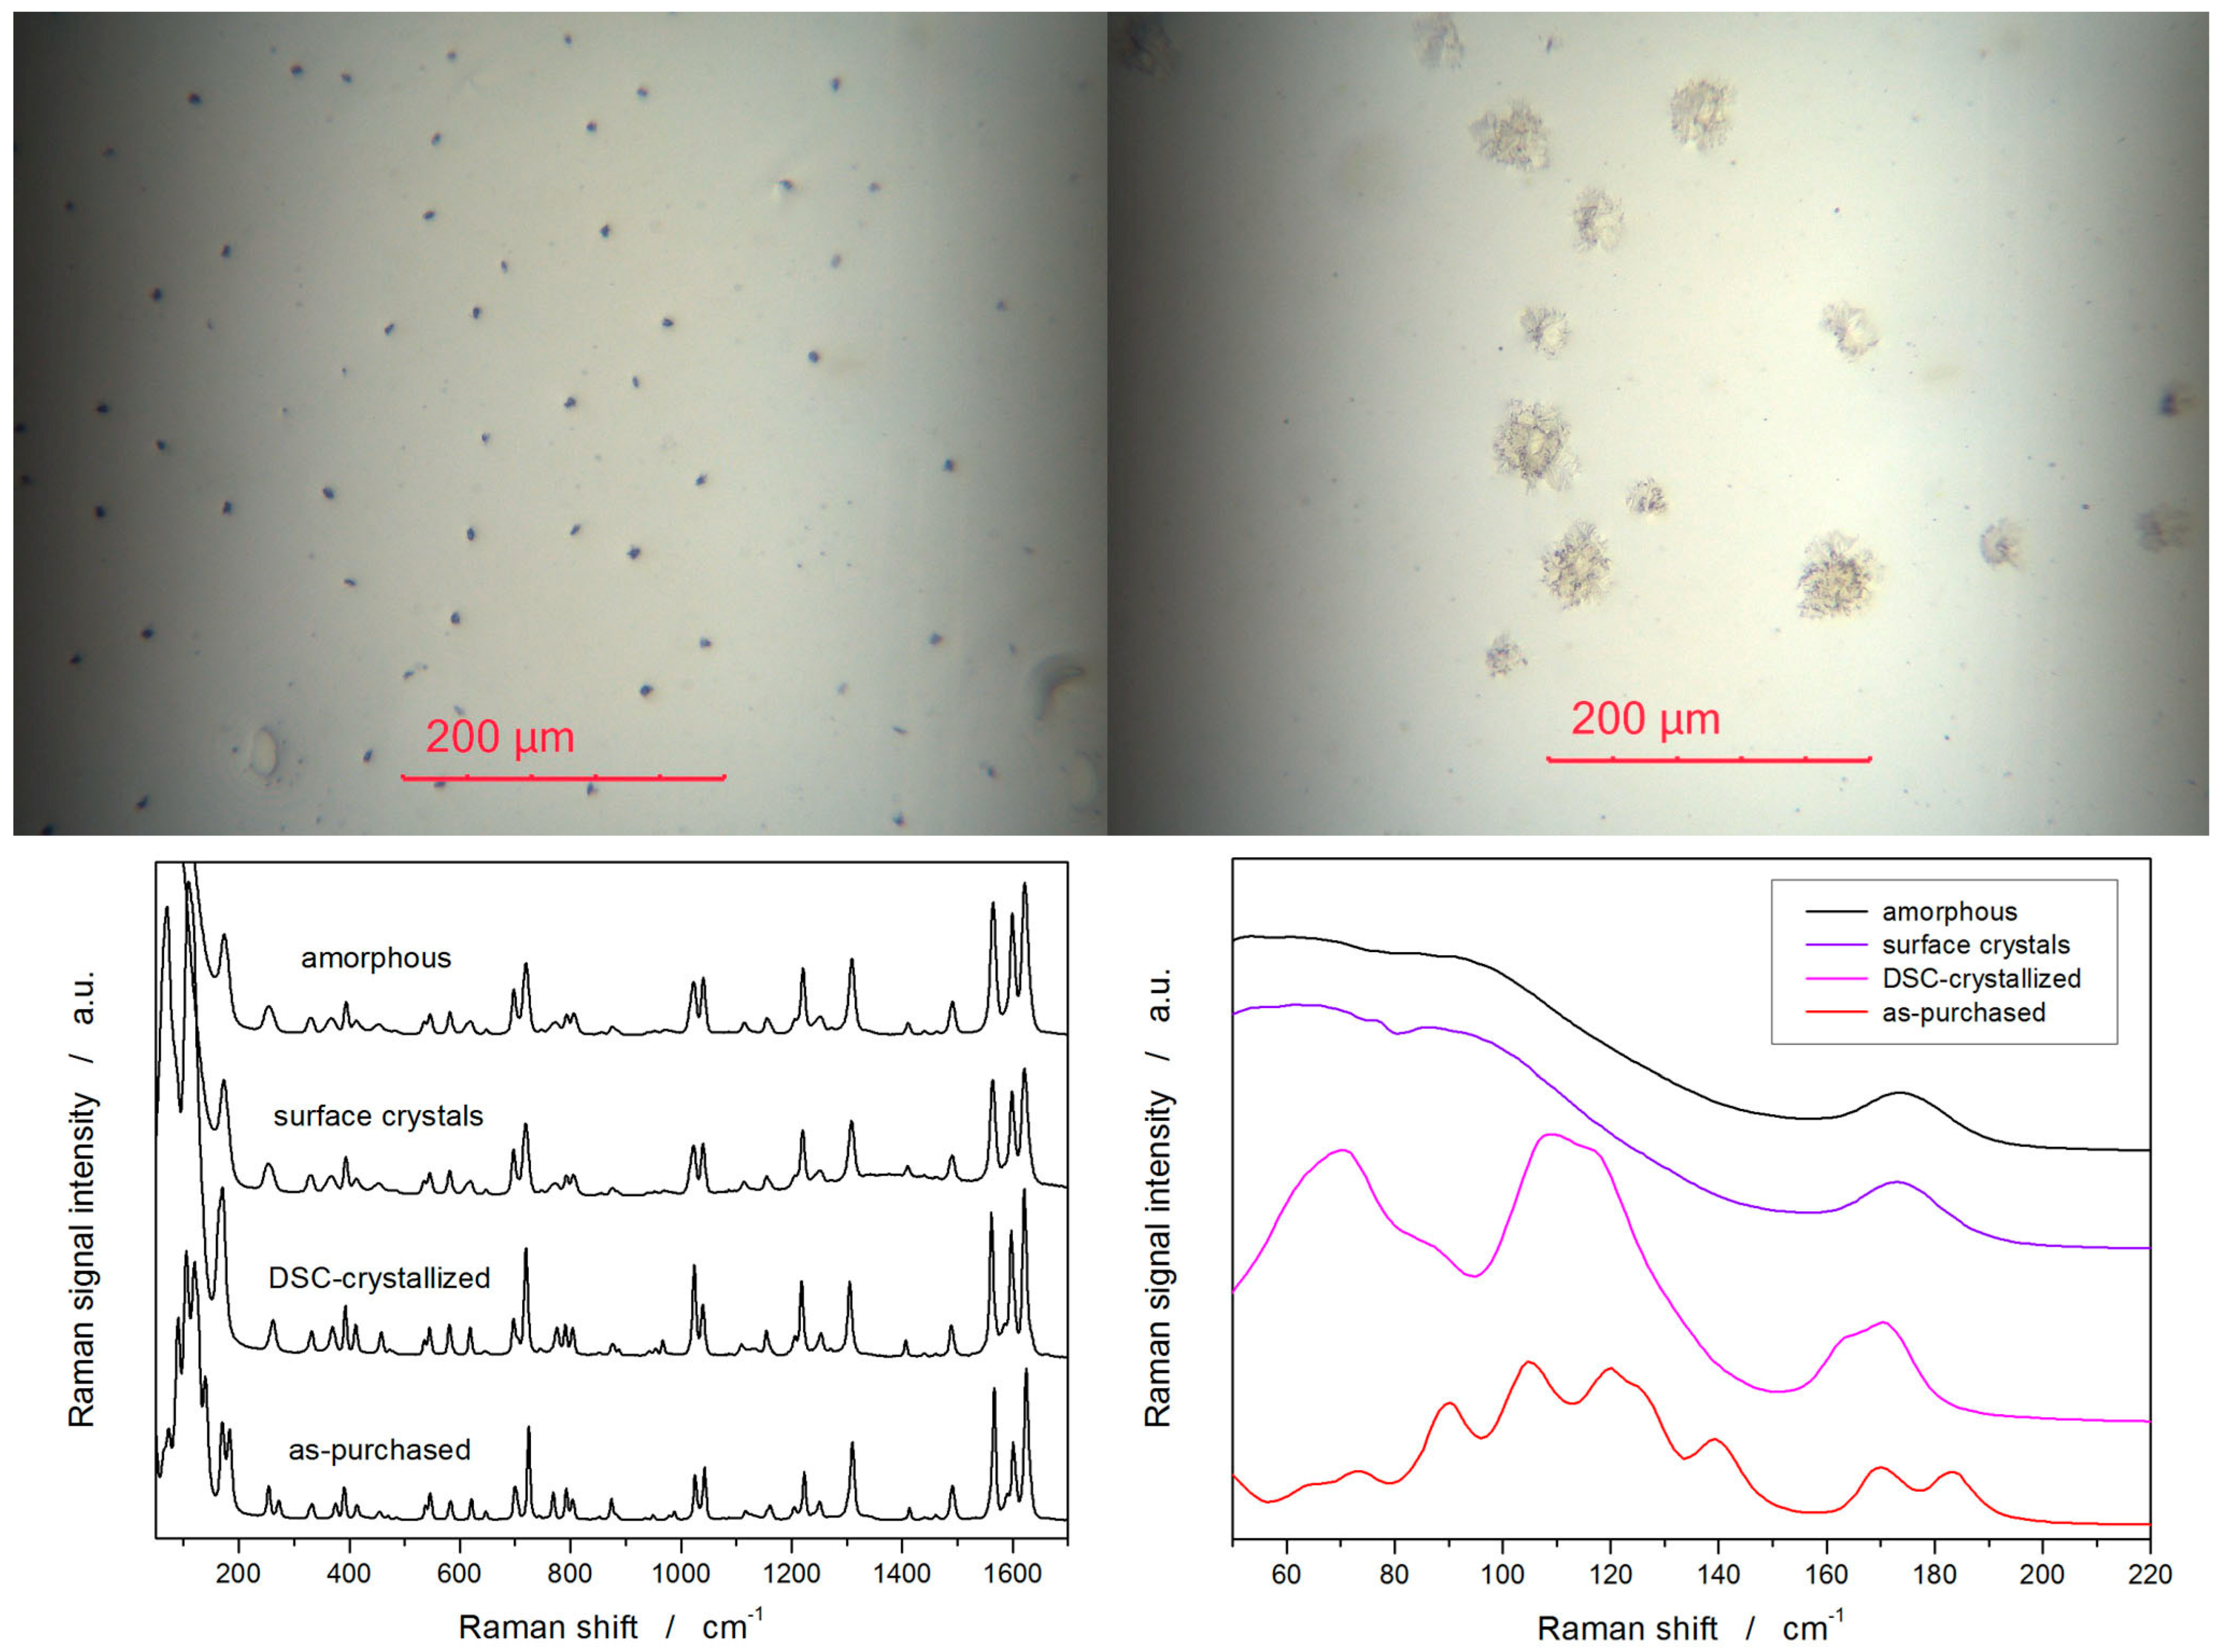
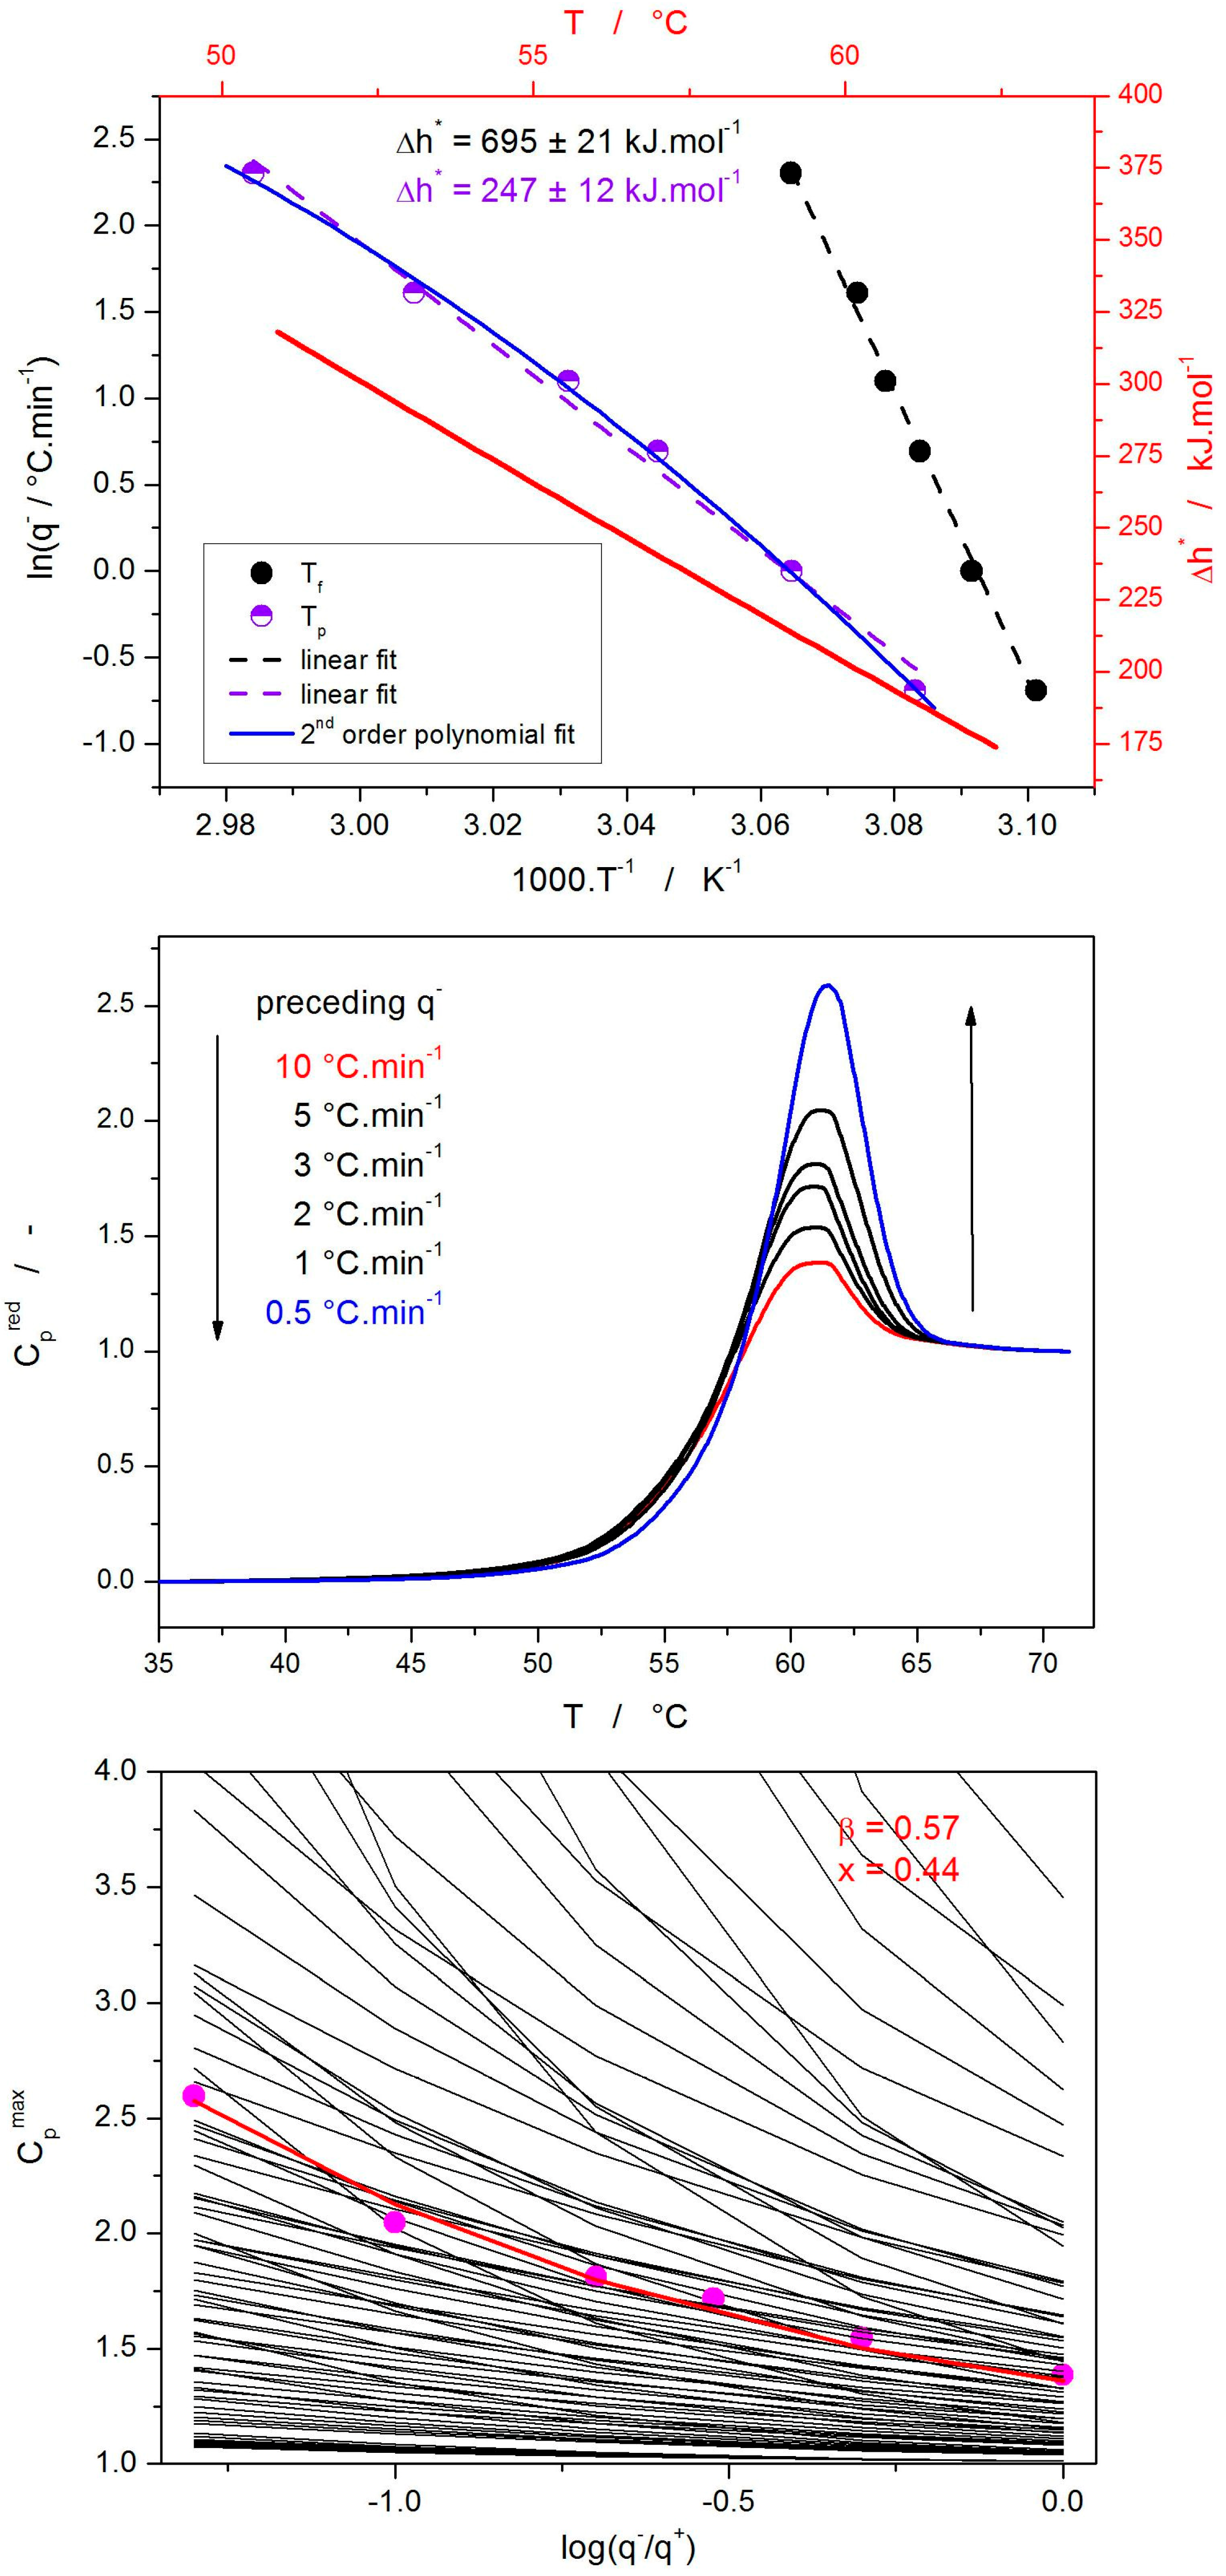
2. Results
3. Discussion
3.1. Structural Relaxation Kinetics
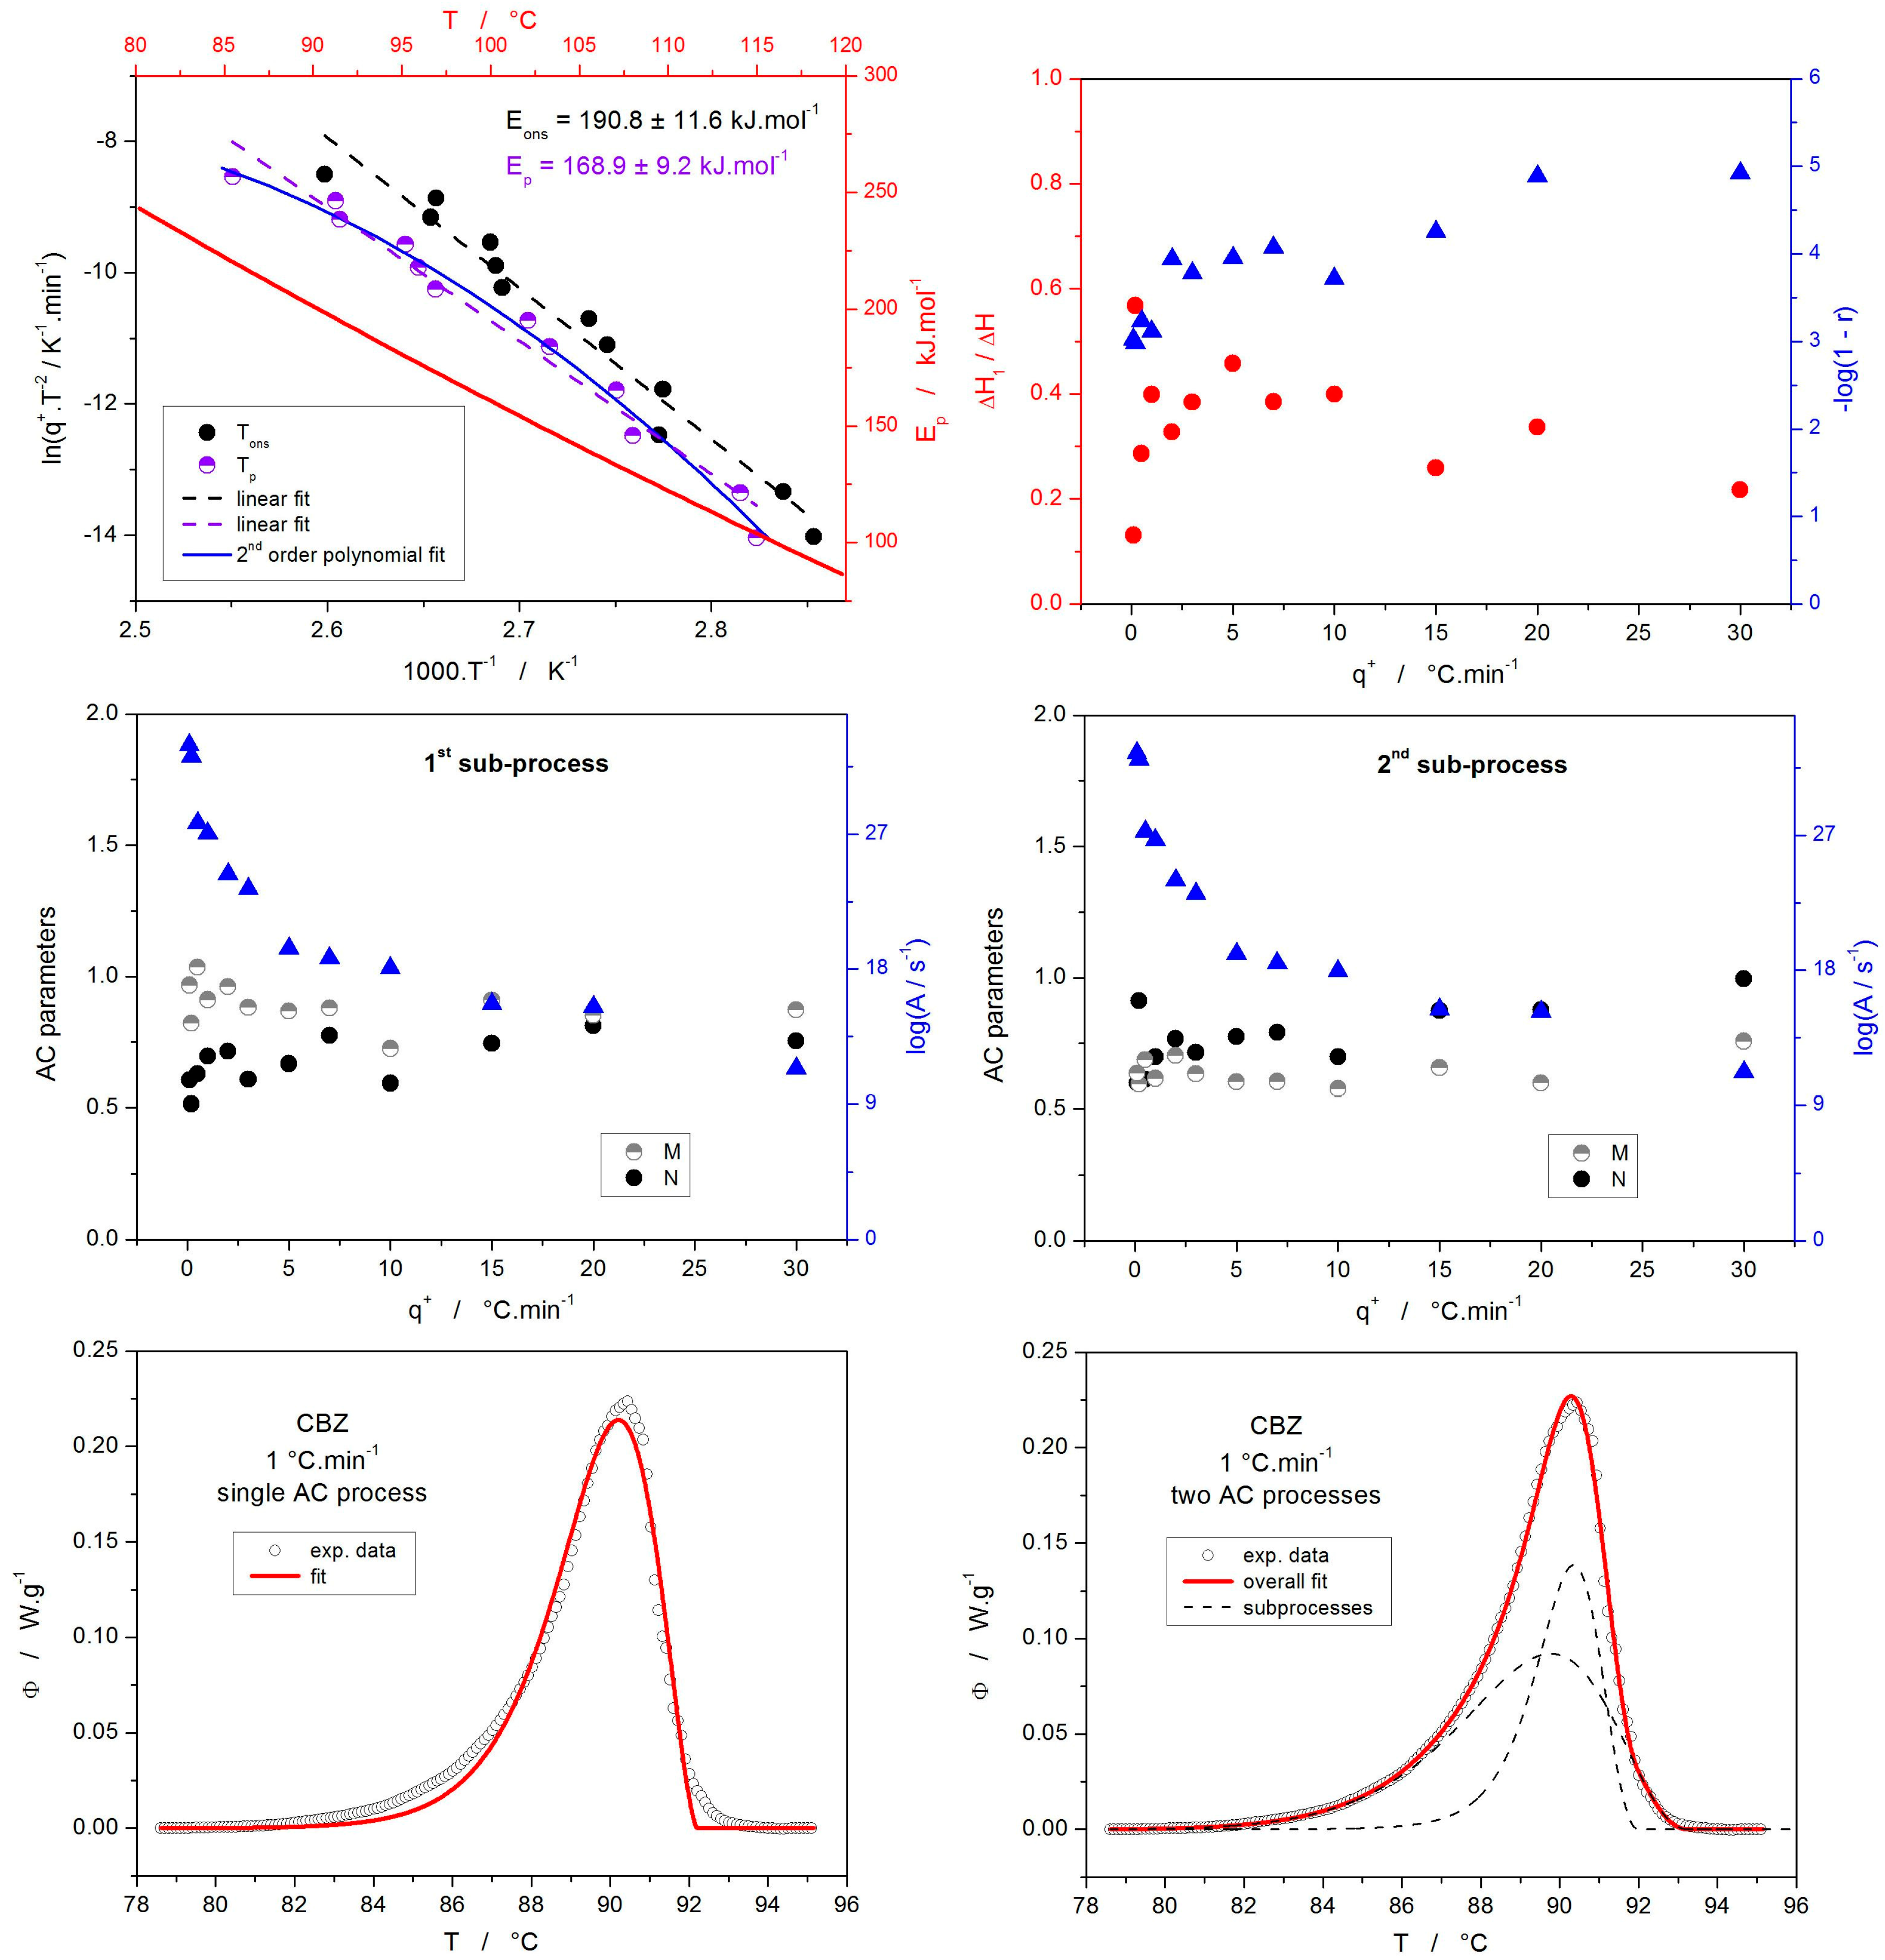
3.2. Cold Crystallization Kinetics
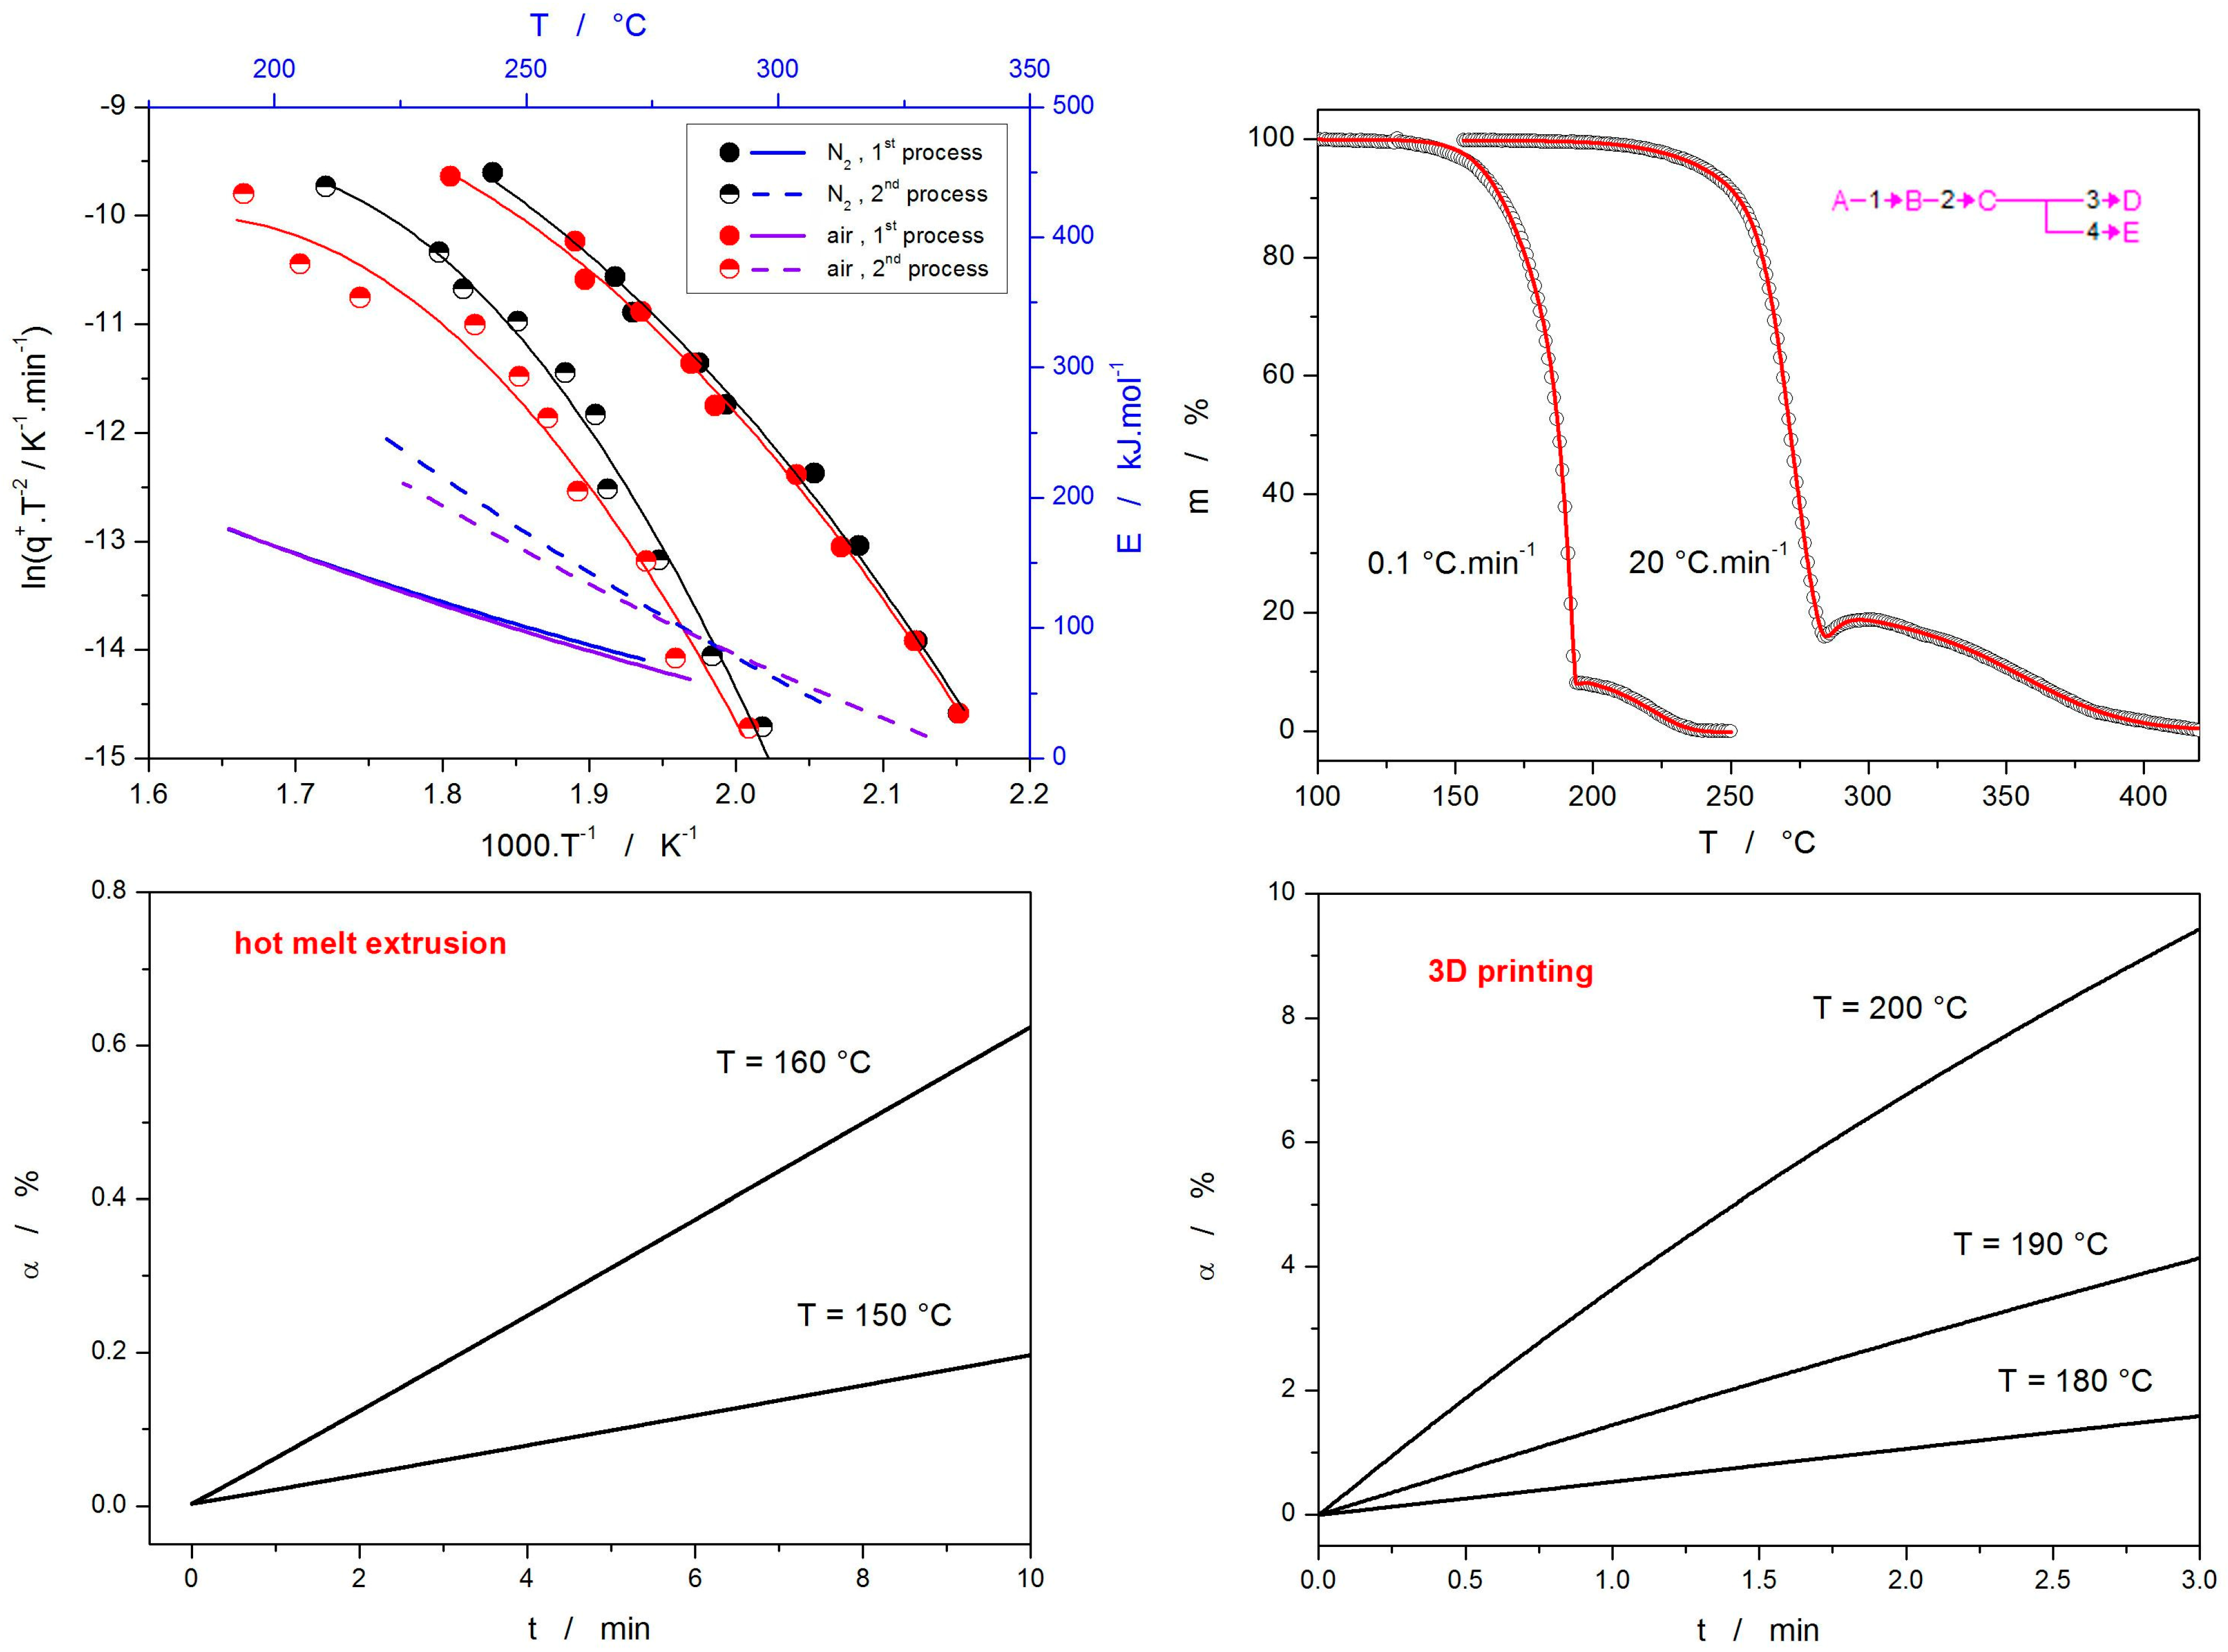
3.3. Thermal Decomposition Kinetics
3.4. Correlation Between the Relaxation and Crystallization Kinetics
4. Materials and Methods
5. Conclusions
Supplementary Materials
Author Contributions
Funding
Institutional Review Board Statement
Informed Consent Statement
Data Availability Statement
Conflicts of Interest
References
- Yan, R.; Tuo, J.; Tai, Z.; Zhang, H.; Yang, J.; Yu, C.; Xu, Z. Management of anti-seizure medications in lactating women with epilepsy. Front. Neurol. 2022, 13, 1005890. [Google Scholar] [CrossRef] [PubMed]
- Hakami, T. Efficacy and tolerability of antiseizure drugs. Ther. Adv. Neurol. Disord. 2021, 14, 17562864211037430. [Google Scholar] [CrossRef] [PubMed]
- Cornett, E.M.; Amarasinghe, S.N.; Angelette, A.; Abubakar, T.; Kaye, A.M.; Kaye, A.D.; Neuchat, E.E.; Urits, I.; Viswanath, O. Valtoco® (Diazepam nasal spray) for the acute treatment of intermittent stereotypic episodes of frequent seizure activity. Neurol. Int. 2021, 13, 64–78. [Google Scholar] [CrossRef]
- Mirza, N.; Stevelink, R.; Taweel, B.; Koeleman, B.P.; Marson, A.G. Using common genetic variants to find drugs for common epilepsies. Brain Commun. 2021, 3, fcab287. [Google Scholar] [CrossRef]
- Nierenberg, A.A.; Agustini, B.; Köhler-Forsberg, O.; Cusin, C.; Katz, D.; Sylvia, L.G.; Peters, A.; Berk, M. Diagnosis and treatment of bipolar disorder: A review. JAMA 2023, 330, 1370–1380. [Google Scholar] [CrossRef] [PubMed]
- Lochana, P.; Banerjee, M.; Bansal, N.; Patel, J.A.; Varghese, R. Carbamazepine and Bipolar Disorder: Pharmacodynamics, Pharmacokinetics, Pharmacogenomics, and Adverse Drug Reactions—A Comprehensive Review. Asian J. Pharm. Pharmacol. 2023, 9, 189–195. [Google Scholar] [CrossRef]
- Grunze, A.; Amann, B.L.; Grunze, H. Efficacy of carbamazepine and its derivatives in the treatment of bipolar disorder. Medicina 2021, 57, 433. [Google Scholar] [CrossRef]
- Ali, S.F.B.; Rahman, Z.; Dharani, S.; Afrooz, H.; Khan, M.A. Chemometric models for quantification of carbamazepine anhydrous and dihydrate forms in the formulation. J. Pharm. Sci. 2019, 108, 1211–1219. [Google Scholar] [CrossRef]
- Kobayashi, Y.; Ito, S.; Itai, S.; Yamamoto, K. Physicochemical properties and bioavailability of carbamazepine polymorphs and dihydrate. Int. J. Pharm. 2000, 193, 137–146. [Google Scholar] [CrossRef]
- Lindenberg, M.; Kopp, S.; Dressman, J.B. Classification of orally administered drugs on the World Health Organization Model list of Essential Medicines according to the biopharmaceutics classification system. Eur. J. Pharm. Biopharm. 2004, 58, 265–278. [Google Scholar] [CrossRef]
- Xu, X.; Grohganz, H.; Knapik-Kowalczuk, J.; Paluch, M.; Rades, T. Mechanistic Investigation into Crystallization of Hydrated Co-Amorphous Systems of Flurbiprofen and Lidocaine. Pharmaceutics 2025, 17, 175. [Google Scholar] [CrossRef]
- Shen, S.; Wang, X.; Dong, C.; Zhao, W.; Wang, Y.; Zhu, L. Solution-Mediated Phase Transformation Processes of Amorphous Iohexol: Mechanisms and Its Applications. Cryst. Growth Des. 2025, 25, 519–532. [Google Scholar] [CrossRef]
- Budiman, A.; Lailasari, E.; Nurani, N.V.; Yunita, E.N.; Anastasya, G.; Aulia, R.N.; Lestari, I.N.; Subra, L.; Aulifa, D.L. Ternary solid dispersions: A review of the preparation, characterization, mechanism of drug release, and physical stability. Pharmaceutics 2023, 15, 2116. [Google Scholar] [CrossRef]
- Baird, J.A.; van Eerdenbrugh, B.; Taylor, L.S. A classification system to assess the crystallization tendency of organic molecules from undercooled melts. J. Pharm. Sci. 2010, 99, 3787–3806. [Google Scholar] [CrossRef] [PubMed]
- Schneider-Rauber, G.; Arhangelskis, M.; Bond, A.D.; Ho, R.; Nere, N.; Bordawekar, S.; Sheikh, A.Y.; Jones, W. Polymorphism and surface diversity arising from stress-induced transformations—The case of multicomponent forms of carbamazepine. Struct. Sci. 2021, 77, 54–67. [Google Scholar] [CrossRef]
- Dołęga, A.; Juszyńska-Gałązka, E.; Deptuch, A.; Baran, S.; Zieliński, P.M. Cold-crystallization and physical stability of glassy carbamazepine. Thermochim. Acta 2022, 707, 179100. [Google Scholar] [CrossRef]
- Chakravarty, P.; Pandya, K.; Nagapudi, K. Determination of fragility in organic small molecular glass forming liquids: Comparison of calorimetric and spectroscopic data and commentary on pharmaceutical importance. Mol. Pharm. 2018, 15, 1248–1257. [Google Scholar] [CrossRef]
- Angell, C.A.; Ngai, K.L.; McKenna, G.B.; McMillan, P.F.; Martin, S.W. Relaxation in glassforming liquids and amorphous solids. J. Appl. Phys. 2000, 88, 3113–3157. [Google Scholar] [CrossRef]
- Kohlrausch, F. Beiträge zur Kenntniss der elastischen Nachwirkung. Ann. Der Phys. 1866, 204, 1–20. [Google Scholar] [CrossRef]
- Williams, G.; Watts, D.C. Non-symmetrical dielectric relaxation behaviour arising from a simple empirical decay function. Trans. Faraday Soc. 1970, 66, 80–85. [Google Scholar] [CrossRef]
- Dołęga, A.; Zieliński, P.M. Kinetics of non-isothermal cold-crystallization of carbamazepine in the glassy state studied by DSC. J. Non-Cryst. Solids 2022, 575, 121198. [Google Scholar] [CrossRef]
- Avrami, M. Kinetics of phase change. I—General theory. J. Chem. Phys. 1939, 7, 1103–1112. [Google Scholar] [CrossRef]
- Avrami, M. Kinetics of phase change. II—Transformation-time relations for random distribution of nuclei. J. Chem. Phys. 1940, 8, 212–224. [Google Scholar] [CrossRef]
- Avrami, M. Granulation, phase change, and microstructure kinetics of phase change III. J. Chem. Phys. 1941, 9, 177–184. [Google Scholar] [CrossRef]
- Luo, M.; Chen, A.; Shan, S.; Guo, M.; Cai, T. Molar Ratio-Dependent Crystallization in Coamorphous Celecoxib–Carbamazepine Systems: The Interplay of Thermodynamics and Kinetics. Mol. Pharm. 2025, 22, 3401–3413. [Google Scholar] [CrossRef]
- Pinto, M.A.L.; Ambrozini, B.; Ferreira, A.P.G.; Cavalheiro, É.T.G. Thermoanalytical studies of carbamazepine: Hydration/dehydration, thermal decomposition, and solid phase transitions. Braz. J. Pharm. Sci. 2014, 50, 877–884. [Google Scholar] [CrossRef]
- Bordawekar, M.S.; Pudipeddi, M.; Ruegger, C.E.; Dhareshwar, S.S. Formulation Intervention to Overcome Decreased Kinetic Solubility of a Low Tg Amorphous Drug. AAPS PharmSciTech 2023, 24, 149. [Google Scholar] [CrossRef]
- Kushwah, V.; Gomes Lopes, D.; Saraf, I.; Koutsamanis, I.; Werner, B.; Zangger, K.; Roy, M.C.; Bartlett, J.A.; Schmidt, H.F.; Shamblin, S.L.; et al. Phase behavior of drug–lipid–surfactant ternary systems toward understanding the annealing-induced change. Mol. Pharm. 2021, 19, 532–546. [Google Scholar] [CrossRef]
- Luo, M.; Chen, A.; Huang, C.; Guo, M.; Cai, T. Effects of Polymers on Cocrystal Growth in a Drug–Drug Coamorphous System: Relations between Glass-to-Crystal Growth and Surface-Enhanced Crystal Growth. Mol. Pharm. 2024, 21, 3591–3602. [Google Scholar] [CrossRef]
- Cai, T.; Zhu, L.; Yu, L. Crystallization of organic glasses: Effects of polymer additives on bulk and surface crystal growth in amorphous nifedipine. Pharm. Res. 2011, 28, 2458–2466. [Google Scholar] [CrossRef]
- Sun, Y.; Zhu, L.; Wu, T.; Cai, T.; Gunn, E.M.; Yu, L. Stability of amorphous pharmaceutical solids: Crystal growth mechanisms and effect of polymer additives. AAPS J. 2012, 14, 380–388. [Google Scholar] [CrossRef] [PubMed]
- Scherer, G.W. Theories of relaxation. J. Non-Cryst. Sol. 1990, 123, 75–89. [Google Scholar] [CrossRef]
- Richert, R. Physical aging and heterogeneous dynamics. Phys. Rev. Lett. 2010, 104, 085702. [Google Scholar] [CrossRef]
- Svoboda, R.; Pakosta, M.; Doležel, P. How the Presence of Crystalline Phase Affects Structural Relaxation in Molecular Liquids: The Case of Amorphous Indomethacin. Int. J. Mol. Sci. 2023, 24, 16275. [Google Scholar] [CrossRef] [PubMed]
- Awad, A.; Gaisford, S.; Basit, A.W. Fused deposition modelling: Advances in engineering and medicine. 3D Print. Pharm. 2018, 31, 107–132. [Google Scholar] [CrossRef]
- Mohapatra, S.; Kar, R.K.; Biswal, P.K.; Bindhani, S. Approaches of 3D printing in current drug delivery. Sens. Int. 2022, 3, 100146. [Google Scholar] [CrossRef]
- Li, N.; Qiao, D.; Zhao, S.; Lin, Q.; Zhang, B.; Xie, F. 3D printing to innovate biopolymer materials for demanding applications: A review. Mater. Today Chem. 2021, 20, 100459. [Google Scholar] [CrossRef]
- Liu, J.; Sun, L.; Xu, W.; Wang, Q.; Yu, S.; Sun, J. Current advances and future perspectives of 3D printing natural-derived biopolymers. Carbohydr. Polym. 2019, 207, 297–316. [Google Scholar] [CrossRef]
- Patel, N.G.; Serajuddin, A.T. Development of FDM 3D-printed tablets with rapid drug release, high drug-polymer miscibility and reduced printing temperature by applying the acid-base supersolubilization (ABS) principle. Int. J. Pharm. 2021, 600, 120524. [Google Scholar] [CrossRef]
- Svoboda, R. Thermally Induced Phenomena in Amorphous Nifedipine: The Correlation Between the Structural Relaxation and Crystal Growth Kinetics. Molecules 2025, 30, 175. [Google Scholar] [CrossRef]
- Svoboda, R.; Kozlová, K. Thermo-Structural Characterization of Phase Transitions in Amorphous Griseofulvin: From sub-Tg Relaxation and Crystal Growth to High-Temperature Decomposition. Molecules 2024, 29, 1516. [Google Scholar] [CrossRef] [PubMed]
- Svoboda, R.; Košťálová, D.; Krbal, M.; Komersová, A. Indomethacin: The interplay between structural relaxation, viscous flow and crystal growth. Molecules 2022, 27, 5668. [Google Scholar] [CrossRef] [PubMed]
- Svoboda, R.; Macháčková, J.; Nevyhoštěná, M.; Komersová, A. Thermal stability of amorphous nimesulide: From glass formation to crystal growth and thermal degradation. Phys. Chem. Chem. Phys. 2024, 26, 856–872. [Google Scholar] [CrossRef] [PubMed]
- Grzesiak, A.L.; Lang, M.; Kim, K.; Matzger, A.J. Comparison of the four anhydrous polymorphs of carbamazepine and the crystal structure of form I. J. Pharm. Sci. 2003, 92, 2260–2271. [Google Scholar] [CrossRef]
- Tian, F.; Zeitler, J.A.; Strachan, C.J.; Saville, D.J.; Gordon, K.C.; Rades, T. Characterizing the conversion kinetics of carbamazepine polymorphs to the dihydrate in aqueous suspension using Raman spectroscopy. J. Pharm. Biomed. Anal. 2006, 40, 271–280. [Google Scholar] [CrossRef]
- Šesták, J. Science of Heat and Thermophysical Studies: A Generalized Approach to Thermal Analysis; Elsevier: Amsterdam, The Netherlands, 2005. [Google Scholar]
- Svoboda, R.; Málek, J. Description of enthalpy relaxation dynamics in terms of TNM model. J. Non-Cryst. Solids 2013, 378, 186–195. [Google Scholar] [CrossRef]
- Ediger, M. Lecture: Unusual liquids prepared by vapor deposition. In Proceedings of the Viscous Liquids and the Glass Transition XXI, Roskilde, Denmark, 14–16 May 2025. [Google Scholar]
- Dołęga, A.; Juszyńska-Gałązka, E.; Osiecka-Drewniak, N.; Natkański, P.; Kuśtrowski, P.; Krupa, A.; Zieliński, P.M. Study on the thermal performance of carbamazepine at different temperatures, pressures and atmosphere conditions. Thermochim. Acta 2021, 703, 178990. [Google Scholar] [CrossRef]
- Dołęga, A.; Krupa, A.; Zieliński, P.M. Enhanced thermal stability of carbamazepine obtained by fast heating, hydration and recrystallization from organic solvent solutions: A DSC and HPLC study. Thermochim. Acta 2020, 690, 178691. [Google Scholar] [CrossRef]
- Guinet, Y.; Paccou, L.; Danède, F.; Willart, J.F.; Derollez, P.; Hédoux, A. Comparison of amorphous states prepared by melt-quenching and cryomilling polymorphs of carbamazepine. Int. J. Pharm. 2016, 509, 305–313. [Google Scholar] [CrossRef]
- O’Brien, L.E.; Timmins, P.; Williams, A.C.; York, P. Use of in situ FT-Raman spectroscopy to study the kinetics of the transformation of carbamazepine polymorphs. J. Pharm. Biomed. Anal. 2004, 36, 335–340. [Google Scholar] [CrossRef]
- Tool, A.Q. Relation between inelastic deformability and thermal expansion of glass in its annealing range. J. Am. Ceram. Soc. 1946, 29, 240–253. [Google Scholar] [CrossRef]
- Narayanaswamy, O. A model of structural relaxation in glass. J. Am. Ceram. Soc. 1971, 54, 491–498. [Google Scholar] [CrossRef]
- Moynihan, C.T.; Easteal, A.J.; De Bolt, M.A.; Tucker, J. Dependence of the fictive temperature of glass on cooling rate. J. Am. Ceram. Soc. 1976, 59, 12–16. [Google Scholar] [CrossRef]
- Svoboda, R. Novel equation to determine activation energy of enthalpy relaxation. J. Therm. Anal. Calorim. 2015, 121, 895–899. [Google Scholar] [CrossRef]
- Hodge, I.M.; Berens, A.R. Effects of annealing and prior history on enthalpy relaxation in glassy polymers. 2. Mathematical modeling. Macromolecules 1982, 15, 762–770. [Google Scholar] [CrossRef]
- Holba, P.; Šesták, J. Heat inertia and its role in thermal analysis. J. Therm. Anal. Calorim. 2015, 121, 303–307. [Google Scholar] [CrossRef]
- Svoboda, R.; Málek, J. Enthalpy relaxation in Ge–Se glassy system. J. Therm. Anal. 2012, 113, 831–842. [Google Scholar] [CrossRef]
- Šesták, J. Thermophysical Properties of Solids, Their Measurements and Theoretical Analysis; Elsevier: Amsterdam, The Netherlands, 1984. [Google Scholar]
- Kissinger, H.E. Reaction kinetics in differential thermal analysis. Anal. Chem. 1957, 29, 1702–1706. [Google Scholar] [CrossRef]
- Augis, J.A.; Bennett, J.E. Calculation of the Avrami parameters for heterogeneous solid state reactions using a modification of the Kissinger method. J. Therm. Anal. 1978, 13, 283–292. [Google Scholar] [CrossRef]
- Svoboda, R.; Chovanec, J.; Slang, S.; Beneš, L.; Konrad, P. Single-curve multivariate kinetic analysis: Application to the crystallization of commercial Fe-Si-Cr-B amorphous alloys. J. Alloys Compd. 2021, 889, 161672. [Google Scholar] [CrossRef]
- Opfermann, J. Kinetic analysis using multivariate non-linear regression. J. Therm. Anal. Calorim. 2000, 60, 641–658. [Google Scholar] [CrossRef]
- Svoboda, R.; Romanová, J.; Šlang, S.; Obadalová, I.; Komersová, A. Influence of particle size and manufacturing conditions on the recrystallization of amorphous Enzalutamide. Eur. J. Pharm. Sci. 2020, 153, 105468. [Google Scholar] [CrossRef] [PubMed]
- Patil, H.; Tiwari, R.V.; Repka, M.A. Hot-Melt Extrusion: From Theory to Application in Pharmaceutical Formulation. AAPS PharmSciTech 2016, 17, 20–42. [Google Scholar] [CrossRef] [PubMed]
- Huang, S.; O’Donnell, K.P.; Keen, J.M.; Rickard, M.A.; McGinity, J.W.; Williams, R.O., III. A New Extrudable Form of Hypromellose: AFFINISOL™ HPMC HME. AAPS PharmSciTech 2016, 17, 106–119. [Google Scholar] [CrossRef]
- Svoboda, R.; Nevyhoštěná, M.; Macháčková, J.; Vaculík, J.; Knotková, K.; Chromčíková, M.; Komersová, A. Thermal degradation of Affinisol HPMC: Optimum processing temperatures for hot melt extrusion and 3D printing. Pharm. Res. 2023, 40, 2253–2268. [Google Scholar] [CrossRef]
- Cohen, M.H.; Turnbull, D. Molecular Transport in Liquids and Glasses. J. Chem. Phys. 1959, 31, 1164–1169. [Google Scholar] [CrossRef]


| q+/°C.min−1 | Tg/°C | Tons/°C | Tp/°C | ΔHc/J.g−1 | Tm_ons/°C | Tm_p/°C | ΔHm/J.g−1 |
|---|---|---|---|---|---|---|---|
| 0.1 | 50.67 | 77.32 | 81.03 | 47.48 | 183.45 | 184.68 | 89.96 |
| 0.2 | 48.61 | 79.28 | 82.08 | 45 | 187.17 | 188.57 | 87.85 |
| 0.5 | 51.58 | 87.51 | 89.28 | 45.21 | 188.13 | 189.23 | 97.7 |
| 1 | 49.53 | 87.24 | 90.42 | 53.42 | 187.96 | 189.37 | 113.3 |
| 2 | 53.54 | 91.06 | 95.07 | 56.3 | 188.14 | 189.68 | 110.6 |
| 3 | 54.27 | 92.31 | 96.59 | 57.05 | 187.96 | 189.96 | 108.6 |
| 5 | 56.92 | 98.45 | 103.3 | 60.57 | 188.31 | 190.57 | 100.1 |
| 7 | 57.33 | 98.93 | 104.59 | 63.32 | 188.1 | 190.58 | 113.3 |
| 10 | 59.36 | 99.3 | 105.55 | 61.1 | 188.16 | 190.48 | 107.4 |
| 15 | 58.87 | 103.67 | 110.52 | 61.72 | 187.92 | 191 | 108.4 |
| 20 | 59.42 | 103.27 | 110.83 | 64.72 | 187.96 | 191.4 | 114.4 |
| 30 | 61.16 | 111.67 | 118.92 | 66.93 | 187.91 | 192.16 | 102.3 |
| Drug | ∆h*/kJ·mol−1 | β/- | x/- | Reference |
|---|---|---|---|---|
| Carbamazepine | 275 | 0.57 | 0.44 | This work |
| Indomethacin | 308 | 0.53 | 0.32 | [34] |
| Nimesulide | 305 | 0.54 | 0.40 | [43] |
| Griseofulvin | 379 | 0.41 | 0.29 | [41] |
| nifedipine | 279 | 0.55 | 0.38 | [40] |
| q+/°C·min−1 | 0.1 | 0.2 | 0.5 | 1 | 2 | 3 | 5 | 7 | 10 | 20 |
|---|---|---|---|---|---|---|---|---|---|---|
| log(A1/s) | 16.68803 | 15.55479 | 13.99215 | 12.78519 | 10.64098 | 10.07923 | 8.59189 | 8.25742 | 7.74375 | 5.75816 |
| E1 | 174.74 | 166 | 153.9 | 144.55 | 126.1 | 120.4 | 106.56 | 102.8 | 94.4 | 77.15 |
| N1 | 1.51103 | 0.74778 | 0.77778 | 0.26916 | 0.15355 | 3.85 × 10⁻² | 1.02 × 10⁻² | 5.01 × 10⁻³ | 0.53381 | 0.93172 |
| M1 | 2.52 × 10⁻² | 2.32 × 10⁻⁴ | 1.01 × 10⁻⁴ | 6.21 × 10⁻⁵ | 5.89 × 10⁻⁵ | 5.31 × 10⁻⁵ | 0.10877 | 0.15823 | 0.33233 | 0.32967 |
| log(A2/s) | 16.12644 | 15.33341 | 14.11392 | 13.13384 | 11.00083 | 10.43413 | 8.85628 | 8.56524 | 7.72344 | 6.32128 |
| E2 | 174.74 | 166 | 153.9 | 144.55 | 126.1 | 120.4 | 106.56 | 102.8 | 94.4 | 77.15 |
| N2 | 0.20443 | 0.32288 | 0.48118 | 0.55288 | 0.54284 | 0.54883 | 0.4046 | 0.36066 | 0.31932 | 1.41584 |
| M2 | 0.46254 | 0.59597 | 0.64207 | 0.63111 | 0.61939 | 0.59092 | 0.55085 | 0.59061 | 0.65583 | 0.57754 |
| log(A3/s) | 24.40883 | 21.32904 | 18.44007 | 15.97648 | 15.453 | 13.99532 | 11.60053 | 9.17964 | 8.62322 | 3.92277 |
| E3 | 245.1 | 222 | 197.4 | 173.8 | 168.1 | 154.3 | 132.31 | 107.3 | 96.28 | 43.95 |
| N3 | 3.15329 | 1.77813 | 2.38565 | 2.24905 | 2.24681 | 1.9831 | 2.39261 | 1.98374 | 2.83091 | 5.36013 |
| M3 | 0.63821 | 0.61661 | 0.61352 | 0.69363 | 0.61634 | 0.64226 | 0.64775 | 0.59279 | 0.86141 | 0.67531 |
| log(A4/s) | 22.42912 | 19.74473 | 16.78756 | 14.30939 | 13.79004 | 12.41094 | 10.18802 | 7.8666 | 6.29772 | 1.96211 |
| E4 | 245.1 | 222 | 197.4 | 173.8 | 168.1 | 154.3 | 132.31 | 107.3 | 96.28 | 43.95 |
| N4 | 1.2522 | 0.82817 | 1.20213 | 1.11947 | 1.11085 | 1.0086 | 1.02698 | 1.1933 | 1.00453 | 0.95017 |
| M4 | 0.18135 | 0.13964 | 0.14512 | 0.14421 | 0.12459 | 9.14 × 10⁻² | 6.68 × 10⁻² | 2.37 × 10⁻² | 0.17295 | 0.54406 |
| wfol1 | 0.28799 | 0.27388 | 0.20953 | 0.2526 | 0.24408 | 0.18507 | 0.17136 | 0.18327 | 0.18492 | 0.15229 |
| wfol2 | 0.63209 | 0.61135 | 0.65112 | 0.60612 | 0.58186 | 0.56257 | 0.61504 | 0.46183 | 0.66541 | 0.71104 |
| wcom3 | −0.65184 | −0.26457 | −0.42554 | −0.34494 | −0.43478 | −0.7266 | −1.39134 | −1.40146 | −0.38187 | −3.00739 |
| wcom4 | 8.5935 | 9.73956 | 10.01935 | 9.58223 | 10.81768 | 10.80582 | 7.92621 | 8.90405 | 12.47581 | 3.24355 |
| m/% | −103.904 | −103.52 | −104.332 | −103.243 | −103.755 | −106.6 | −97.5805 | −108.022 | −104.85 | −104.349 |
Disclaimer/Publisher’s Note: The statements, opinions and data contained in all publications are solely those of the individual author(s) and contributor(s) and not of MDPI and/or the editor(s). MDPI and/or the editor(s) disclaim responsibility for any injury to people or property resulting from any ideas, methods, instructions or products referred to in the content. |
© 2025 by the authors. Licensee MDPI, Basel, Switzerland. This article is an open access article distributed under the terms and conditions of the Creative Commons Attribution (CC BY) license (https://creativecommons.org/licenses/by/4.0/).
Share and Cite
Svoboda, R.; Pospíšilová, A. Kinetics of Phase Transitions in Amorphous Carbamazepine: From Sub-Tg Structural Relaxation to High-Temperature Decomposition. Int. J. Mol. Sci. 2025, 26, 6136. https://doi.org/10.3390/ijms26136136
Svoboda R, Pospíšilová A. Kinetics of Phase Transitions in Amorphous Carbamazepine: From Sub-Tg Structural Relaxation to High-Temperature Decomposition. International Journal of Molecular Sciences. 2025; 26(13):6136. https://doi.org/10.3390/ijms26136136
Chicago/Turabian StyleSvoboda, Roman, and Adéla Pospíšilová. 2025. "Kinetics of Phase Transitions in Amorphous Carbamazepine: From Sub-Tg Structural Relaxation to High-Temperature Decomposition" International Journal of Molecular Sciences 26, no. 13: 6136. https://doi.org/10.3390/ijms26136136
APA StyleSvoboda, R., & Pospíšilová, A. (2025). Kinetics of Phase Transitions in Amorphous Carbamazepine: From Sub-Tg Structural Relaxation to High-Temperature Decomposition. International Journal of Molecular Sciences, 26(13), 6136. https://doi.org/10.3390/ijms26136136