Article

Analysis of the Expression Patterns of Tumor Necrosis Factor Alpha Signaling Pathways and Regulatory MicroRNAs in Astrocytic Tumors

by
Klaudia Skóra
1,2,*,
Damian Strojny
2,3,4,
Dawid Sobański
2,5,
Rafał Staszkiewicz
2,6,7,
Paweł Gogol
2,8,9,10,
Mateusz Miller
11 and
Beniamin Oskar Grabarek
2
1
Department of Neurological Rehabilitation, District Hospital of St. Padre Pio in Sędziszów Małopolski, 39-120 Sędziszów Małopolski, Poland
2
Collegium Medicum, WSB University, 41-300 Dąbrowa Górnicza, Poland
3
Department of Neurology, New Medical Techniques Specjalist Hospital of St. Family in Rudna Mała, 36-060 Rzeszow, Poland
4
Institute of Health Care, National Academy of Applied Sciences in Przemyśl, 37-700 Przemyśl, Poland
5
Department of Neurosurgery, St. Raphael Hospital, 30-693 Krakow, Poland
6
Department of Neurosurgery, 5th Military Clinical Hospital with the SP ZOZ Polyclinic in Krakow, 30-901 Krakow, Poland
7
Department of Neurosurgery, Faculty of Medicine in Zabrze, Academy of Silesia in Katowice, 40-555 Katowice, Poland
8
Department of Anesthesiology and Intensive Care, Our Lady of Perpetual Help Hospital in Wołomin, 05-200 Wołomin, Poland
9
Department of Trauma and Orthopedic Surgery, Our Lady of Perpetual Help Hospital in Wołomin, 05-200 Wołomin, Poland
10
Pain Treatment Clinic, Our Lady of Perpetual Help Hospital in Wołomin, 05-200 Wołomin, Poland
11
Department of Neurology, Independent Public Healthcare Institution of the Ministry of Internal Affairs and Administration in Rzeszów, 35-111 Rzeszów, Poland
*
Author to whom correspondence should be addressed.
Int. J. Mol. Sci. 2025, 26(12), 5892; https://doi.org/10.3390/ijms26125892
Submission received: 10 May 2025 / Revised: 12 June 2025 / Accepted: 19 June 2025 / Published: 19 June 2025

Abstract

Chronic inflammation is increasingly recognized as a driver of glioma progression, with tumor necrosis factor-alpha (TNF-α) playing a central role in modulating the tumor microenvironment. This study aimed to investigate the expression profiles and regulatory mechanisms of TNF-α and its downstream mediators—including interleukin-1 beta (IL-1β), Mitogen-Activated Protein Kinase Kinase Kinase 8 (MAP3K8), and Mitogen-activated protein kinase kinase 7 (MAP2K7)—in astrocytic tumors of varying malignancy. We conducted an integrative molecular analysis of 60 human astrocytic tumor samples (20 G2, 12 G3, 28 G4) using transcriptomic microarrays, Reverse Transcription Quantitative Polymerase Chain Reaction (RT-qPCR), Enzyme-Linked Immunosorbent Assay (ELISA), Western blotting, immunohistochemistry, methylation-specific PCR, and miRNA profiling. Prognostic associations were evaluated using Kaplan–Meier survival and Cox regression analyses. TNF-α, IL-1β, and MAP3K8 were significantly upregulated in high-grade tumors, with log2 fold changes ranging from 5.56 to 8.76 (p < 0.001). High expression of TNF-α (HR = 2.10, 95% CI: 1.27–3.46, p = 0.004), IL-1β (HR = 2.35, 95% CI: 1.45–3.82, p = 0.001), and MAP3K8 (Hazard Ratio; HR = 1.88, 95% confidence interval; 95% CI: 1.12–3.16, p = 0.015) was associated with poorer overall survival. miR-34a-3p and miR-30 family members, predicted to target TNF-α and IL-1β, were markedly downregulated in G3/G4 tumors (e.g., miR-30e-3p fold change: –3.78, p < 0.01). Promoter hypomethylation was observed in G3/G4 tumors, supporting epigenetic activation. Our findings establish a multi-layered regulatory mechanism of TNF-α signaling in astrocytic tumors. These data highlight the TNF-α/IL-1β/MAP3K8 axis as a critical driver of glioma aggressiveness and a potential therapeutic target.

1. Introduction

Inflammatory signaling pathways are increasingly recognized as key contributors to the pathogenesis and progression of astrocytic tumors [1,2]. Among the most prominent molecular drivers of glioma-associated inflammation is tumor necrosis factor-alpha (TNF-α) [3], a pleiotropic cytokine that modulates various cellular processes, including proliferation, survival, differentiation, and immune responses. TNF-α primarily exerts its biological effects through its interaction with two surface receptors—TNFR1 and TNFR2—activating downstream signaling cascades such as nuclear factor kappa-light-chain-enhancer of activated B cells (NF-κB), mitogen-activated protein kinase (MAPK), and c-Jun N-terminal kinase (JNK), which are often aberrantly regulated in high-grade gliomas [4,5,6,7].
Notably, TNF-α operates at the intersection of inflammation and tumor biology. While it can promote immune-mediated tumor clearance under certain conditions, sustained TNF-α activity is frequently associated with enhanced tumor cell migration, angiogenesis, resistance to apoptosis, and maintenance of glioma stem-like cells [8,9].
Closely associated with TNF-α signaling is interleukin-1 beta (IL-1β), another critical pro-inflammatory cytokine involved in shaping the glioma microenvironment. IL-1β promotes the expression of adhesion molecules, cytokines, and growth factors that support tumor expansion and infiltration into adjacent brain tissue. It also synergizes with TNF-α in activating NF-κB-mediated transcription of inflammatory genes, thereby reinforcing the tumor-promoting inflammatory milieu [10,11,12,13].
A growing body of evidence highlights the regulatory role of microRNAs (miRNAs) in modulating TNF-α and IL-1β signaling in astrocytic tumors. These small non-coding RNAs function as post-transcriptional regulators of gene expression and play critical roles in glioma development, progression, and immune evasion [14,15]. Several miRNAs have been shown to directly target transcripts encoding TNF-α, TNF receptors, and associated signaling mediators [16,17,18], suggesting that miRNA dysregulation may significantly influence inflammatory signaling and tumor dynamics.
The epigenetic landscape further contributes to the complexity of astrocytic tumor biology. DNA methylation profiling has emerged as a valuable adjunct to histopathological evaluation, offering improved accuracy in tumor classification and prognosis. The integration of molecular and epigenetic data with traditional diagnostic criteria has refined our understanding of glioma behavior. In certain cases, tumors lacking overt histological features of malignancy may be upgraded based on molecular abnormalities alone, underscoring the growing importance of comprehensive molecular diagnostics in neuro-oncology [19].
Astrocytic tumors, which originate from astrocytes—star-shaped glial cells—are among the most prevalent primary brain neoplasms. These tumors have traditionally been classified into four histopathological grades reflecting their biological aggressiveness and clinical outcomes [20,21,22]. Despite therapeutic advancements, prognosis remains poor. Patients with lower-grade gliomas (LGGs; WHO grades II and III) generally exhibit median survival of 5 to 10 years, whereas those with high-grade gliomas, particularly grade IV, face a substantially worse prognosis, with median survival often limited to 12–24 months [23]. Glioblastoma multiforme (GBM), the most aggressive and frequent grade IV astrocytic tumor, is characterized by rapid progression and resistance to standard therapies [24,25].
In recent years, a major paradigm shift has occurred in the classification of brain tumors, driven by the integration of molecular and genetic biomarkers. The 2016 WHO classification introduced molecularly informed diagnostic criteria for central nervous system tumors, which was further refined in the 2021 update. The latter emphasized genomic features over histology, distinguishing between molecularly defined grade IV astrocytomas and glioblastomas—entities previously considered indistinguishable [26]. This approach has led to the reclassification of some tumors traditionally diagnosed as grade III based on the presence of specific genetic alterations, reflecting a more biologically meaningful stratification [27,28,29].
Prognostic evaluation and treatment decision-making in astrocytic tumors are increasingly driven by molecular biomarkers [30]. Key biomarkers include mutations in isocitrate dehydrogenase genes (IDH1/IDH2), methylation of the O6-methylguanine-DNA methyltransferase (MGMT) promoter, co-deletion of chromosomal arms 1p/19q, and amplification of the epidermal growth factor receptor (EGFR). IDH mutations, in particular, serve as powerful prognostic indicators, conferring significantly improved survival across glioma grades. For example, median survival among patients with IDH-mutant grade IV astrocytomas can reach approximately 31 months, compared to only 15 months in those with IDH wild-type tumors [31,32,33].
Therefore, the aim of this study was to evaluate variations in the expression patterns of TNF-α-related inflammatory mediators and their regulatory microRNAs in astrocytic tumors of varying malignancy grades.

2. Results

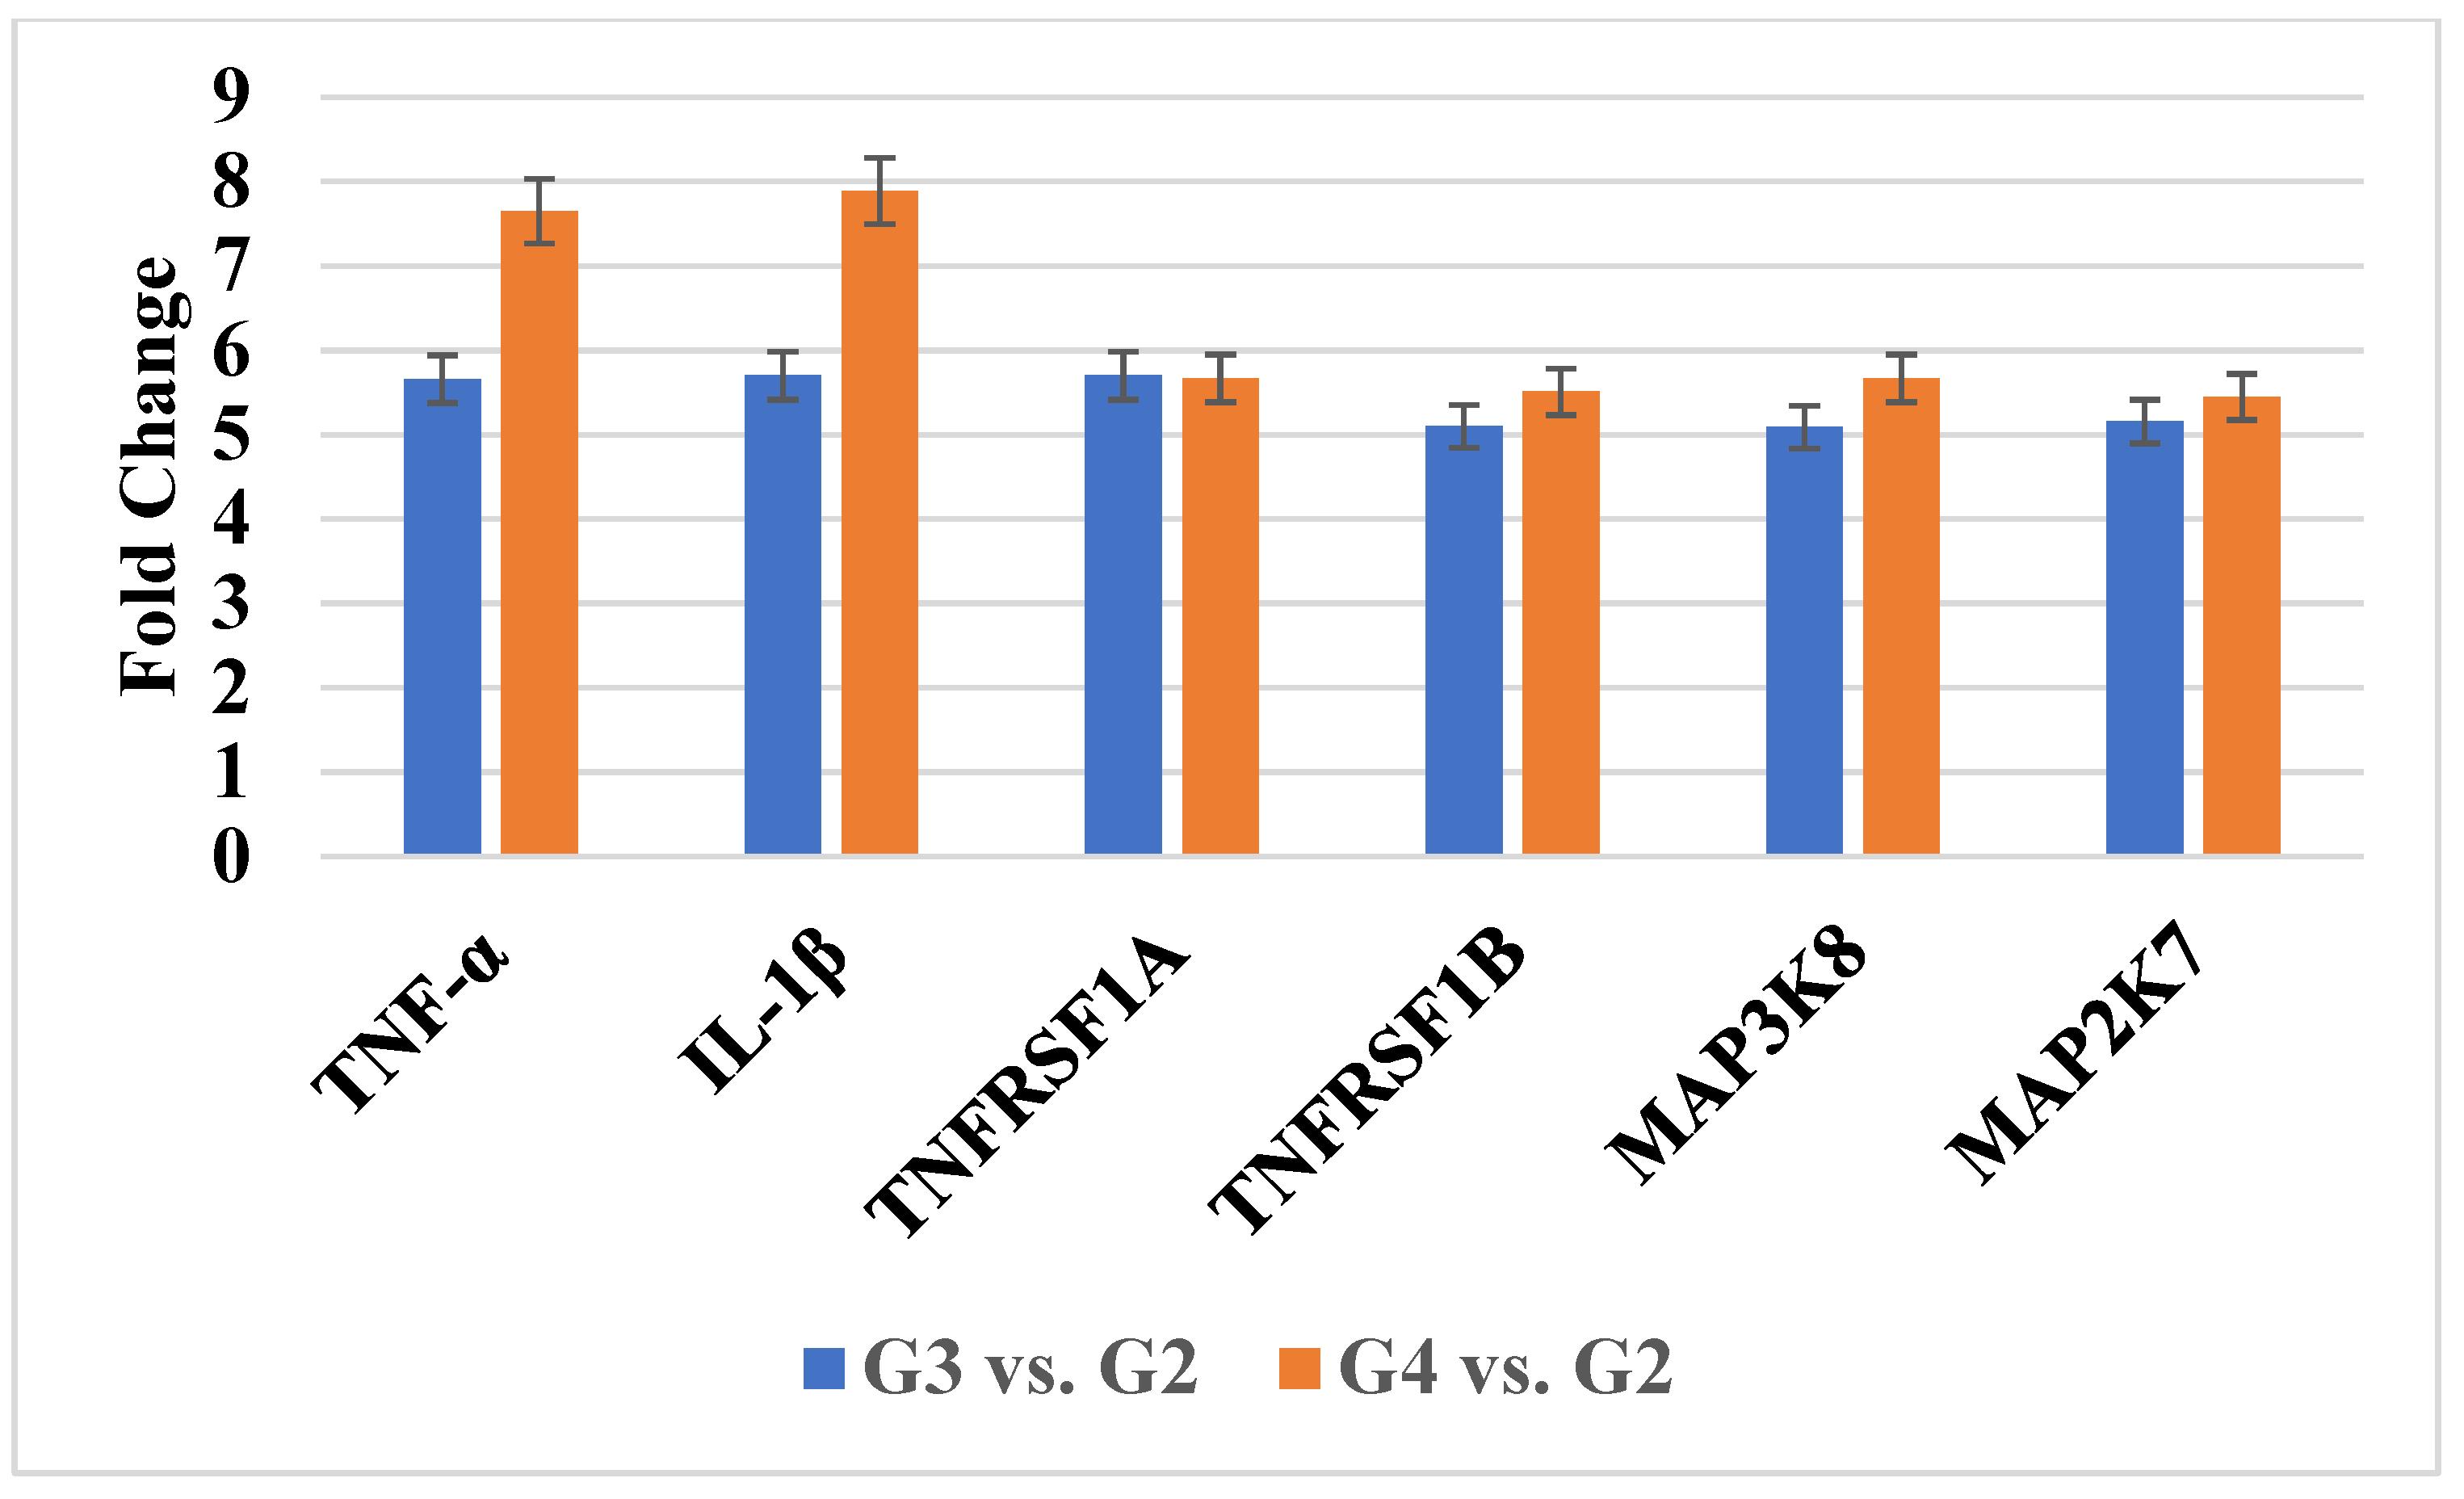
2.1. Transcriptomic Profiling of TNF-α Pathway Genes

Out of 119 genes associated with TNF-α-dependent signaling, one-way ANOVA revealed that six genes were significantly differentially expressed (fold change > 5.0 or <–5.0; p < 0.05) in G3 and G4 astrocytic tumors relative to G2. TNF-α and IL-1β were upregulated consistently across both high-grade groups. Additional genes, including TNFRSF1A, TNFRSF1B, MAP3K8, and MAP2K7, also demonstrated increased expression (p < 0.05). These results suggest progressive activation of inflammatory signaling in higher-grade tumors. Table 1 summarizes the fold changes, while Figure 1 shows RT-qPCR validation.

2.2. miRNA-Mediated Regulation of TNF-α Pathway Genes

We next assessed the differential expression of miRNAs predicted to regulate TNF-α signaling components. Downregulation of hsa-miR-34a-3p, a predicted regulator of TNF-α, and members of the miR-30 family targeting IL-1β, was observed in G3/G4 compared to G2. Conversely, hsa-miR-106b-5p and hsa-miR-27b-3p, targeting MAP3K8 and MAP2K7, respectively, were upregulated, despite elevated mRNA levels of their targets. No miRNA regulators were predicted for TNFRSF1A or TNFRSF1B.
These findings are detailed in Table 2.

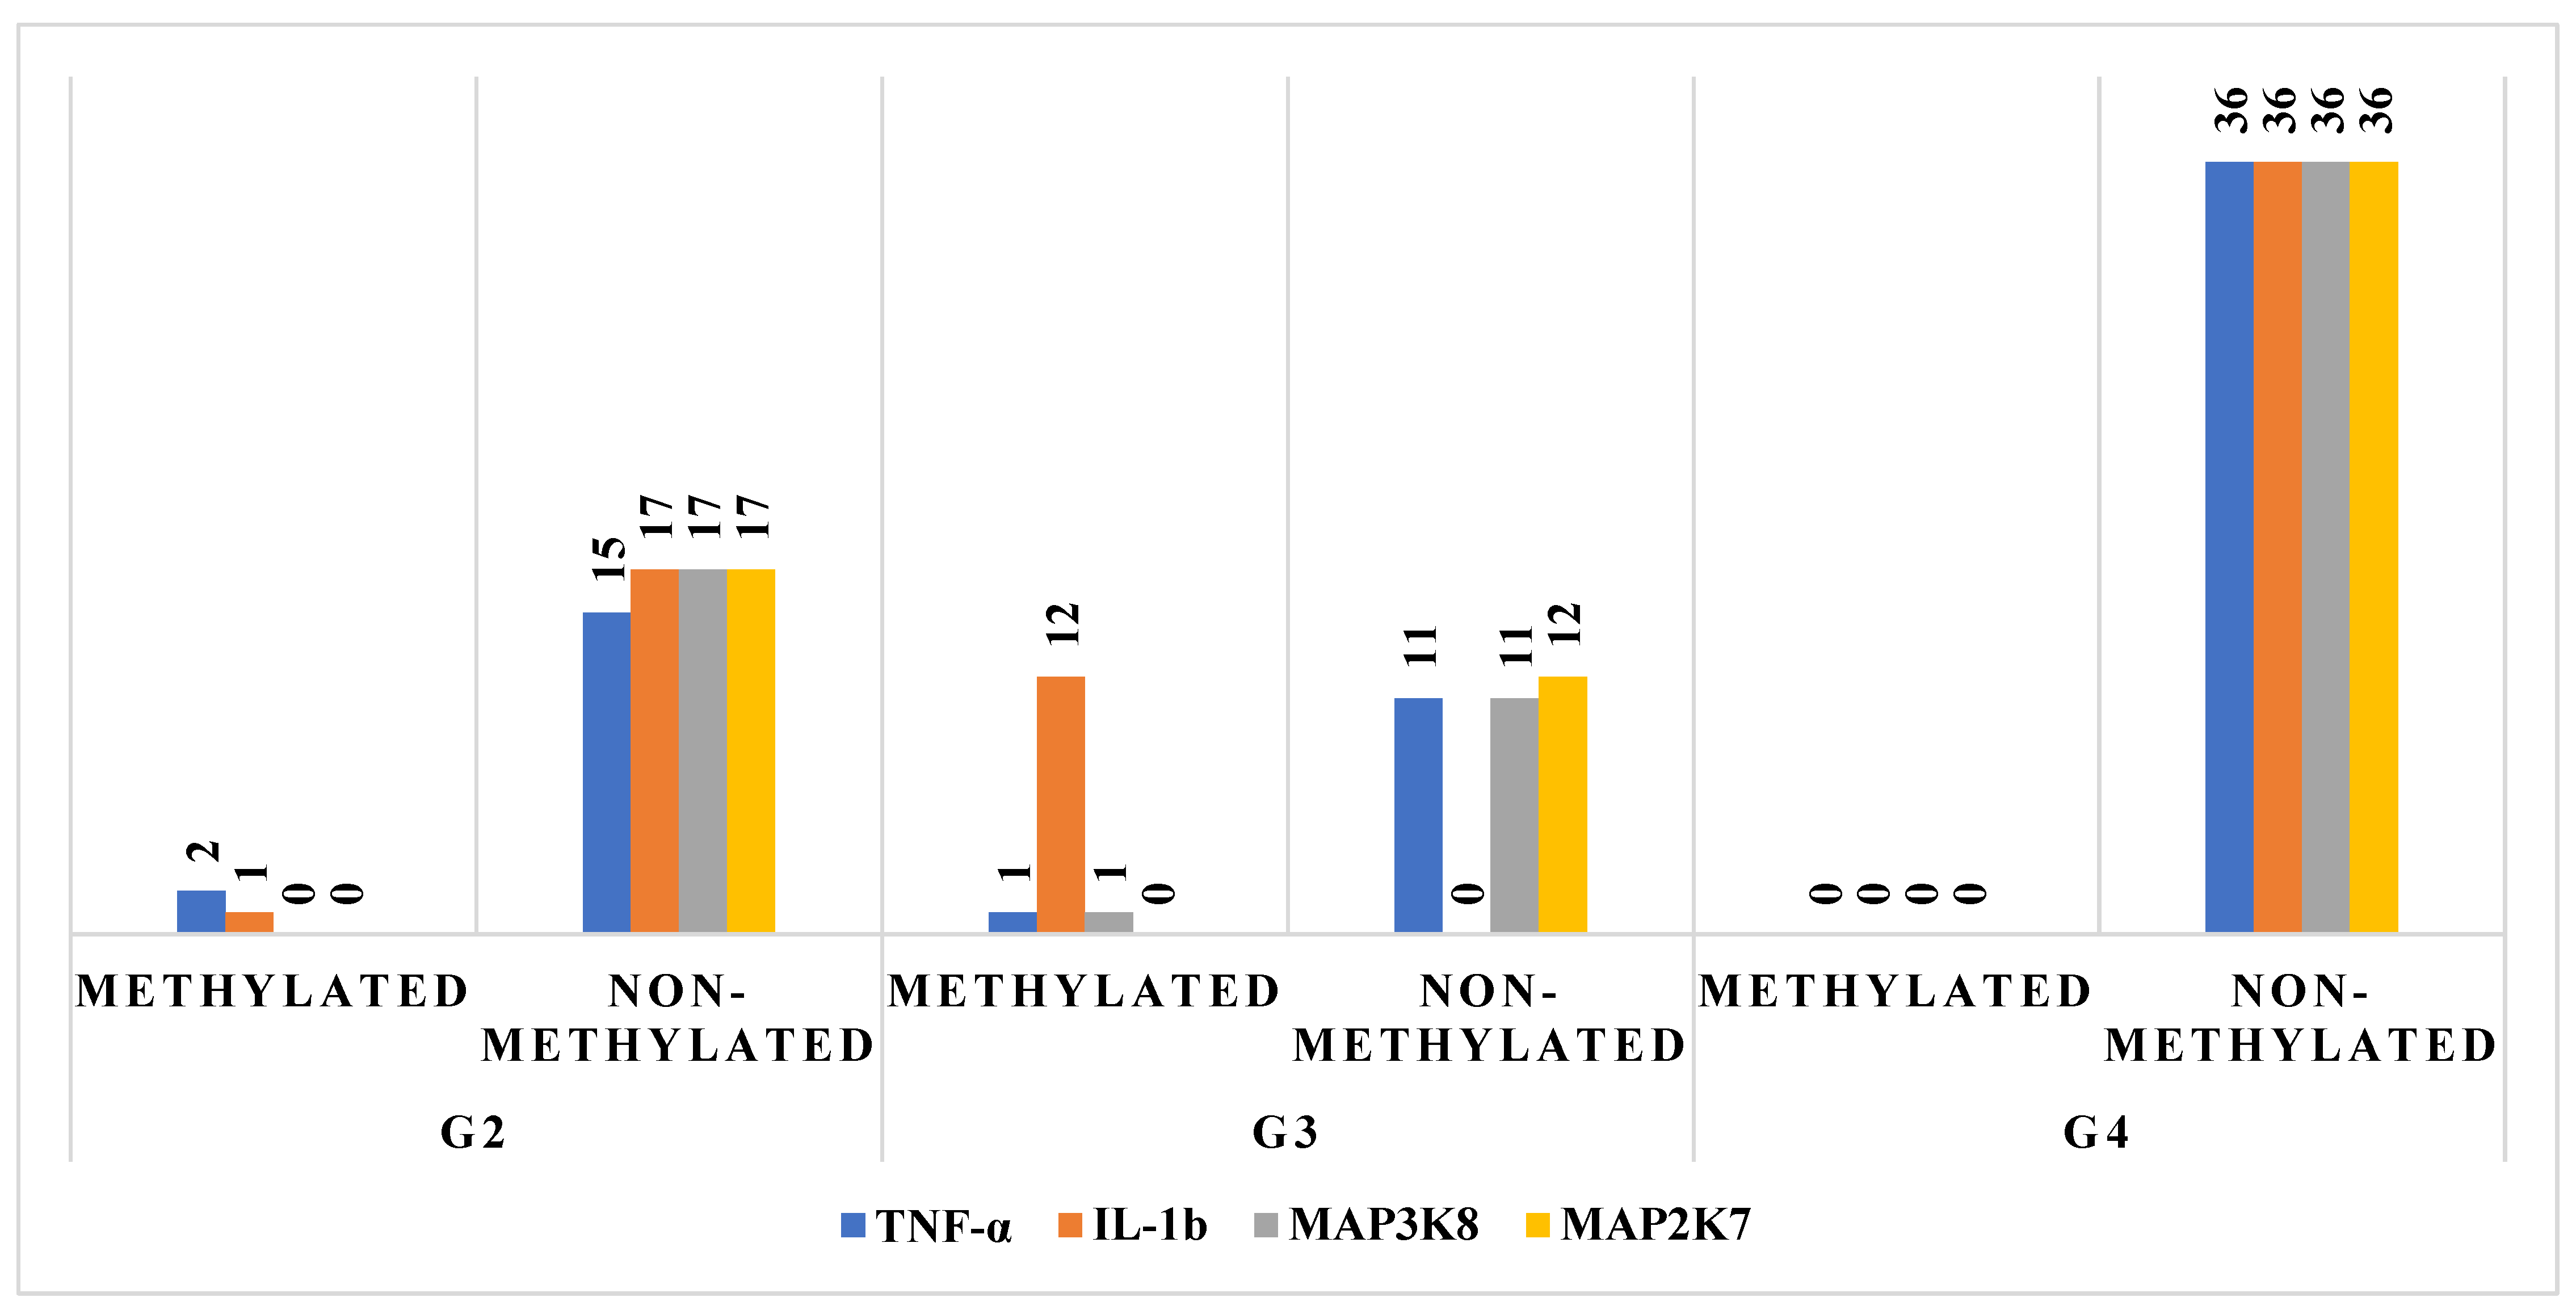
2.3. Methylation Status of TNF-α Pathway Components

To investigate potential epigenetic regulation of inflammatory mediators, we analyzed the promoter methylation status of TNF-α, IL-1β, MAP3K8, and MAP2K7 in astrocytic tumors across different malignancy grades. A clear inverse relationship was observed between promoter methylation and gene expression levels.
In G2 tumors, the majority of cases exhibiting high mRNA expression corresponded to non-methylated promoter regions (15–17 cases per gene), while methylated samples generally showed little or no detectable expression. In G3 tumors, this trend became more variable. IL-1β expression, in particular, was observed in a substantial proportion of methylated cases (n = 12), whereas TNF-α, MAP3K8, and MAP2K7 remained primarily expressed in non-methylated samples (11–12 cases). These findings suggest potential gene-specific differences in methylation sensitivity or partial epigenetic silencing in intermediate-grade tumors.
In G4 astrocytomas, a more definitive pattern emerged: expression of all four genes was entirely absent in methylated samples, while all non-methylated cases (n = 36) displayed consistent and robust gene expression. This striking dichotomy underscores the functional impact of promoter methylation in advanced tumors and reinforces the notion that epigenetic silencing may contribute to the transcriptional inactivation of key inflammatory mediators in a grade-dependent manner.
Collectively, these observations support the hypothesis that DNA methylation status plays a significant regulatory role in the expression of TNF-α signaling components during glioma progression. Detailed methylation-expression concordance is illustrated in Figure 2.

2.4. Protein Quantification by ELISA

To validate gene-level findings at the protein level, we performed ELISA assays. (Table 3). NF-α and IL-1β levels were significantly increased in G3 and G4 compared to G2 (p < 0.05). MAP3K8 protein concentration was similarly elevated, while MAP2K7 showed no significant change. TNFRSF1A and TNFRSF1B trended higher in advanced tumors but did not reach statistical significance.
These results are presented in Table 3.

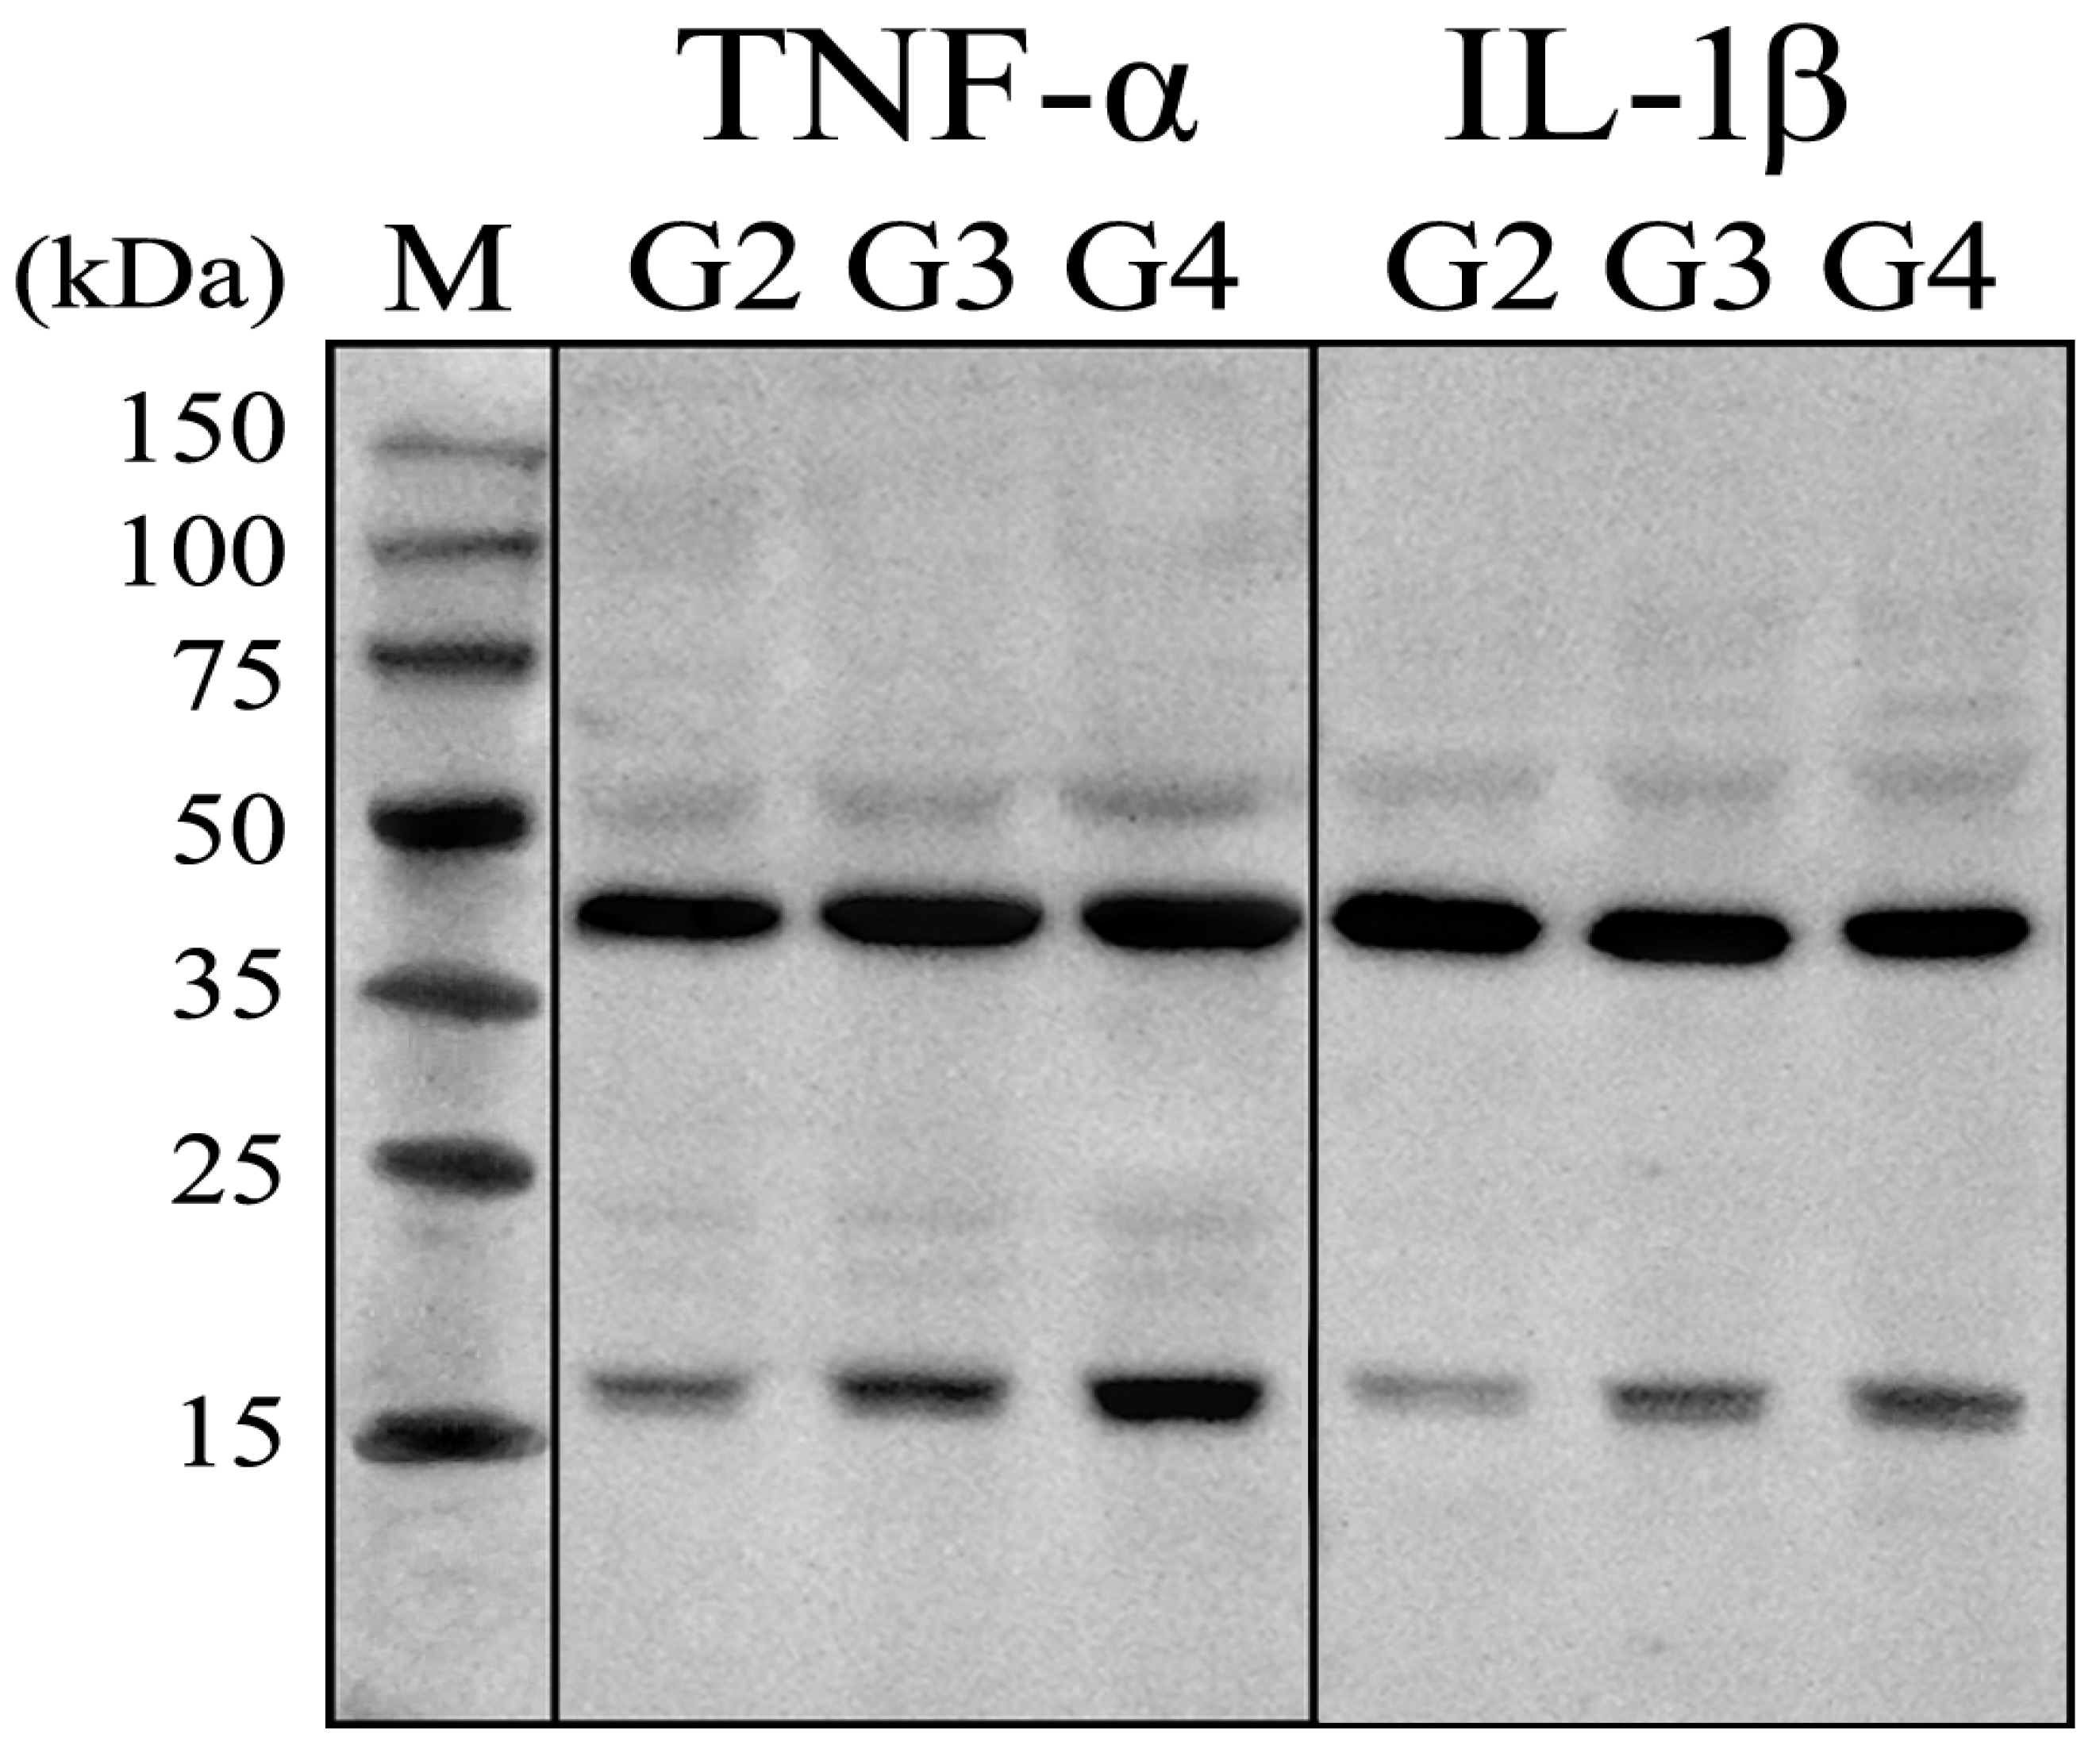
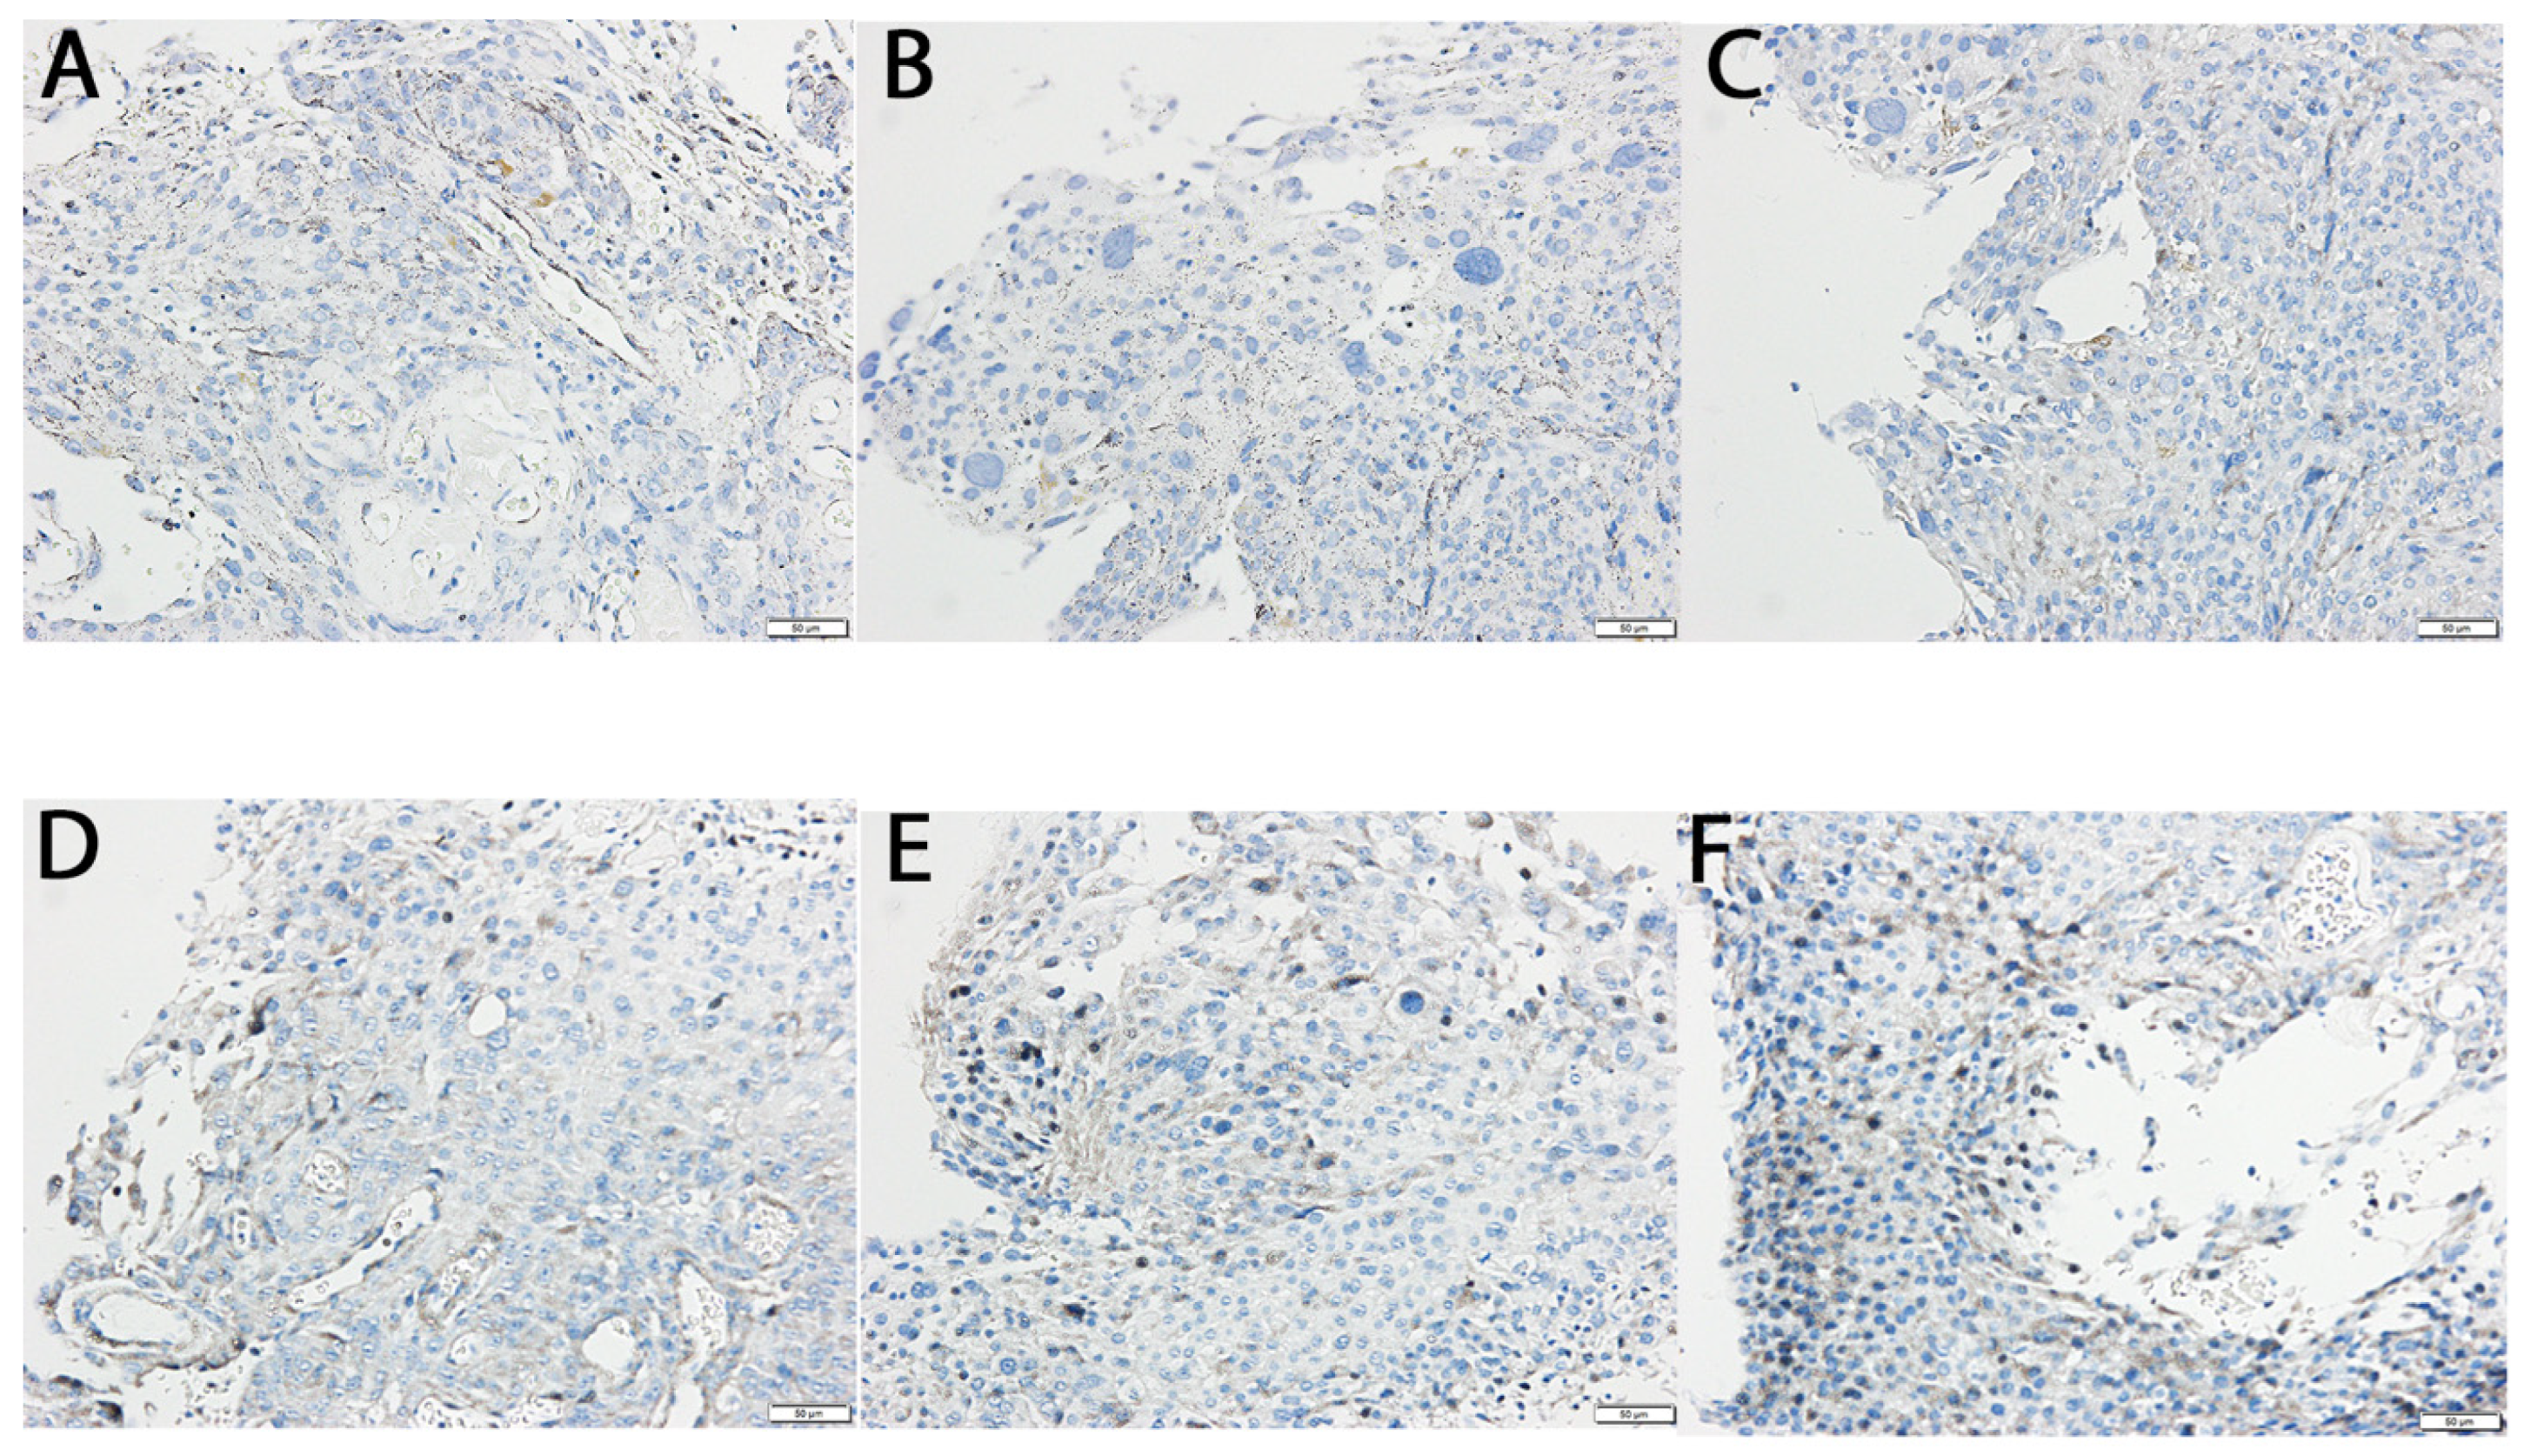
2.5. Protein Expression Validation by Western Blot and Immunohistochemistry

To further validate our transcriptomic findings, we assessed the protein expression levels of TNF-α and IL-1β—two cytokines that showed statistically significant differences in gene expression—using Western blot and immunohistochemistry (IHC) in tumor tissue samples.
Figure 3 presents a representative Western blot image, demonstrating the specificity of the antibody-based detection and the integrity of the samples, as evidenced by consistent expression of the housekeeping protein ACTB (β-actin, 42 kDa). Quantitative analysis of the normalized optical density (OD) for TNF-α (17 kDa), relative to ACTB, revealed significantly elevated expression in G3 samples (1.09 ± 0.23), compared to G2 (0.14 ± 0.07, p < 0.05) and G4 (1.97 ± 0.54, p < 0.05).
Similarly, IL-1β expression was significantly increased in G3 samples (0.48 ± 0.12) compared to both G2 (0.25 ± 0.12, p < 0.05) and G4 (0.73 ± 0.18, p < 0.05).
In turn, the optical density of the reaction product for TNF-α in G3 tumor samples reached 128.02 ± 5.67% relative to G2 (p < 0.05), while in G4 samples, it increased to 171.43 ± 10.18% of G2 (p < 0.05). Similarly, the optical density of the reaction product for IL-1β in G3 samples was 251.79 ± 20.11% compared to G2 (p < 0.05), whereas in G4 samples, it further increased to 316.96 ± 21.65% of G2 (p < 0.05). Figure 4 illustrates immunohistochemical staining for TNF-α and IL-1β.

2.6. Functional Network Analysis of Selected Proteins: Insights from Protein–Protein Interaction (PPI) Analysis

STRING database analysis revealed that the six studied proteins form a tightly connected interaction network (6 nodes, 11 edges; PPI enrichment p = 4.48 × 10⁻⁵), suggesting functional convergence. MAP3K8 was centrally positioned, highlighting its coordinating role in TNF-α-related signaling cascades. Figure 5 shows the STRING-based network.

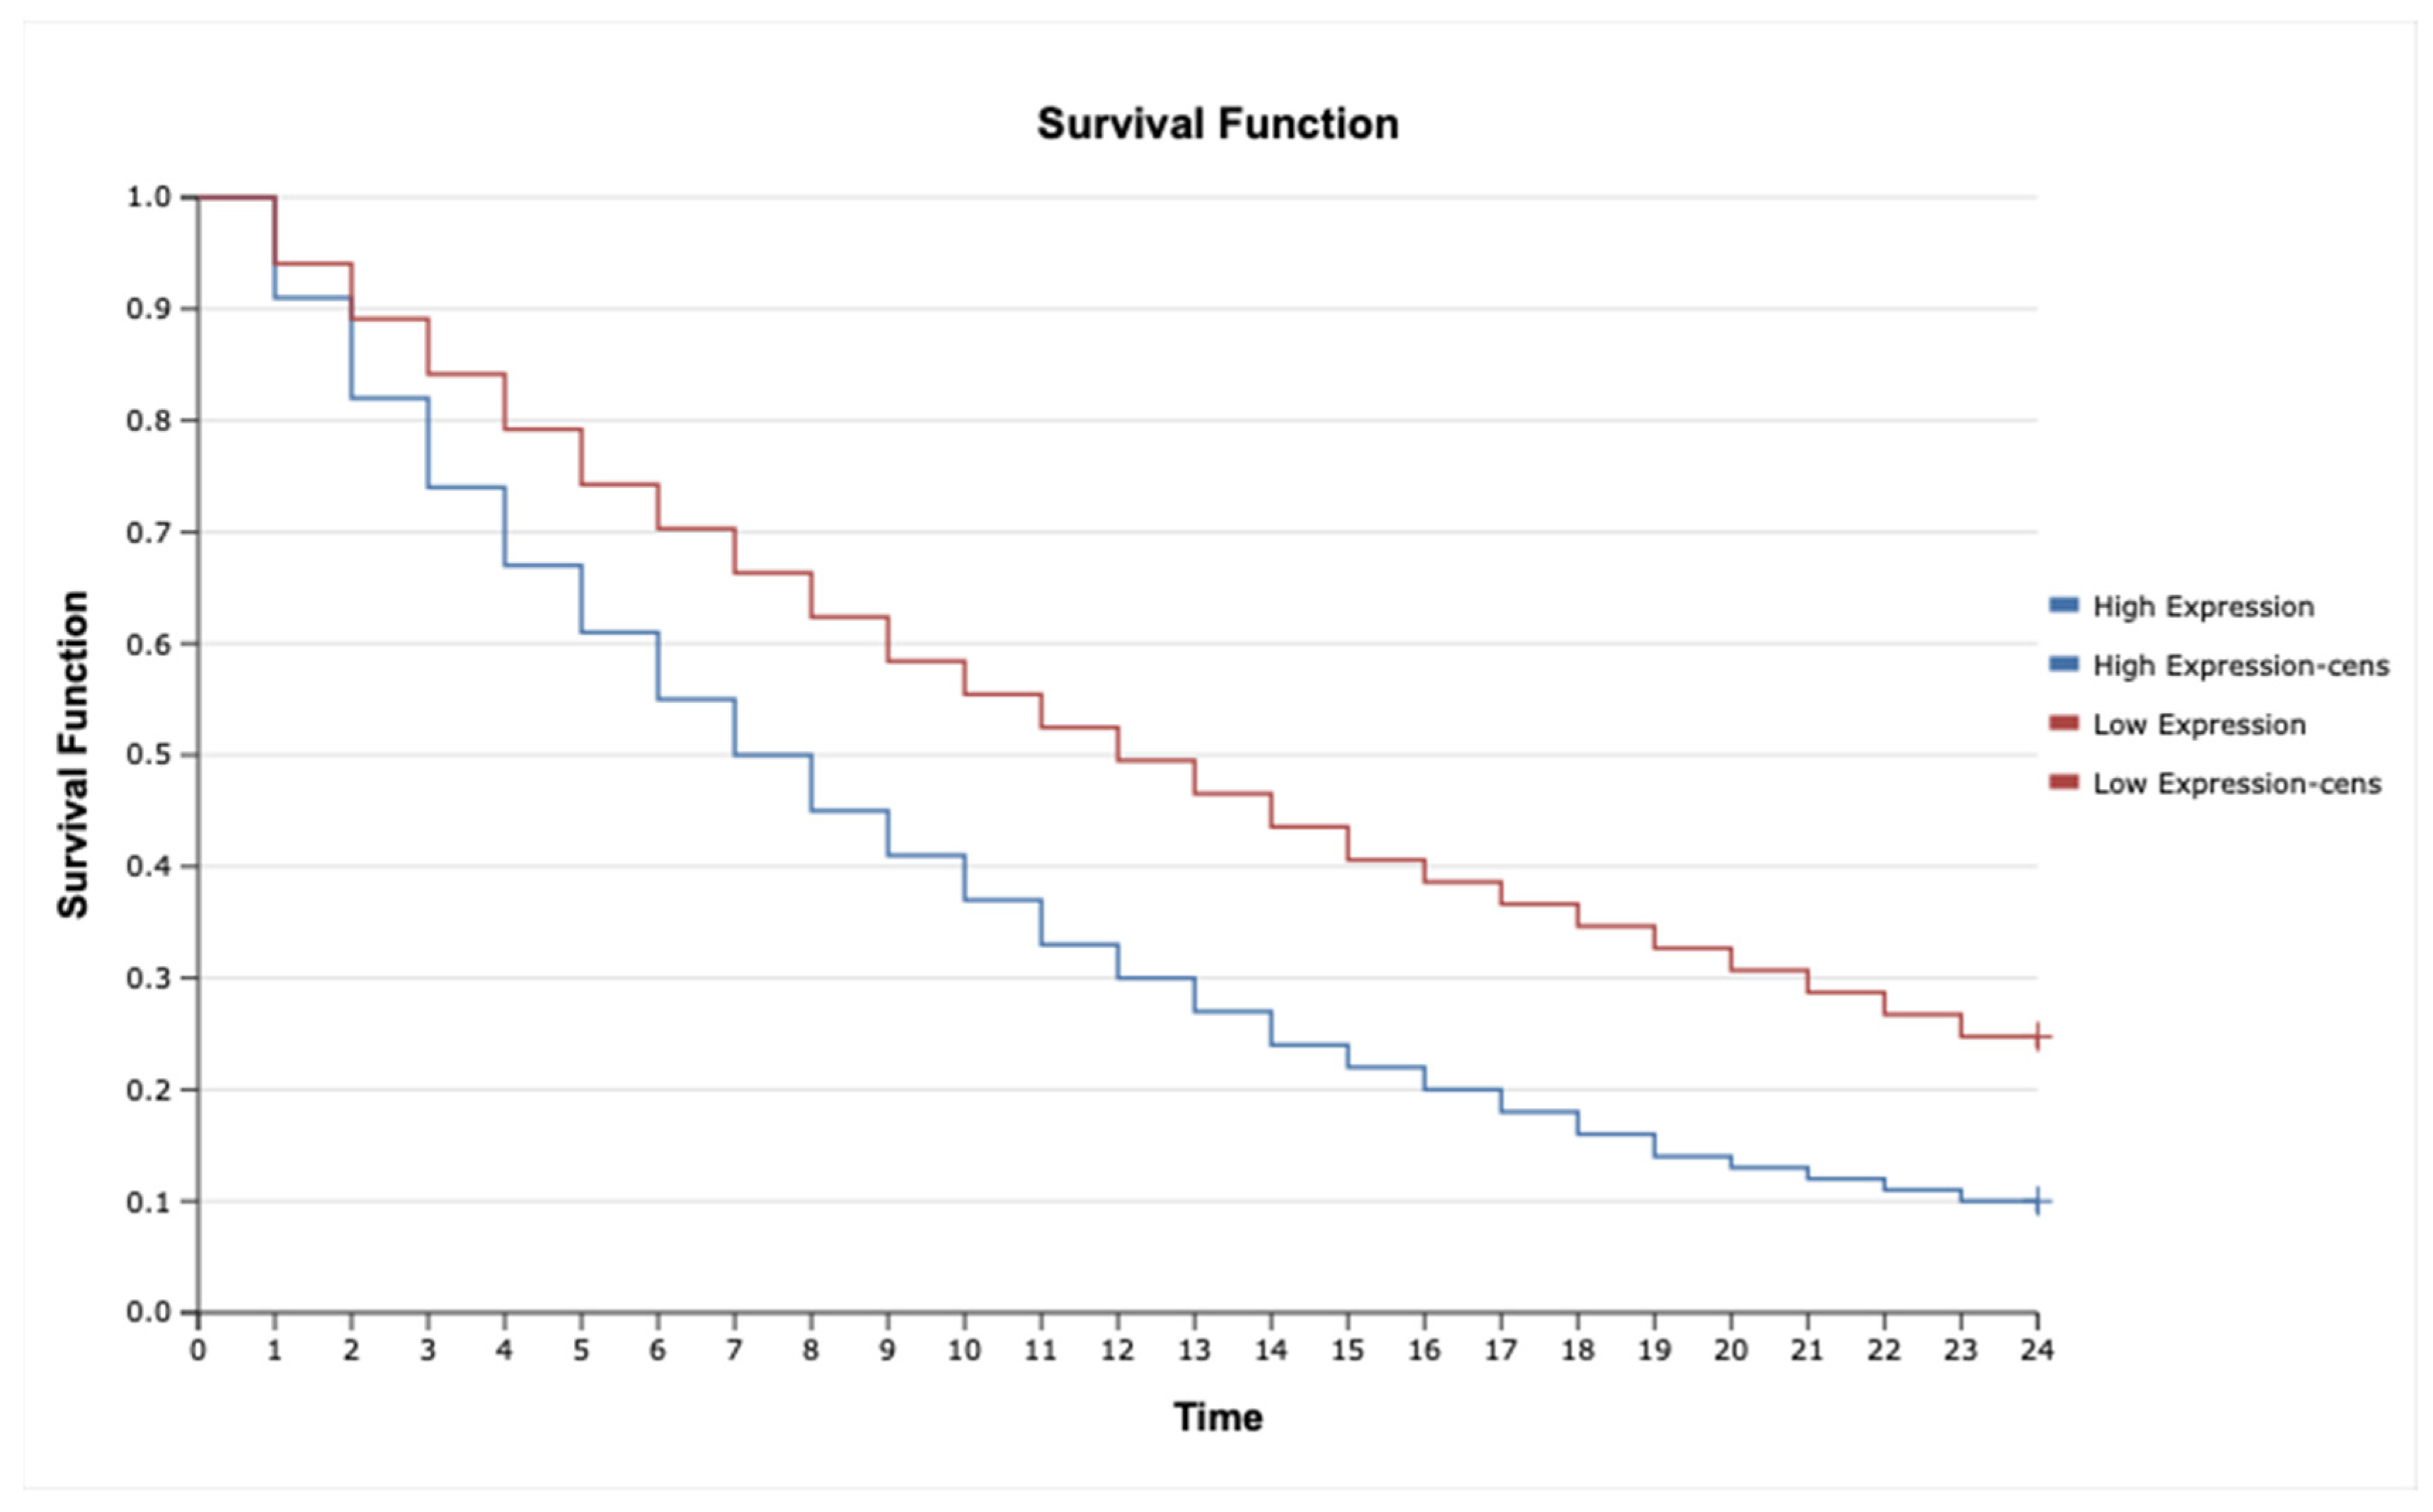
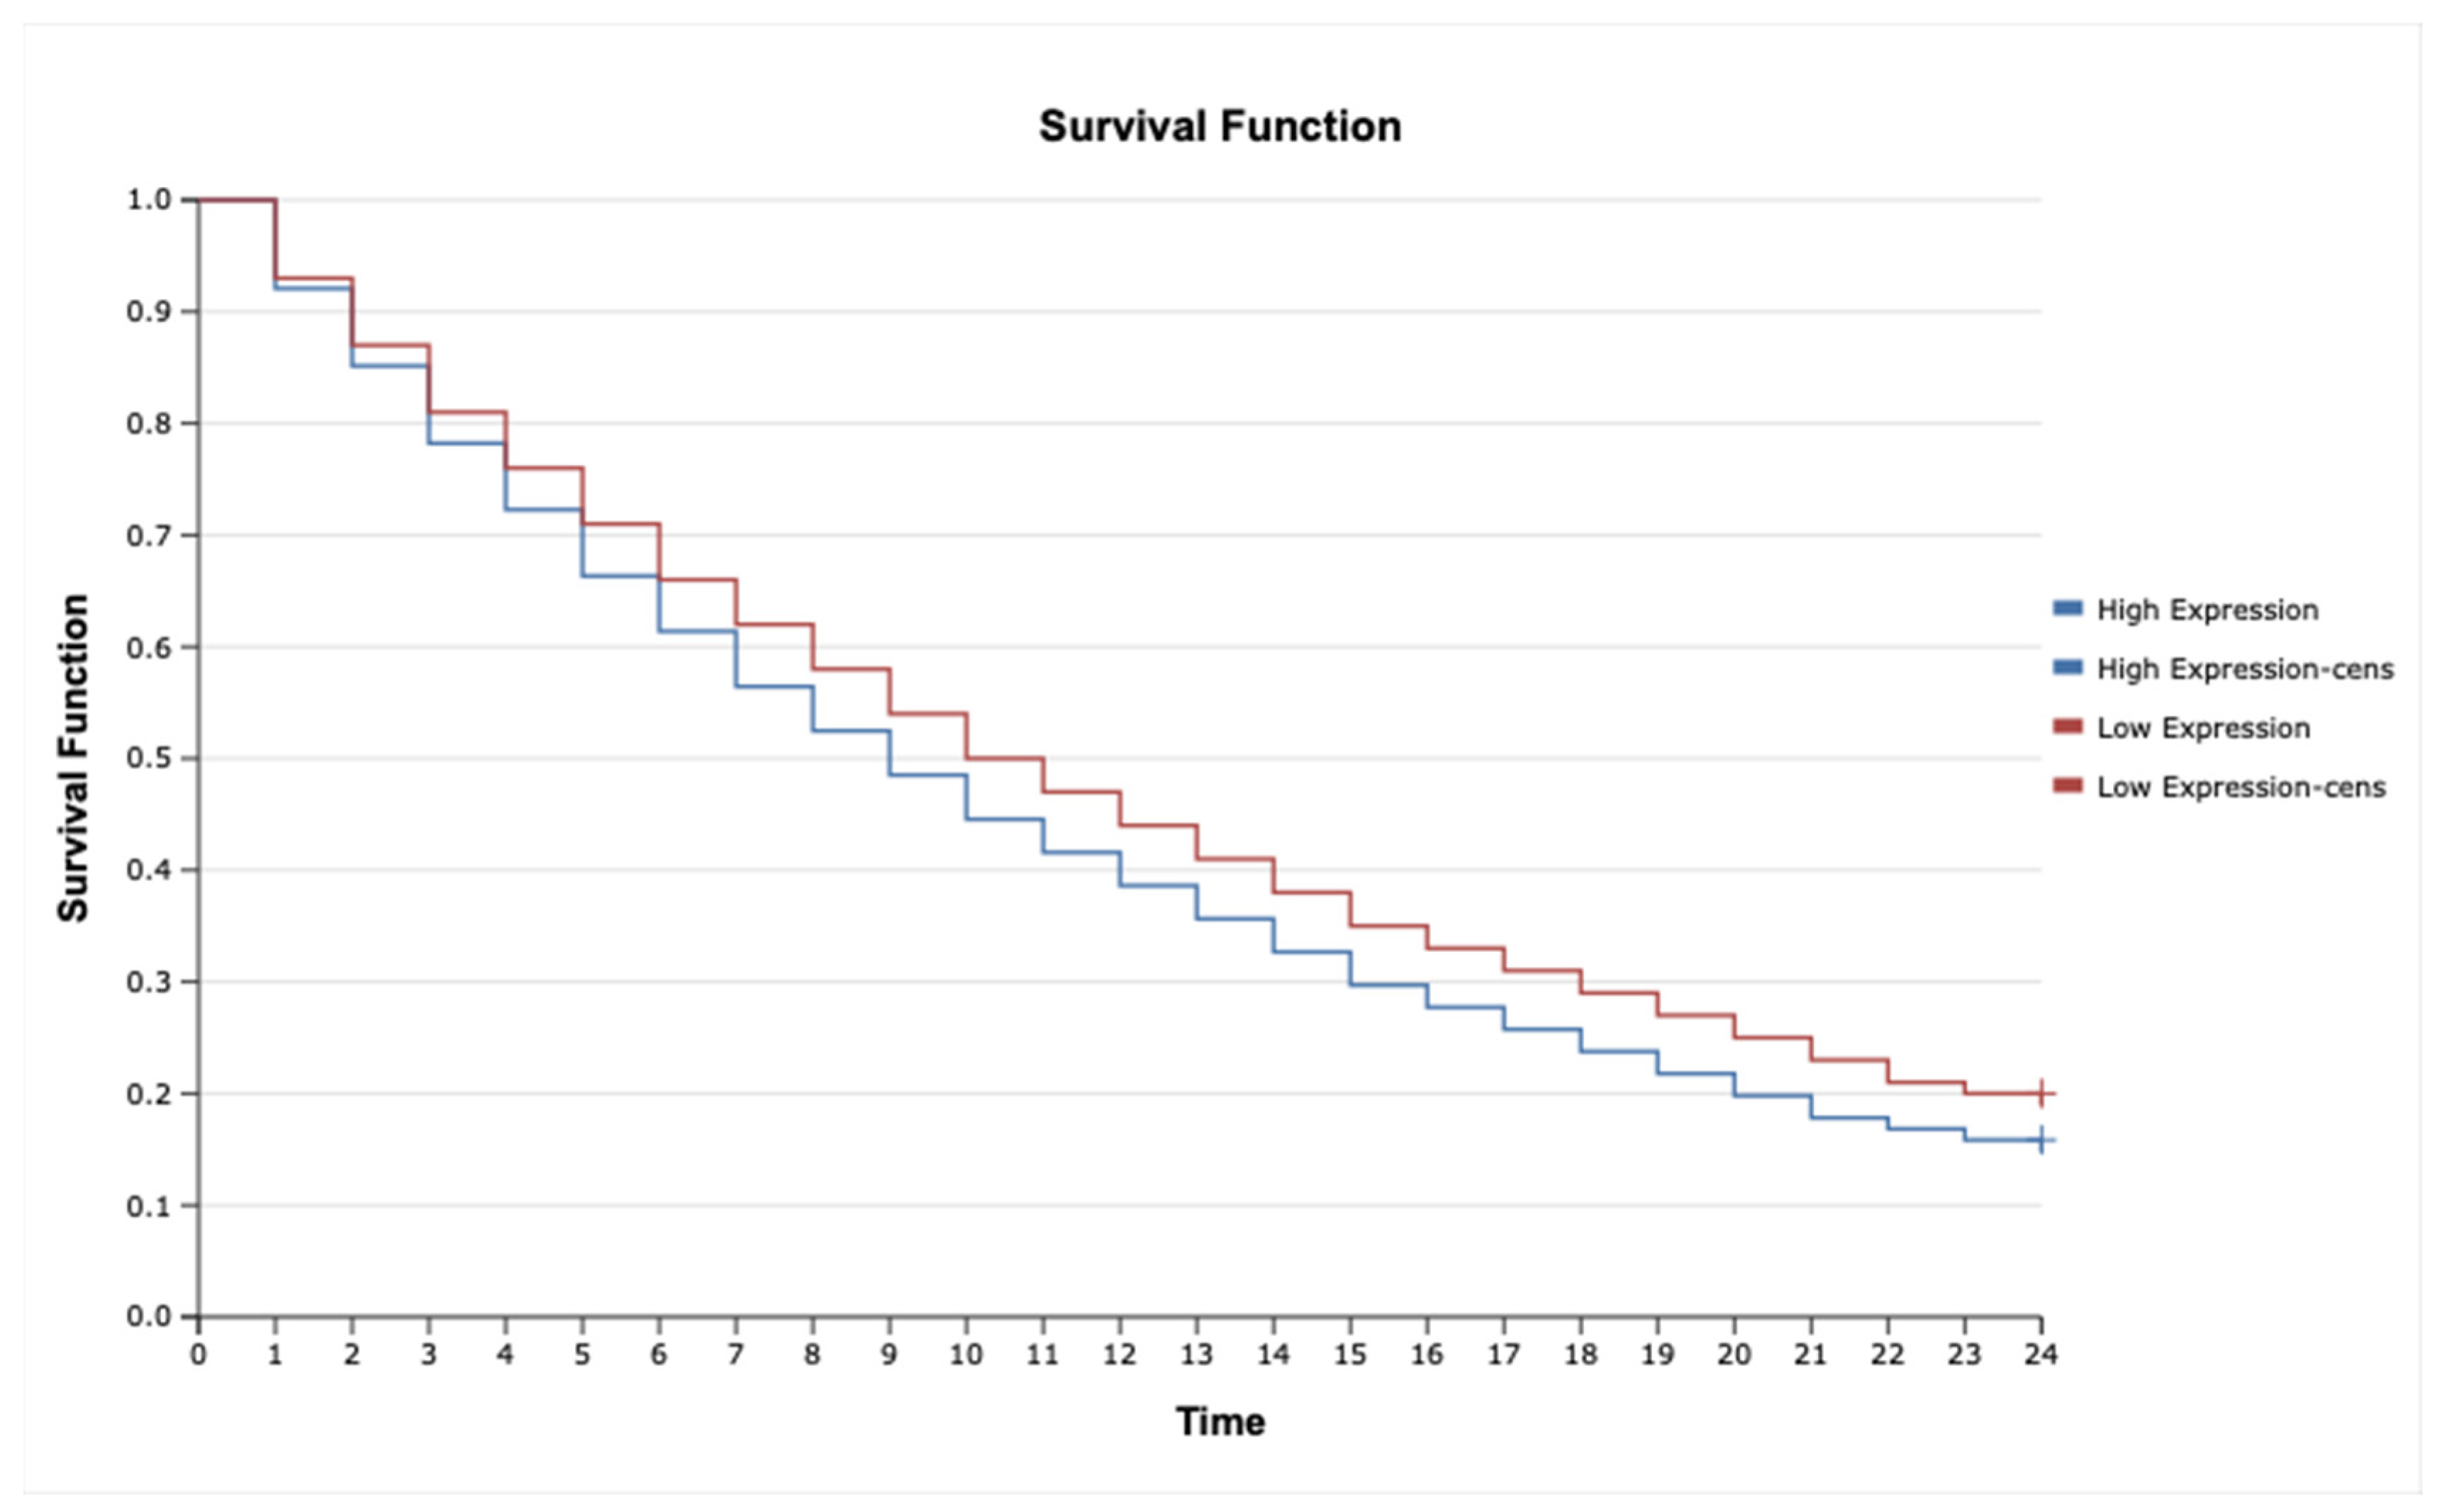
2.7. Kaplan–Meier Survival Analysis and Cox Proportional Hazards Model for TNF-α, IL-1β, TNFRSF1A, TNFRSF1B, MAP3K8, and MAP2K7 in Astrocytic Tumors

The analysis revealed that high expression of IL-1β (Figure 6; HR = 2.35, 95% CI: 1.45–3.82, p = 0.001), MAP3K8 (Figure 7; HR = 1.88, 95% CI: 1.12–3.16, p = 0.015), and TNF-α (Figure 8; HR = 2.10, 95% CI: 1.27–3.46, p = 0.004) was significantly associated with poorer overall survival. These findings suggest that upregulation of these inflammatory markers may reflect enhanced disease aggressiveness or progression. In contrast, expression levels of MAP2K7 (Figure 9; HR = 1.05, 95% CI: 0.72–1.52, p = 0.36), TNFRSF1A (Figure 10; HR = 1.22, 95% CI: 0.81–1.84, p = 0.29), and TNFRSF1B (Figure 11; HR = 1.18, 95% CI: 0.79–1.76, p = 0.33) did not show significant differences in survival between high- and low-expression groups, indicating a limited prognostic utility in this clinical context.

3. Discussion

This study provides an integrative, multi-omic evaluation of TNF-α signaling in astrocytic tumors, revealing significant correlations between pathway activation, molecular regulation, and clinical outcome [34,35,36]. Through comprehensive analysis-including RT-qPCR, ELISA, immunohistochemistry, methylation profiling, miRNA expression, and survival analysis, we demonstrate that TNF-α, IL-1 β, and MAP3K8 are not only upregulated in high-grade astrocytomas but also independently predict worse overall survival. These findings reinforce the concept that chronic inflammation, particularly TNF-α-driven, is a key driver of glioma aggressiveness [11,37,38,39].
Chronic inflammation represents a hallmark of GBM, contributing substantially to its pathogenesis and resistance to therapy [40,41]. This proinflammatory state supports immune evasion by GBM cells, fostering immune tolerance and undermining the efficacy of both conventional and targeted treatments [42,43]. The inflammatory microenvironment of GBM is primarily shaped by tumor cells and glioma-associated microglia/macrophages (GAMs), which synergistically promote tumor progression, invasion, and recurrence [44,45]. In addition, GBM cells interact with components of the tumor stroma—including the extracellular matrix, astrocytes, pericytes, and endothelial cells—to secrete a diverse array of cytokines and chemokines. These mediators drive the recruitment and polarization of GAMs [46], creating a self-reinforcing inflammatory loop that exacerbates disease progression and therapeutic resistance.
Our data highlight the TNF-α, IL-1β axis as a critical mediator of glioma progression. Elevated protein and transcript levels of both cytokines in G3 and G4 tumors, coupled with their association with poor survival, are consistent with their established roles in sustaining a tumor-permissive microenvironment [47,48]. TNF-α is a pleiotropic cytokine that, while capable of inducing apoptosis under certain conditions, predominantly fosters tumor survival and immune evasion in the glioma context through NF-kB, MAPK, and JNK signaling [49,50]. IL-1β synergizes with TNF-α to amplify pro-inflammatory gene expression, promote angiogenesis, and remodel the extracellular matrix [51,52,53]. The prognostic value of MAP3K8 (TPL2) further supports this mechanistic axis. MAP3K8 acts as a convergence node for TNF-α and Toll-like receptor (TLR) signaling, triggering ERK and JNK cascades [54,55,56,57], both of which are implicated in glioblastoma stemness, invasion, and resistance to therapy [58,59,60,61]. Notably, while MAP3K8 was significantly elevated and prognostically relevant, MAP2K7, though upregulated, was not associated with survival outcomes-suggesting divergent functional relevance despite shared pathway affiliation [62]. These differences may reflect context-dependent pathway crosstalk, post-translational modifications, or alternative splicing events that modulate kinase function [63,64].
The study further elucidates post-transcriptional regulation via miRNAs. The downregulation of hsa-miR-34a-3p and miR-30e-5p, a known tumor suppressor [65,66,67] targeting TNF-α, aligns with the observed increase in TNF-α expression in higher-grade tumors. Similarly, members of the miR-30 family, particularly miR-30e-3p, which are predicted to target IL-1β, were markedly suppressed in G3/G4 tumors. These findings support a model wherein miRNA silencing of cytokines is progressively lost during malignant transformation, contributing to unchecked inflammatory signaling [68,69].
Conversely, miR-106b-5p and miR-27b-3p, predicted to regulate MAP3K8 and MAP2K7, were paradoxically upregulated despite increased mRNA and protein levels of their targets. This suggests non-canonical regulation or the presence of miRNA sponging mechanisms, such as competing endogenous RNAs (ceRNAs), circular RNAs, or long non-coding RNAs that sequester miRNAs [70,71,72]. These mechanisms remain underexplored in gliomas and represent a potential gap in our understanding of miRNA-mediated regulation.
The epigenetic data add a further layer of complexity. Our MS PCR analysis showed that promoter methylation suppressed gene expression across the examined cytokines and kinases, particularly in lower-grade tumors. In contrast, high-grade gliomas exhibited hypomethylation and strong gene expression, consistent with the broader observation of global hypomethylation and locus-specific hypermethylation in malignant gliomas. Interestingly, IL-1β maintained expression even in methylated G3 samples, indicating potential methylation-independent activation, possibly via enhancer remodeling or inflammatory stimulus-induced transcription [73,74,75,76].
The identification of TNF-α and MAP3K8 as independent predictors of poor prognosis has significant translational potential. Targeting TNF-α signaling in gliomas has been challenging due to its dual role in tumor biology and host immunity [50,77,78]. However, selective inhibitors of MAP3K8, which acts downstream of multiple inflammatory inputs, may provide a more precise intervention point. Importantly, MAP3K8 inhibitors have shown promise in preclinical models of inflammatory diseases and hematologic malignancies, but their application in gliomas remains untested [79,80,81]. Our results suggest that a subset of patients with high MAP3K8 expression could benefit from such approaches [62].
Moreover, integrating miRNA and methylation profiles with standard diagnostic workflows may enhance the molecular stratification of astrocytic tumors, allowing for more personalized prognostication and treatment. For example, downregulation of miR-34a or miR-30e-3p could be explored as biomarkers for cytokine-driven gliomas, while methylation signatures may guide epigenetic therapy approaches [82,83,84].
Despite these strengths, several limitations merit discussion. First, while our study included a well-characterized cohort, the sample size was moderate, potentially limiting statistical power—particularly for subgroup analyses and survival modeling. Second, although we observed robust correlations between gene expression and clinical outcomes, the relationships remain inherently associative. Causal links, particularly between MAP3K8, miRNA regulation, and glioma progression, require functional validation in cell-based and in vivo models. Approaches such as CRISPR/Cas9-mediated gene knockouts, cytokine inhibition assays, or promoter-reporter luciferase assays would greatly strengthen mechanistic interpretations. Third, the methylation analysis was limited to selected CpG regions; genome-wide methylation profiling could uncover additional regulatory elements or enhancer interactions affecting transcriptional activity.
Additionally, the use of bulk tumor tissue represents an important constraint, as it prevents discrimination between tumor-intrinsic gene expression and signals derived from non-neoplastic cells in the microenvironment. Given the centrality of inflammation in gliomagenesis, distinguishing the contributions of glioma cells from those of infiltrating immune cells (e.g., microglia, macrophages) is particularly critical. Future studies employing single-cell RNA sequencing or spatial transcriptomic technologies will be essential for resolving cell-type–specific signaling networks and dissecting the inflammatory ecosystem of astrocytic tumors.
Finally, it should be noted that the use of glyceraldehyde-3-phosphate dehydrogenase (GAPDH) and beta actin (ACTB) as internal controls for Western blot normalization, while conventional and widely accepted, is not without limitations. Both of these housekeeping proteins have been reported to exhibit variable expression in certain pathological conditions, including a range of cancers. Specifically, studies have demonstrated that GAPDH and β-actin levels can be upregulated or downregulated depending on tumor type, grade, metabolic status, and cellular stress responses [85,86]. In the context of astrocytic tumors, where metabolic reprogramming and cytoskeletal remodeling are frequently observed, such fluctuations in housekeeping protein levels could potentially introduce bias in quantitative protein analyses. Despite these concerns, GAPDH and β-actin remain widely used due to their robust detection, historical precedent, and relative expression stability across many sample types. However, we acknowledge this limitation in our study and suggest that future investigations should consider validating the stability of internal reference proteins in the specific tissue and disease context under study.
A further gap lies in the spatial and cellular resolution of cytokine expression. Bulk tissue analysis does not distinguish between tumor cell-derived and microenvironmental cytokine sources (e.g., microglia, macrophages). Future studies employing single-cell RNA-seq or spatial transcriptomics could clarify the cellular origins of TNF-α, IL-1β in gliomas and their interaction with infiltrating immune cells.

4. Materials and Methods

4.1. Characterization of Participants

This study included tumor samples from 60 patients who underwent surgical resection of astrocytic brain tumors at two neurosurgical departments in Kraków, Poland: the Department of Neurosurgery at the 5th Military Clinical Hospital with the SP ZOZ Polyclinic and the Department of Neurosurgery at Saint Raphael Hospital.
Preoperative diagnosis was initially established through contrast-enhanced computed tomography (CT) and confirmed with magnetic resonance imaging (MRI). Imaging protocols incorporated T1- and T2-weighted sequences, fluid-attenuated inversion recovery (FLAIR), and, when clinically indicated, diffusion tensor imaging. For tumors adjacent to functionally critical brain regions, additional evaluations such as functional MRI and tractography supported surgical planning via neuronavigation.
Surgical intervention prioritized maximal tumor resection with preservation of neurological function. Intraoperative guidance included frameless neuronavigation, fluorescence-guided resection with 5-aminolevulinic acid (5-ALA) in high-grade gliomas, and cortical mapping through direct electrical stimulation when operating near sensorimotor areas.
Postoperative tumor classification was based on histopathological assessment according to the World Health Organization (WHO) grading system, categorizing tumors into grade II (G2), grade III (G3), and grade IV (G4) astrocytomas.
The study cohort comprised 35 female and 30 male patients, aged between 56 and 59 years on average. Among females, tumor distribution was: 10 G2, 7 G3, and 18 G4. For males: 7 G2, 5 G3, and 18 G4 cases were identified.
Patient eligibility was determined using strict inclusion and exclusion criteria. Inclusion required scheduled elective tumor resection at one of the participating centers and provision of informed consent. Patients with concurrent malignancies were excluded from the study.
To ensure consistency in perioperative conditions, all patients adhered to a standardized fasting protocol, with the final preoperative meal administered by 6:00 PM on the evening before surgery. All procedures were conducted between 8:00 A.M. and 11:00 A.M. the following day under elective surgical scheduling.

4.2. Extraction of Total Ribonucleic Acid (RNA)

Tumor tissue samples were homogenized using a T18 Digital Ultra-Turrax rotor–stator system (IKA Poland Ltd., Warsaw, Poland). Total RNA was extracted using TRIzol reagent (Invitrogen, Carlsbad, CA, USA), followed by further purification with the RNeasy Mini Kit (QIAGEN, Hilden, Germany) to ensure removal of proteins and phenolic contaminants. Residual genomic DNA was eliminated through DNase I treatment (Fermentas, Burlington, ON, Canada).
RNA quality and integrity were assessed via 1% agarose gel electrophoresis stained with ethidium bromide (0.5 µg/mL). RNA concentrations were determined by measuring absorbance at 260 nm using a spectrophotometer, ensuring consistent purity for downstream applications.

4.3. Microarray Analysis

Gene expression profiling was conducted to compare transcript levels between astrocytic tumor samples and non-tumor control tissues. The Affymetrix HG-U133A2 platform and GeneChip™ 3′ IVT PLUS Reagent Kit (Affymetrix, Santa Clara, CA, USA; Cat. No. 902416) were used in accordance with the manufacturer’s protocols and previously validated procedures [87]. The Kyoto Encyclopedia of Genes and Genomes (KEGG) pathway database [88] was used to identify genes involved in the TNF-α signaling cascade. Specifically, the KEGG TNF-α signaling pathway map (entry hsa04668, pathway ID N00056) served as the reference for compiling a curated list of 119 genes functionally associated with this pathway.

4.4. Microarray Profiling of TNF-α-Related miRNAs

MicroRNA expression analysis was performed using the GeneChip miRNA 2.0 Array (Affymetrix), enabling comprehensive detection of differentially expressed miRNAs between tumor and control tissues. The experimental workflow followed the manufacturer’s standardized protocol to ensure data reliability and reproducibility. miRNA–mRNA interaction predictions were carried out using the TargetScan (http://www.targetscan.org/, accessed on 10 March 2025) [89] and miRanda (http://mirdb.org, accessed on 10 March 2025)—[90] databases. High-confidence target interactions were defined by a prediction score > 80, while interactions with scores < 60 were flagged for additional validation [90,91].

4.5. Validation of Gene Expression Using Quantitative Reverse-Transcription Polymerase Chain Reaction (qRT-PCR)

To validate the microarray data, qRT-PCR was performed on selected genes using the SensiFast SYBR Quantitative reverse transcription PCR (qRT-PCR) to validate selected gene expression profiles from the microarray analysis. Reactions were performed using the SensiFast SYBR No-ROX One-Step Kit (Bioline, London, UK). The thermal protocol included reverse transcription at 45 °C, polymerase activation at 95 °C for 2 min, followed by 40 amplification cycles: 95 °C for 5 s, 60 °C for 10 s, and 72 °C for 5 s.
Expression levels were normalized to GAPDH ACTB as an internal control. Relative quantification was calculated using the 2−ΔΔCt method. A fold-change threshold of 1 represented baseline expression; values above or below indicated overexpression or downregulation, respectively. Primer sequences are listed in Table 4.

4.6. Methylation Analysis of Genes

CpG-rich regions within the target genes were identified using the MethPrimer tool (http://www.urogene.org/cgi-bin/methprimer/methprimer.cgi; accessed on 19 January 2025) [92]. Primer design criteria included a CpG island length > 100 bp, GC content > 50%, and an observed-to-expected CpG ratio > 0.6 (see Table 5).
Genomic DNA was subjected to sodium bisulfite conversion followed by cleanup, as per the kit instructions. Methylation-specific PCR (MSP) was performed using the QuantiTect SYBR Green PCR Kit (QIAGEN, Hilden, Germany). Thermal cycling consisted of an initial 5 min denaturation at 95 °C, followed by 40 cycles at 94 °C (30 s), 65 °C (30 s), and 72 °C (30 s).
PCR products were analyzed by agarose gel electrophoresis (1% gel, ethidium bromide 0.5 µg/mL, 1× TBE buffer, 120 V). Fragment sizes were compared to the pBR322/HaeIII marker. To validate amplification specificity, methylated and non-methylated DNA controls from the EpiTect Control DNA Set (QIAGEN) were included.

4.7. Enzyme-Linked Immunosorbent Assay (ELISA) Quantification of Selected Proteins in G2, G3, G4 Astrocytic Tumor Samples

Quantitative analysis of selected inflammatory and signaling proteins in astrocytic tumor tissues (grades G2, G3, and G4) was performed using commercially available ELISA kits, following the manufacturers’ protocols. The concentrations of TNF-α and IL-1β were determined using the Human TNF alpha ELISA Kit (Invitrogen Life Technologies, Carlsbad, CA, USA; catalog number: KHC3012) and the Human IL-1 beta ELISA Kit (Invitrogen Life Technologies, Carlsbad, CA, USA; catalog number: BMS224-2), respectively. To assess the involvement of TNF receptors in astrocytic tumor progression, levels of tumor necrosis factor receptor superfamily member 1A (TNFRSF1A) and member 1B (TNFRSF1B) were measured using specific ELISA kits obtained from Invitrogen (catalog numbers: BMS224-2 and KAC1771, respectively). Additionally, components of the MAPK signaling pathway were evaluated. Human MAP2K7 concentrations were determined using the Human MAP2K7 ELISA Kit (MyBioSource, San Diego, CA, USA; catalog number: MBS9334956), while Human MAP3K8 levels were quantified with the Human MAP3K8 ELISA Kit (MyBioSource, San Diego, CA, USA; catalog number: MBS9325582). Each assay was conducted in triplicate depending on sample availability, and absorbance was measured at the recommended wavelength using a microplate reader. Protein concentrations were calculated based on standard curves generated with known concentrations of the target analytes.

4.8. Western Blot for Protein Quantification of TNF-α and IL-1β

TNF-α was detected using a specific antibody (STI, Poznań, Poland; bs-10802R) at a 1:1000 dilution, while IL-1β was assessed using a primary antibody from Labiot (Cieszyn, Poland; Cell Signaling; d3ue2) also at a 1:1000 dilution. Protein separation was performed by SDS-PAGE using polyacrylamide gels.
Glyceraldehyde 3-phosphate dehydrogenase (GAPDH; sc-47724, Santa Cruz Biotechnology, Dallas, TX, USA; 1:500 dilution) served as the endogenous control. For Western blot detection, a horseradish peroxidase (HRP)-conjugated goat anti-rabbit IgG secondary antibody (BioRad, Milan, Italy; catalog no. 1706515; 1:3000 dilution) was used. Absorbance readings for ELISA were obtained at 540 nm using an M200PRO microplate reader (Tecan, Männedorf, Switzerland). Detailed ELISA and Western blot procedures were conducted according to protocols described in previously published studies.

4.9. Immunohistochemical (IHC) Analysis of TNF-α and IL1β in Astrocytic Brain Tumor Samples

Paraffin-embedded tissue specimens were sectioned into 8.0 µm thick slices using a rotary microtome (Leica Microsystems, Germany). Deparaffinization, antigen retrieval, and antibody incubation steps were performed following the manufacturer’s protocols provided with the DAB Substrate Kit (Peroxidase, HRP; Vector Laboratories, Newark, CA, USA) and the IHC-Paraffin Protocol (Abcam plc, Cambridge, UK).
Immunoreactive signals were visualized and documented using a Nikon Coolpix-equipped fluorescent microscope. Cellular localization(Melville, NY 11747-3064, USA) and protein expression levels were analyzed using computer-assisted image analysis in ImageJ software (version: 1.x). Representative images were acquired from three non-overlapping fields at 200× magnification.
Quantification of the DAB chromogen signal was performed using the IHC-Profiler plug-in in ImageJ. Optical density was measured in regions exhibiting immunoreactivity, and the average percentage of DAB-stained area was calculated in relation to the background staining intensity for each image field.

4.10. Functional Network Analysis of Protein–Protein Interactions (PPI)

To assess the functional relationships among the selected proteins (TNF-α, IL-1β, TNFRSF1A, TNFRSF1B, MAP3K8, and MAP2K7), we used the STRING database (Search Tool for the Retrieval of Interacting Genes/Proteins, version 12.0; https://string-db.org, accessed on 10 March 2025) [93]. The official gene symbols of the six proteins were entered into the STRING search tool, and interactions were explored based on known and predicted associations, including physical binding and functional co-expression.
The analysis was performed using the full STRING network with a medium confidence score threshold (≥0.4). Edges in the resulting network were displayed according to the type of supporting evidence, allowing visualization of both direct (physical) and indirect (functional) associations. Topological features of the network, including the number of nodes, number of edges, average node degree, and local clustering coefficient, were automatically calculated. The statistical significance of the interaction enrichment was assessed using the STRING-provided PPI enrichment p-value, which determines whether the observed number of connections exceeds what would be expected for a randomly selected set of proteins of similar size.

4.11. Statistical Analysis

All statistical analyses were performed using StatPlus (AnalystSoft Inc., Brandon, FL, USA, https://www.analystsoft.com/en/products/statplusmacle/, accessed on 10 March 2025) and the Transcriptome Analysis Console (Affymetrix, Santa Clara, CA, USA). Prior to analysis, data distributions were assessed for normality using the Shapiro–Wilk test. A threshold of p < 0.05 was used to indicate non-normal distribution.
For comparisons of gene and protein expression levels among tumor grades (G2, G3, G4), one-way analysis of variance (ANOVA) was applied. To control for false discovery rate due to multiple testing, the Benjamini–Hochberg correction was employed. Scheffé’s post hoc test was used to identify specific between-group differences.
Kaplan–Meier survival analysis was performed to evaluate associations between molecular markers and overall survival. Differences in survival curves were compared using the log-rank test. Furthermore, Cox proportional hazards regression models were used to estimate hazard ratios (HRs) and 95% confidence intervals (CIs), allowing multivariate assessment of the prognostic significance of cytokine expression levels, miRNA profiles, and methylation status.
All results were considered statistically significant at p < 0.05. Data are presented as mean ± standard deviation (SD) unless otherwise stated.

5. Conclusions

In summary, our study demonstrates that dysregulation of the TNF-α signaling axis—including upregulation of TNF-α, IL-1β, and MAP3K8—is a hallmark of high-grade astrocytomas and correlates with worse patient outcomes. This dysregulation is shaped by miRNA suppression and epigenetic modifications, emphasizing the multilayered regulation of inflammatory signaling in glioma. These findings highlight promising targets for molecular therapy and lay the groundwork for further mechanistic exploration in translational glioma research.

Author Contributions

Conceptualization, K.S. and D.S. (Dawid Sobański); methodology, D.S. (Damian Strojny) and D.S. (Dawid Sobański); software, B.O.G.; validation, K.S., D.S. (Dawid Sobański) and B.O.G.; formal analysis, D.S. (Damian Strojny); investigation, K.S. and R.S.; resources, M.M.; data curation, K.S. and B.O.G.; writing—original draft preparation, K.S. and P.G.; writing—review and editing, K.S. and D.S. (Dawid Sobański); supervision, B.O.G.; project administration, B.O.G. All authors have read and agreed to the published version of the manuscript.

Funding

This research received no external funding.

Institutional Review Board Statement

This study was conducted in accordance with the Declaration of Helsinki and received ethical approval from two institutions: the Bioethical Committee of the Regional Medical Chamber in Krakow (reference number: 247/KBL/OIL/2021; dated 11 June 2021) and the Bioethics Committee of the State Academy of Applied Sciences in Przemyśl (approval number: 7/2024; dated 1 August 2024).

Informed Consent Statement

Informed consent was obtained from all subjects involved in the study.

Data Availability Statement

The data used to support the findings of this study are included in the article. The data cannot be shared due to third-party rights and commercial confidentiality.

Acknowledgments

We would like to thank Nikola Zmarzły for improving the quality of the figures, and Oskar Ogloszka for his assistance in improving the English language.

Conflicts of Interest

The authors declare no conflicts of interest.

Abbreviations

The following abbreviations are used in this manuscript:
TNF-αTumor Necrosis Factor Alpha
IL-1βInterleukin-1 Beta
TNFRSF1ATumor Necrosis Factor Receptor Superfamily Member 1A
TNFRSF1BTumor Necrosis Factor Receptor Superfamily Member 1B
MAP3K8Mitogen-Activated Protein Kinase Kinase Kinase 8
MAP2K7Mitogen-Activated Protein Kinase Kinase 7
NF-κBNuclear Factor kappa-light-chain-enhancer of activated B cells
JNKc-Jun N-terminal Kinase
RT-qPCRReverse Transcription Quantitative Polymerase Chain Reaction
ELISAEnzyme-Linked Immunosorbent Assay
IHCImmunohistochemistry
MSPMethylation-Specific Polymerase Chain Reaction
PPIProtein–Protein Interaction
KEGGKyoto Encyclopedia of Genes and Genomes
GAPDHGlyceraldehyde-3-Phosphate Dehydrogenase
ACTBBeta Actin
miRNAMicroRNA
ceRNACompeting Endogenous RNA
IDHIsocitrate Dehydrogenase
MGMTO6-Methylguanine-DNA Methyltransferase
EGFREpidermal Growth Factor Receptor
GBMGlioblastoma Multiforme
G2Grade II Astrocytoma
G3Grade III Astrocytoma
G4Grade IV Astrocytoma
HRHazard Ratio
CIConfidence Interval
SDStandard Deviation
SP ZOZSamodzielny Publiczny Zakład Opieki Zdrowotnej

References

  1. Zhao, H.; Wu, L.; Yan, G.; Chen, Y.; Zhou, M.; Wu, Y.; Li, Y. Inflammation and Tumor Progression: Signaling Pathways and Targeted Intervention. Signal Transduct. Target. Ther. 2021, 6, 263. [Google Scholar] [PubMed]
  2. Kipanyula, M.J.; Etet, P.F.S.; Vecchio, L.; Farahna, M.; Nukenine, E.N.; Kamdje, A.H.N. Signaling Pathways Bridging Microbial-Triggered Inflammation and Cancer. Cell. Signal. 2013, 25, 403–416. [Google Scholar] [CrossRef] [PubMed]
  3. Wei, J.; Wu, D.; Zhao, S.; Shao, Y.; Xia, Y.; Ni, D.; Qiu, X.; Zhang, J.; Chen, J.; Meng, F.; et al. Immunotherapy of Malignant Glioma by Noninvasive Administration of TLR9 Agonist CpG Nano-Immunoadjuvant. Adv. Sci. 2022, 9, 2103689. [Google Scholar] [CrossRef] [PubMed]
  4. Salomon, B.L. Insights into the Biology and Therapeutic Implications of TNF and Regulatory T Cells. Nat. Rev. Rheumatol. 2021, 17, 487–504. [Google Scholar] [CrossRef]
  5. Mehta, A.K.; Gracias, D.T.; Croft, M. TNF Activity and T Cells. Cytokine 2018, 101, 14–18. [Google Scholar] [CrossRef]
  6. Guo, Q.; Jin, Y.; Chen, X.; Ye, X.; Shen, X.; Lin, M.; Zeng, C.; Zhou, T.; Zhang, J. NF-κB in Biology and Targeted Therapy: New Insights and Translational Implications. Signal Transduct. Target. Ther. 2024, 9, 53. [Google Scholar] [CrossRef]
  7. Cruceriu, D.; Baldasici, O.; Balacescu, O.; Berindan-Neagoe, I. The Dual Role of Tumor Necrosis Factor-Alpha (TNF-α) in Breast Cancer: Molecular Insights and Therapeutic Approaches. Cell Oncol. 2020, 43, 1–18. [Google Scholar] [CrossRef]
  8. Qu, X.; Tang, Y.; Hua, S. Immunological Approaches towards Cancer and Inflammation: A Cross Talk. Front. Immunol. 2018, 9, 563. [Google Scholar] [CrossRef]
  9. Bhat, A.A.; Uppada, S.; Achkar, I.W.; Hashem, S.; Yadav, S.K.; Shanmugakonar, M.; Al-Naemi, H.A.; Haris, M.; Uddin, S. Tight Junction Proteins and Signaling Pathways in Cancer and Inflammation: A Functional Crosstalk. Front. Physiol. 2019, 9, 1942. [Google Scholar] [CrossRef]
  10. Bent, R.; Moll, L.; Grabbe, S.; Bros, M. Interleukin-1 Beta—A Friend or Foe in Malignancies? Int. J. Mol. Sci. 2018, 19, 2155. [Google Scholar] [CrossRef]
  11. Galozzi, P.; Bindoli, S.; Doria, A.; Sfriso, P. The Revisited Role of Interleukin-1 Alpha and Beta in Autoimmune and Inflammatory Disorders and in Comorbidities. Autoimmun. Rev. 2021, 20, 102785. [Google Scholar] [CrossRef] [PubMed]
  12. Mantovani, A.; Dinarello, C.A.; Molgora, M.; Garlanda, C. Interleukin-1 and Related Cytokines in the Regulation of Inflammation and Immunity. Immunity 2019, 50, 778–795. [Google Scholar] [CrossRef] [PubMed]
  13. Yokose, K.; Sato, S.; Asano, T.; Yashiro, M.; Kobayashi, H.; Watanabe, H.; Suzuki, E.; Sato, C.; Kozuru, H.; Yatsuhashi, H. TNF-α Potentiates Uric Acid-Induced Interleukin-1 β (IL-1 β) Secretion in Human Neutrophils. Mod. Rheumatol. 2018, 28, 513–517. [Google Scholar] [CrossRef] [PubMed]
  14. Dexheimer, P.J.; Cochella, L. MicroRNAs: From Mechanism to Organism. Front. Cell Dev. Biol. 2020, 8, 409. [Google Scholar] [CrossRef]
  15. Saliminejad, K.; Khorram Khorshid, H.R.; Soleymani Fard, S.; Ghaffari, S.H. An Overview of microRNAs: Biology, Functions, Therapeutics, and Analysis Methods. J. Cell. Physiol. 2019, 234, 5451–5465. [Google Scholar] [CrossRef]
  16. Sharma, A.R.; Sharma, G.; Lee, S.; Chakraborty, C. miRNA-Regulated Key Components of Cytokine Signaling Pathways and Inflammation in Rheumatoid Arthritis. Med. Res. Rev. 2016, 36, 425–439. [Google Scholar] [CrossRef]
  17. Oyama, R.; Jinnin, M.; Kakimoto, A.; Kanemaru, H.; Ichihara, A.; Fujisawa, A.; Honda, N.; Masuguchi, S.; Fukushima, S.; Maruo, K. Circulating microRNA Associated with TNF-α Signaling Pathway in Patients with Plaque Psoriasis. J. Dermatol. Sci. 2011, 61, 209–211. [Google Scholar] [CrossRef]
  18. Banerjee, S.; Xu, W.; Doctor, A.; Driss, A.; Nezhat, C.; Sidell, N.; Taylor, R.N.; Thompson, W.E.; Chowdhury, I. TNFα-Induced Altered miRNA Expression Links to NF-κB Signaling Pathway in Endometriosis. Inflammation 2023, 46, 2055–2070. [Google Scholar] [CrossRef]
  19. Park, J.W.; Lee, K.; Kim, E.E.; Kim, S.-I.; Park, S.-H. Brain Tumor Classification by Methylation Profile. J. Korean Med. Sci. 2023, 38, e356. [Google Scholar] [CrossRef]
  20. Cano-Valdez, A.M.; Sevilla-Lizcano, D.B. Pathological Classification of Brain Tumors. In Principles of Neuro-Oncology; Monroy-Sosa, A., Chakravarthi, S.S., De La Garza-Salazar, J.G., Meneses Garcia, A., Kassam, A.B., Eds.; Springer International Publishing: Cham, Switzerland, 2021; pp. 75–105. ISBN 978-3-030-54878-0. [Google Scholar]
  21. Pienkowski, T.; Kowalczyk, T.; Kretowski, A.; Ciborowski, M. A Review of Gliomas-Related Proteins. Characteristics of Potential Biomarkers. Am. J. Cancer Res. 2021, 11, 3425. [Google Scholar]
  22. Machnik, G.; Bułdak, Ł.; Zapletal-Pudełko, K.; Grabarek, B.O.; Staszkiewicz, R.; Sobański, D.; Okopień, B. The Impact of Wound-Healing Assay, Phorbol Myristate Acetate (PMA) Stimulation and siRNA-Mediated FURIN Gene Silencing on Endogenous Retroviral ERVW-1 Expression Level in U87-MG Astrocytoma Cells. Adv. Med. Sci. 2024, 69, 113–124. [Google Scholar] [CrossRef] [PubMed]
  23. Chen, Z.; Hambardzumyan, D. Immune Microenvironment in Glioblastoma Subtypes. Front. Immunol. 2018, 9, 1004. [Google Scholar] [CrossRef] [PubMed]
  24. Hanif, F.; Muzaffar, K.; Perveen, K.; Malhi, S.M.; Simjee, S.U. Glioblastoma Multiforme: A Review of Its Epidemiology and Pathogenesis through Clinical Presentation and Treatment. Asian Pac. J. Cancer Prev. 2017, 18, 3–9. [Google Scholar] [CrossRef] [PubMed]
  25. Ostrom, Q.T.; Cioffi, G.; Gittleman, H.; Patil, N.; Waite, K.; Kruchko, C.; Barnholtz-Sloan, J.S. CBTRUS Statistical Report: Primary Brain and Other Central Nervous System Tumors Diagnosed in the United States in 2012–2016. Neuro-Oncol. 2019, 21, v1–v100. [Google Scholar] [CrossRef]
  26. Reifenberger, G.; Wirsching, H.-G.; Knobbe-Thomsen, C.B.; Weller, M. Advances in the Molecular Genetics of Gliomas—Implications for Classification and Therapy. Nat. Rev. Clin. Oncol. 2017, 14, 434–452. [Google Scholar] [CrossRef]
  27. Bale, T.A.; Rosenblum, M.K. The 2021 WHO Classification of Tumors of the Central Nervous System: An Update on Pediatric Low-grade Gliomas and Glioneuronal Tumors. Brain Pathol. 2022, 32, e13060. [Google Scholar] [CrossRef]
  28. Horbinski, C.; Berger, T.; Packer, R.J.; Wen, P.Y. Clinical Implications of the 2021 Edition of the WHO Classification of Central Nervous System Tumours. Nat. Rev. Neurol. 2022, 18, 515–529. [Google Scholar] [CrossRef]
  29. Louis, D.N.; Perry, A.; Wesseling, P.; Brat, D.J.; Cree, I.A.; Figarella-Branger, D.; Hawkins, C.; Ng, H.K.; Pfister, S.M.; Reifenberger, G.; et al. The 2021 WHO Classification of Tumors of the Central Nervous System: A Summary. Neuro Oncol. 2021, 23, 1231–1251. [Google Scholar] [CrossRef]
  30. Sokolenko, A.P.; Imyanitov, E.N. Molecular Diagnostics in Clinical Oncology. Front. Mol. Biosci. 2018, 5, 76. [Google Scholar] [CrossRef]
  31. Ceccarelli, M.; Barthel, F.P.; Malta, T.M.; Sabedot, T.S.; Salama, S.R.; Murray, B.A.; Morozova, O.; Newton, Y.; Radenbaugh, A.; Pagnotta, S.M.; et al. Molecular Profiling Reveals Biologically Discrete Subsets and Pathways of Progression in Diffuse Glioma. Cell 2016, 164, 550–563. [Google Scholar] [CrossRef]
  32. Radke, J.; Koch, A.; Pritsch, F.; Schumann, E.; Misch, M.; Hempt, C.; Lenz, K.; Löbel, F.; Paschereit, F.; Heppner, F.L.; et al. Predictive MGMT Status in a Homogeneous Cohort of IDH Wildtype Glioblastoma Patients. Acta Neuropathol. Commun. 2019, 7, 89. [Google Scholar] [CrossRef] [PubMed]
  33. Labreche, K.; Kinnersley, B.; Berzero, G.; Di Stefano, A.L.; Rahimian, A.; Detrait, I.; Marie, Y.; Grenier-Boley, B.; Hoang-Xuan, K.; Delattre, J.-Y.; et al. Diffuse Gliomas Classified by 1p/19q Co-Deletion, TERT Promoter and IDH Mutation Status Are Associated with Specific Genetic Risk Loci. Acta Neuropathol. 2018, 135, 743–755. [Google Scholar] [CrossRef] [PubMed]
  34. Boroń, D.; Zmarzły, N.; Wierzbik-Strońska, M.; Rosińczuk, J.; Mieszczański, P.; Grabarek, B.O. Recent Multiomics Approaches in Endometrial Cancer. Int. J. Mol. Sci. 2022, 23, 1237. [Google Scholar] [CrossRef] [PubMed]
  35. Fu, Y.; Tao, J.; Liu, T.; Liu, Y.; Qiu, J.; Su, D.; Wang, R.; Luo, W.; Cao, Z.; Weng, G.; et al. Unbiasedly Decoding the Tumor Microenvironment with Single-Cell Multiomics Analysis in Pancreatic Cancer. Mol. Cancer 2024, 23, 140. [Google Scholar] [CrossRef]
  36. Li, L.; Bai, L.; Lin, H.; Dong, L.; Zhang, R.; Cheng, X.; Liu, Z.; Ouyang, Y.; Ding, K. Multiomics Analysis of Tumor Mutational Burden across Cancer Types. Comput. Struct. Biotechnol. J. 2021, 19, 5637–5646. [Google Scholar] [CrossRef]
  37. Nigam, M.; Mishra, A.P.; Deb, V.K.; Dimri, D.B.; Tiwari, V.; Bungau, S.G.; Bungau, A.F.; Radu, A.-F. Evaluation of the Association of Chronic Inflammation and Cancer: Insights and Implications. Biomed. Pharmacother. 2023, 164, 115015. [Google Scholar] [CrossRef]
  38. Michels, N.; van Aart, C.; Morisse, J.; Mullee, A.; Huybrechts, I. Chronic Inflammation towards Cancer Incidence: A Systematic Review and Meta-Analysis of Epidemiological Studies. Crit. Rev. Oncol./Hematol. 2021, 157, 103177. [Google Scholar] [CrossRef]
  39. Basheer, A.S.; Abas, F.; Othman, I.; Naidu, R. Role of Inflammatory Mediators, Macrophages, and Neutrophils in Glioma Maintenance and Progression: Mechanistic Understanding and Potential Therapeutic Applications. Cancers 2021, 13, 4226. [Google Scholar] [CrossRef]
  40. Ham, S.W.; Jeon, H.-Y.; Jin, X.; Kim, E.-J.; Kim, J.-K.; Shin, Y.J.; Lee, Y.; Kim, S.H.; Lee, S.Y.; Seo, S. TP53 Gain-of-Function Mutation Promotes Inflammation in Glioblastoma. Cell Death Differ. 2019, 26, 409–425. [Google Scholar] [CrossRef]
  41. Gromeier, M.; Brown, M.C.; Zhang, G.; Lin, X.; Chen, Y.; Wei, Z.; Beaubier, N.; Yan, H.; He, Y.; Desjardins, A. Very Low Mutation Burden Is a Feature of Inflamed Recurrent Glioblastomas Responsive to Cancer Immunotherapy. Nat. Commun. 2021, 12, 352. [Google Scholar] [CrossRef]
  42. Mantovani, A.; Allavena, P.; Marchesi, F.; Garlanda, C. Macrophages as Tools and Targets in Cancer Therapy. Nat. Rev. Drug Discov. 2022, 21, 799–820. [Google Scholar] [CrossRef] [PubMed]
  43. Cui, A.; Huang, T.; Li, S.; Ma, A.; Pérez, J.L.; Sander, C.; Keskin, D.B.; Wu, C.J.; Fraenkel, E.; Hacohen, N. Dictionary of Immune Responses to Cytokines at Single-Cell Resolution. Nature 2024, 625, 377–384. [Google Scholar] [CrossRef] [PubMed]
  44. Broekman, M.L.; Maas, S.L.; Abels, E.R.; Mempel, T.R.; Krichevsky, A.M.; Breakefield, X.O. Multidimensional Communication in the Microenvirons of Glioblastoma. Nat. Rev. Neurol. 2018, 14, 482–495. [Google Scholar] [CrossRef] [PubMed]
  45. Chen, N.; Peng, C.; Li, D. Epigenetic Underpinnings of Inflammation: A Key to Unlock the Tumor Microenvironment in Glioblastoma. Front. Immunol. 2022, 13, 869307. [Google Scholar] [CrossRef]
  46. Sampson, J.H.; Gunn, M.D.; Fecci, P.E.; Ashley, D.M. Brain Immunology and Immunotherapy in Brain Tumours. Nat. Rev. Cancer 2020, 20, 12–25. [Google Scholar] [CrossRef]
  47. Van Cutsem, E.; Collignon, J.; Eefsen, R.; Ochsenreither, S.; Zvirbule, Z.; Ivanauskas, A.; Millrud, C.R.; Skoog, P.; Losic, N.; Magnusson, S. Tumor IL1RAP Levels and Reduction in Serum Biomarkers Correlate with Response in PDAC Patients Treated with Nadunolimab, an Anti-IL1RAP Monoclonal Antibody, in Combination with Gemcitabine and Nab-Paclitaxel. Cancer Res. 2023, 83, 2172. [Google Scholar] [CrossRef]
  48. Oyende, Y.; Taus, L.J.; Fatatis, A. IL-1β in Neoplastic Disease and the Role of Its Tumor-Derived Form in the Progression and Treatment of Metastatic Prostate Cancer. Cancers 2025, 17, 290. [Google Scholar] [CrossRef]
  49. Chen, A.Y.; Wolchok, J.D.; Bass, A.R. TNF in the Era of Immune Checkpoint Inhibitors: Friend or Foe? Nat. Rev. Rheumatol. 2021, 17, 213–223. [Google Scholar] [CrossRef]
  50. Laha, D.; Grant, R.; Mishra, P.; Nilubol, N. The Role of Tumor Necrosis Factor in Manipulating the Immunological Response of Tumor Microenvironment. Front. Immunol. 2021, 12, 656908. [Google Scholar] [CrossRef]
  51. Walsh, M.J.; Ali, L.R.; Lenehan, P.; Kureshi, C.T.; Kureshi, R.; Dougan, M.; Knipe, D.M.; Dougan, S.K. Blockade of Innate Inflammatory Cytokines TNF α, IL-1 β, or IL-6 Overcomes Virotherapy-Induced Cancer Equilibrium to Promote Tumor Regression. Immunother. Adv. 2023, 3, ltad011. [Google Scholar] [CrossRef]
  52. Caronni, N.; La Terza, F.; Vittoria, F.M.; Barbiera, G.; Mezzanzanica, L.; Cuzzola, V.; Barresi, S.; Pellegatta, M.; Canevazzi, P.; Dunsmore, G. IL-1β+ Macrophages Fuel Pathogenic Inflammation in Pancreatic Cancer. Nature 2023, 623, 415–422. [Google Scholar] [CrossRef] [PubMed]
  53. Ghosh, S.; Ghosh, R.; Sawoo, R.; Dutta, P.; Bishayi, B. Impact of Dual Neutralization of TNF-α and IL-1β along with Gentamicin Treatment on the Functions of Blood and Splenic Neutrophils and Its Role on Improvement of S. Aureus Induced Septic Arthritis. Int. Immunopharmacol. 2023, 123, 110766. [Google Scholar] [CrossRef] [PubMed]
  54. Takahashi, T.; Yamasaki, K. Psoriasis and Antimicrobial Peptides. Int. J. Mol. Sci. 2020, 21, 6791. [Google Scholar] [CrossRef] [PubMed]
  55. Yehuda, H.; Soroka, Y.; Zlotkin-Frušić, M.; Gilhar, A.; Milner, Y.; Tamir, S. Isothiocyanates Inhibit Psoriasis-Related Proinflammatory Factors in Human Skin. Inflamm. Res. 2012, 61, 735–742. [Google Scholar] [CrossRef]
  56. Mukherjee, T.; Mohanty, S.; Kaur, J.; Das, M.; Adhikary, K.; Chatterjee, P.; Maiti, R. Exploring Small-Molecule Inhibitors Targeting MAPK Pathway Components: Focus on ERK, MEK1, and MEK2 Kinases in Cancer Treatment. Chem. Biol. Lett. 2024, 11, 659. [Google Scholar] [CrossRef]
  57. Bai, D.; Cheng, X.; Li, Q.; Zhang, B.; Zhang, Y.; Lu, F.; Sun, T.; Hao, J. Eupatilin Inhibits Keratinocyte Proliferation and Ameliorates Imiquimod-Induced Psoriasis-like Skin Lesions in Mice via the P38 MAPK/NF-κB Signaling Pathway. Immunopharmacol. Immunotoxicol. 2023, 45, 133–139. [Google Scholar] [CrossRef]
  58. Paardekooper, L.M.; Bendix, M.B.; Ottria, A.; de Haer, L.W.; Ter Beest, M.; Radstake, T.R.; Marut, W.; van den Bogaart, G. Hypoxia Potentiates Monocyte-Derived Dendritic Cells for Release of Tumor Necrosis Factor α via MAP3K8. Biosci. Rep. 2018, 38, BSR20182019. [Google Scholar] [CrossRef]
  59. Pattison, M.J.; Mitchell, O.; Flynn, H.R.; Chen, C.-S.; Yang, H.-T.; Ben-Addi, H.; Boeing, S.; Snijders, A.P.; Ley, S.C. TLR and TNF-R1 Activation of the MKK3/MKK6–P38α Axis in Macrophages Is Mediated by TPL-2 Kinase. Biochem. J. 2016, 473, 2845–2861. [Google Scholar] [CrossRef]
  60. Martinelli, E.; Morgillo, F.; Troiani, T.; Ciardiello, F. Cancer Resistance to Therapies against the EGFR-RAS-RAF Pathway: The Role of MEK. Cancer Treat. Rev. 2017, 53, 61–69. [Google Scholar] [CrossRef]
  61. Lee, S.; Rauch, J.; Kolch, W. Targeting MAPK Signaling in Cancer: Mechanisms of Drug Resistance and Sensitivity. Int. J. Mol. Sci. 2020, 21, 1102. [Google Scholar] [CrossRef]
  62. Ren, J.; Xu, Y.; Liu, J.; Wu, S.; Zhang, R.; Cao, H.; Sun, J. MAP3K8 Is a Prognostic Biomarker and Correlated With Immune Response in Glioma. Front. Mol. Biosci. 2021, 8, 779290. [Google Scholar] [CrossRef] [PubMed]
  63. Hamosh, A.; Scott, A.F.; Amberger, J.; Valle, D.; McKusick, V.A. Online Mendelian Inheritance in Man (OMIM). Hum. Mutat. 2000, 15, 57–61. [Google Scholar] [CrossRef]
  64. Jean-Quartier, C.; Jeanquartier, F.; Holzinger, A. Open Data for Differential Network Analysis in Glioma. Int. J. Mol. Sci. 2020, 21, 547. [Google Scholar] [CrossRef]
  65. Fu, J.; Imani, S.; Wu, M.-Y.; Wu, R.-C. MicroRNA-34 Family in Cancers: Role, Mechanism, and Therapeutic Potential. Cancers 2023, 15, 4723. [Google Scholar] [CrossRef] [PubMed]
  66. Tokumaru, Y.; Katsuta, E.; Oshi, M.; Sporn, J.C.; Yan, L.; Le, L.; Matsuhashi, N.; Futamura, M.; Akao, Y.; Yoshida, K.; et al. High Expression of miR-34a Associated with Less Aggressive Cancer Biology but Not with Survival in Breast Cancer. Int. J. Mol. Sci. 2020, 21, 3045. [Google Scholar] [CrossRef]
  67. Mao, L.; Liu, S.; Hu, L.; Jia, L.; Wang, H.; Guo, M.; Chen, C.; Liu, Y.; Xu, L. miR-30 Family: A Promising Regulator in Development and Disease. BioMed Res. Int. 2018, 2018, 9623412. [Google Scholar] [CrossRef]
  68. Khan, A.Q.; Ahmed, E.I.; Elareer, N.R.; Junejo, K.; Steinhoff, M.; Uddin, S. Role of miRNA-Regulated Cancer Stem Cells in the Pathogenesis of Human Malignancies. Cells 2019, 8, 840. [Google Scholar] [CrossRef]
  69. Garavelli, S.; De Rosa, V.; De Candia, P. The Multifaceted Interface between Cytokines and microRNAs: An Ancient Mechanism to Regulate the Good and the Bad of Inflammation. Front. Immunol. 2018, 9, 3012. [Google Scholar] [CrossRef]
  70. Manjili, D.A.; Babaei, F.N.; Younesirad, T.; Ghadir, S.; Askari, H.; Daraei, A. Dysregulated Circular RNA and Long Non-Coding RNA-Mediated Regulatory Competing Endogenous RNA Networks (ceRNETs) in Ovarian and Cervical Cancers: A Non-Coding RNA-Mediated Mechanism of Chemotherapeutic Resistance with New Emerging Clinical Capacities. Arch. Biochem. Biophys. 2025, 768, 110389. [Google Scholar] [CrossRef]
  71. Liu, S.; Li, X.; Xie, Q.; Zhang, S.; Liang, X.; Li, S.; Zhang, P. Identification of a lncRNA/circRNA-miRNA-mRNA Network in Nasopharyngeal Carcinoma by Deep Sequencing and Bioinformatics Analysis. J. Cancer 2024, 15, 1916–1928. [Google Scholar] [CrossRef]
  72. Farré, P.L.; Duca, R.B.; Massillo, C.; Dalton, G.N.; Graña, K.D.; Gardner, K.; Lacunza, E.; De Siervi, A. MiR-106b-5p: A Master Regulator of Potential Biomarkers for Breast Cancer Aggressiveness and Prognosis. Int. J. Mol. Sci. 2021, 22, 11135. [Google Scholar] [CrossRef] [PubMed]
  73. Elguindy, M.M.; Young, J.S.; Ho, W.S.; Lu, R.O. Co-Evolution of Glioma and Immune Microenvironment. J. Immunother. Cancer 2024, 12, e009175. [Google Scholar] [CrossRef] [PubMed]
  74. J Dabrowski, M.; Wojtas, B. Global DNA Methylation Patterns in Human Gliomas and Their Interplay with Other Epigenetic Modifications. Int. J. Mol. Sci. 2019, 20, 3478. [Google Scholar] [CrossRef] [PubMed]
  75. Aoki, K.; Natsume, A. Overview of DNA Methylation in Adult Diffuse Gliomas. Brain Tumor Pathol. 2019, 36, 84–91. [Google Scholar] [CrossRef]
  76. Chen, S.; Jiang, Y.; Wang, C.; Tong, S.; He, Y.; Lu, W.; Zhang, Z. Epigenetic Clocks and Gliomas: Unveiling the Molecular Interactions between Aging and Tumor Development. Front. Mol. Biosci. 2024, 11, 1446428. [Google Scholar] [CrossRef]
  77. Wei, J.; Chen, P.; Gupta, P.; Ott, M.; Zamler, D.; Kassab, C.; Bhat, K.P.; Curran, M.A.; de Groot, J.F.; Heimberger, A.B. Immune Biology of Glioma-Associated Macrophages and Microglia: Functional and Therapeutic Implications. Neuro Oncol. 2020, 22, 180–194. [Google Scholar] [CrossRef]
  78. Tong, N.; He, Z.; Ma, Y.; Wang, Z.; Huang, Z.; Cao, H.; Xu, L.; Zou, Y.; Wang, W.; Yi, C.; et al. Tumor Associated Macrophages, as the Dominant Immune Cells, Are an Indispensable Target for Immunologically Cold Tumor-Glioma Therapy? Front. Cell Dev. Biol. 2021, 9, 706286. [Google Scholar] [CrossRef]
  79. Hao, J.; Cao, Y.; Yu, H.; Zong, L.; An, R.; Xue, Y. Effect of MAP3K8 on Prognosis and Tumor-Related Inflammation in Renal Clear Cell Carcinoma. Front. Genet. 2021, 12, 674613. [Google Scholar] [CrossRef]
  80. Chiu, C.-Y.; Willis-Owen, S.A.G.; Wong, K.C.C.; Farrow, S.N.; Cookson, W.O.C.; Moffatt, M.F.; Zhang, Y. MAP3K8 Is a Potential Therapeutic Target in Airway Epithelial Inflammation. J. Inflamm. 2024, 21, 27. [Google Scholar] [CrossRef]
  81. Gianì, F.; Russo, G.; Pennisi, M.; Sciacca, L.; Frasca, F.; Pappalardo, F. Computational Modeling Reveals MAP3K8 as Mediator of Resistance to Vemurafenib in Thyroid Cancer Stem Cells. Bioinformatics 2019, 35, 2267–2275. [Google Scholar] [CrossRef]
  82. Kukreja, L.; Li, C.J.; Ezhilan, S.; Iyer, V.R.; Kuo, J.S. Emerging Epigenetic Therapies for Brain Tumors. Neuromol Med. 2022, 24, 41–49. [Google Scholar] [CrossRef] [PubMed]
  83. Lee, D.H.; Ryu, H.-W.; Won, H.-R.; Kwon, S.H. Advances in Epigenetic Glioblastoma Therapy. Oncotarget 2017, 8, 18577–18589. [Google Scholar] [CrossRef] [PubMed]
  84. Govindarajan, V.; Shah, A.H.; Di, L.; Rivas, S.; Suter, R.K.; Eichberg, D.G.; Luther, E.; Lu, V.; Morell, A.A.; Ivan, M.E.; et al. Systematic Review of Epigenetic Therapies for Treatment of IDH-Mutant Glioma. World Neurosurg. 2022, 162, 47–56. [Google Scholar] [CrossRef] [PubMed]
  85. Nowak, N.; Kulma, A.; Gutowicz, J. Up-Regulation of Key Glycolysis Proteins in Cancer Development. Open Life Sci. 2018, 13, 569–581. [Google Scholar] [CrossRef]
  86. Chen, S.; Luo, X.; Wang, W.; Chen, X.-H.; Ma, N.; Zhu, X.-Y.; Zhou, T.; Gao, Q.-J.; Zhao, D.-W. ACTN1 Promotes Cell Invasion, Migration, and EMT in Thyroid Cancer and Is Associated with Immune Infiltration. Sci. Rep. 2024, 14, 32060. [Google Scholar] [CrossRef]
  87. Staszkiewicz, R.; Sobański, D.; Pulka, W.; Gładysz, D.; Gadzieliński, M.; Strojny, D.; Grabarek, B.O. Variances in the Expression Profile of Circadian Clock-Related Genes in Astrocytic Brain Tumors. Cancers 2024, 16, 2335. [Google Scholar] [CrossRef]
  88. Kanehisa, M.; Furumichi, M.; Sato, Y.; Matsuura, Y.; Ishiguro-Watanabe, M. KEGG: Biological Systems Database as a Model of the Real World. Nucleic Acids Res. 2025, 53, D672–D677. [Google Scholar] [CrossRef]
  89. Agarwal, V.; Bell, G.W.; Nam, J.-W.; Bartel, D.P. Predicting Effective microRNA Target Sites in Mammalian mRNAs. eLife 2015, 4, e05005. [Google Scholar] [CrossRef]
  90. Chen, Y.; Wang, X. miRDB: An Online Database for Prediction of Functional microRNA Targets. Nucleic Acids Res. 2020, 48, D127–D131. [Google Scholar] [CrossRef]
  91. Liu, W.; Wang, X. Prediction of Functional microRNA Targets by Integrative Modeling of microRNA Binding and Target Expression Data. Genome Biol. 2019, 20, 18. [Google Scholar] [CrossRef]
  92. Li, L.-C.; Dahiya, R. MethPrimer: Designing Primers for Methylation PCRs. Bioinformatics 2002, 18, 1427–1431. [Google Scholar] [CrossRef] [PubMed]
  93. Szklarczyk, D.; Kirsch, R.; Koutrouli, M.; Nastou, K.; Mehryary, F.; Hachilif, R.; Gable, A.L.; Fang, T.; Doncheva, N.T.; Pyysalo, S.; et al. The STRING Database in 2023: Protein-Protein Association Networks and Functional Enrichment Analyses for Any Sequenced Genome of Interest. Nucleic Acids Res. 2023, 51, D638–D646. [Google Scholar] [CrossRef]
Figure 1. Expression profile of 6 mRNAs related to the TNF-α signaling pathways obtained via RTqPCR. TNF-α, Tumor Necrosis Factor Alpha; IL-1β, Interleukin-1 Beta; TNFRSF1A, Tumor Necrosis Factor Receptor Superfamily Member 1A; TNFRSF1B, Tumor Necrosis Factor Receptor Superfamily Member 1B; MAP3K8, Mitogen-Activated Protein Kinase Kinase Kinase 8; MAP2K7, Mitogen-Activated Protein Kinase Kinase 7.
Ijms 26 05892 g001
Figure 2. The degree of methylation of selected genes in the G2, G3, and G4 astrocytic tumor samples.
Ijms 26 05892 g002
Figure 3. Example of electrophoretic separation of TNF-α and IL-1β in in the G2, G3, and G4 astrocytic tumor samples. TNF-α, Tumor Necrosis Factor Alpha; IL-1β, Interleukin-1 Beta; kDa, kilo Daltons; M, size marker (New England Biolabs Marker).
Ijms 26 05892 g003
Figure 4. Immunochemical expression of TNF-α and IL-1β in the G2, G3, and G4 astrocytic tumor samples. (A) IL-1β expression in a G2 tumor sample; (B) IL-1β in G3; (C) IL-1β in G4; (D) TNF-α expression in G2; (E) TNF-α in G3; (F) TNF-α in G4. Scale bar = 50 µm. TNF-α, Tumor Necrosis Factor Alpha; IL-1β, Interleukin-1 Beta.
Ijms 26 05892 g004
Figure 5. Interaction Network of selected proteins generated using the STRING database. TNF, Tumor Necrosis Factor; IL1B, Interleukin-1 Beta; TNFRSF1A, Tumor Necrosis Factor Receptor Superfamily Member 1A; TNFRSF1B, Tumor Necrosis Factor Receptor Superfamily Member 1B; MAP3K8, Mitogen-Activated Protein Kinase Kinase Kinase 8; MAP2K7, Mitogen-Activated Protein Kinase Kinase 7.
Ijms 26 05892 g005
Figure 6. Kaplan–Meier survival curves comparing patients with high and low IL-1β expression.
Ijms 26 05892 g006
Figure 7. Kaplan–Meier survival curves comparing patients with high and low MAP2K7 expression.
Ijms 26 05892 g007
Figure 8. Kaplan–Meier survival curves comparing patients with high and low MAP3K8 expression.
Ijms 26 05892 g008
Figure 9. Kaplan–Meier survival curves comparing patients with high and low TNF-α expression.
Ijms 26 05892 g009
Figure 10. Kaplan–Meier survival curves comparing patients with high and low TNFRSF1A expression.
Ijms 26 05892 g010
Figure 11. Kaplan–Meier survival curves comparing patients with high and low TNFRSF1B expression.
Ijms 26 05892 g011
Table 1. Expression profile of genes significantly differentiating G3/G4 vs. G2 samples based on microarray analysis.
IDmRNAlog2FC G3 vs. G2log2FC G4 vs. G2
207113_s_atTNF-α5.98 ± 0.348.19 ± 0.33
1563357_at5.89 ± 0.438.76 ± 0.13
39402_atIL-1β5.56 ± 0.567.23 ± 0.98
207643_s_atTNFRSF1A5.09 ± 0.715.56 ± 0.77
203508_atTNFRSF1B5.10 ± 0.815.51 ± 0.98
205027_s_atMAP3K85.11 ± 0.445.87 ± 0.19
235421_at5.14 ± 0.675.67 ± 0.34
209951_s_atMAP2K75.33 ± 0.815.71 ± 0.55
209952_s_at5.43 ± 0.196.03 ± 0.63
216206_x_at5.16 ± 0.346.01 ± 0.76
226023_at5.77 ± 0.815.61 ± 0.99
226053_at5.18 ± 0.185.78 ± 1.01
TNF-α, Tumor Necrosis Factor Alpha; IL-1β, Interleukin-1 Beta; TNFRSF1A, Tumor Necrosis Factor Receptor Superfamily Member 1A; TNFRSF1B, Tumor Necrosis Factor Receptor Superfamily Member 1B; MAP3K8, Mitogen-Activated Protein Kinase Kinase Kinase 8; MAP2K7, Mitogen-Activated Protein Kinase Kinase 7.
Table 2. Expression of miRNAs potentially involved in the regulation of the studied genes.
mRNAmiRNATarget ScoreG3 vs. G2 (FC)G4 vs. G2 (FC)
TNF-αhsa-miR-34a-3p96−2.42 ± 0.71−2.12 ± 0.34
IL-1βhsa-miR-30a-3p83−1.72 ± 0.21−2.87 ± 0.21
hsa-miR-30d-3p−1.88 ± 0.19−2.10 ± 0.19
hsa-miR-30e-3p−3.45 ± 0.33−3.78 ± 0.78
MAP3K8hsa-miR-106b-5p86+1.98 ± 0.18+2.01 ± 0.42
MAP2K7hsa-miR-27b-3p86+1.71 ± 0.51+2.43 ± 0.10
TNF-α, Tumor Necrosis Factor Alpha; IL-1β, Interleukin-1 Beta; MAP3K8, Mitogen-Activated Protein Kinase Kinase Kinase 8; MAP2K7, Mitogen-Activated Protein Kinase Kinase 7.
Table 3. Concentration of TNF-α, IL-1β, TNFRSF1A, TNFRSF1B, MAP3K8, and MAP2K7 protein in astrocytic tumor samples.
ProteinG2G3G4
TNF-α [pg/mL]237.89 ± 19.12376.12 ± 21.87 *381.91 ± 23.98 *
IL-1β [pg/mL]67.12 ± 8.1989.91 ± 10.41 *100.12 ± 12.56 *
TNFRSF1A [ng/mL]1.23 ± 0.111.45 ± 0.091.76 ± 0.23
TNFRSF1B [ng/mL]0.98 ± 0.121.34 ± 0.221.50 ± 0.19
MAP3K8 [ng/mL]13.98 ± 0.9818.71 ± 1.2319.18 ± 1.34
MAP2K7 [ng/mL]17.18 ± 1.7818.98 ± 2.7118.45 ± 2.09
TNF-α, Tumor Necrosis Factor Alpha; IL-1β, Interleukin-1 Beta; TNFRSF1A, Tumor Necrosis Factor Receptor Superfamily Member 1A; TNFRSF1B, Tumor Necrosis Factor Receptor Superfamily Member 1B; MAP3K8, Mitogen-Activated Protein Kinase Kinase Kinase 8; MAP2K7, Mitogen-Activated Protein Kinase Kinase 7; * p < 0.05 vs. G2.
Table 4. Nucleotide sequence of primers used in RTqPCR.
mRNART-qPCR Amplification Primers (5′-3′)
TNF-αForward: AGGACCAGCTAAGAGGGAGA
Reverse: CCCGGATCATGCTTTCAGTG
IL-1βForward: GGAGAATGACCTGAGCACCT
Reverse: GGAGGTGGAGAGCTTTCAGT
TNFRSF1AForward: GCTGTACCAAGTGCCACAAA
Reverse: CTCCACCTGACCCATTTCCT
TNFRSF1BForward: TTGTGTCTGCGTCTGTGTTG
Reverse: GCTACACTGGTTTCCCCTCT
MAP3K8Forward: GGCCATTCAACCAAAGCAGA
Reverse: GGTTTCTCTCCAGGGAAGCT
MAP2K7Forward: GGGACGTTCATCACCAACAC
Reverse: CTTCAGGTAGTACAGCGCCT
ACTBForward: TCACCCACACTGTGCCCATCTACGA
Reverse: CAGCGGAACCGCTCATTGCCAATGG
GAPDHForward: GGCCAGATCCTGTCCAAGC
Reverse: GTGGGTTTCCACCATTAGCAC
TNF-α, Tumor Necrosis Factor Alpha; IL-1β, Interleukin-1 Beta; TNFRSF1A, Tumor Necrosis Factor Receptor Superfamily Member 1A; TNFRSF1B, Tumor Necrosis Factor Receptor Superfamily Member 1B; MAP3K8, Mitogen-Activated Protein Kinase Kinase Kinase 8; MAP2K7, Mitogen-Activated Protein Kinase Kinase 7; ACTB, beta actin; GAPDH, glyceraldehyde-3-phosphate dehydrogenase.
Table 5. Characteristics of primers designed for the MSP.
mRNAM/UNCBI Reference SequenPrimers (5′-3′)
TNF-αMNM_000594.4Forward: GAGTATTGAAAGTATGATTCGGGAC
Reverse: CAAAATACAACAAACAAAAAAACGTA
UForward: GTATTGAAAGTATGATTTGGGATGT
Reverse: AAAATACAACAAACAAAAAAACATA
IL-1βMNM_000576Forward: ATAGTAAGGGTTTTAGGTAGGTCGC
Reverse: CGAAACGTACAATTCAATAATCGTA
UForward: AGTAAGGGTTTTAGGTAGGTTGTGT
Reverse: CCAAAACATACAATTCAATAATCATA
TNFRSF1AMNM_001065.4Forward: GAGGCGTAATATAGTATGTTGGC
Reverse: TCATCTAAAAAAACTAAACGCGAA
UForward: GAGGTGTAATATAGTATGTTGGTGA
Reverse: ACCTCATCTAAAAAAACTAAACACAAA
TNFRSF1BMNM_001066.3Forward: GTTGAGTAAGTAGGAGGGGTGTC
Reverse: ACTCCGAATAAAAAACGTAAACGTA
UForward: GTTGAGTAAGTAGGAGGGGTGTT
Reverse: ACTCCAAATAAAAAACATAAACATA
MAP3K8MNM_005204.4Forward: TCGTCGGATTTTAGTGGTTC
Reverse: AAAAATTACATCTACGACCTTAACG
UForward: TGTTGGATTTTAGTGGTTTG
Reverse: AAATTACATCTACAACCTTAACACT
MAP2K7MNM_001297555.2Forward: GTATTTTGGGTAAGATGATAGTGGC
Reverse: CTTAACTTTAAAATCCACCAAACGA
UForward: TATTTTGGGTAAGATGATAGTGGTG
Reverse: TTAACTTTAAAATCCACCAAACAAC
M, primers designed for methylated sequences; U, primers designed for non-methylated sequence; TNF-α, Tumor Necrosis Factor Alpha; IL-1β, Interleukin-1 Beta; TNFRSF1A, Tumor Necrosis Factor Receptor Superfamily Member 1A; TNFRSF1B, Tumor Necrosis Factor Receptor Superfamily Member 1B; MAP3K8, Mitogen-Activated Protein Kinase Kinase Kinase 8; MAP2K7, Mitogen-Activated Protein Kinase Kinase 7.
Disclaimer/Publisher’s Note: The statements, opinions and data contained in all publications are solely those of the individual author(s) and contributor(s) and not of MDPI and/or the editor(s). MDPI and/or the editor(s) disclaim responsibility for any injury to people or property resulting from any ideas, methods, instructions or products referred to in the content.

