
Elucidating Regulatory Mechanisms of Genes Involved in Pathobiology of Sjögren’s Disease: Immunostimulation Using a Cell Culture Model
 , and
, and
Abstract
1. Introduction
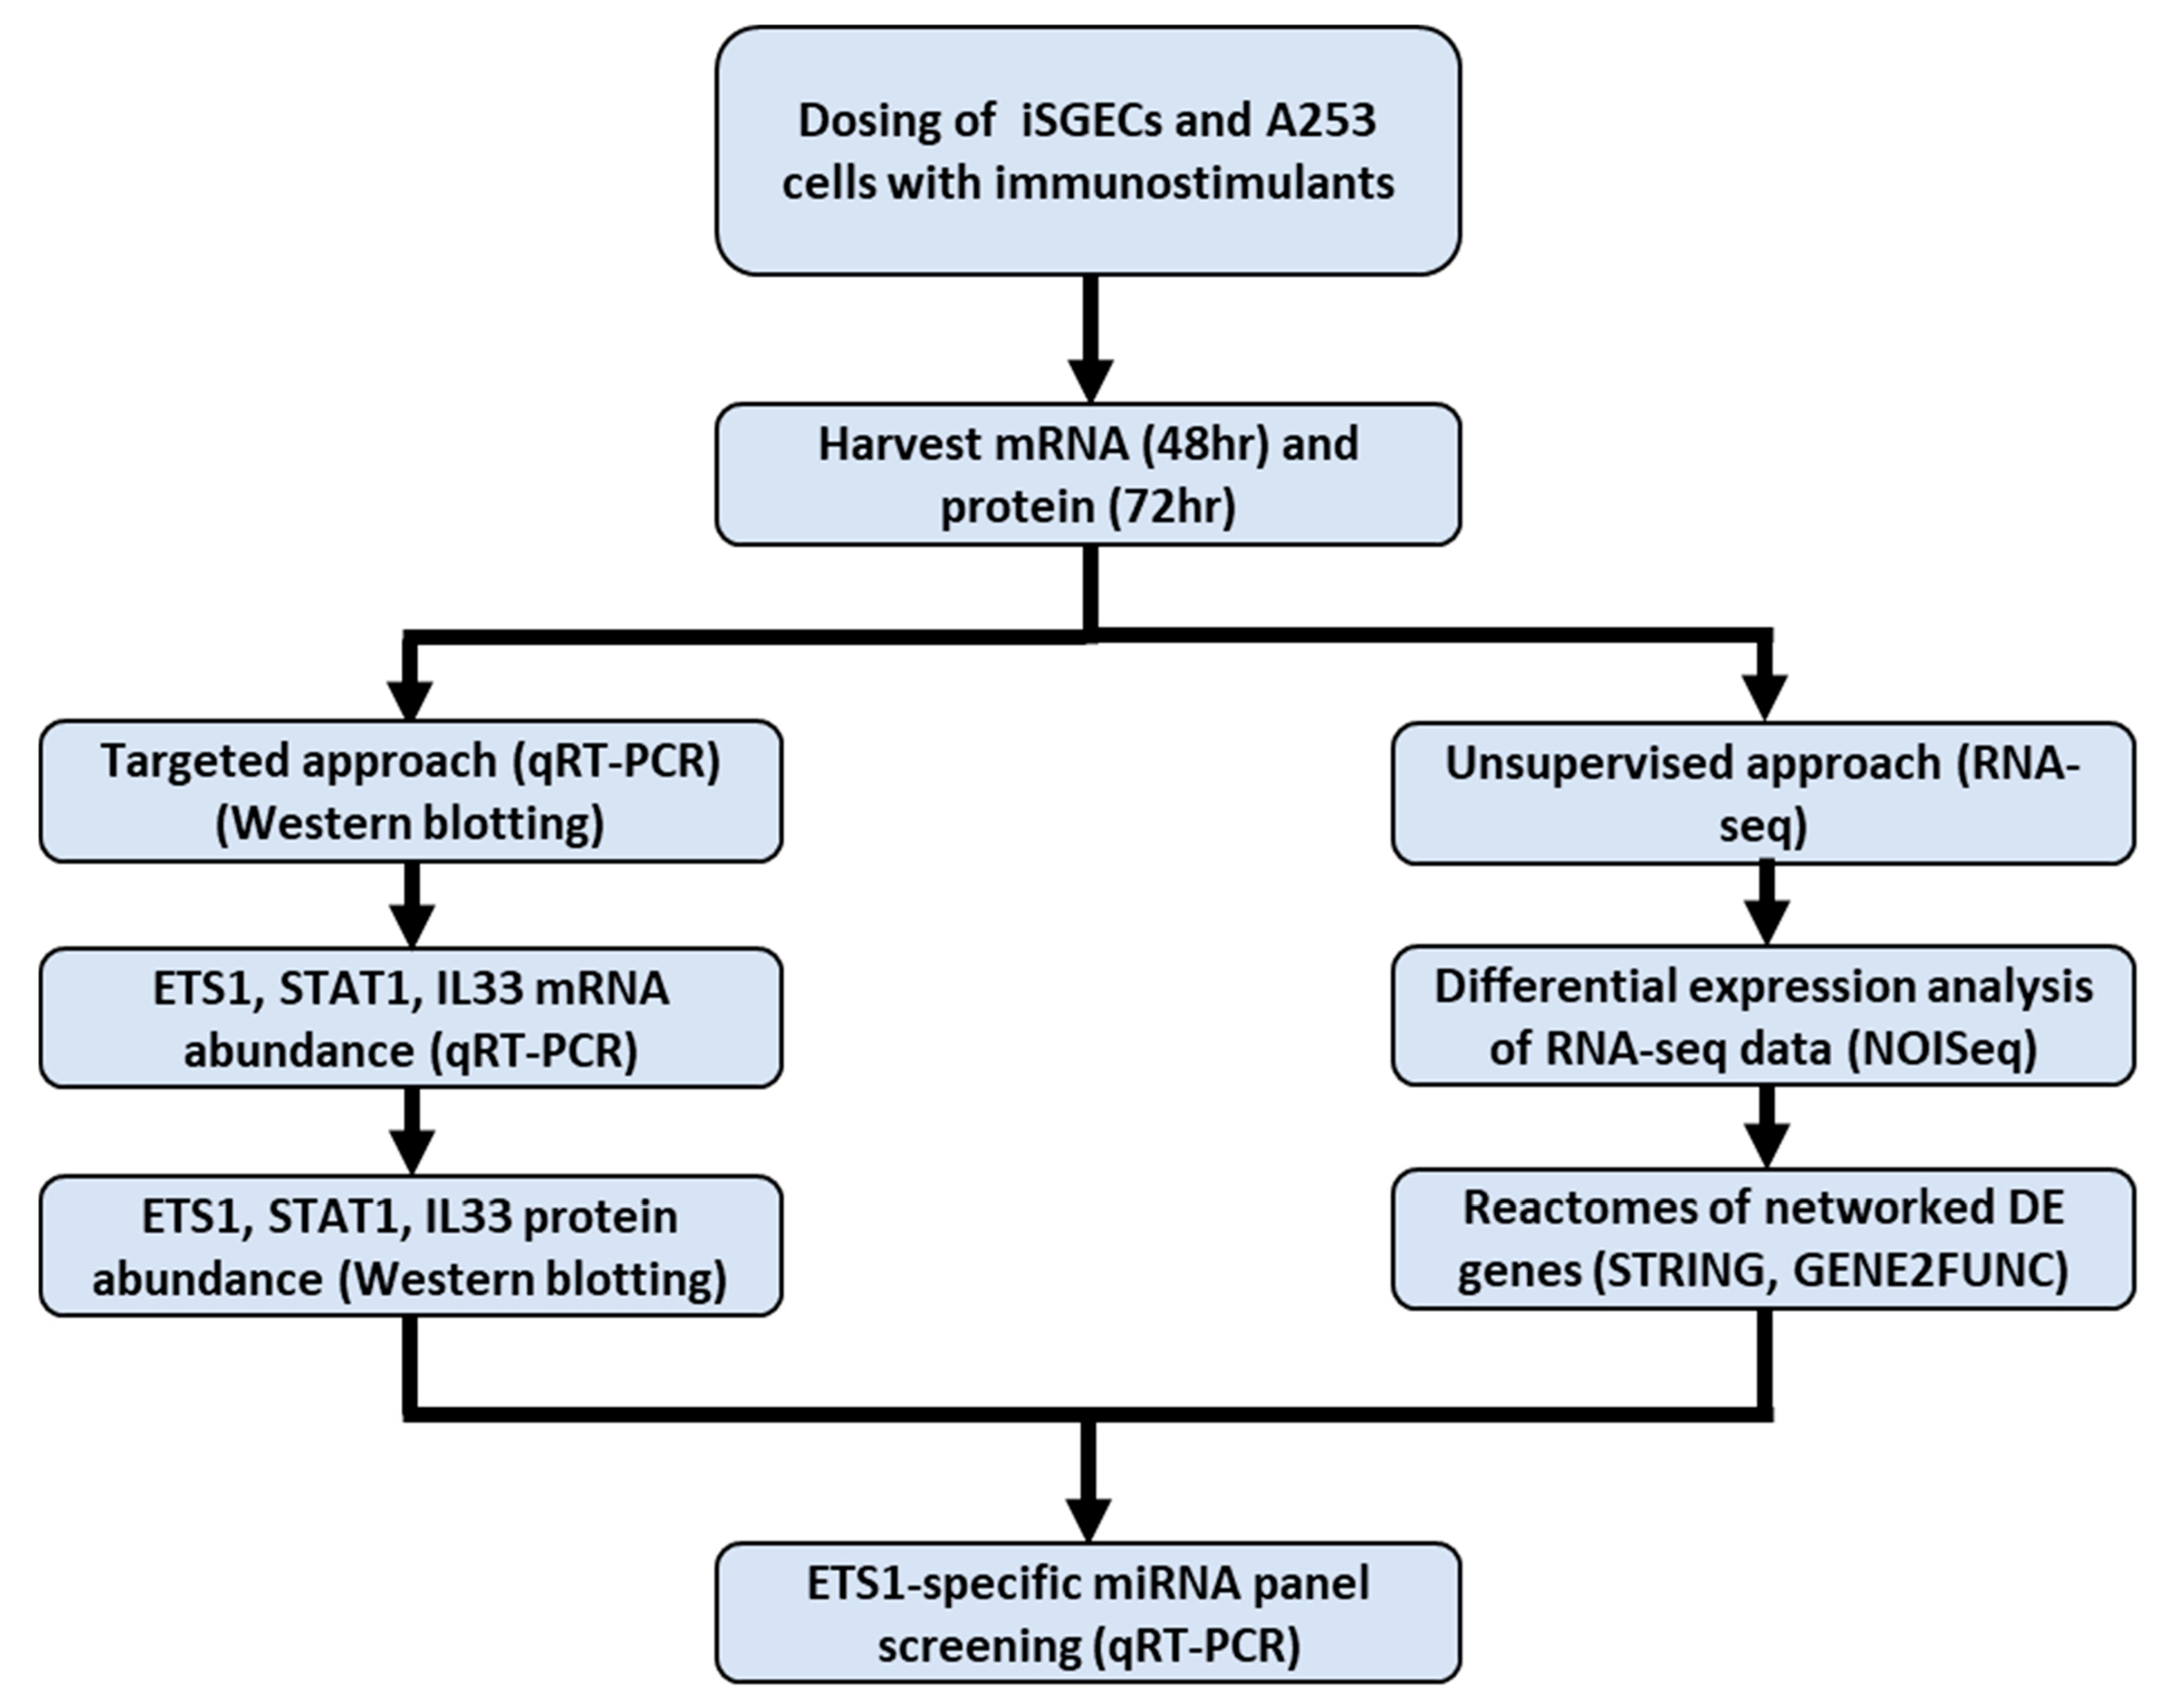
2. Results
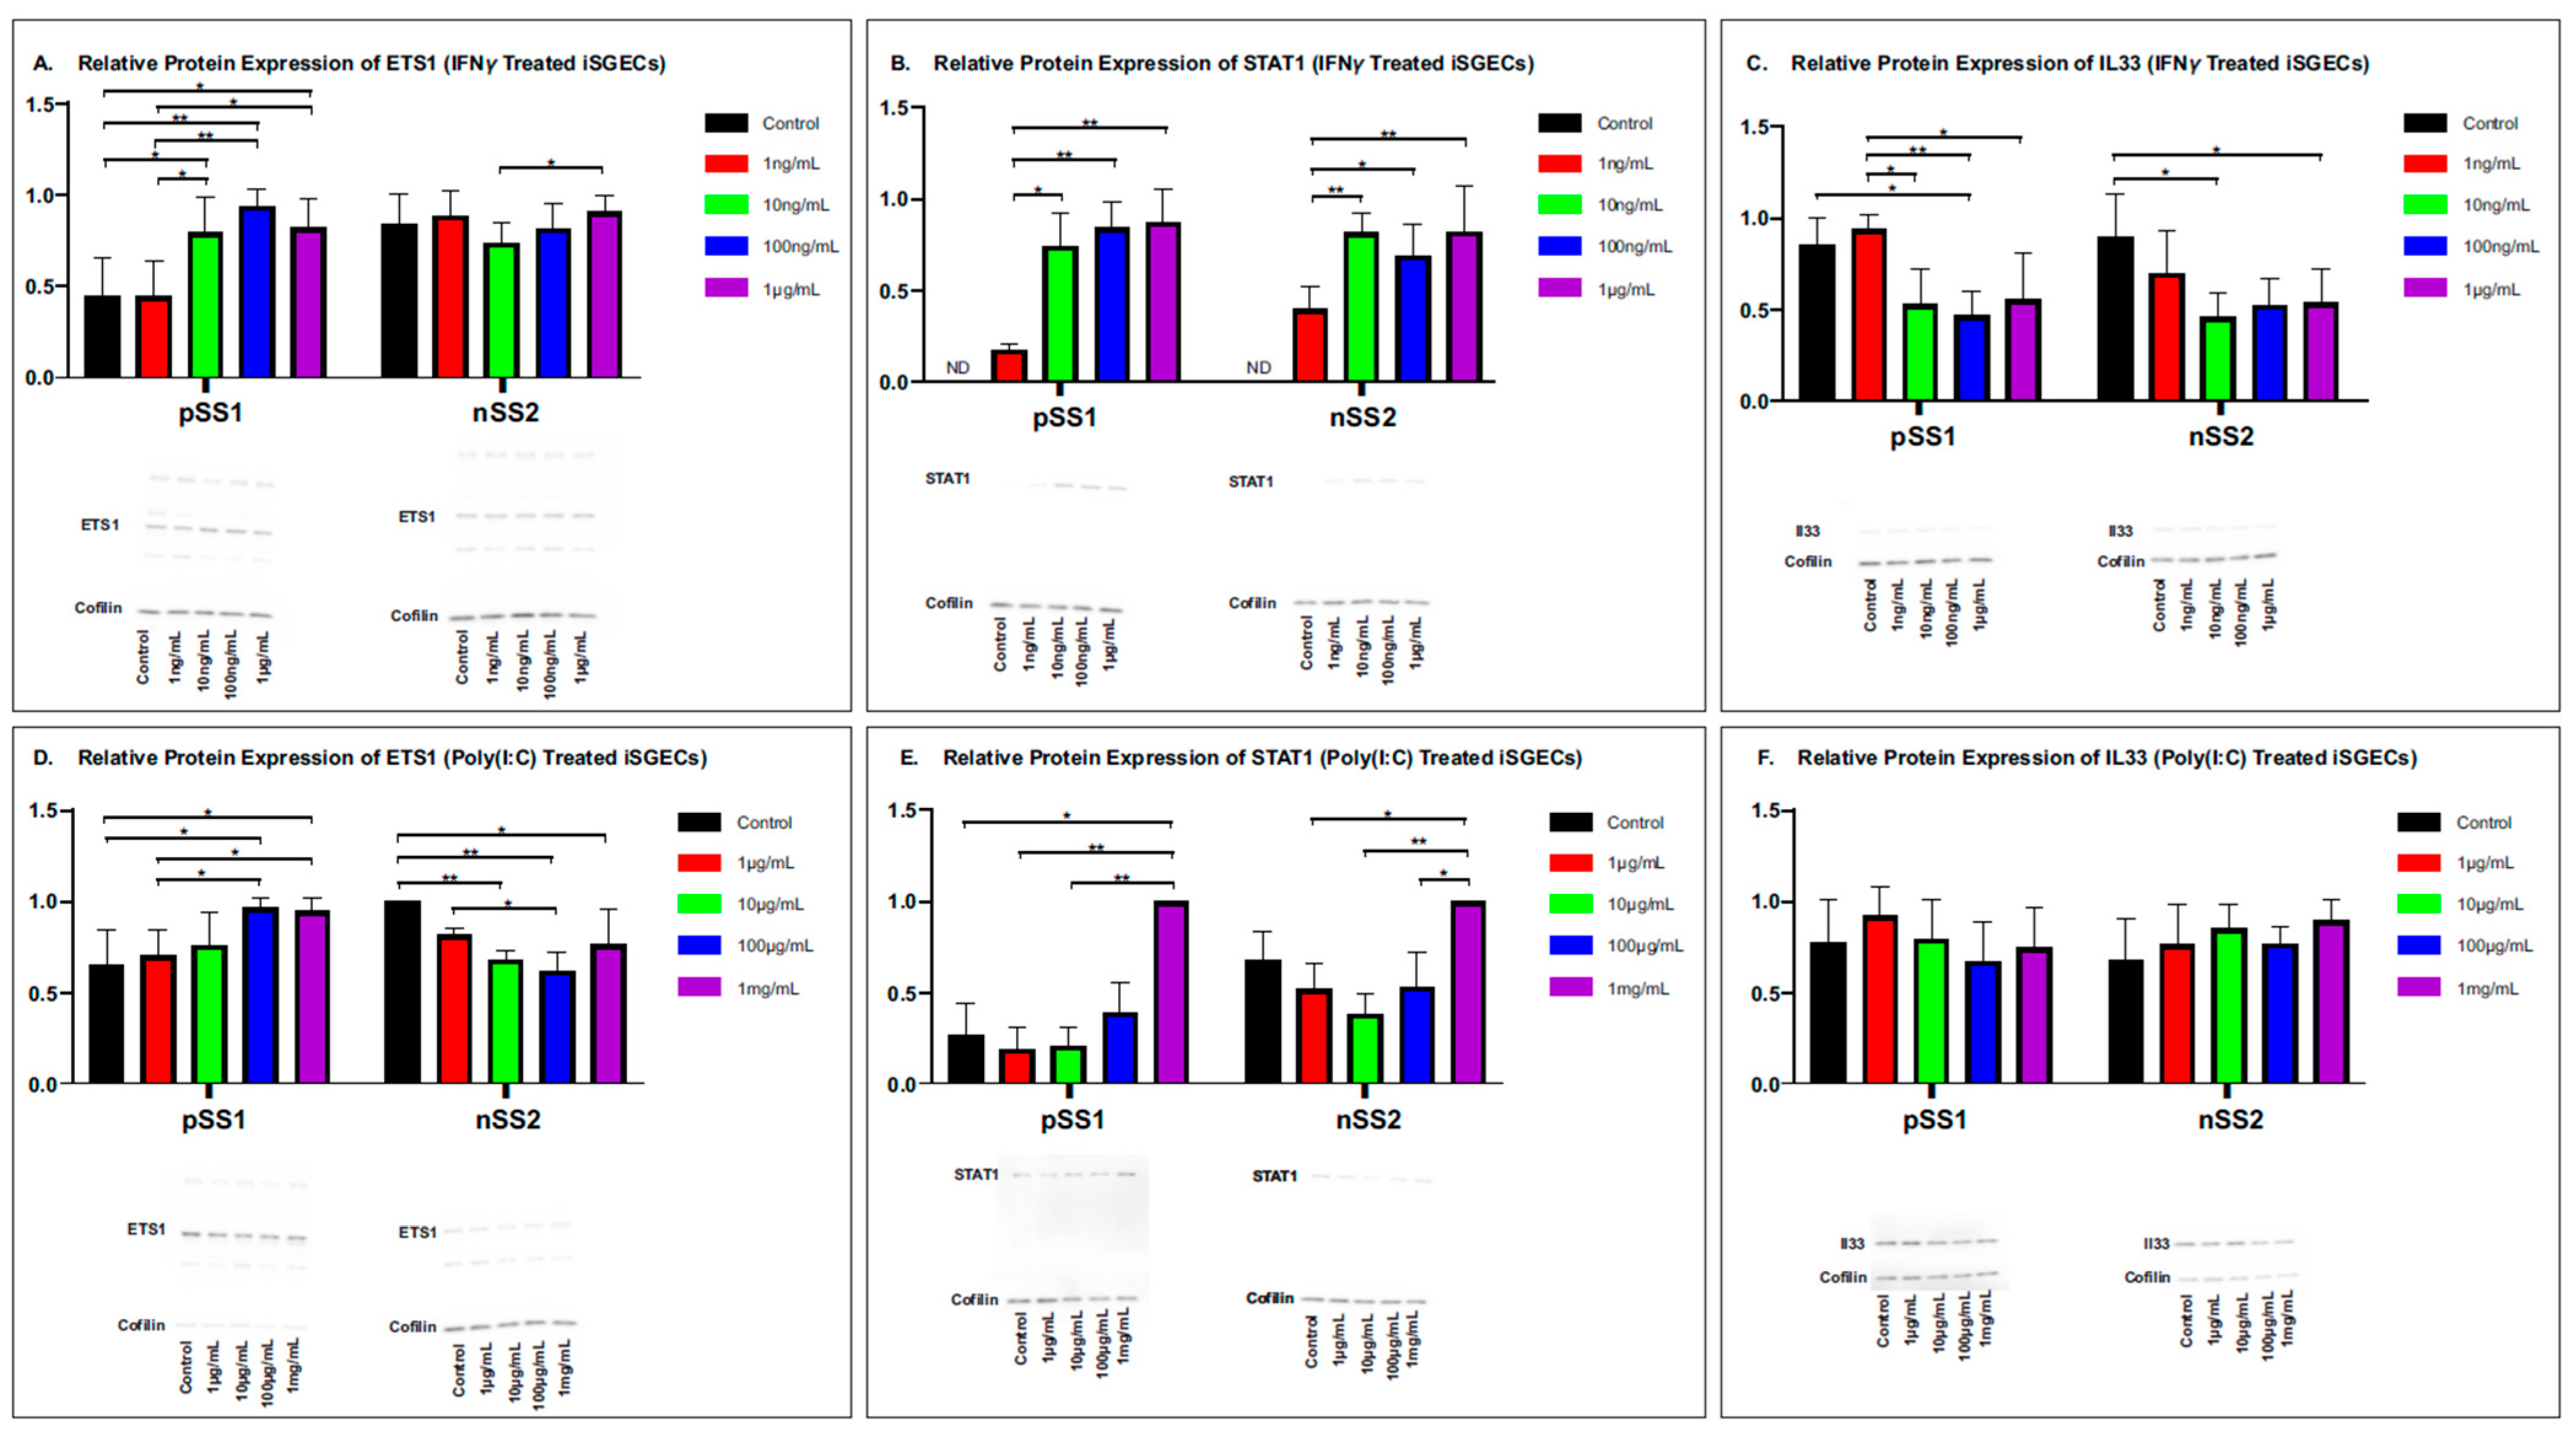
2.1. Targeted Approach: SjD Pathogenesis Markers ETS1, STAT1, and IL33 Abundance in Immunostimulated iSGECs
2.2. ETS1, STAT1, IL33 Relative Protein Abundance in Immunostimulated iSGECs
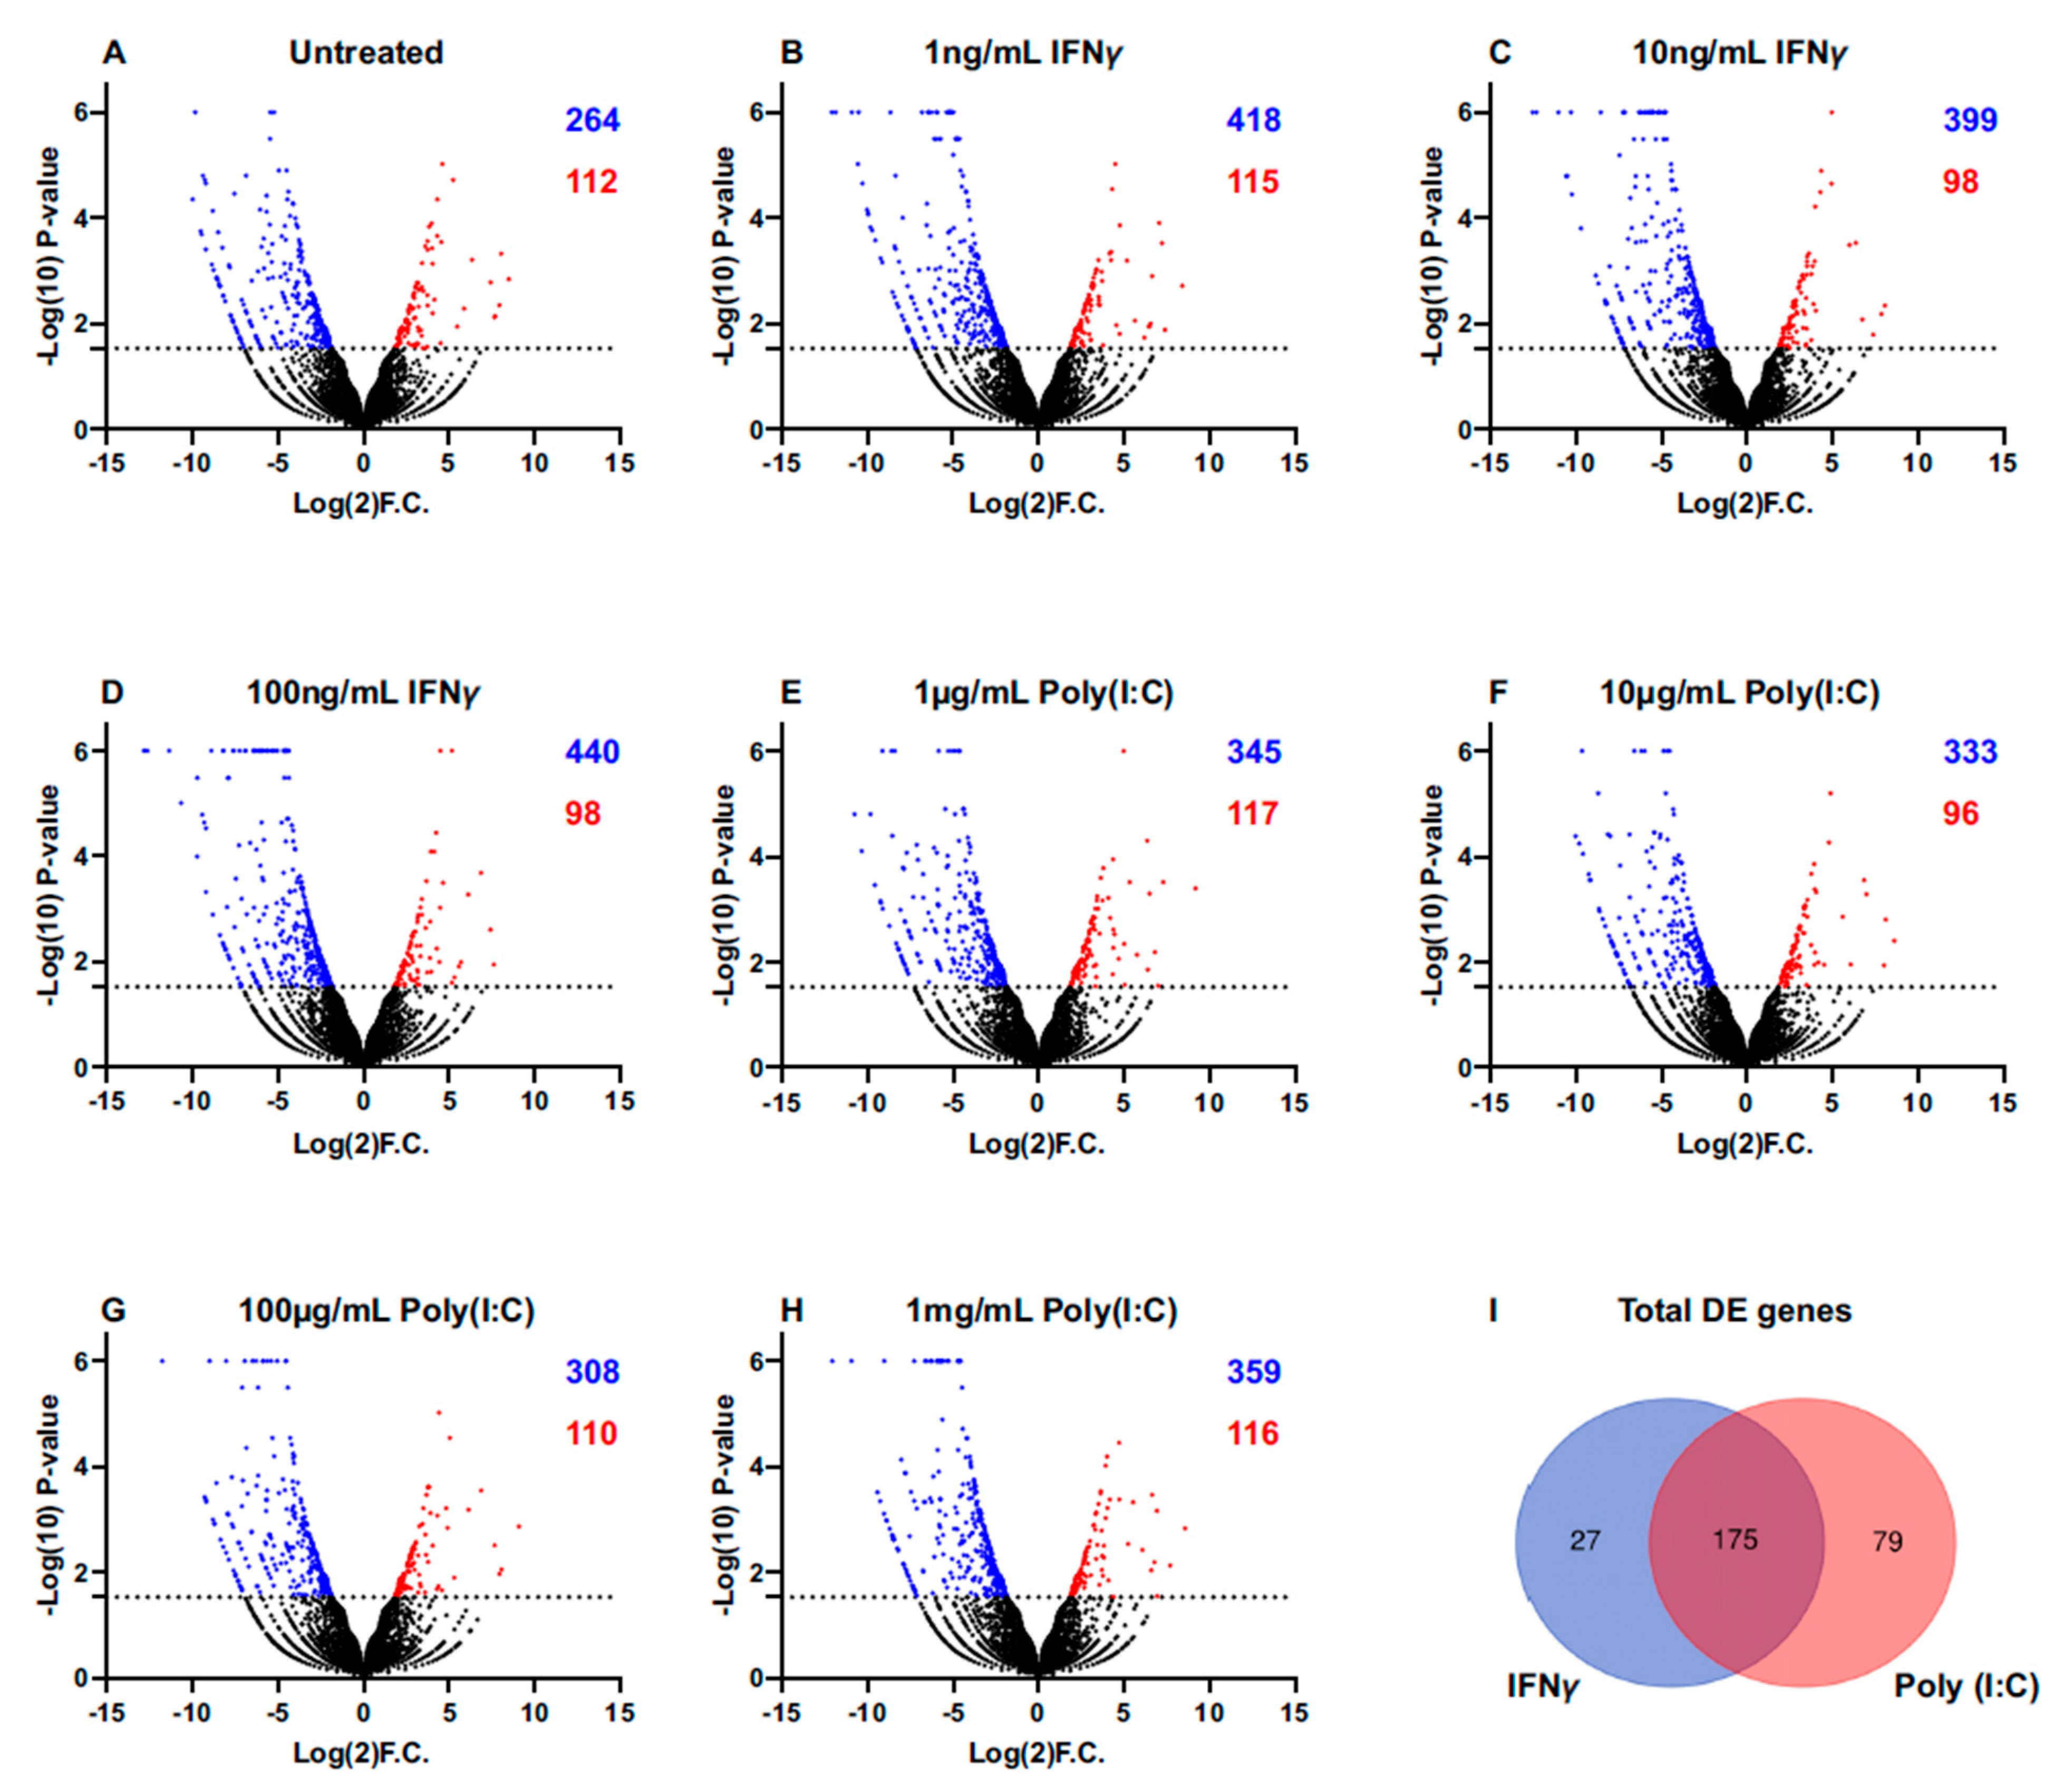
2.3. Unsupervised Approach: RNA-Seq of Immunostimulated iSGECs
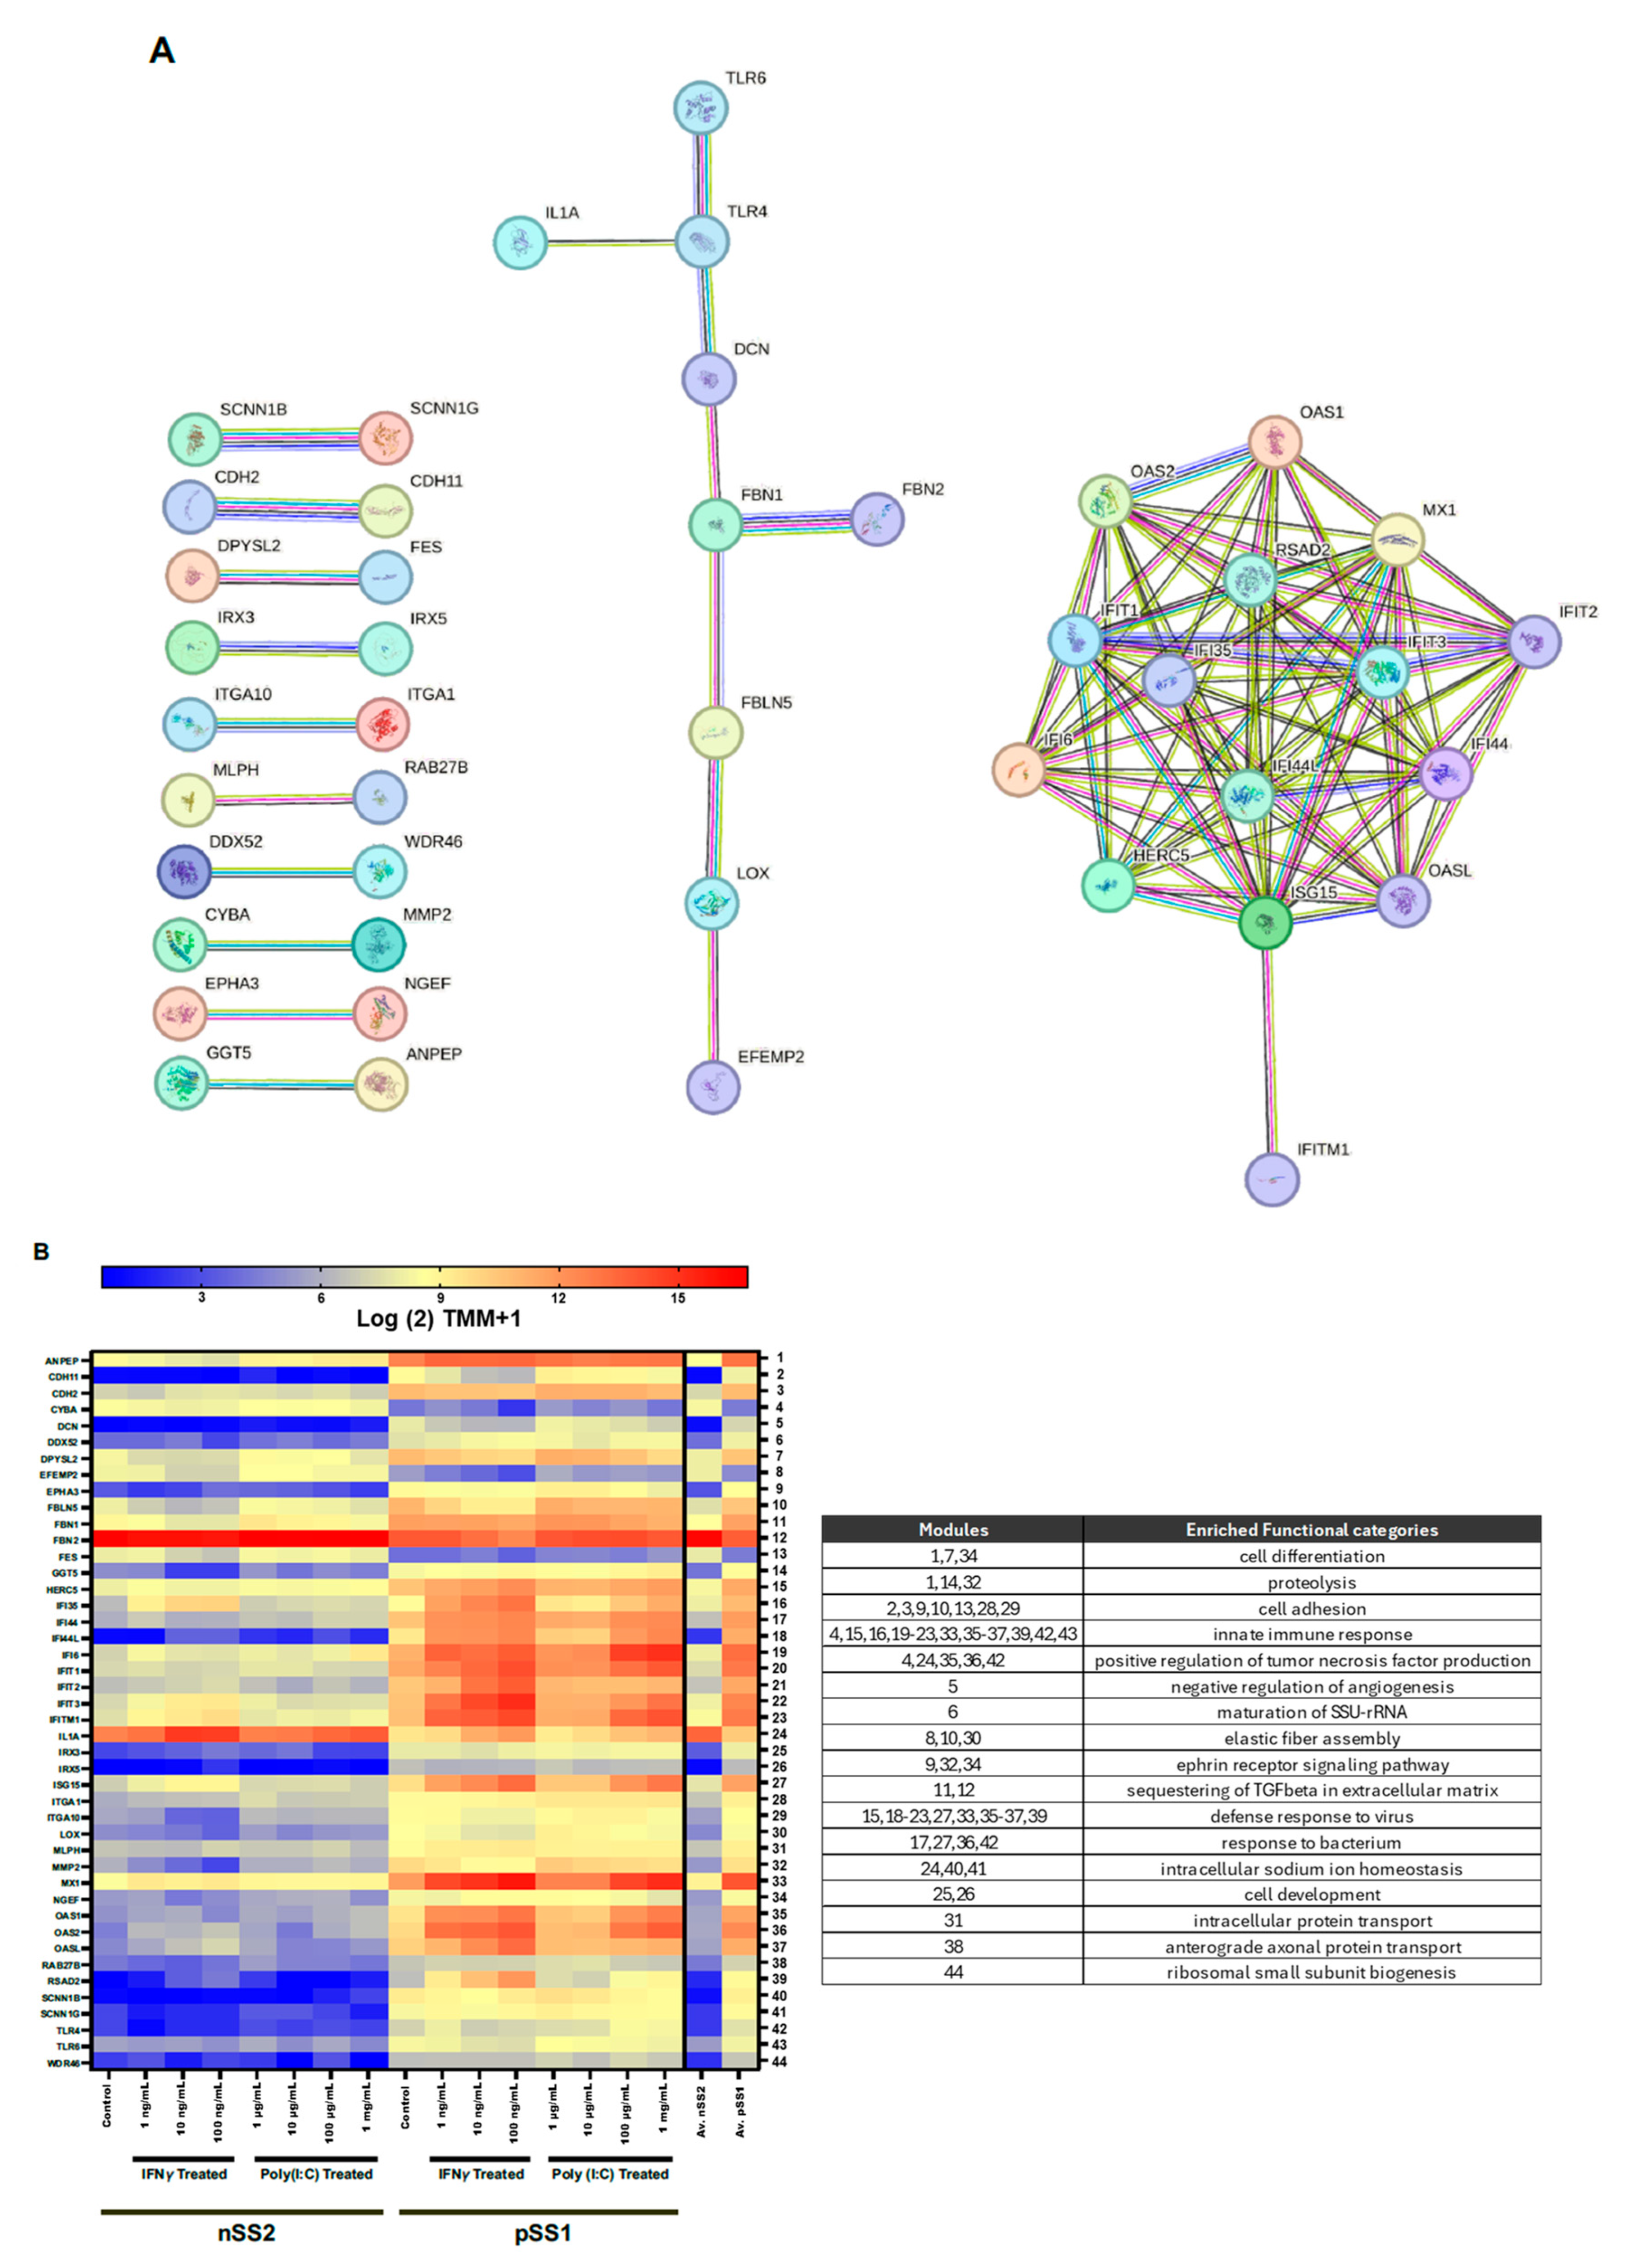
2.4. Reactome Identification of Conserved DE Genes
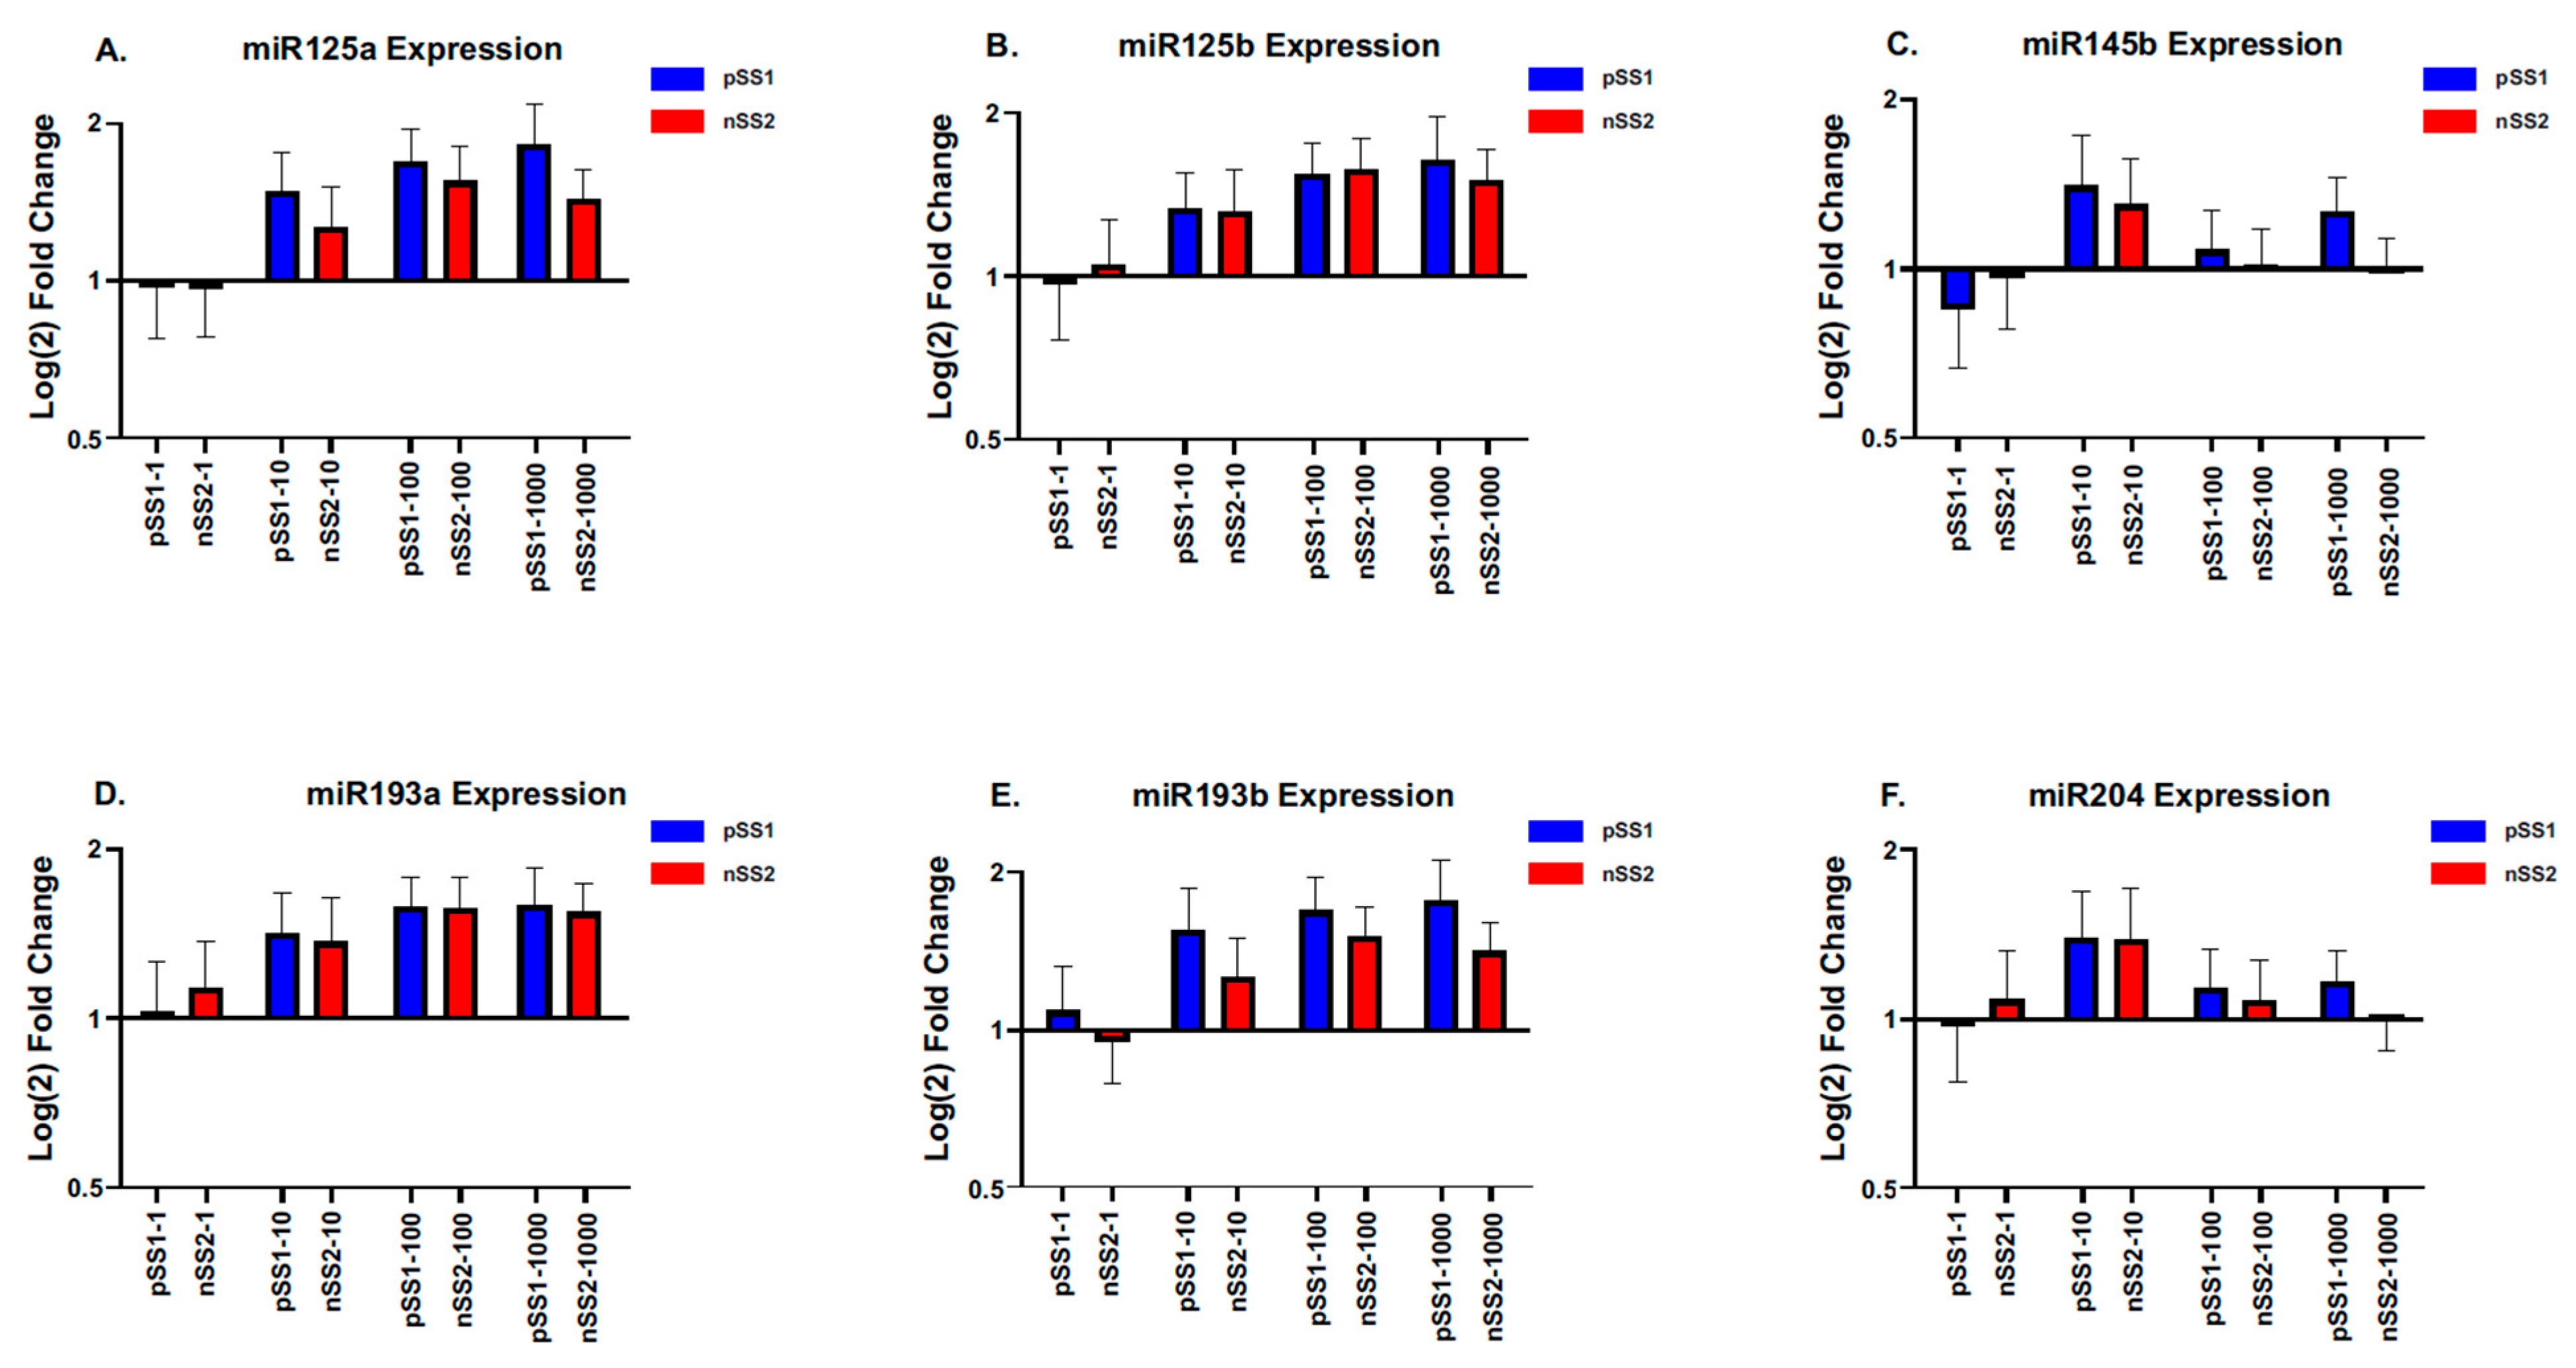
2.5. Screening of a Panel of miRNAs to Determine the Effects on ETS1 Expression in iSGECs Dosed with Immunostimulators
3. Discussion
4. Materials and Methods
4.1. Cell Cultures and Response Curves to Immunostimulators
4.2. qRT-PCR and Reference-Based RNA-Seq
4.3. Semi-Quantitative Western Blotting
4.4. Statistical Analysis
5. Conclusions
Supplementary Materials
Author Contributions
Funding
Institutional Review Board Statement
Informed Consent Statement
Data Availability Statement
Acknowledgments
Conflicts of Interest
References
- Carsons, S.E.; Patel, B.C. Sjogren Syndrome. In StatPearls; StatPearls Publishing: Treasure Island, FL, USA, 2022. Available online: https://www.ncbi.nlm.nih.gov/books/NBK431049/ (accessed on 1 August 2022).
- Tarn, J.; Lendrem, D.; McMeekin, P.; Lendrem, C.; Hargreaves, B.; Ng, W.F. Primary Sjögren’s syndrome: Longitudinal real-world, observational data on health-related quality of life. J. Intern. Med. 2022, 291, 849–855. [Google Scholar] [CrossRef]
- Both, T.; Dalm, V.A.; van Hagen, P.M.; van Daele, P.L. Reviewing primary Sjögren’s syndrome: Beyond the dryness—From pathophysiology to diagnosis and treatment. Int. J. Med. Sci. 2017, 14, 191–200. [Google Scholar] [CrossRef]
- McCoy, S.S.; Sampene, E.; Baer, A.N. Association of Sjögren’s Syndrome With Reduced Lifetime Sex Hormone Exposure: A Case-Control Study. Arthritis Care Res. 2020, 72, 1315–1322. [Google Scholar] [CrossRef] [PubMed]
- Parisis, D.; Chivasso, C.; Perret, J.; Soyfoo, M.S.; Delporte, C. Current State of Knowledge on Primary Sjögren’s Syndrome, an Autoimmune Exocrinopathy. J. Clin. Med. 2020, 9, 2299. [Google Scholar] [CrossRef]
- Chen, Q.; Zhou, X.; Tan, W.; Zhang, M. Association between Helicobacter pylori infection and Sjögren syndrome: A meta-analysis. Medicine 2018, 97, e13528. [Google Scholar] [CrossRef] [PubMed]
- Sanosyan, A.; Daien, C.; Nutz, A.; Bollore, K.; Bedin, A.-S.; Morel, J.; Zimmermann, V.; Nocturne, G.; Peries, M.; Guigue, N.; et al. Discrepancy of Serological and Molecular Patterns of Circulating Epstein-Barr Virus Reactivation in Primary Sjögren’s Syndrome. Front. Immunol. 2019, 10, 1153. [Google Scholar] [CrossRef]
- Maslinska, M.; Kostyra-Grabczak, K. The role of virus infections in Sjögren’s syndrome. Front. Immunol. 2022, 13, 823659. [Google Scholar] [CrossRef] [PubMed]
- Pérez, P.; Goicovich, E.; Alliende, C.; Aguilera, S.; Leyton, C.; Molina, C.; Pinto, R.; Romo, R.; Martinez, B.; González, M.J. Differential expression of matrix metalloproteinases in labial salivary glands of patients with primary Sjögren’s syndrome. Arthritis Rheum. 2000, 43, 2807–2817. [Google Scholar] [CrossRef]
- Fox, R.I.; Fox, C.M.; Gottenberg, J.E.; Dörner, T. Treatment of Sjögren’s syndrome: Current therapy and future directions. Rheumatology 2021, 60, 2066–2074. [Google Scholar] [CrossRef]
- Srivastava, A.; Makarenkova, H.P. Innate Immunity and Biological Therapies for the Treatment of Sjögren’s Syndrome. Int. J. Mol. Sci. 2020, 21, 9172. [Google Scholar] [CrossRef]
- Busamia, B.; Gonzalez-Moles, M.A.; Ruiz-Avila, I.; Brunotto, M.; Gil-Montoya, J.A.; Bravo, M.; Gobbi, C.; Finkelberg, A. Cell apoptosis and proliferation in salivary glands of Sjögren’s syndrome. J. Oral. Pathol. Med. 2011, 40, 721–725. [Google Scholar] [CrossRef] [PubMed]
- Kaneko, N.; Chen, H.; Perugino, C.A.; Maehara, T.; Munemura, R.; Yokomizo, S.; Sameshima, J.; Diefenbach, T.J.; Premo, K.R.; Chinju, A.; et al. Cytotoxic CD8+ T cells may be drivers of tissue destruction in Sjögren’s syndrome. Sci. Rep. 2022, 12, 15427. [Google Scholar] [CrossRef] [PubMed]
- Zhou, J.; Zhang, X.; Yu, Q. Plasmacytoid dendritic cells promote the pathogenesis of Sjögren’s syndrome. Biochim. Et. Biophys. Acta (BBA)—Mol. Basis Disease. 2022, 1868, 166302. [Google Scholar] [CrossRef]
- Verstappen, G.M.; Pringle, S.; Bootsma, H.; Kroese, F.G.M. Epithelial-immune cell interplay in primary Sjögren syndrome salivary gland pathogenesis. Nat. Rev. Rheumatol. 2021, 17, 333–348. [Google Scholar] [CrossRef]
- Segerberg-Konttinen, M.; Konttinen, Y.T.; Bergroth, V. Focus score in the diagnosis of Sjögren’s syndrome. Scand. J. Rheumatol. Suppl. 1986, 61, 47–51. [Google Scholar] [CrossRef]
- Quartuccio, L.; Baldini, C.; Bartoloni, E.; Priori, R.; Carubbi, F.; Corazza, L.; Alunno, A.; Colafrancesco, S.; Luciano, N.; Giacomelli, R.; et al. Anti-SSA/SSB-negative Sjögren’s syndrome shows a lower prevalence of lymphoproliferative manifestations, and a lower risk of lymphoma evolution. Autoimmun Rev. 2015, 14, 1019–1022. [Google Scholar] [CrossRef] [PubMed]
- Shiboski, C.H.; Baer, A.N.; Shiboski, S.C.; Lam, M.; Challacombe, S.; Lanfranchi, H.E.; Schiødt, M.; Shirlaw, P.; Srinivasan, M.; Umehara, H.; et al. Natural History and Predictors of Progression to Sjögren’s Syndrome Among Participants of the Sjögren’s International Collaborative Clinical Alliance Registry. Arthritis Care Res. 2018, 70, 284–294. [Google Scholar] [CrossRef]
- Neumann, M.; Quintero, J.; Shih, T.; Capitle, E.M. Not all Sicca is Sjögren’s and not all Sjögren’s is Sicca. Cureus 2021, 13, e12996. [Google Scholar] [CrossRef]
- Bharaj, T.K.; Aqrawi, L.A.; Fromreide, S.; Jonsson, R.; Brun, J.G.; Appel, S.; Skarstein, K. Inflammatory Stratification in Primary Sjögren’s Syndrome Reveals Novel Immune Cell Alterations in Patients’ Minor Salivary Glands. Front Immunol. 2021, 12, 701581. [Google Scholar] [CrossRef]
- Asatsuma, M.; Ito, S.; Watanabe, M.; Takeishi, H.; Nomura, S.; Wada, Y.; Nakano, M.; Gejyo, F.; Igarashi, A. Increase in the ratio of matrix metalloproteinase-9 to tissue inhibitor of metalloproteinase-1 in saliva from patients with primary Sjögren’s syndrome. Clin. Chim. Acta. 2004, 345, 99–104. [Google Scholar] [CrossRef]
- Soyfoo, M.S.; Nicaise, C. Pathophysiologic role of Interleukin-33/ST2 in Sjögren’s syndrome. Autoimmun Rev. 2021, 20, 102756. [Google Scholar] [CrossRef] [PubMed]
- Khatri, B.; Tessneer, K.L.; Rasmussen, A.; Aghakhanian, F.; Reksten, T.R.; Adler, A.; Alevizos, I.; Anaya, J.-M.; Aqrawi, L.A.; Baecklund, E.; et al. Genome-wide association study identifies Sjögren’s risk loci with functional implications in immune and glandular cells. Nat. Commun. 2022, 27, 13. [Google Scholar]
- Liew, F.Y.; Girard, J.-P.; Turnquist, H.R. Interleukin-33 in health and disease. Nat. Rev. Immunology. 2016, 16, 676–689. [Google Scholar] [CrossRef]
- Noll, B.; Mougeot, F.B.; Brennan, M.T.; Mougeot, J.C. Regulation of MMP9 transcription by ETS1 in immortalized salivary gland epithelial cells of patients with salivary hypofunction and primary Sjögren’s syndrome. Sci. Rep. 2022, 12, 14552. [Google Scholar] [CrossRef]
- Nguyen, J.; Knapnougel, P.; Lesavre, P.; Bauvois, B. Inhibition of matrix metalloproteinase-9 by interferons and TGF-beta1 through distinct signalings accounts for reduced monocyte invasiveness. FEBS Lett. 2005, 579, 5487–5493. [Google Scholar] [CrossRef]
- Shah, N.R.; Noll, B.D.; Stevens, C.B.; Brennan, M.T.; Mougeot, F.B.; Mougeot, J.C. Biosemantics guided gene expression profiling of Sjögren’s syndrome: A comparative analysis with systemic lupus erythematosus and rheumatoid arthritis. Arthritis Res Ther. 2017, 19, 192. [Google Scholar] [CrossRef]
- Shah, N.R.; Noll, B.D.; Padilla, R.J.; Brennan, M.T.; Mougeot, F.B.; Mougeot, J.C. Expression of ETS1 and LEF1 in salivary glands of Sjögren syndrome patients. Oral Dis. 2019, 25, 164–173. [Google Scholar] [CrossRef] [PubMed]
- Findlay, V.J.; LaRue, A.C.; Turner, D.P.; Watson, P.M.; Watson, D.K. Understanding the role of ETS-mediated gene regulation in complex biological processes. Adv. Cancer Res. 2013, 119, 1–61. [Google Scholar] [CrossRef]
- Zhang, Y.; Yan, L.-X.; Wu, Q.-N.; Du, Z.-M.; Chen, J.; Liao, D.-Z.; Huang, M.-Y.; Hou, J.-H.; Wu, Q.-L.; Zeng, M.-S.; et al. Mir-125B is methylated and functions as a tumor suppressor by regulating the ETS1 proto-oncogene in human invasive breast cancer. Cancer Res. 2011, 71, 3552–3562. [Google Scholar] [CrossRef]
- Xu, C.; Liu, S.; Fu, H.; Li, S.; Tie, Y.; Zhu, J.; Xing, R.; Jin, Y.; Sun, Z.; Zheng, X. MicroRNA-193B regulates proliferation, migration and invasion in human hepatocellular carcinoma cells. Eur. J. Cancer 2010, 46, 2828–2836. [Google Scholar] [CrossRef]
- Larsson, E.; Fuchs, P.F.; Heldin, J.; Barkefors, I.; Bondjers, C.; Genové, G.; Arrondel, C.; Gerwins, P.; Kurschat, C.; Schermer, B.; et al. Discovery of microvascular mirnas using public gene expression data: Mir-145 is expressed in pericytes and is a regulator of FLI1. Genome Med. 2009, 1, 108. [Google Scholar] [CrossRef] [PubMed]
- Meephansan, J.; Tsuda, H.; Komine, M.; Tominaga, S.; Ohtsuki, M. Regulation of IL-33 expression by IFN-γ and tumor necrosis factor-α in normal human epidermal keratinocytes. J. Investig. Dermatol. 2012, 132, 2593–2600. [Google Scholar] [CrossRef] [PubMed]
- Millar, N.L.; Gilchrist, D.S.; Akbar, M.; Reilly, J.H.; Kerr, S.C.; Campbell, A.L.; Murrell, G.A.C.; Liew, F.Y.; Kurowska-Stolarska, M.; McInnes, I.B. Microrna29a regulates il-33-mediated tissue remodelling in tendon disease. Nat. Commun. 2015, 6, 6774. [Google Scholar] [CrossRef] [PubMed]
- Sembler-Møller, M.L.; Belstrøm, D.; Locht, H.; Pedersen, A.M.L. Distinct microRNA expression profiles in saliva and salivary gland tissue differentiate patients with primary Sjögren’s syndrome from non-Sjögren’s sicca patients. J. Oral Pathol. Med. 2020, 49, 1044–1052. [Google Scholar] [CrossRef]
- Theander, E.; Jonsson, R.; Sjöström, B.; Brokstad, K.; Olsson, P.; Henriksson, G. Prediction of Sjögren’s Syndrome Years Before Diagnosis and Identification of Patients With Early Onset and Severe Disease Course by Autoantibody Profiling. Arthritis Rheumatol. 2015, 67, 2427–2436. [Google Scholar] [CrossRef]
- Yan, K.; Liu, P.; Wu, C.-A.; Yang, G.-D.; Xu, R.; Guo, Q.-H.; Huang, J.-G.; Zheng, C.-C. Stress-induced alternative splicing provides a mechanism for the regulation of MicroRNA processing in Arabidopsis thaliana. Mol. Cell 2012, 48, 521–531. [Google Scholar] [CrossRef]
- Garrett-Sinha, L.A. Review of Ets1 structure, function, and roles in immunity. Cell. Mol. Life Sci. 2013, 70, 3375–3390. [Google Scholar] [CrossRef]
- Kielty, C.M.; Baldock, C.; Lee, D.; Rock, M.J.; Ashworth, J.L.; Shuttleworth, C.A. Fibrillin: From Microfibril Assembly to biomechanical function. Philos. Trans. R. Soc. B Biol. Sci. 2002, 357, 207–217. [Google Scholar] [CrossRef]
- Bankers-Fulbright, J.L.; Kalli, K.R.; McKean, D.J. Interleukin-1 signal transduction. Life Sci. 1996, 59, 61–83. [Google Scholar] [CrossRef]
- Luo, H.; Zhou, X. Bioinformatics analysis of potential common pathogenic mechanisms for COVID-19 infection and primary Sjogren’s syndrome. Front. Immunol. 2022, 13, 938837. [Google Scholar] [CrossRef]
- Hynne, H.; Aqrawi, L.A.; Jensen, J.L.; Thiede, B.; Palm, Ø.; Amdal, C.D.; Westgaard, K.L.; Herlofson, B.B.; Utheim, T.P.; Galtung, H.K. Proteomic Profiling of Saliva and Tears in Radiated Head and Neck Cancer Patients as Compared to Primary Sjögren’s Syndrome Patients. Int. J. Mol. Sci. 2022, 23, 3714. [Google Scholar] [CrossRef] [PubMed]
- Woods, M.W.; Kelly, J.N.; Hattlmann, C.J.; Tong, J.G.; Xu, L.S.; Coleman, M.D.; Quest, G.R.; Smiley, J.R.; Barr, S.D. Human HERC5 restricts an early stage of HIV-1 assembly by a mechanism correlating with the ISGylation of Gag. Retrovirology 2011, 8, 95. [Google Scholar] [CrossRef] [PubMed]
- Grover, H.; Phillips, M.A.; Lillicrap, D.P.; Giles, A.R.; Garvey, M.B.; Teitel, J.; Rivard, G.; Blanchbtte, V.; White, B.N.; Holden, J.J.A. Carrier detection of haemophilia A using DNA markers in families with an isolated affected male. Clin. Genet. 1987, 32, 10–19. [Google Scholar] [CrossRef]
- Chen, H.-H.; Ma, K.S.-K.; Dong, C.; Chang, W.-J.; Gao, K.-R.; Perng, W.-T.; Huang, J.-Y.; Wei, J.C.-C. Risk of primary Sjogren’s Syndrome following human papillomavirus infections: A nationwide population-based cohort study. Front. Immunol. 2022, 13, 967040. [Google Scholar] [CrossRef] [PubMed]
- Magg, T.; Okano, T.; Koenig, L.M.; Boehmer, D.F.; Schwartz, S.L.; Inoue, K.; Heimall, J.; Licciardi, F.; Ley-Zaporozhan, J.; Ferdman, R.M.; et al. Heterozygous OAS1 gain-of-function variants cause an autoinflammatory immunodeficiency. Sci. Immunol. 2021, 6, eabf9564. [Google Scholar] [CrossRef]
- Noll, B.D.; Grdzelishvili, A.; Brennan, M.T.; Mougeot, F.B.; Mougeot, J.C. Immortalization of Salivary Gland Epithelial Cells of Xerostomic Patients: Establishment and Characterization of Novel Cell Lines. J. Clin. Med. 2020, 9, 3820. [Google Scholar] [CrossRef]
- Rasband, W.S. ImageJ; US National Institutes of Health: Bethesda, MD, USA, 1997–2024. Available online: https://imagej.net/ij/ (accessed on 9 September 2024).
- Dempoya, J.; Matsumiya, T.; Imaizumi, T.; Hayakari, R.; Xing, F.; Yoshida, H.; Okumura, K.; Satoh, K. Double-stranded RNA induces biphasic STAT1 phosphorylation by both type I interferon (IFN)-dependent and type I IFN-independent pathways. J. Virol. 2012, 86, 12760–12769. [Google Scholar] [CrossRef]
- Workman, M.J.; Troisi, E.; Targan, S.R.; Svendsen, C.N.; Barrett, R.J. Modeling Intestinal Epithelial Response to Interferon-γ in Induced Pluripotent Stem Cell-Derived Human Intestinal Organoids. Int. J. Mol. Sci. 2020, 22, 288. [Google Scholar] [CrossRef]
- Dai, X.; Sayama, K.; Yamasaki, K.; Tohyama, M.; Shirakata, Y.; Hanakawa, Y.; Tokumaru, S.; Yahata, Y.; Yang, L.; Yoshimura, A.; et al. SOCS1-negative feedback of STAT1 activation is a key pathway in the dsRNA-induced innate immune response of human keratinocytes. J. Investig. Dermatol. 2006, 126, 1574–1581. [Google Scholar] [CrossRef]
- Ohta, K.; Ishida, Y.; Fukui, A.; Mizuta, K.; Nishi, H.; Takechi, M.; Kamata, N. Toll-like receptor (TLR) expression and TLR-mediated interleukin-8 production by human submandibular gland epithelial cells. Mol. Med. Rep. 2014, 10, 2377–2382. [Google Scholar] [CrossRef]
- Tarazona, S.; Furió-Tarí, P.; Turrà, D.; Di Pietro, A.; Nueda, M.J.; Ferrer, A.; Conesa, A. Data quality aware analysis of differential expression in RNA-seq with NOISeq R/Bioc package. Nucleic Acids Res. 2015, 43, e140. [Google Scholar] [CrossRef] [PubMed]
- Starr, A.; Nickoloff-Bybel, E.; Abedalthaqafi, R.; Albloushi, N.; Jordan-Sciutto, K.L. Human iPSC-derived neurons reveal NMDAR-independent dysfunction following HIV-associated insults. Front. Mol. Neurosci. 2023, 16, 1353562. [Google Scholar] [CrossRef] [PubMed]
- Davoudnia, B.; Dadkhodaie, A.; Moghadam, A.; Heidari, B.; Yassaie, M. Transcriptome analysis in Aegilops tauschii unravels further insights into genetic control of stripe rust resistance. Planta 2024, 259, 70. [Google Scholar] [CrossRef] [PubMed]
- Wei, S.; Xing, J.; Chen, J.; Chen, L.; Lv, J.; Chen, X.; Li, T.; Yu, T.; Wang, H.; Wang, K.; et al. DCAF13 inhibits the p53 signaling pathway by promoting p53 ubiquitination modification in lung adenocarcinoma. J. Exp. Clin. Cancer Res. 2024, 43, 3. [Google Scholar] [CrossRef]
- Szklarczyk, D.; Kirsch, R.; Koutrouli, M.; Nastou, K.; Mehryary, F.; Hachilif, R.; Gable, A.L.; Fang, T.; Doncheva, N.T.; Pyysalo, S.; et al. The STRING database in 2023: Protein-protein association networks and functional enrichment analyses for any sequenced genome of interest. Nucleic Acids Res. 2023, 51, D638–D646. [Google Scholar] [CrossRef]
- Garcia-Moreno, A.; López-Domínguez, R.; Villatoro-García, J.A.; Ramirez-Mena, A.; Aparicio-Puerta, E.; Hackenberg, M.; Pascual-Montano, A.; Carmona-Saez, P. Functional Enrichment Analysis of regulatory elements. Biomedicines 2022, 10, 590. [Google Scholar] [CrossRef]
- Watanabe, K.; Taskesen, E.; van Bochoven, A.; Posthuma, D. Functional mapping and annotation of genetic associations with FUMA. Nat. Commun. 2017, 8, 1826. [Google Scholar] [CrossRef]


| Gene Set a | N | n | padj-Value b | Genes c |
|---|---|---|---|---|
| INTERFERON ALPHA BETA SIGNALING | 72 | 12 | 5.64 × 10⁻¹⁸ | ISG15, IFI6, RSAD2, IFIT2, IFIT3, IFIT1, IFITM1, OAS1, OAS2, OASL, IFI35, MX1 |
| INTERFERON SIGNALING | 193 | 13 | 1.15 × 10⁻¹⁴ | ISG15, IFI6, RSAD2, HERC5, IFIT2, IFIT3, IFIT1, IFITM1, OAS1, OAS2, OASL, IFI35, MX1 |
| CYTOKINE SIGNALING IN IMMUNE SYSTEM | 693 | 15 | 3.40 × 10⁻¹ | ISG15, IFI6, RSAD2, IL1A, HERC5, IFIT2, IFIT3, IFIT1, IFITM1, OAS1, OAS2, OASL, MMP2, IFI35, MX1 |
| ANTIVIRAL MECHANISM BY IFN STIMULATED GENES | 79 | 7 | 4.20 × 10⁻⁸ | ISG15, HERC5, IFIT1, OAS1, OAS2, OASL, MX1 |
| EXTRACELLULAR MATRIX ORGANIZATION | 292 | 9 | 7.49 × 10⁻⁷ | ITGA10, ITGA1, LOX, FBN2, EFEMP2, DCN, FBLN5, FBN1, MMP2 |
| ELASTIC FIBER FORMATION | 42 | 5 | 3.43 × 10⁻⁶ | LOX, FBN2, EFEMP2, FBLN5, FBN1 |
| OAS ANTIVIRAL RESPONSE | 9 | 3 | 9.71 × 10⁻⁵ | OAS1, OAS2, OASL |
| MOLECULES ASSOCIATED WITH ELASTIC FIBRES | 35 | 4 | 9.71 × 10⁻⁵ | FBN2, EFEMP2, FBLN5, FBN1 |
| SENSORY PERCEPTION OF SALTY TASTE | 6 | 2 | 8.28 × 10⁻³ | SCNN1G, SCNN1B |
| NERVOUS SYSTEM DEVELOPMENT | 543 | 7 | 8.28 × 10⁻³ | ITGA10, NGEF, EPHA3, ITGA1, DPYSL2, FES, MMP2 |
| CHL1 INTERACTIONS | 8 | 2 | 1.34 × 10⁻² | ITGA10, ITGA1 |
| DEGRADATION OF THE EXTRACELLULAR MATRIX | 139 | 4 | 1.61 × 10⁻² | FBN2, DCN, FBN1, MMP2 |
| SEMAPHORIN INTERACTIONS | 64 | 3 | 2.72 × 10⁻² | ITGA1, DPYSL2, FES |
| PLATELET ADHESION TO EXPOSED COLLAGEN | 15 | 2 | 3.91 × 10⁻² | ITGA10, ITGA1 |
| CRMPS IN SEMA3A SIGNALING | 16 | 2 | 4.17 × 10⁻² | DPYSL2, FES |
| INTEGRIN CELL SURFACE INTERACTIONS | 82 | 3 | 4.59 × 10⁻² | ITGA10, ITGA1, FBN1 |
| IRAK4 DEFICIENCY TLR2 4 | 18 | 2 | 4.68 × 10⁻² | TLR6, TLR4 |
| INTERFERON GAMMA SIGNALING | 86 | 3 | 4.69 × 10⁻² | OAS1, OAS2, OASL |
| REGULATION OF TLR BY ENDOGENOUS LIGAND | 20 | 2 | 4.98 × 10⁻² | TLR6, TLR4 |
| EPH EPHRIN SIGNALING | 91 | 3 | 4.98 × 10⁻² | NGEF, EPHA3, MMP2 |
Disclaimer/Publisher’s Note: The statements, opinions and data contained in all publications are solely those of the individual author(s) and contributor(s) and not of MDPI and/or the editor(s). MDPI and/or the editor(s) disclaim responsibility for any injury to people or property resulting from any ideas, methods, instructions or products referred to in the content. |
© 2025 by the authors. Licensee MDPI, Basel, Switzerland. This article is an open access article distributed under the terms and conditions of the Creative Commons Attribution (CC BY) license (https://creativecommons.org/licenses/by/4.0/).
Share and Cite
Kepple, D.D.; Thornburg, T.E.; Beckman, M.F.; Bahrani Mougeot, F.; Mougeot, J.-L.C. Elucidating Regulatory Mechanisms of Genes Involved in Pathobiology of Sjögren’s Disease: Immunostimulation Using a Cell Culture Model. Int. J. Mol. Sci. 2025, 26, 5881. https://doi.org/10.3390/ijms26125881
Kepple DD, Thornburg TE, Beckman MF, Bahrani Mougeot F, Mougeot J-LC. Elucidating Regulatory Mechanisms of Genes Involved in Pathobiology of Sjögren’s Disease: Immunostimulation Using a Cell Culture Model. International Journal of Molecular Sciences. 2025; 26(12):5881. https://doi.org/10.3390/ijms26125881
Chicago/Turabian StyleKepple, Daniel D., Thomas E. Thornburg, Micaela F. Beckman, Farah Bahrani Mougeot, and Jean-Luc C. Mougeot. 2025. "Elucidating Regulatory Mechanisms of Genes Involved in Pathobiology of Sjögren’s Disease: Immunostimulation Using a Cell Culture Model" International Journal of Molecular Sciences 26, no. 12: 5881. https://doi.org/10.3390/ijms26125881
APA StyleKepple, D. D., Thornburg, T. E., Beckman, M. F., Bahrani Mougeot, F., & Mougeot, J.-L. C. (2025). Elucidating Regulatory Mechanisms of Genes Involved in Pathobiology of Sjögren’s Disease: Immunostimulation Using a Cell Culture Model. International Journal of Molecular Sciences, 26(12), 5881. https://doi.org/10.3390/ijms26125881