
PBX3-HMGCR Axis Promotes Hepatocellular Carcinoma Progression Through Enhancing De Novo Cholesterol Biosynthesis
 , , , and
Abstract
1. Introduction
2. Results
2.1. PBX3 Alters HCC Cell Lipid Accumulation
2.2. PBX3 Regulates HCC Cell Cholesterol Metabolism by Promoting HMGCR Expression
2.3. PBX3 Promotes HMGCR Transcriptional Activity
2.4. Cholesterol Is Critical for PBX3 Tumorigenic Potential
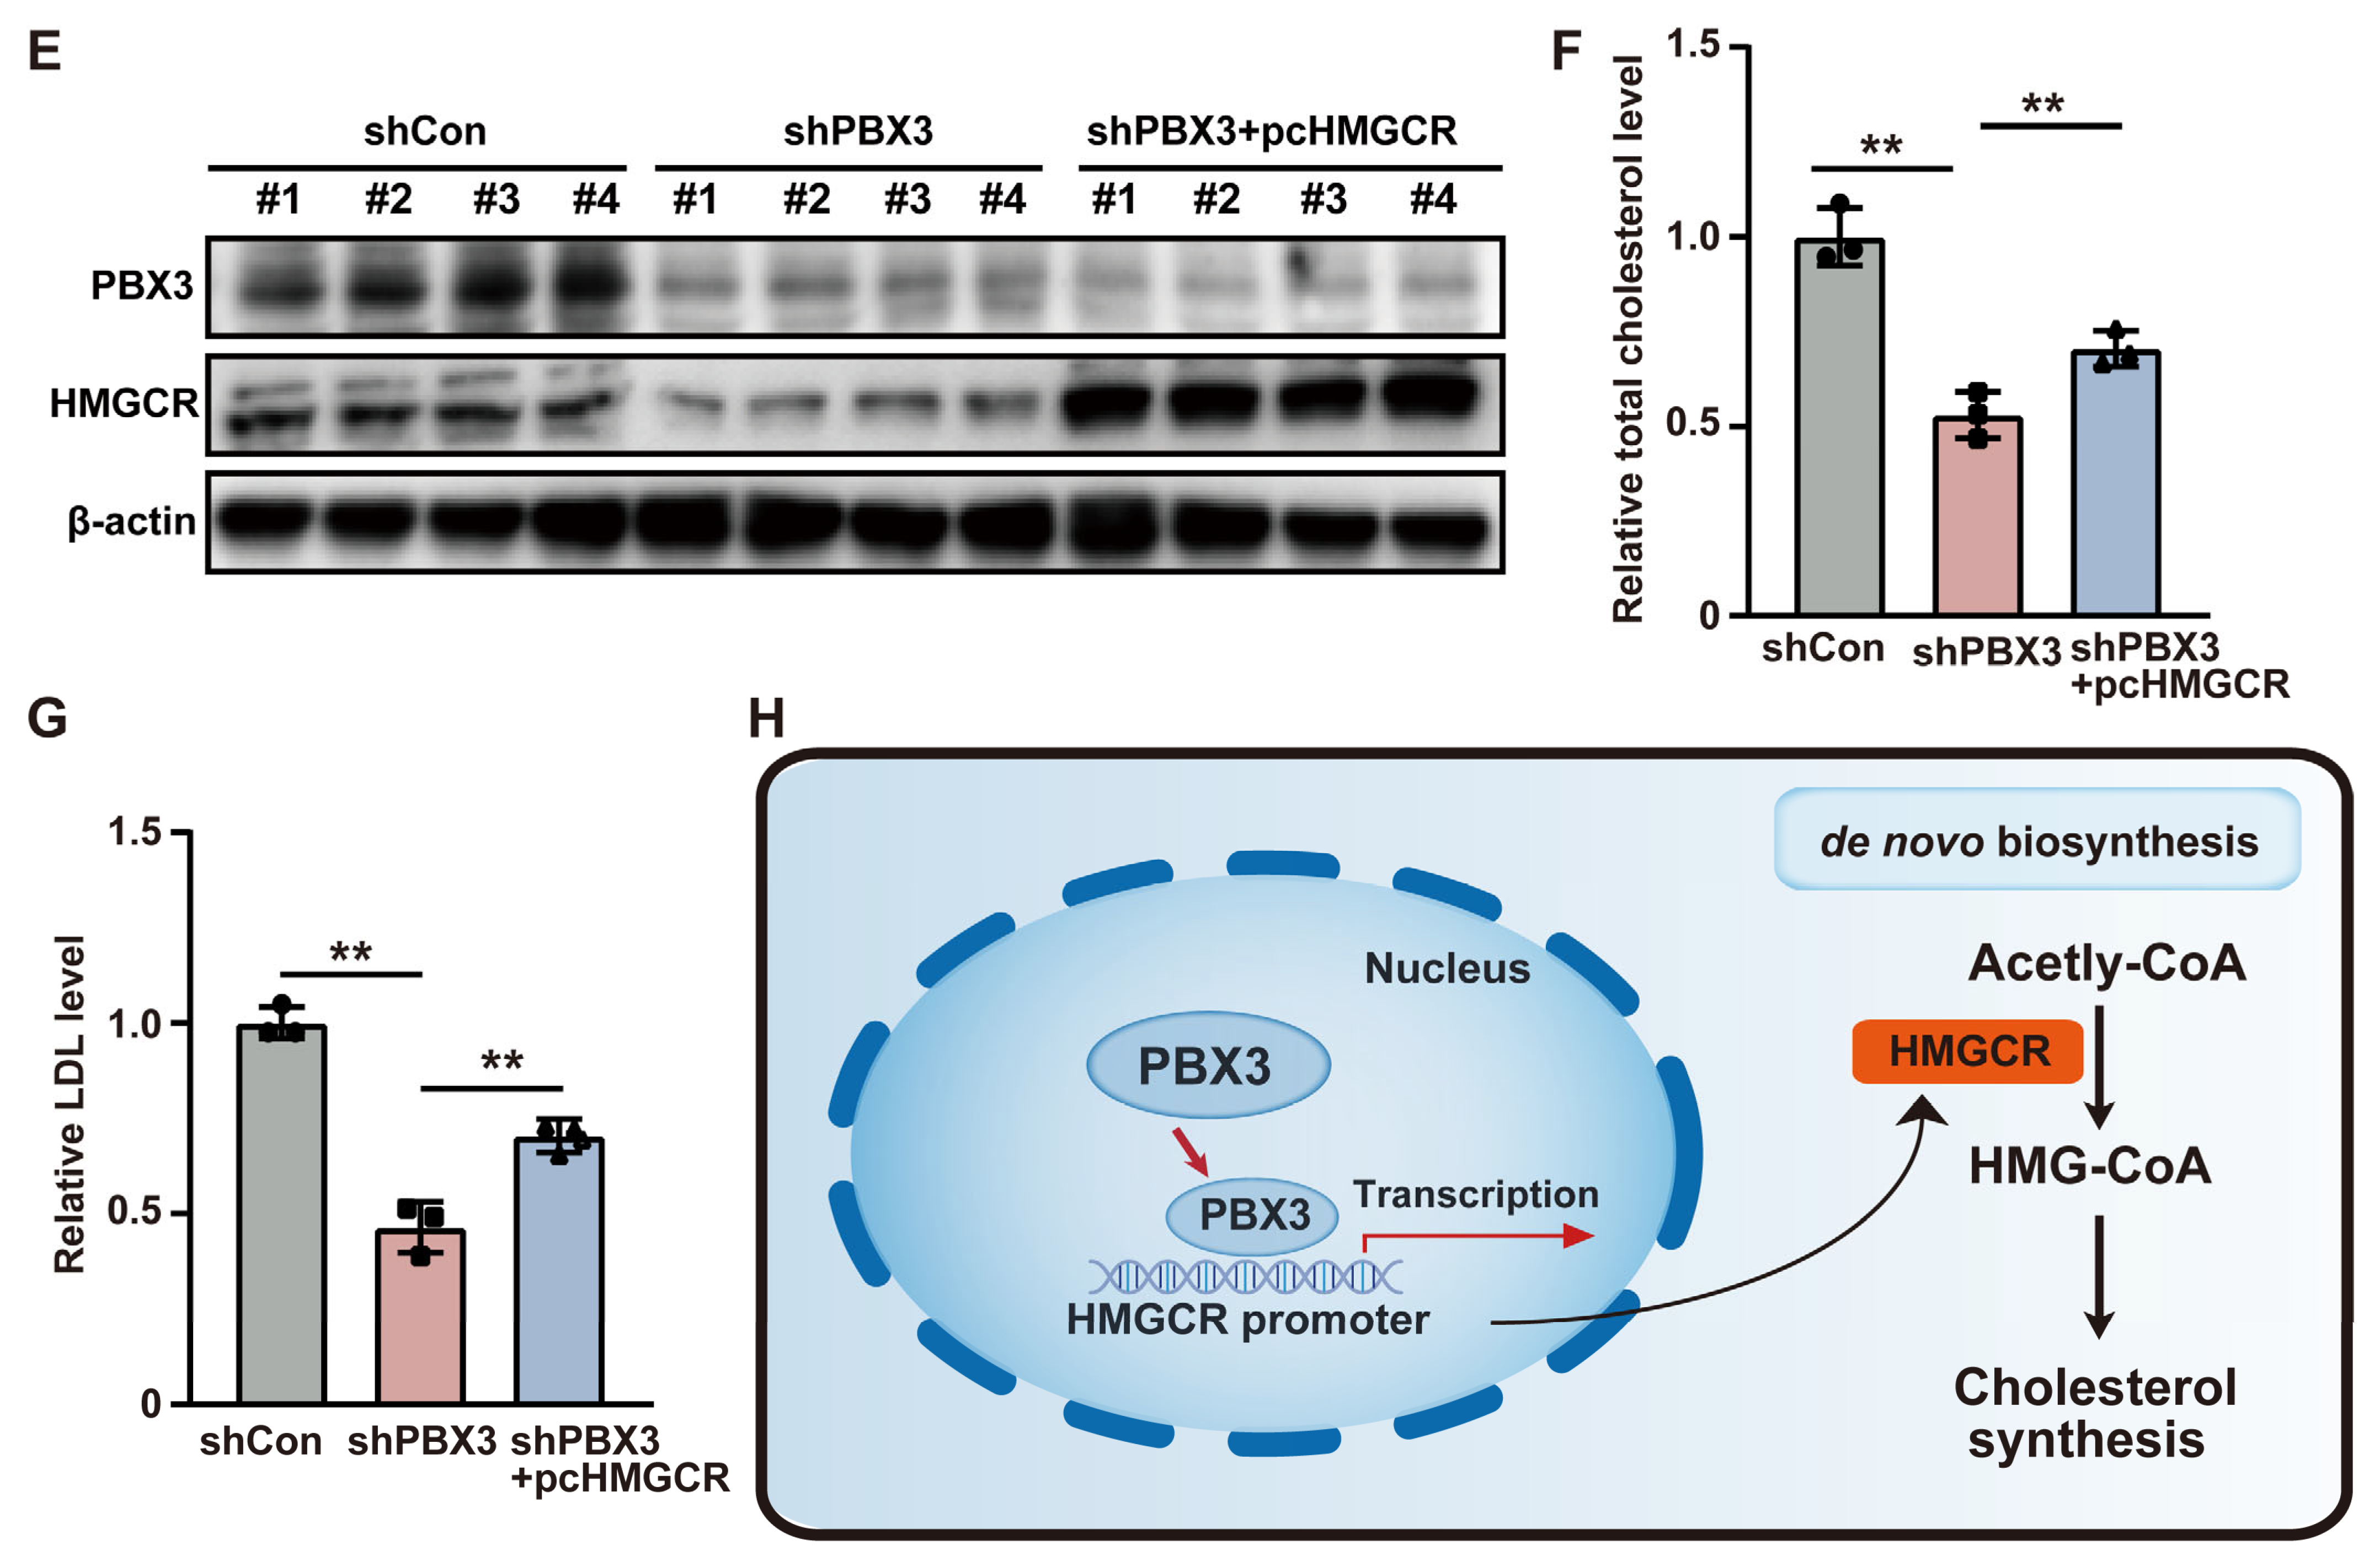
2.5. PBX3/HMGCR Axis Is Crucial for HCC Tumorigenesis
3. Discussion
4. Materials and Methods
4.1. Vector Construction
4.2. Cell Lines and Cell Cultures
4.3. Nile Red Staining
4.4. RNA Extraction and Quantitative Reverse Transcribed–PCR (qRT–PCR)
4.5. Western Blotting
4.6. 5-Ethynyl-2′-deoxyuridine (EdU) Incorporation Assay and Colony Formation Assay
4.7. Measurements of Total Cholesterol Level and Low-Density Lipoprotein (LDL) Levels
4.8. Cell Growth Rate Assay
4.9. Colony Formation Assay
4.10. Dual Luciferase Reporter Assay
4.11. Chromatin Immunoprecipitation (ChIP) Assay
4.12. Animal Experiment
4.13. Clinical Human HCC Specimens
4.14. Immunohistochemistry and Hematoxylin and Eosin (H&E) Stainings
4.15. Statistical Analysis
Supplementary Materials
Author Contributions
Funding
Institutional Review Board Statement
Informed Consent Statement
Data Availability Statement
Conflicts of Interest
References
- Gyamfi, J.; Kim, J.; Choi, J. Cancer as a Metabolic Disorder. Int. J. Mol. Sci. 2022, 23, 1155. [Google Scholar] [CrossRef] [PubMed]
- Hanahan, D. Hallmarks of Cancer: New Dimensions. Cancer Discov. 2022, 12, 31–46. [Google Scholar] [CrossRef] [PubMed]
- Yang, K.; Wang, X.; Song, C.; He, Z.; Wang, R.; Xu, Y.; Jiang, G.; Wan, Y.; Mei, J.; Mao, W. The role of lipid metabolic reprogramming in tumor microenvironment. Theranostics 2023, 13, 1774–1808. [Google Scholar] [CrossRef]
- Paul, B.; Lewinska, M.; Andersen, J.B. Lipid alterations in chronic liver disease and liver cancer. JHEP Rep. Innov. Hepatol. 2022, 4, 100479. [Google Scholar] [CrossRef]
- Bacci, M.; Lorito, N.; Smiriglia, A.; Morandi, A. Fat and Furious: Lipid Metabolism in Antitumoral Therapy Response and Resistance. Trends Cancer 2021, 7, 198–213. [Google Scholar] [CrossRef]
- Bian, X.; Liu, R.; Meng, Y.; Xing, D.; Xu, D.; Lu, Z. Lipid metabolism and cancer. J. Exp. Med. 2021, 218, e20201606. [Google Scholar] [CrossRef] [PubMed]
- Cebecauer, M. Role of Lipids in Morphogenesis of T-Cell Microvilli. Front. Immunol. 2021, 12, 613591. [Google Scholar] [CrossRef]
- Essayan-Perez, S.; Südhof, T.C. Neuronal γ-secretase regulates lipid metabolism, linking cholesterol to synaptic dysfunction in Alzheimer’s disease. Neuron 2023, 111, 3176–3194.e7. [Google Scholar] [CrossRef]
- Iwamoto, H.; Abe, M.; Yang, Y.; Cui, D.; Seki, T.; Nakamura, M.; Hosaka, K.; Lim, S.; Wu, J.; He, X.; et al. Cancer Lipid Metabolism Confers Antiangiogenic Drug Resistance. Cell Metab. 2018, 28, 104–117.e5. [Google Scholar] [CrossRef]
- Vander Heiden, M.G.; Cantley, L.C.; Thompson, C.B. Understanding the Warburg effect: The metabolic requirements of cell proliferation. Science 2009, 324, 1029–1033. [Google Scholar] [CrossRef]
- Fhu, C.W.; Ali, A. Fatty Acid Synthase: An Emerging Target in Cancer. Molecules 2020, 25, 3935. [Google Scholar] [CrossRef]
- Jeong, Y.J.; Rogers, T.J.; Anderson, C.E.; Lien, E.C. Tumor lipid metabolism: A mechanistic link between diet and cancer progression. Curr. Opin. Biotechnol. 2023, 84, 102993. [Google Scholar] [CrossRef] [PubMed]
- Martin-Perez, M.; Urdiroz-Urricelqui, U.; Bigas, C.; Benitah, S.A. The role of lipids in cancer progression and metastasis. Cell Metab. 2022, 34, 1675–1699. [Google Scholar] [CrossRef] [PubMed]
- Ramberg, H.; Alshbib, A.; Berge, V.; Svindland, A.; Taskén, K.A. Regulation of PBX3 expression by androgen and Let-7d in prostate cancer. Mol. Cancer 2011, 10, 50. [Google Scholar] [CrossRef]
- Pan, C.; Bai, X.; Li, N.; Zheng, N.; Si, Y.; Zhao, Y. PBX3 as a biomarker for the early diagnosis and prediction of prognosis of glioma. PLoS ONE 2024, 19, e0293647. [Google Scholar] [CrossRef] [PubMed]
- Wang, D.; Jin, X.; Lei, M.; Jiang, Y.; Liu, Y.; Yu, F.; Guo, Y.; Han, B.; Yang, Y.; Sun, W.; et al. USF1-ATRAP-PBX3 Axis Promote Breast Cancer Glycolysis and Malignant Phenotype by Activating AKT/mTOR Signaling. Int. J. Biol. Sci. 2022, 18, 2452–2471. [Google Scholar] [CrossRef]
- Xia, Z.; Wang, Q.; Lu, P. LncRNA LINC00885 promotes bladder cancer progression by targeting the miR-98-5p/PBX3 axis. Cell. Mol. Biol. 2023, 69, 163–168. [Google Scholar]
- Mohamed Jiffry, M.Z.; Kloss, R.; Ahmed-Khan, M.; Carmona-Pires, F.; Okam, N.; Weeraddana, P.; Dharmaratna, D.; Dandwani, M.; Moin, K. A review of treatment options employed in relapsed/refractory AML. Hematology 2023, 28, 2196482. [Google Scholar] [CrossRef]
- Zhang, H.; Shi, X.; Ge, Z.; Wang, Z.; Gao, Y.; Gao, G.; Xu, W.; Qu, X. PBX3-activated DLG1-AS1 can promote the proliferation, invasion, and migration of TNBC cells by sponging miR-16-5p. Mol. Ther. Oncolytics 2022, 25, 201–210. [Google Scholar] [CrossRef]
- Peng, J.; Lv, L.; Zhou, Y.; Wang, X.; Hu, C. PHAX enhanced LIN28B-mediated PBX3 mRNA stability to promote esophageal cancer development. Cancer Sci. 2025, 116, 808–823. [Google Scholar] [CrossRef]
- Liu, Y.; Song, J.; Zhang, H.; Liao, Z.; Liu, F.; Su, C.; Wang, W.; Han, M.; Zhang, L.; Zhu, H.; et al. EIF4A3-induced circTOLLIP promotes the progression of hepatocellular carcinoma via the miR-516a-5p/PBX3/EMT pathway. J. Exp. Clin. Cancer Res. CR 2022, 41, 164. [Google Scholar] [CrossRef]
- Lamprecht, S.; Kaller, M.; Schmidt, E.M.; Blaj, C.; Schiergens, T.S.; Engel, J.; Jung, A.; Hermeking, H.; Grünewald, T.G.P.; Kirchner, T.; et al. PBX3 Is Part of an EMT Regulatory Network and Indicates Poor Outcome in Colorectal Cancer. Clin. Cancer Res. Off. J. Am. Assoc. Cancer Res. 2018, 24, 1974–1986. [Google Scholar] [CrossRef] [PubMed]
- Xie, W.; Zhou, H.; Han, Q.; Sun, T.; Nie, C.; Hong, J.; Wei, R.; Leonteva, A.; Han, X.; Wang, J.; et al. Relationship between DLEC1 and PBX3 promoter methylation and the risk and prognosis of gastric cancer in peripheral blood leukocytes. J. Cancer Res. Clin. Oncol. 2020, 146, 1115–1124. [Google Scholar] [CrossRef] [PubMed]
- Terekhanova, N.V.; Karpova, A.; Liang, W.W.; Strzalkowski, A.; Chen, S.; Li, Y.; Southard-Smith, A.N.; Iglesia, M.D.; Wendl, M.C.; Jayasinghe, R.G.; et al. Epigenetic regulation during cancer transitions across 11 tumour types. Nature 2023, 623, 432–441. [Google Scholar] [CrossRef] [PubMed]
- Clifford, B.L.; Sedgeman, L.R.; Williams, K.J.; Morand, P.; Cheng, A.; Jarrett, K.E.; Chan, A.P.; Brearley-Sholto, M.C.; Wahlström, A.; Ashby, J.W.; et al. FXR activation protects against NAFLD via bile-acid-dependent reductions in lipid absorption. Cell Metab. 2021, 33, 1671–1684.e4. [Google Scholar] [CrossRef]
- Lee, S.M.; Lee, S.H.; Jung, Y.; Lee, Y.; Yoon, J.H.; Choi, J.Y.; Hwang, C.Y.; Son, Y.H.; Park, S.S.; Hwang, G.S.; et al. FABP3-mediated membrane lipid saturation alters fluidity and induces ER stress in skeletal muscle with aging. Nat. Commun. 2020, 11, 5661. [Google Scholar] [CrossRef]
- Dyall, S.C.; Balas, L.; Bazan, N.G.; Brenna, J.T.; Chiang, N.; da Costa Souza, F.; Dalli, J.; Durand, T.; Galano, J.M.; Lein, P.J.; et al. Polyunsaturated fatty acids and fatty acid-derived lipid mediators: Recent advances in the understanding of their biosynthesis, structures, and functions. Prog. Lipid Res. 2022, 86, 101165. [Google Scholar] [CrossRef]
- Pokhrel, R.H.; Acharya, S.; Ahn, J.H.; Gu, Y.; Pandit, M.; Kim, J.O.; Park, Y.Y.; Kang, B.; Ko, H.J.; Chang, J.H. AMPK promotes antitumor immunity by downregulating PD-1 in regulatory T cells via the HMGCR/p38 signaling pathway. Mol. Cancer 2021, 20, 133. [Google Scholar] [CrossRef]
- Ishtiaq, S.M.; Arshad, M.I.; Khan, J.A. PPARγ signaling in hepatocarcinogenesis: Mechanistic insights for cellular reprogramming and therapeutic implications. Pharmacol. Ther. 2022, 240, 108298. [Google Scholar] [CrossRef]
- Kuzu, O.F.; Noory, M.A.; Robertson, G.P. The Role of Cholesterol in Cancer. Cancer Res. 2016, 76, 2063–2070. [Google Scholar] [CrossRef]
- King, R.J.; Singh, P.K.; Mehla, K. The cholesterol pathway: Impact on immunity and cancer. Trends Immunol. 2022, 43, 78–92. [Google Scholar] [CrossRef] [PubMed]
- Xiao, M.; Xu, J.; Wang, W.; Zhang, B.; Liu, J.; Li, J.; Xu, H.; Zhao, Y.; Yu, X.; Shi, S. Functional significance of cholesterol metabolism in cancer: From threat to treatment. Exp. Mol. Med. 2023, 55, 1982–1995. [Google Scholar] [CrossRef] [PubMed]
- Guixà-González, R.; Albasanz, J.L.; Rodriguez-Espigares, I.; Pastor, M.; Sanz, F.; Martí-Solano, M.; Manna, M.; Martinez-Seara, H.; Hildebrand, P.W.; Martín, M.; et al. Membrane cholesterol access into a G-protein-coupled receptor. Nat. Commun. 2017, 8, 14505. [Google Scholar] [CrossRef]
- Schade, D.S.; Shey, L.; Eaton, R.P. Cholesterol Review: A Metabolically Important Molecule. Endocr. Pract. Off. J. Am. Coll. Endocrinol. Am. Assoc. Clin. Endocrinol. 2020, 26, 1514–1523. [Google Scholar] [CrossRef] [PubMed]
- Lu, J.; Chen, S.; Bai, X.; Liao, M.; Qiu, Y.; Zheng, L.L.; Yu, H. Targeting cholesterol metabolism in Cancer: From molecular mechanisms to therapeutic implications. Biochem. Pharmacol. 2023, 218, 115907. [Google Scholar] [CrossRef]
- Kopecka, J.; Trouillas, P.; Gašparović, A.; Gazzano, E.; Assaraf, Y.G.; Riganti, C. Phospholipids and cholesterol: Inducers of cancer multidrug resistance and therapeutic targets. Drug Resist. Updat. 2020, 49, 100670. [Google Scholar] [CrossRef]
- Goicoechea, L.; Conde de la Rosa, L.; Torres, S.; García-Ruiz, C.; Fernández-Checa, J.C. Mitochondrial cholesterol: Metabolism and impact on redox biology and disease. Redox Biol. 2023, 61, 102643. [Google Scholar] [CrossRef]
- Hu, N.; Chen, C.; Wang, J.; Huang, J.; Yao, D.; Li, C. Atorvastatin Ester Regulates Lipid Metabolism in Hyperlipidemia Rats via the PPAR-signaling Pathway and HMGCR Expression in the Liver. Int. J. Mol. Sci. 2021, 22, 11107. [Google Scholar] [CrossRef]
- Li, Z.; Fan, Q.; Chen, M.; Dong, Y.; Li, F.; Wang, M.; Gu, Y.; Guo, S.; Ye, X.; Wu, J.; et al. The interaction between polyphyllin I and SQLE protein induces hepatotoxicity through SREBP-2/HMGCR/SQLE/LSS pathway. J. Pharm. Anal. 2023, 13, 39–54. [Google Scholar] [CrossRef]
- Gill, S.; Stevenson, J.; Kristiana, I.; Brown, A.J. Cholesterol-dependent degradation of squalene monooxygenase, a control point in cholesterol synthesis beyond HMG-CoA reductase. Cell Metab. 2011, 13, 260–273. [Google Scholar] [CrossRef]
- Cheng, C.; Geng, F.; Cheng, X.; Guo, D. Lipid metabolism reprogramming and its potential targets in cancer. Cancer Commun. 2018, 38, 27. [Google Scholar] [CrossRef] [PubMed]
- Yan, J.; Yang, J.; Shen, H.; Gao, R.; Lv, S. Sinomenine regulates circTRPM7-related pathway to inhibit gastric cancer cell growth and metastasis. Chem. Biol. Drug Des. 2023, 102, 870–881. [Google Scholar] [CrossRef]
- Zhang, M.; Xu, T.; Tong, D.; Li, S.; Yu, X.; Liu, B.; Jiang, L.; Liu, K. Research advances in endometriosis-related signaling pathways: A review. Biomed. Pharmacother. 2023, 164, 114909. [Google Scholar] [CrossRef]
- Li, W.F.; Herkilini, A.; Tang, Y.; Huang, P.; Song, G.B.; Miyagishi, M.; Kasim, V.; Wu, S.R. The transcription factor PBX3 promotes tumor cell growth through transcriptional suppression of the tumor suppressor p53. Acta Pharmacol. Sin. 2021, 42, 1888–1899. [Google Scholar] [CrossRef] [PubMed]
- Li, H.; Huang, J.; Yu, S.; Li, H.; Zhou, Y.; Wu, Q. HOXA11-AS induces cisplatin resistance by modulating the microRNA-98/PBX3 axis in nasopharyngeal carcinoma. Oncol. Lett. 2021, 21, 493. [Google Scholar] [CrossRef] [PubMed]
- Fu, L.Q.; Du, W.L.; Cai, M.H.; Yao, J.Y.; Zhao, Y.Y.; Mou, X.Z. The roles of tumor-associated macrophages in tumor angiogenesis and metastasis. Cell. Immunol. 2020, 353, 104119. [Google Scholar] [CrossRef]
- Luo, X.; Wei, M.; Li, W.; Zhao, H.; Kasim, V.; Wu, S. PBX3 promotes pentose phosphate pathway and colorectal cancer progression by enhancing G6PD expression. Int. J. Biol. Sci. 2023, 19, 4525–4538. [Google Scholar] [CrossRef]
- Wei, M.; Nurjanah, U.; Herkilini, A.; Huang, C.; Li, Y.; Miyagishi, M.; Wu, S.; Kasim, V. Unspliced XBP1 contributes to cholesterol biosynthesis and tumorigenesis by stabilizing SREBP2 in hepatocellular carcinoma. Cell. Mol. Life Sci. CMLS 2022, 79, 472. [Google Scholar] [CrossRef]
- Wu, S.; Wang, H.; Li, Y.; Xie, Y.; Huang, C.; Zhao, H.; Miyagishi, M.; Kasim, V. Transcription Factor YY1 Promotes Cell Proliferation by Directly Activating the Pentose Phosphate Pathway. Cancer Res. 2018, 78, 4549–4562. [Google Scholar] [CrossRef]
 represent the data of each group. * p < 0.05; ** p < 0.01; *** p < 0.001.
represent the data of each group. * p < 0.05; ** p < 0.01; *** p < 0.001.
represent the data of each group. * p < 0.05; ** p < 0.01; *** p < 0.001.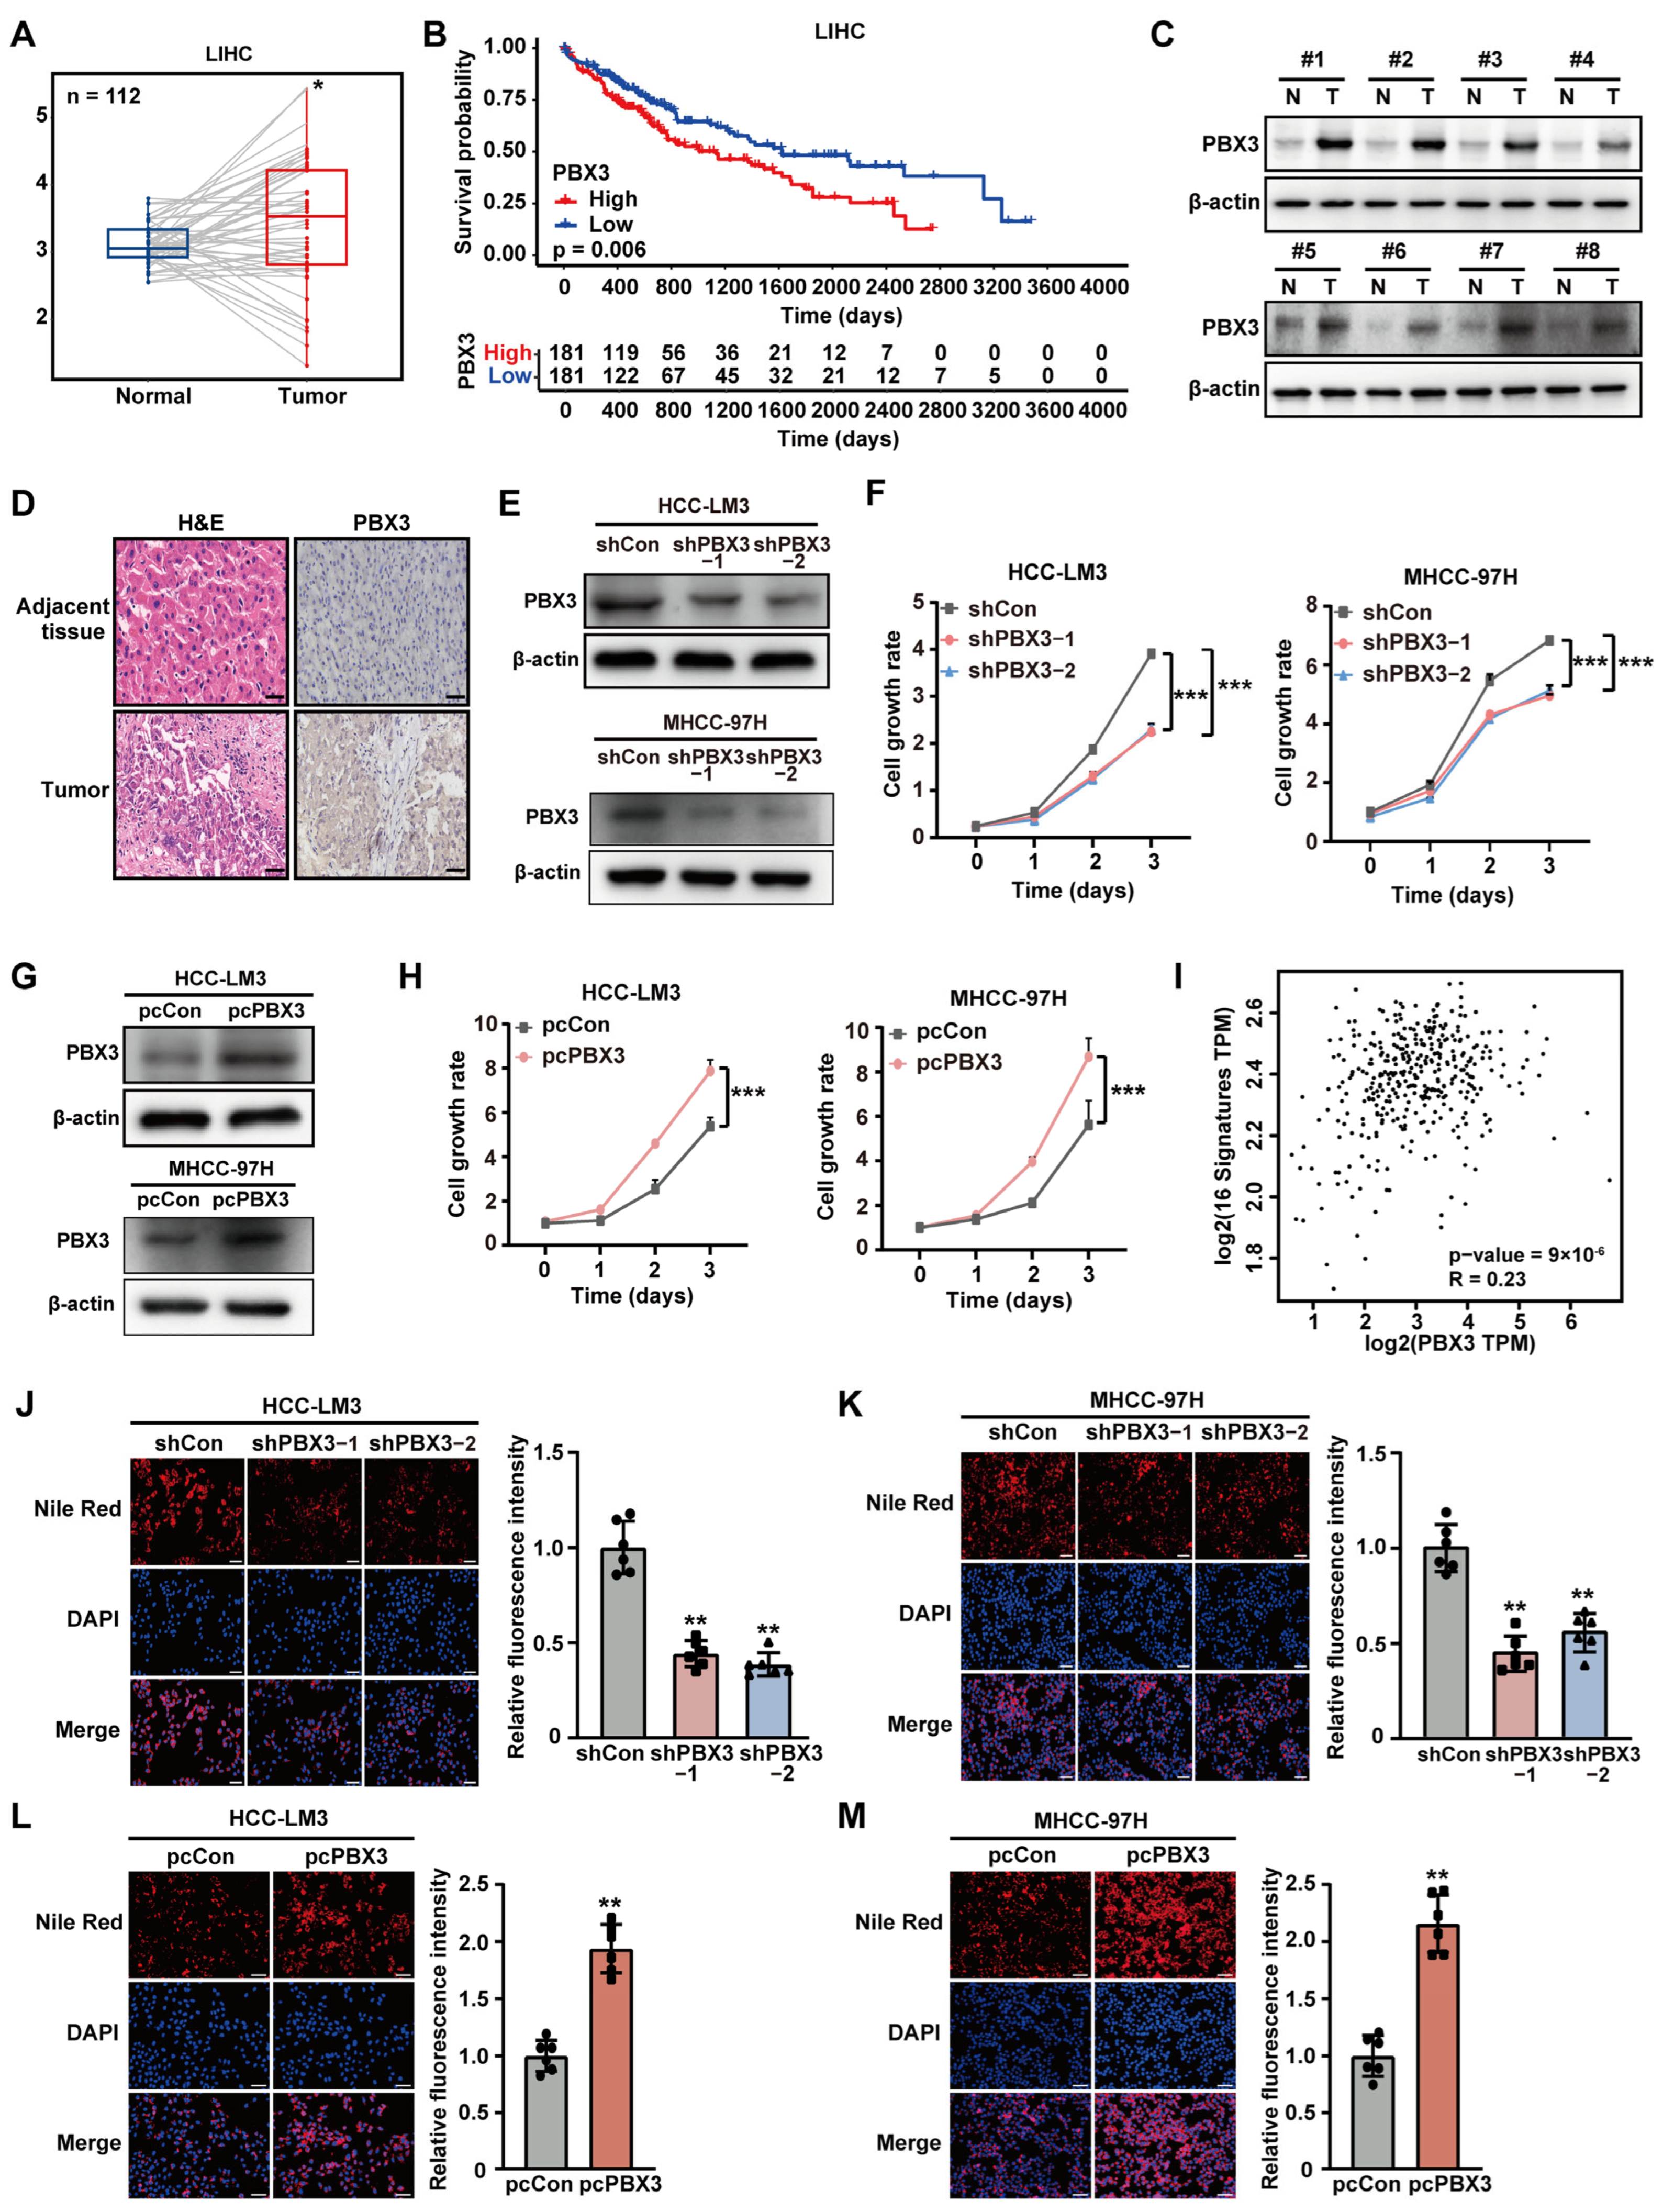 represent the data of each group. pcCon: pcEF9-Puro; * p < 0.05; ** p < 0.01; *** p < 0.001; NS: not significant.
represent the data of each group. pcCon: pcEF9-Puro; * p < 0.05; ** p < 0.01; *** p < 0.001; NS: not significant.
represent the data of each group. pcCon: pcEF9-Puro; * p < 0.05; ** p < 0.01; *** p < 0.001; NS: not significant.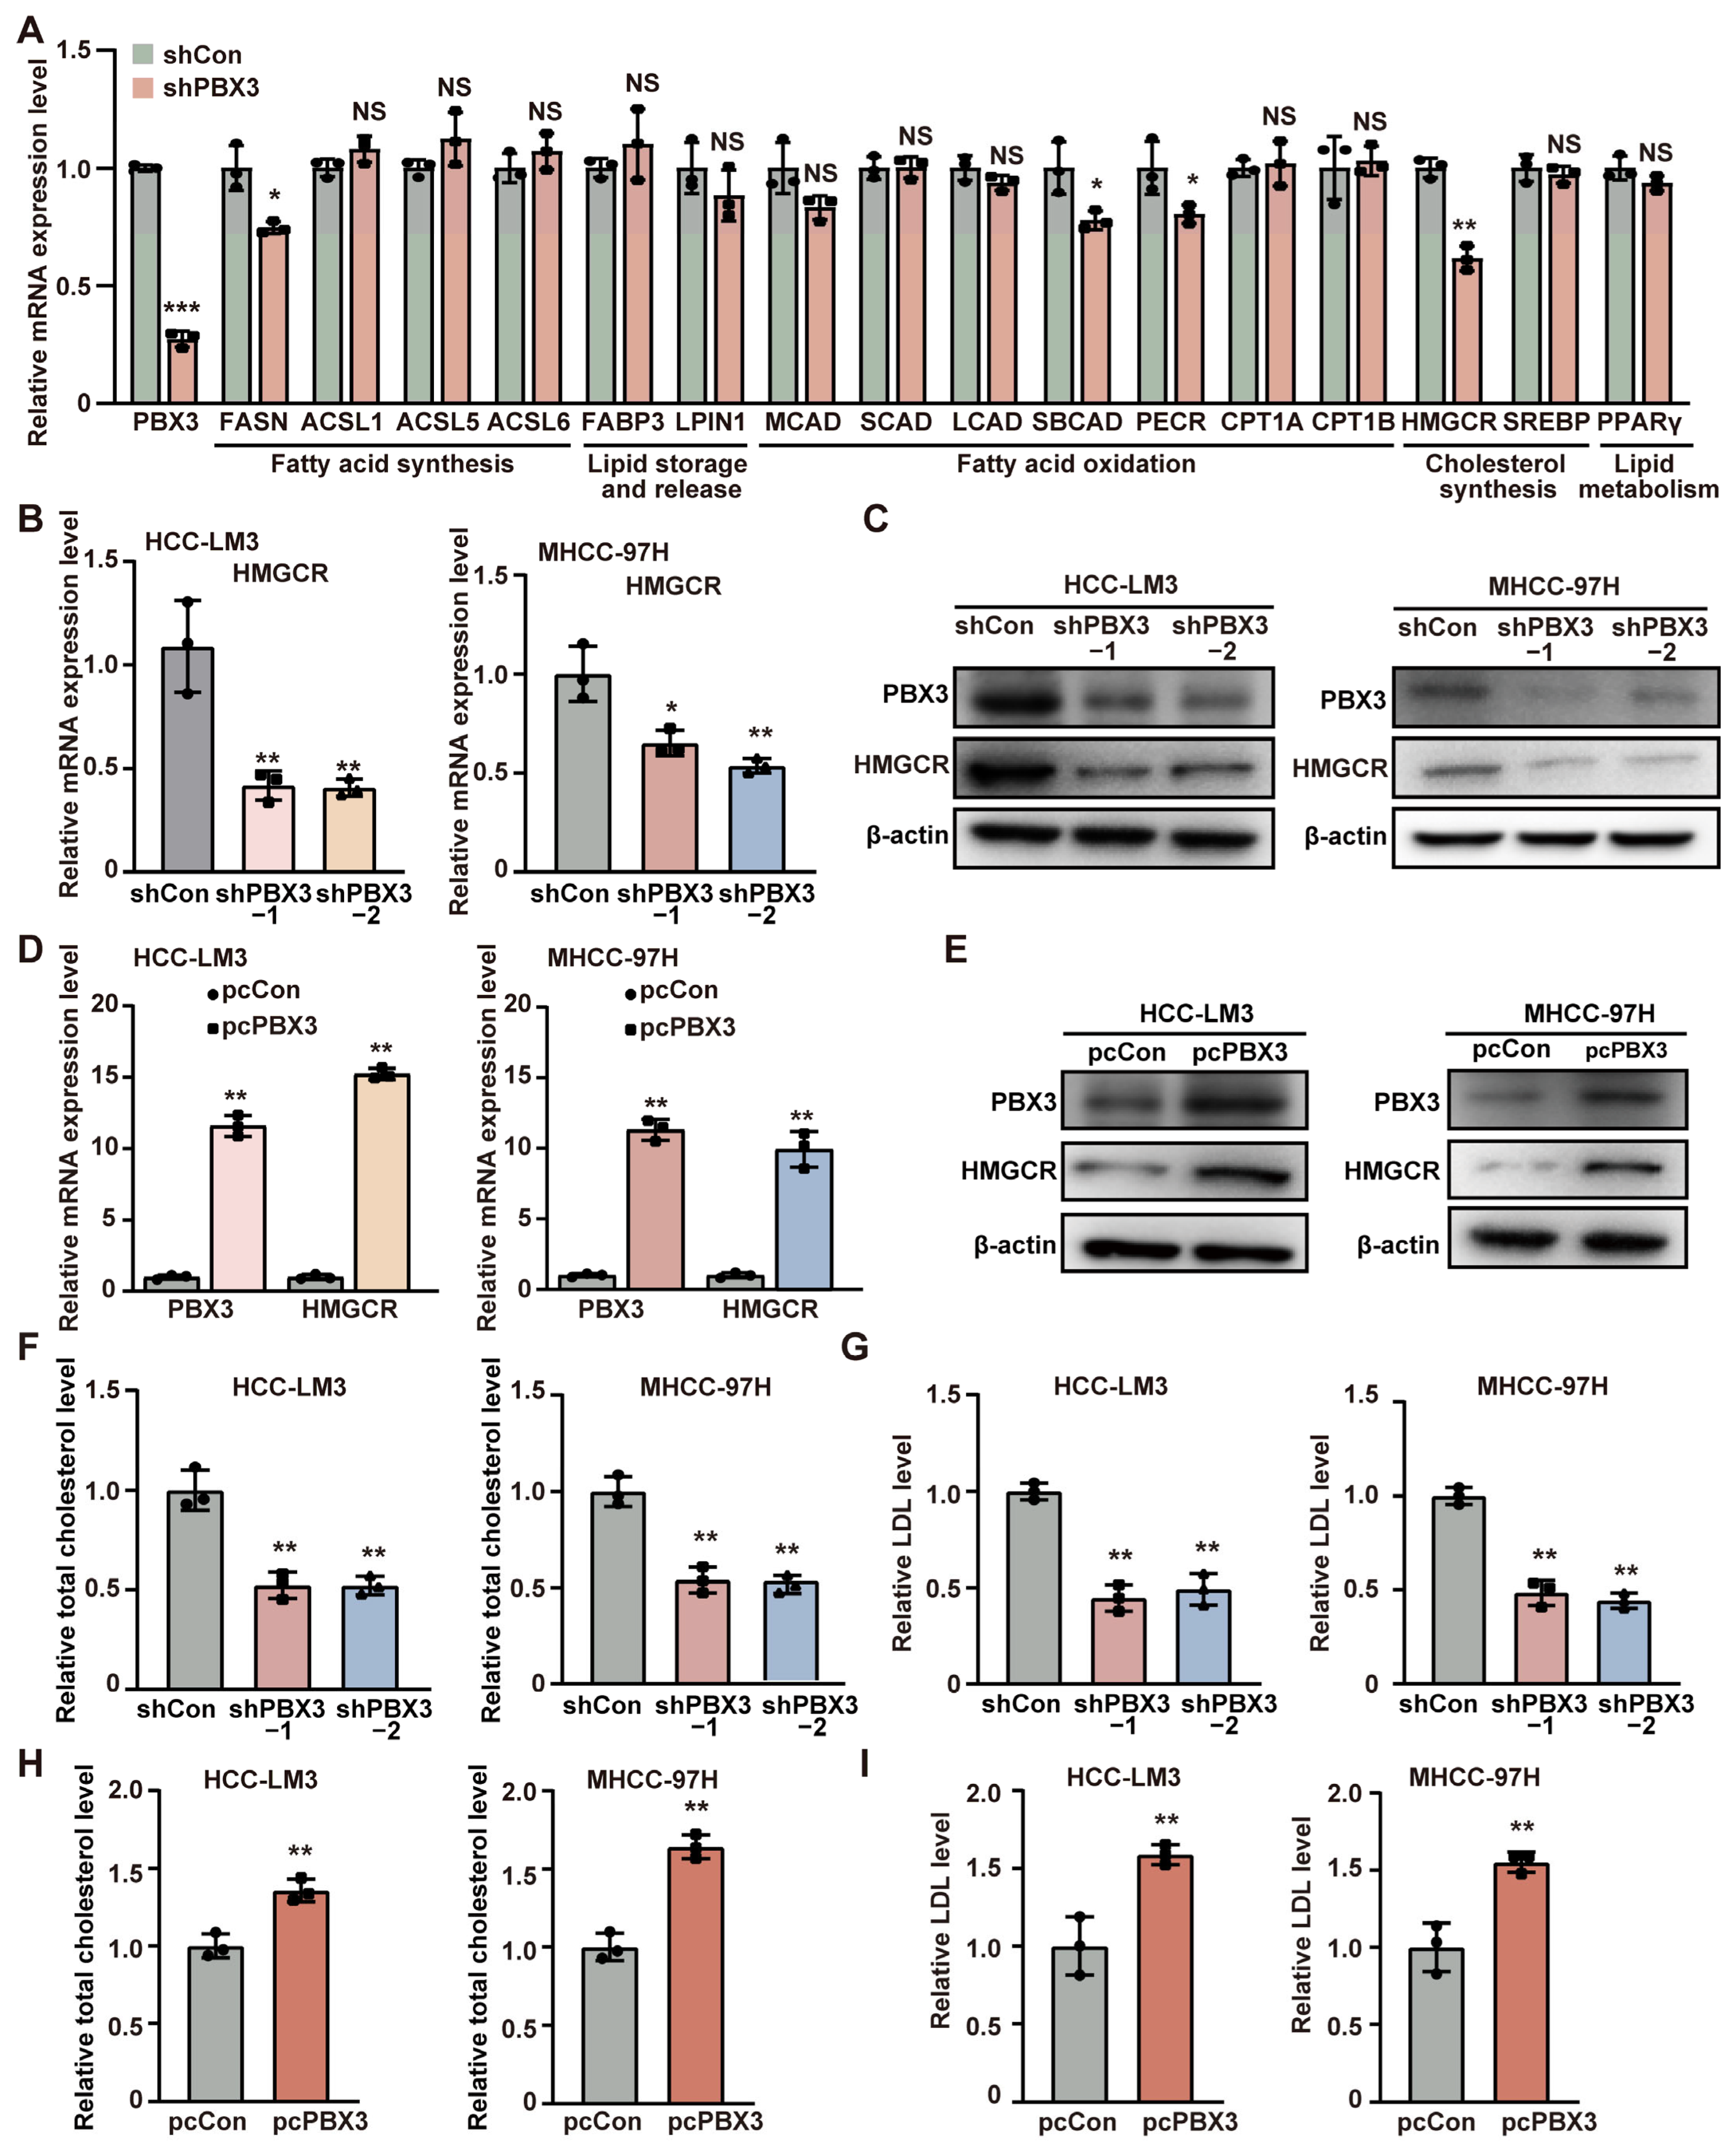 represent the data of each group. pcCon: pcEF9-Puro; * p < 0.05; ** p < 0.01.
represent the data of each group. pcCon: pcEF9-Puro; * p < 0.05; ** p < 0.01.
represent the data of each group. pcCon: pcEF9-Puro; * p < 0.05; ** p < 0.01.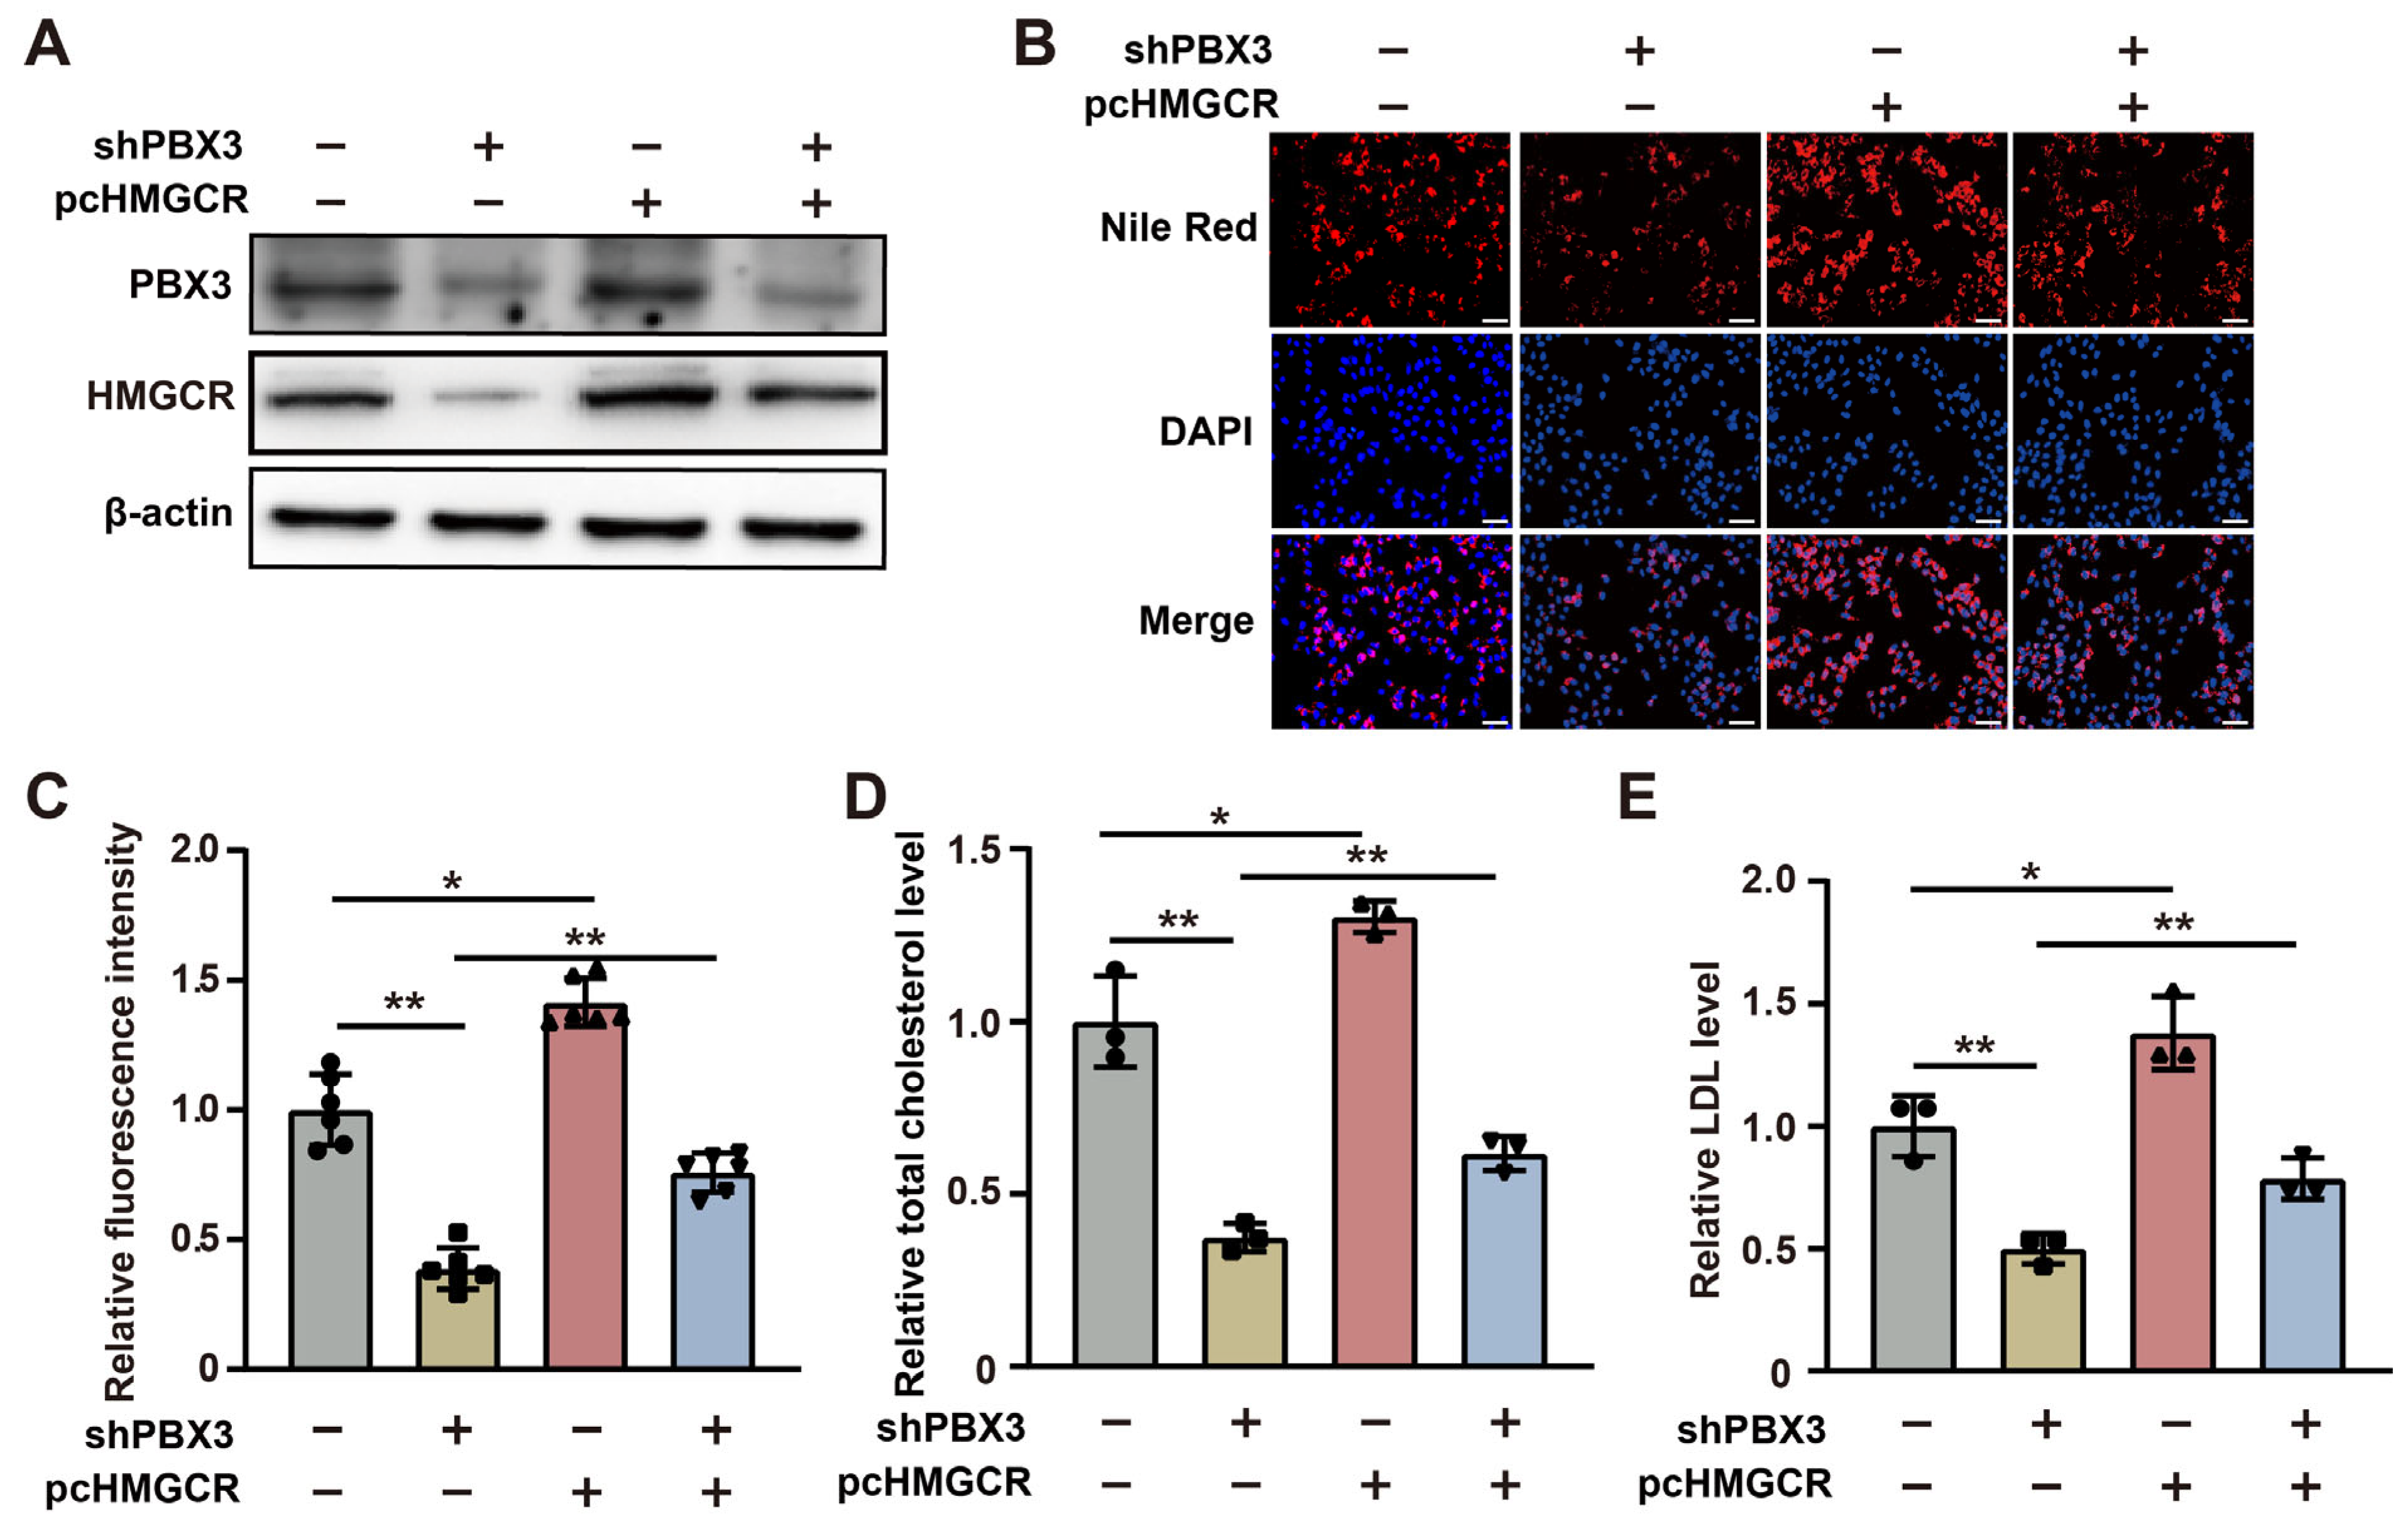 represent the data of each group. pcCon: pcEF9-Puro; ** p < 0.01; NS: not significant.
represent the data of each group. pcCon: pcEF9-Puro; ** p < 0.01; NS: not significant.
represent the data of each group. pcCon: pcEF9-Puro; ** p < 0.01; NS: not significant. represent the data of each group. pcCon: pcEF9-Puro; * p < 0.05; ** p < 0.01; *** p < 0.001.
represent the data of each group. pcCon: pcEF9-Puro; * p < 0.05; ** p < 0.01; *** p < 0.001.
represent the data of each group. pcCon: pcEF9-Puro; * p < 0.05; ** p < 0.01; *** p < 0.001.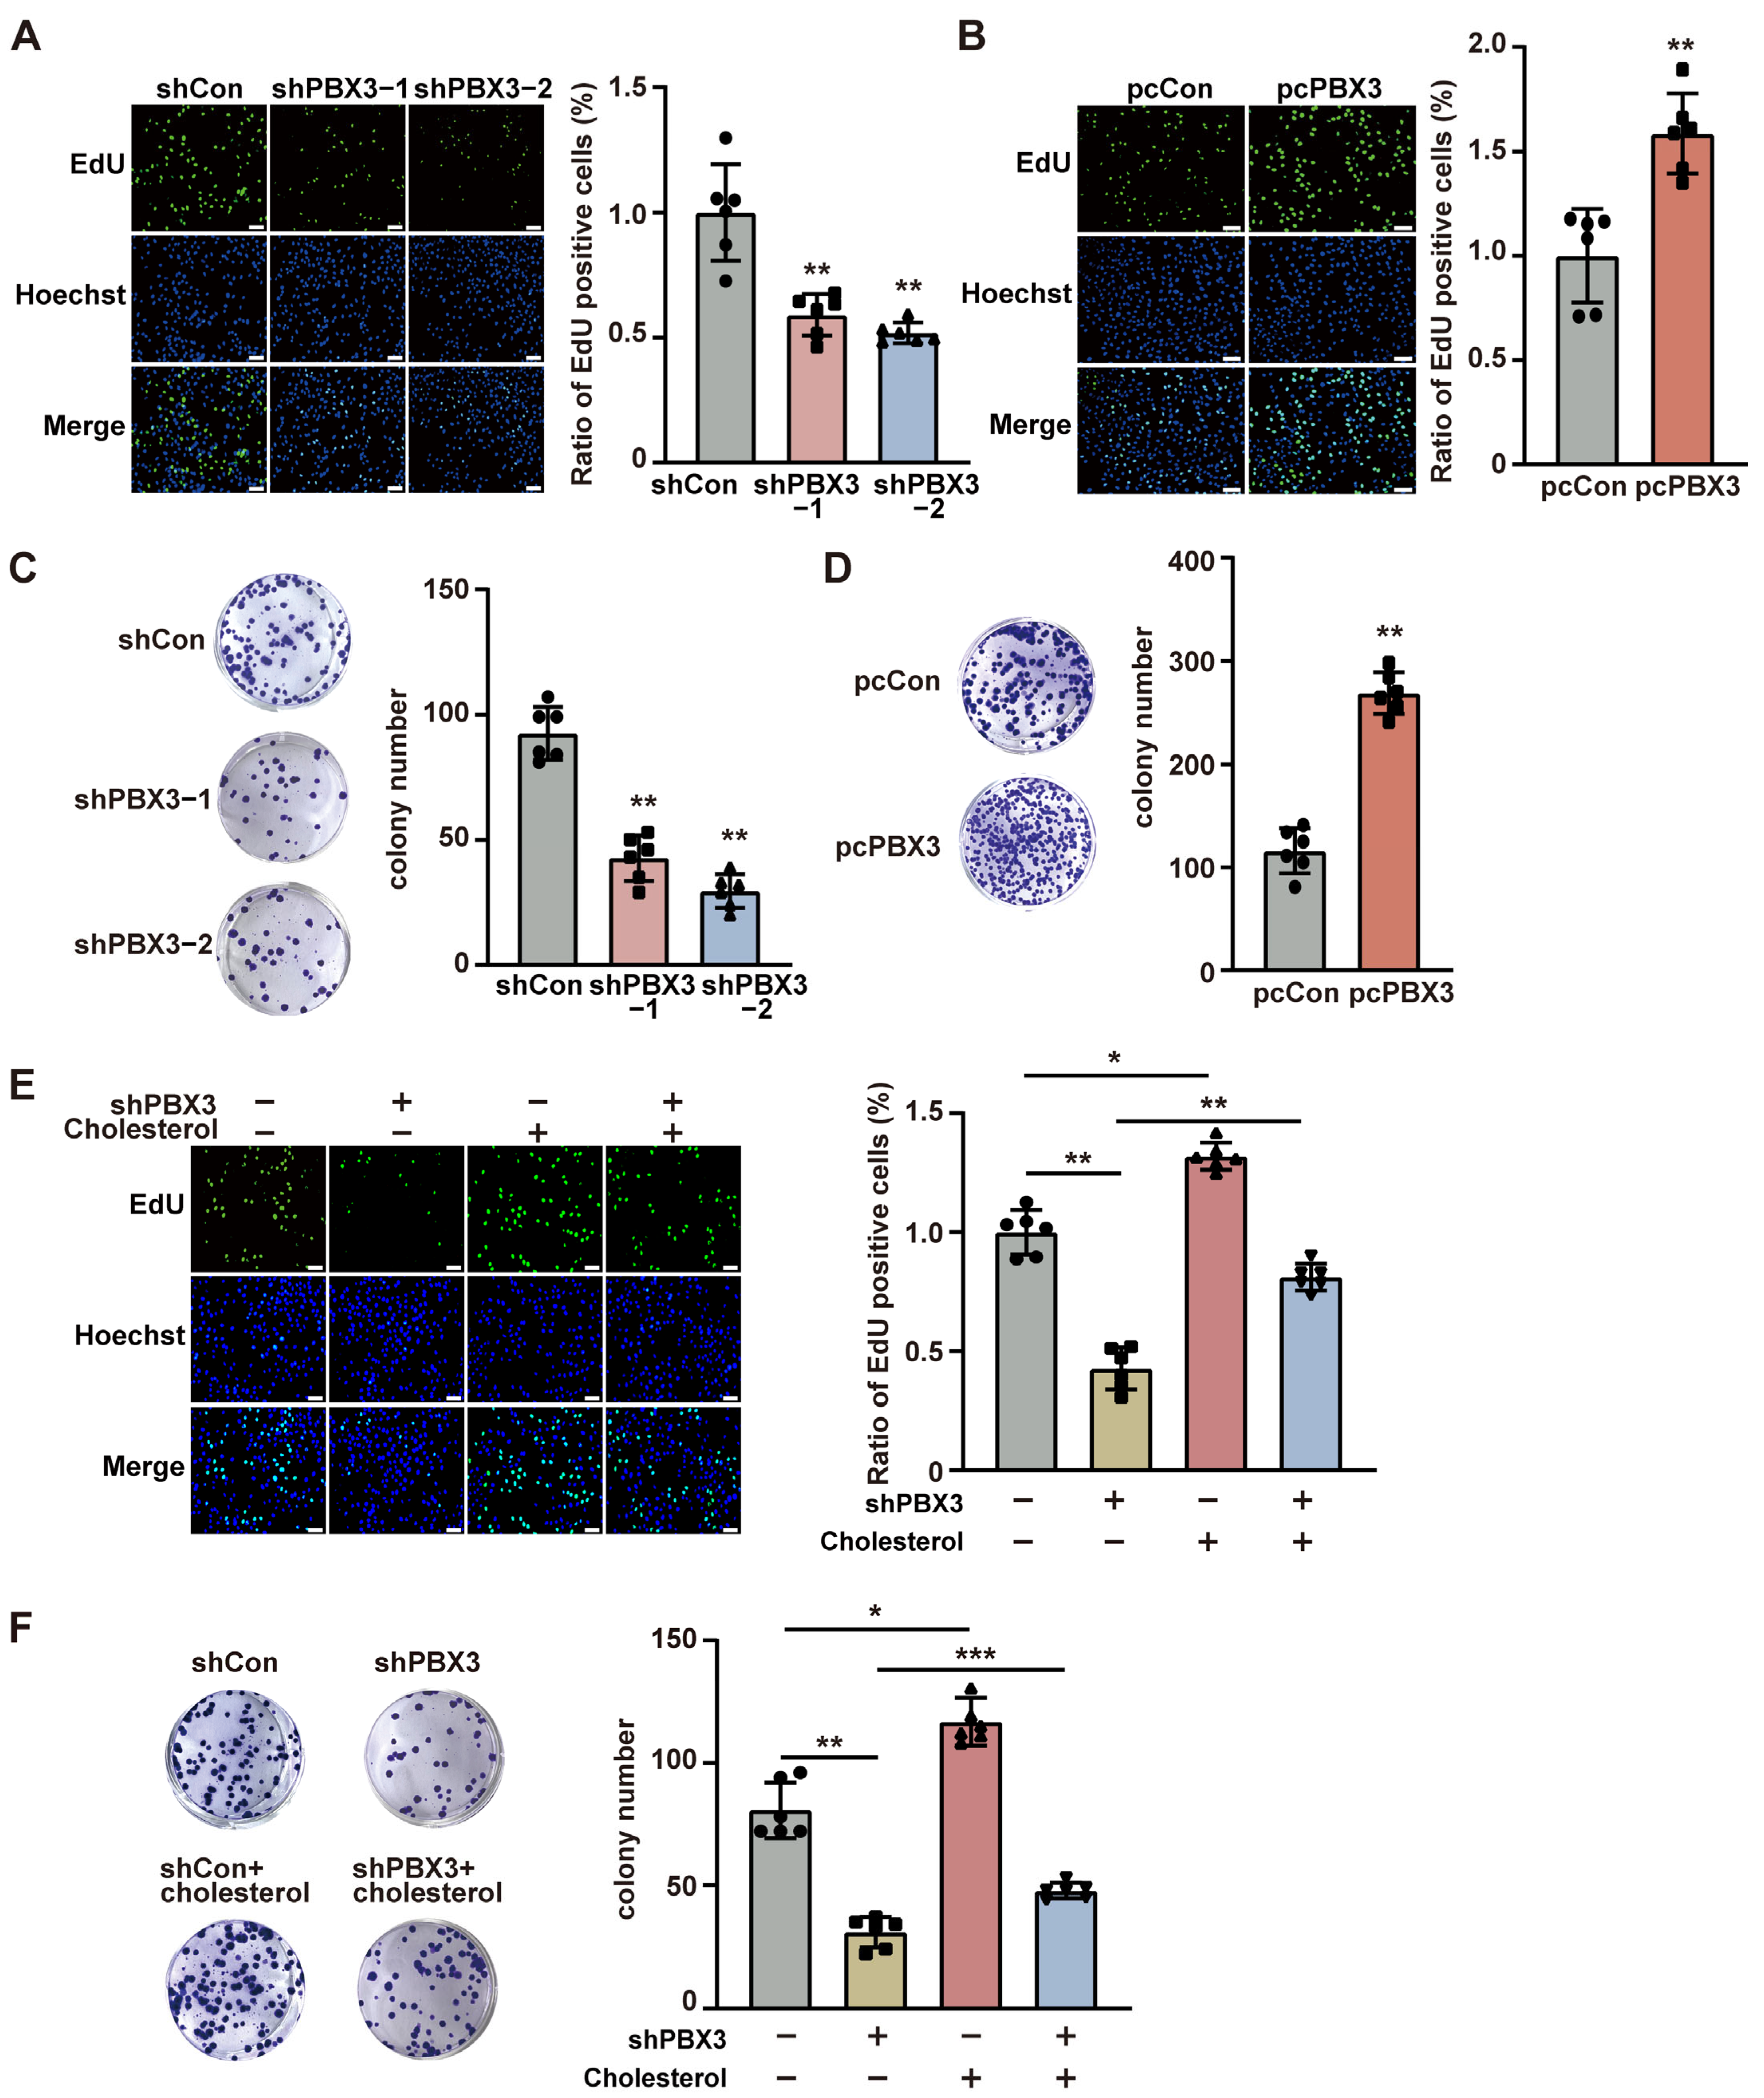 represent the data of each group. pcCon: pcEF9-Puro; * p < 0.05; ** p < 0.01; *** p < 0.001.
represent the data of each group. pcCon: pcEF9-Puro; * p < 0.05; ** p < 0.01; *** p < 0.001.
represent the data of each group. pcCon: pcEF9-Puro; * p < 0.05; ** p < 0.01; *** p < 0.001.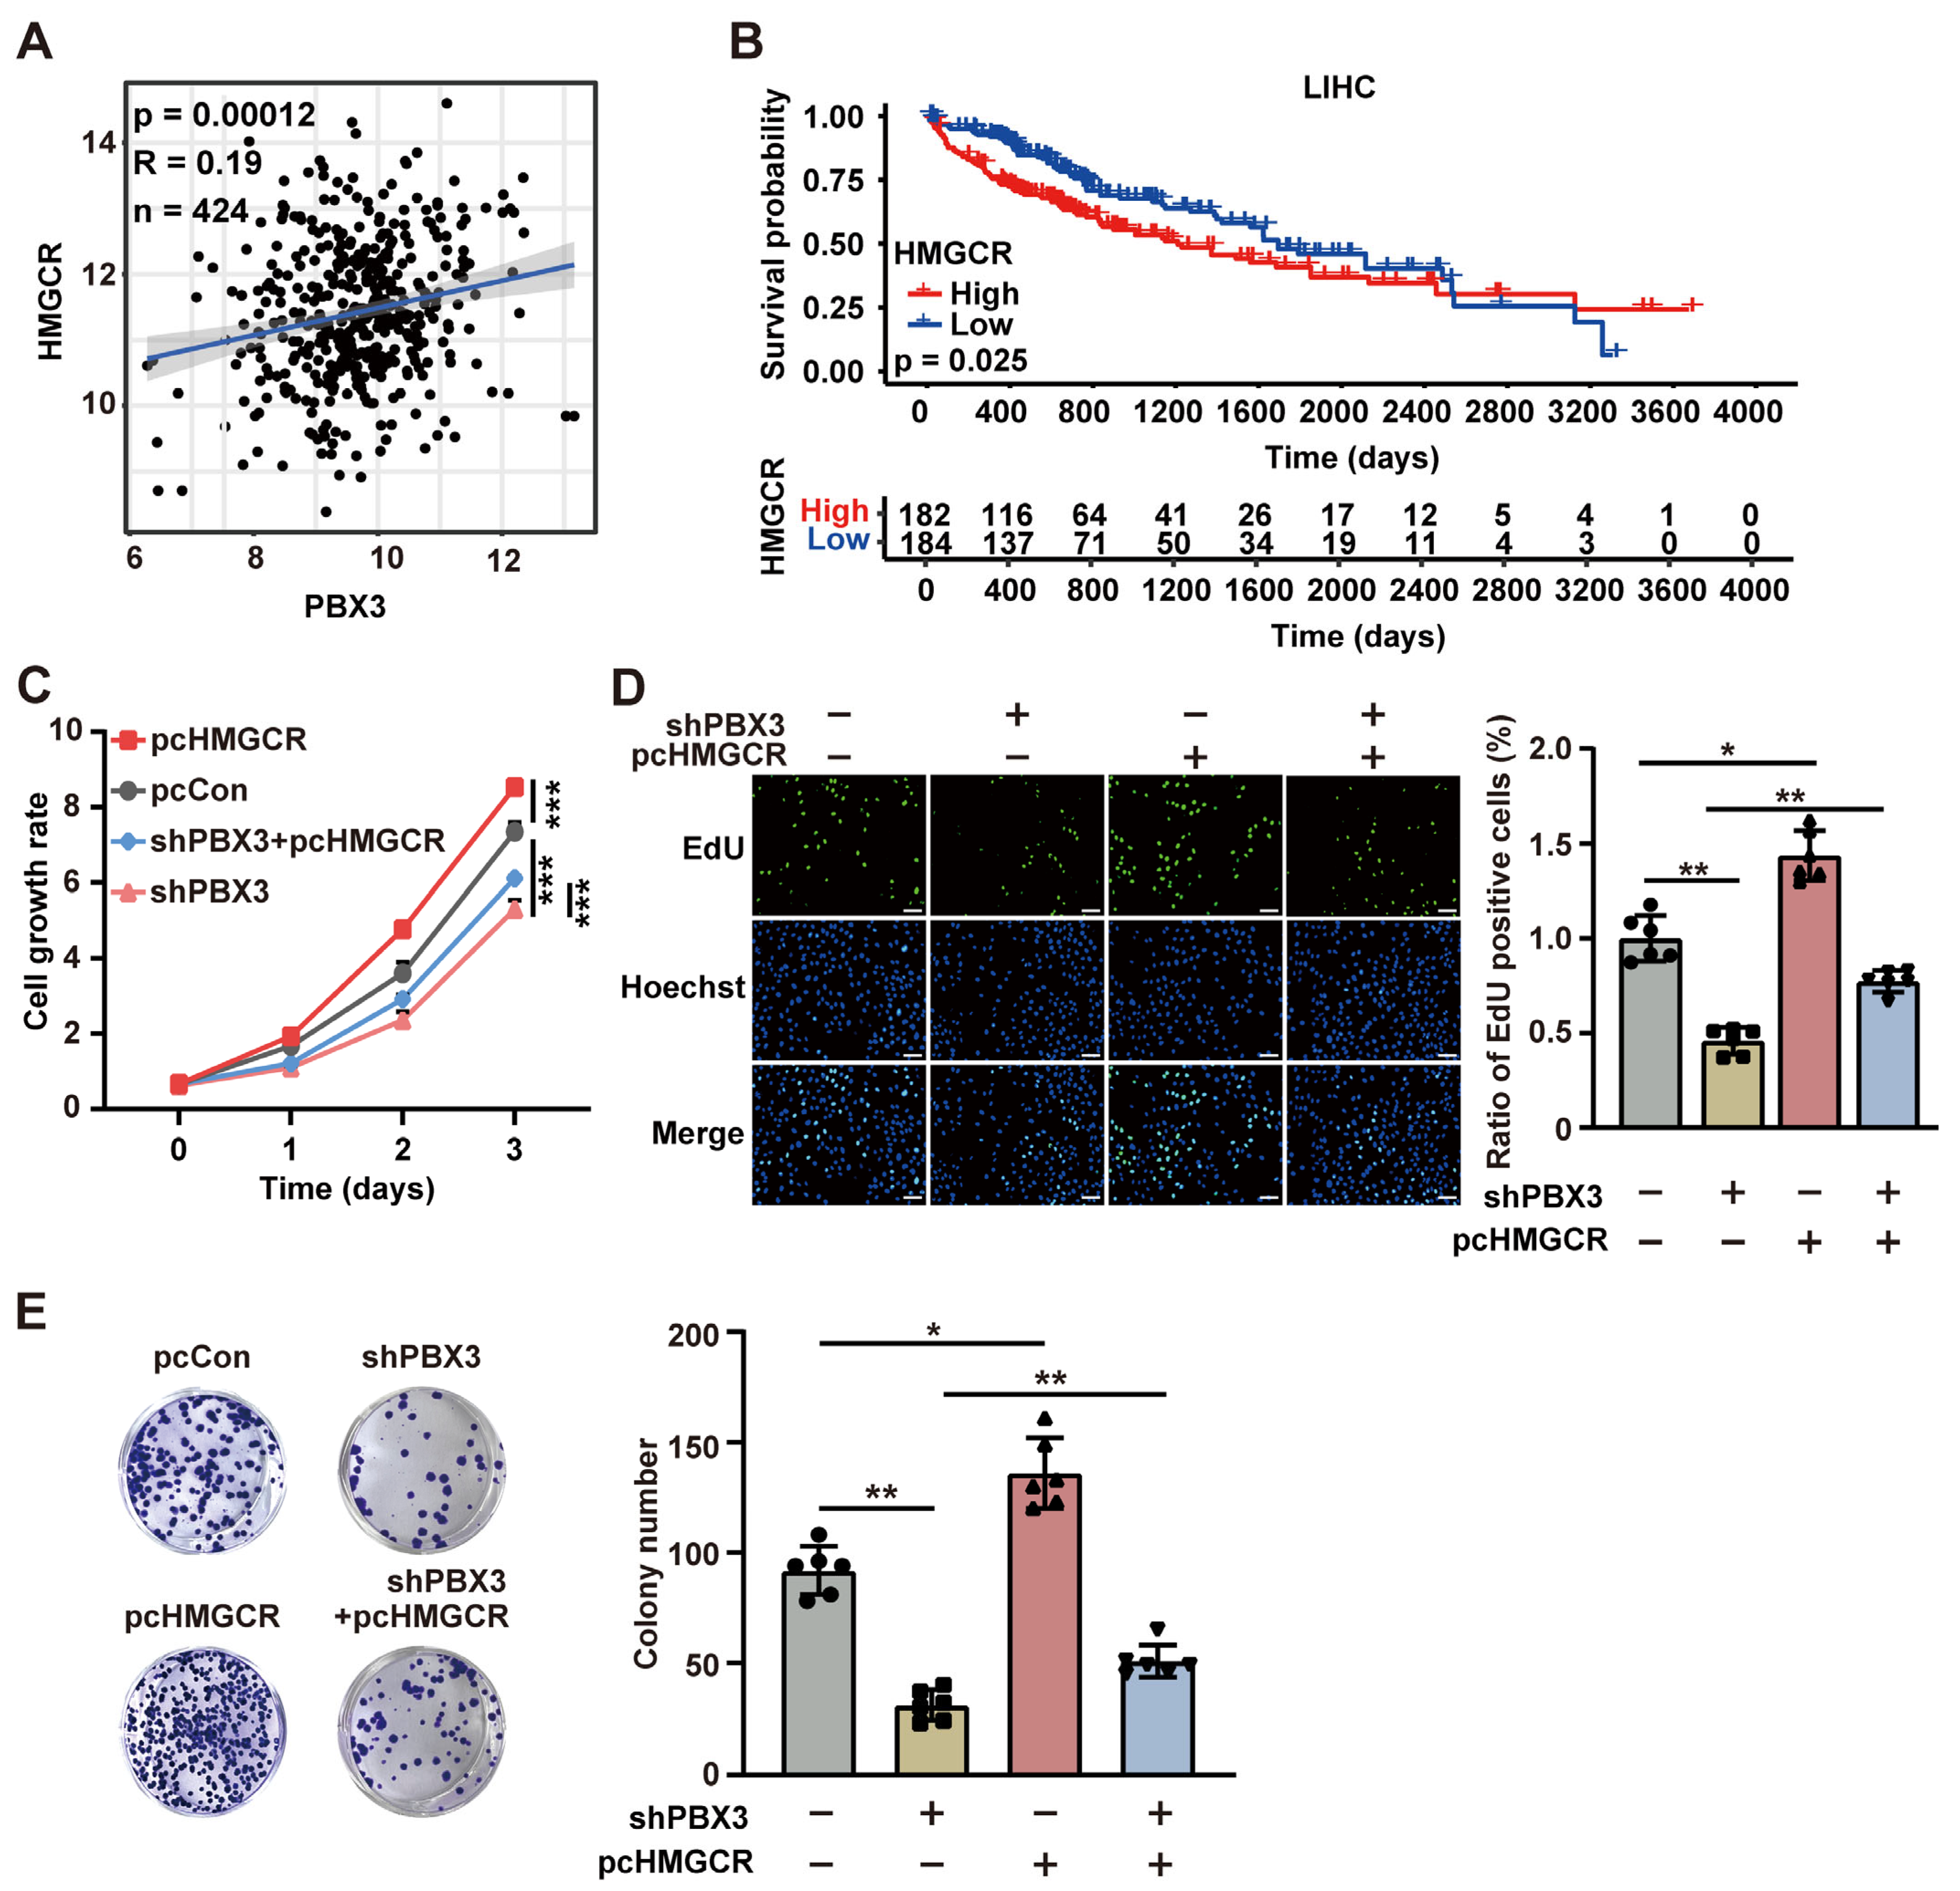 represent the data of each group. pcCon: pcEF9-Puro; ** p < 0.01; *** p < 0.001.
represent the data of each group. pcCon: pcEF9-Puro; ** p < 0.01; *** p < 0.001.
represent the data of each group. pcCon: pcEF9-Puro; ** p < 0.01; *** p < 0.001.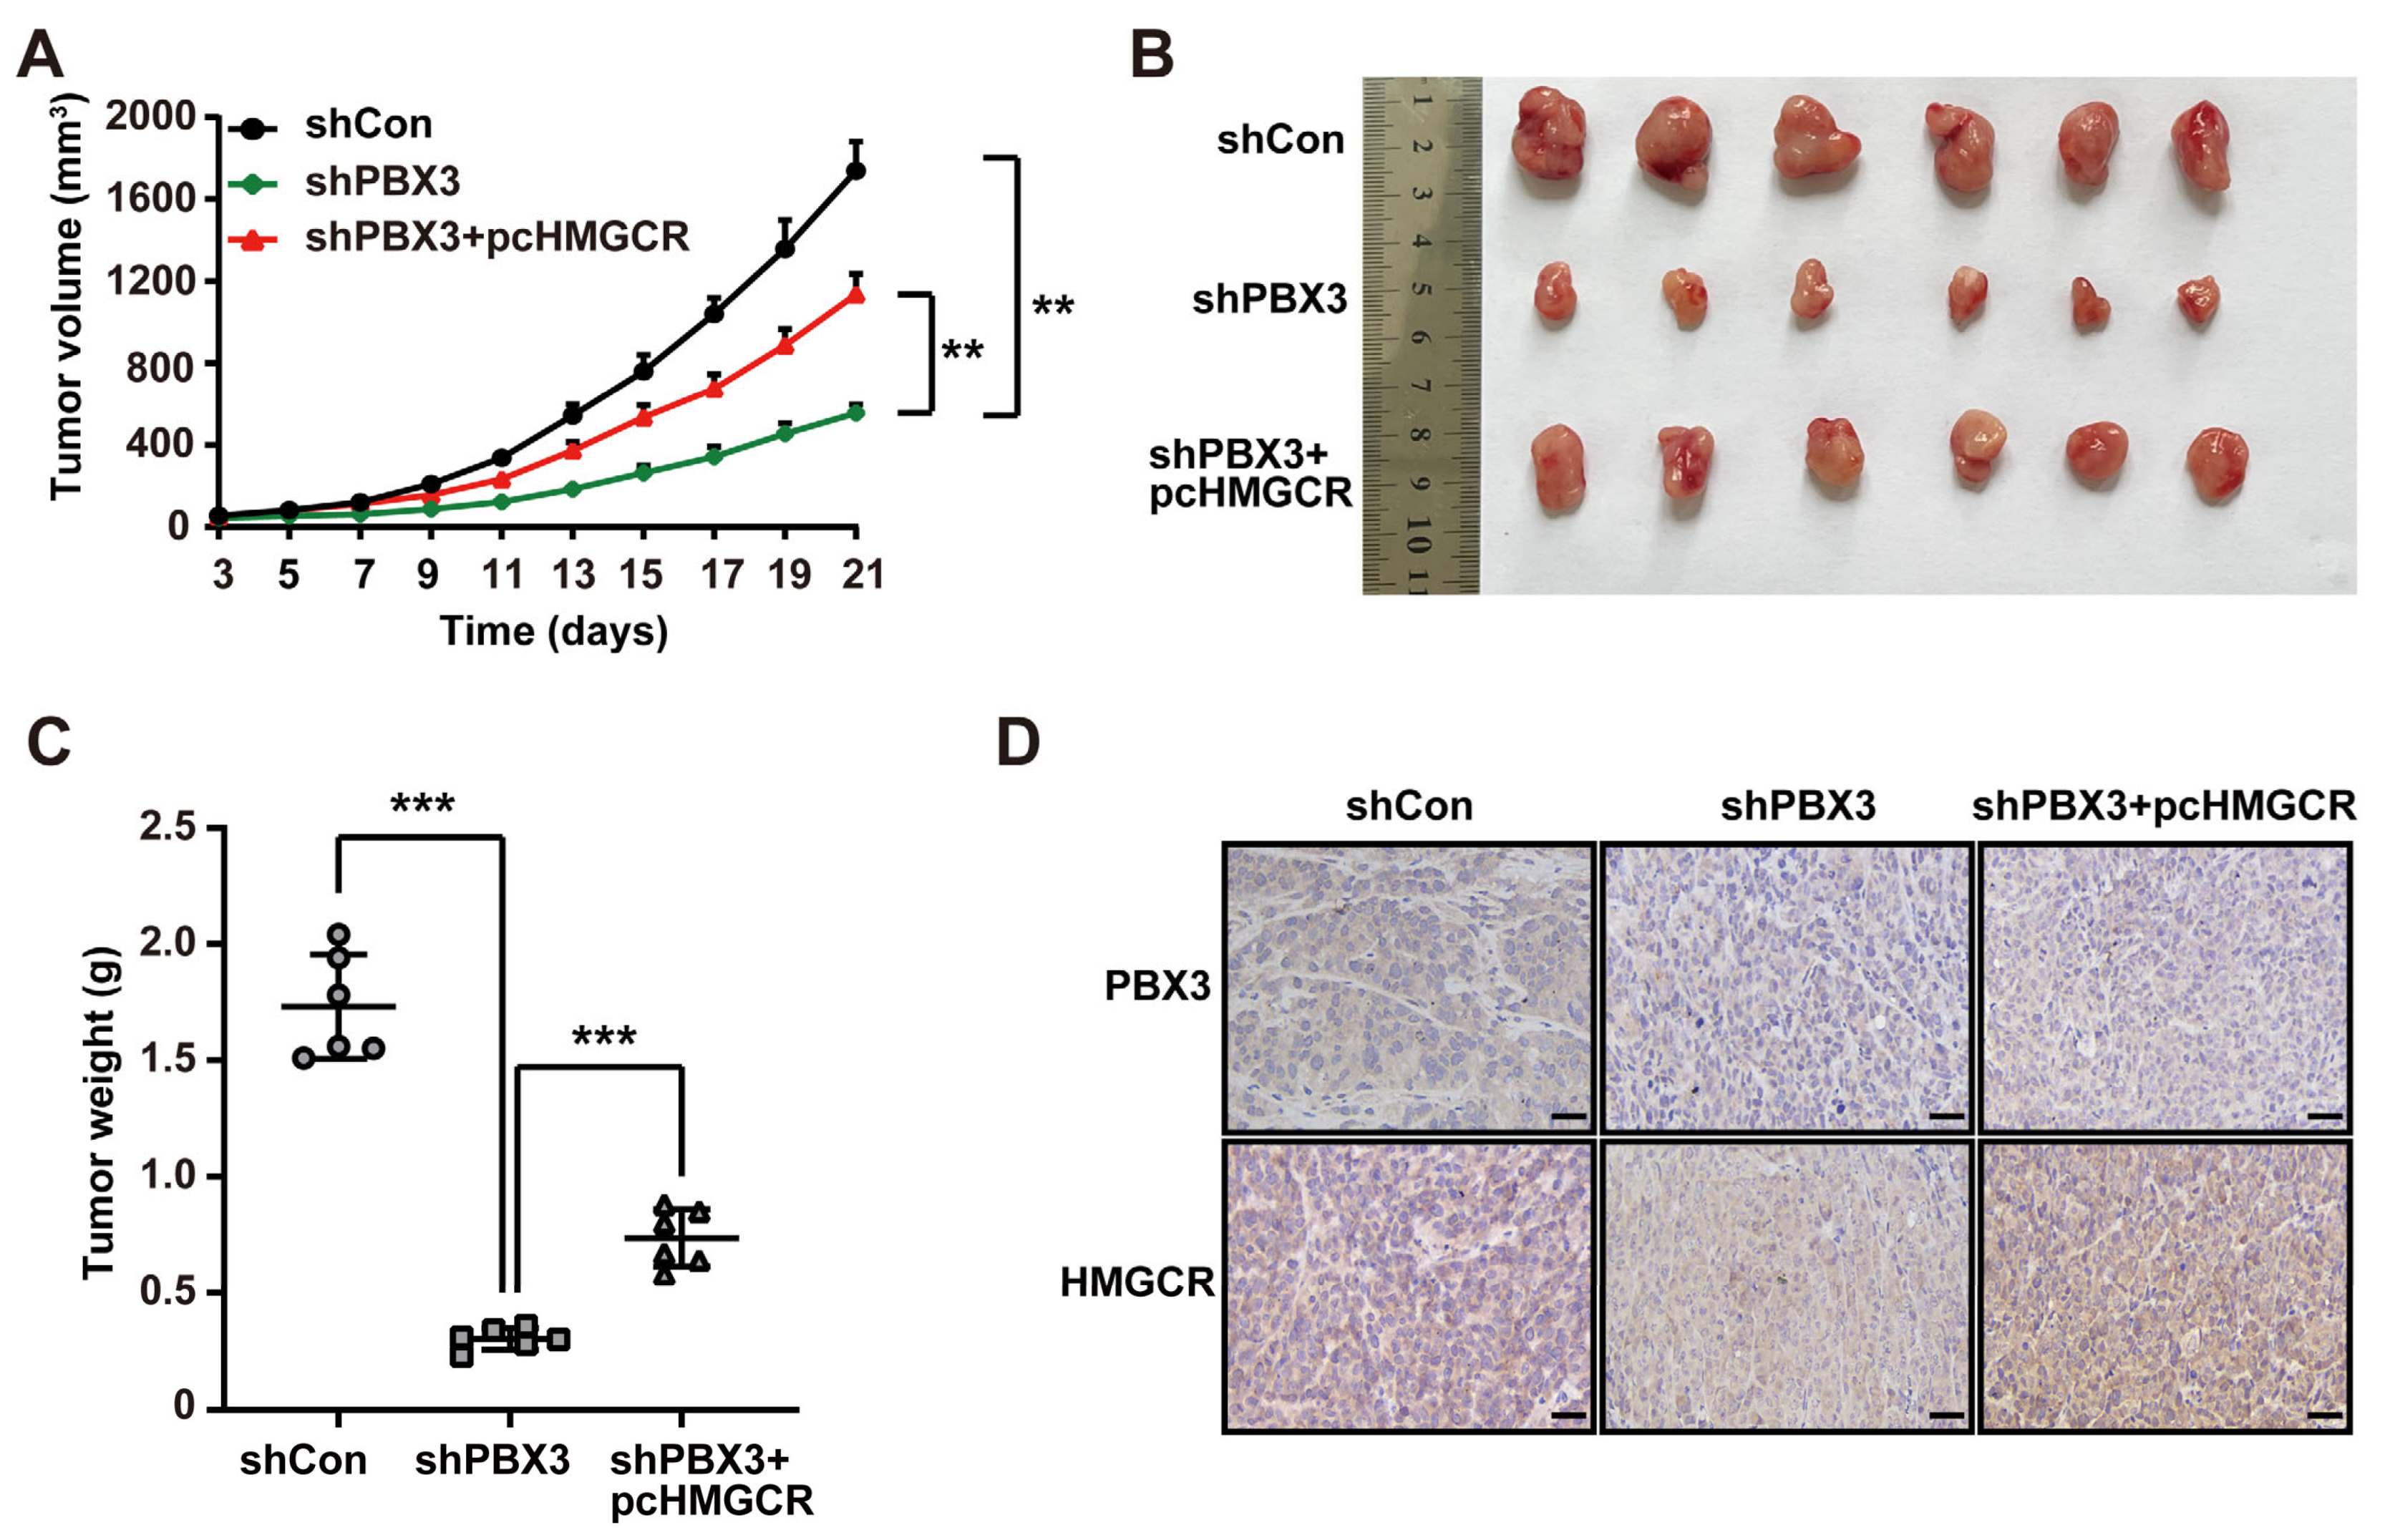
Disclaimer/Publisher’s Note: The statements, opinions and data contained in all publications are solely those of the individual author(s) and contributor(s) and not of MDPI and/or the editor(s). MDPI and/or the editor(s) disclaim responsibility for any injury to people or property resulting from any ideas, methods, instructions or products referred to in the content. |
© 2025 by the authors. Licensee MDPI, Basel, Switzerland. This article is an open access article distributed under the terms and conditions of the Creative Commons Attribution (CC BY) license (https://creativecommons.org/licenses/by/4.0/).
Share and Cite
Zhang, X.; Qiu, L.; Zhang, L.; Li, W.; Xiang, D.; Wang, J.; Wu, S.; Kasim, V. PBX3-HMGCR Axis Promotes Hepatocellular Carcinoma Progression Through Enhancing De Novo Cholesterol Biosynthesis. Int. J. Mol. Sci. 2025, 26, 5210. https://doi.org/10.3390/ijms26115210
Zhang X, Qiu L, Zhang L, Li W, Xiang D, Wang J, Wu S, Kasim V. PBX3-HMGCR Axis Promotes Hepatocellular Carcinoma Progression Through Enhancing De Novo Cholesterol Biosynthesis. International Journal of Molecular Sciences. 2025; 26(11):5210. https://doi.org/10.3390/ijms26115210
Chicago/Turabian StyleZhang, Xia, Li Qiu, Lei Zhang, Wenfang Li, Debing Xiang, Jian Wang, Shourong Wu, and Vivi Kasim. 2025. "PBX3-HMGCR Axis Promotes Hepatocellular Carcinoma Progression Through Enhancing De Novo Cholesterol Biosynthesis" International Journal of Molecular Sciences 26, no. 11: 5210. https://doi.org/10.3390/ijms26115210
APA StyleZhang, X., Qiu, L., Zhang, L., Li, W., Xiang, D., Wang, J., Wu, S., & Kasim, V. (2025). PBX3-HMGCR Axis Promotes Hepatocellular Carcinoma Progression Through Enhancing De Novo Cholesterol Biosynthesis. International Journal of Molecular Sciences, 26(11), 5210. https://doi.org/10.3390/ijms26115210