
Effect of Microglial Activity on Gut Microbiota in Rats with Neuropathic Pain


Abstract
1. Introduction
2. Results
3. Discussion
4. Materials and Methods
4.1. Ethics
4.2. Animals
4.3. Assessment of NP
4.4. Surgery for NP
4.5. Spinal Cord Preparation
4.6. Microglial Activity in the Spinal Cord
4.7. Cytokines in the Spinal Cord
4.8. Gut Microbiota
4.9. Statistics
Author Contributions
Funding
Institutional Review Board Statement
Data Availability Statement
Acknowledgments
Conflicts of Interest
Abbreviations
| ANOVA | Analysis of variance |
| CNS | Central nervous system |
| DAPI | 4,6-diamidino-2-phenylindole |
| ELISA | Enzyme-linked immunosorbent assay |
| F/B | Firmicutes/Bacteroidetes |
| IACUC | Institutional animal care and use committee |
| Iba1 | Ionized calcium binding adaptor molecule 1 |
| IL | Interleukin |
| NP | Neuropathic pain |
| PBS | Phosphate buffered saline |
| rRNA | Ribosomal RNA |
| TMEM | Transmembrane protein |
| TNF-α | Tumor necrosis factor-alpha |
References
- Finnerup, N.B.; Haroutounian, S.; Kamerman, P.; Baron, R.; Bennett, D.L.H.; Bouhassira, D.; Cruccu, G.; Freeman, R.; Hansson, P.; Nurmikko, T.; et al. Neuropathic pain: An updated grading system for research and clinical practice. Pain 2016, 157, 1599–1606. [Google Scholar] [CrossRef] [PubMed]
- Jensen, T.S.; Finnerup, N.B. Allodynia and hyperalgesia in neuropathic pain: Clinical manifestations and mechanisms. Lancet Neurol. 2014, 13, 924–935. [Google Scholar] [CrossRef] [PubMed]
- Torta, R.; Ieraci, V.; Zizzi, F. A Review of the Emotional Aspects of Neuropathic Pain: From Comorbidity to Co-Pathogenesis. Pain Ther. 2017, 6, 11–17. [Google Scholar] [CrossRef]
- O’Connor, A.B.; Dworkin, R.H. Treatment of neuropathic pain: An overview of recent guidelines. Am. J. Med. 2009, 122, S22–S32. [Google Scholar] [CrossRef]
- Bouhassira, D.; Attal, N. Personalized treatment of neuropathic pain: Where are we now? Eur. J. Pain 2023, 27, 1084–1098. [Google Scholar] [CrossRef]
- Tsuda, M.; Masuda, T.; Kohno, K. Microglial diversity in neuropathic pain. Trends Neurosci. 2023, 46, 597–610. [Google Scholar] [CrossRef]
- Karavis, M.Y.; Siafaka, I.; Vadalouca, A.; Georgoudis, G. Role of Microglia in Neuropathic Pain. Cureus 2023, 15, e43555. [Google Scholar] [CrossRef]
- Atta, A.A.; Ibrahim, W.W.; Mohamed, A.F.; Abdelkader, N.F. Microglia polarization in nociplastic pain: Mechanisms and perspectives. Inflammopharmacology 2023, 31, 1053–1067. [Google Scholar] [CrossRef]
- Poppell, M.; Hammel, G.; Ren, Y. Immune Regulatory Functions of Macrophages and Microglia in Central Nervous System Diseases. Int. J. Mol. Sci. 2023, 24, 5925. [Google Scholar] [CrossRef]
- Mika, J.; Zychowska, M.; Popiolek-Barczyk, K.; Rojewska, E.; Przewlocka, B. Importance of glial activation in neuropathic pain. Eur. J. Pharmacol. 2013, 716, 106–119. [Google Scholar] [CrossRef] [PubMed]
- Mika, J.; Osikowicz, M.; Makuch, W.; Przewlocka, B. Minocycline and pentoxifylline attenuate allodynia and hyperalgesia and potentiate the effects of morphine in rat and mouse models of neuropathic pain. Eur. J. Pharmacol. 2007, 560, 142–149. [Google Scholar] [CrossRef] [PubMed]
- Tsuda, M.; Masuda, T.; Tozaki-Saitoh, H.; Inoue, K. Microglial regulation of neuropathic pain. J. Pharmacol. Sci. 2013, 121, 89–94. [Google Scholar] [CrossRef] [PubMed]
- Mika, J.; Popiolek-Barczyk, K.; Rojewska, E.; Makuch, W.; Starowicz, K.; Przewlocka, B. Delta-opioid receptor analgesia is independent of microglial activation in a rat model of neuropathic pain. PLoS ONE 2014, 9, e104420. [Google Scholar] [CrossRef]
- Guo, R.; Chen, L.H.; Xing, C.; Liu, T. Pain regulation by gut microbiota: Molecular mechanisms and therapeutic potential. Br. J. Anaesth. 2019, 123, 637–654. [Google Scholar] [CrossRef]
- Chen, P.; Wang, C.; Ren, Y.N.; Ye, Z.J.; Jiang, C.; Wu, Z.B. Alterations in the gut microbiota and metabolite profiles in the context of neuropathic pain. Mol. Brain 2021, 14, 50. [Google Scholar] [CrossRef]
- Pane, K.; Boccella, S.; Guida, F.; Franzese, M.; Maione, S.; Salvatore, M. Role of gut microbiota in neuropathy and neuropathic pain states: A systematic preclinical review. Neurobiol. Dis. 2022, 170, 105773. [Google Scholar] [CrossRef]
- Tsuda, M.; Shigemoto-Mogami, Y.; Koizumi, S.; Mizokoshi, A.; Kohsaka, S.; Salter, M.W.; Inoue, K. P2X4 receptors induced in spinal microglia gate tactile allodynia after nerve injury. Nature 2003, 424, 778–783. [Google Scholar] [CrossRef]
- Hong, S.-W.; Piao, L.; Cho, E.-H.; Seo, E.-H.; Kim, S.-H. The Effect of Pregabalin on Microglia Differentiation in Rat with Neuropathic pain: A Preliminary Study. Int. J. Med. Sci. 2024, 21, 1265–1273. [Google Scholar] [CrossRef]
- Shreiner, A.B.; Kao, J.Y.; Young, V.B. The gut microbiome in health and in disease. Curr. Opin. Gastroenterol. 2015, 31, 69–75. [Google Scholar] [CrossRef]
- Cockburn, D.W.; Koropatkin, N.M. Polysaccharide Degradation by the Intestinal Microbiota and Its Influence on Human Health and Disease. J. Mol. Biol. 2016, 428, 3230–3252. [Google Scholar] [CrossRef]
- Jandhyala, S.M.; Talukdar, R.; Subramanyam, C.; Vuyyuru, H.; Sasikala, M.; Nageshwar Reddy, D. Role of the normal gut microbiota. World J. Gastroenterol. 2015, 21, 8787–8803. [Google Scholar] [CrossRef] [PubMed]
- Ahmad, K.A.; Shoaib, R.M.; Ahsan, M.Z.; Deng, M.Y.; Ma, L.; Apryani, E.; Li, X.Y.; Wang, Y.X. Microglial IL-10 and beta-endorphin expression mediates gabapentinoids antineuropathic pain. Brain Behav. Immun. 2021, 95, 344–361. [Google Scholar] [CrossRef]
- Rinninella, E.; Raoul, P.; Cintoni, M.; Franceschi, F.; Miggiano, G.A.D.; Gasbarrini, A.; Mele, M.C. What is the Healthy Gut Microbiota Composition? A Changing Ecosystem across Age, Environment, Diet, and Diseases. Microorganisms 2019, 7, 14. [Google Scholar] [CrossRef] [PubMed]
- Jeffery, I.B.; O’Toole, P.W.; Ohman, L.; Claesson, M.J.; Deane, J.; Quigley, E.M.; Simren, M. An irritable bowel syndrome subtype defined by species-specific alterations in faecal microbiota. Gut 2012, 61, 997–1006. [Google Scholar] [CrossRef]
- Mitrea, L.; Nemes, S.A.; Szabo, K.; Teleky, B.E.; Vodnar, D.C. Guts Imbalance Imbalances the Brain: A Review of Gut Microbiota Association With Neurological and Psychiatric Disorders. Front. Med. 2022, 9, 813204. [Google Scholar] [CrossRef]
- Sirisinha, S. The potential impact of gut microbiota on your health:Current status and future challenges. Asian Pac. J. Allergy Immunol. 2016, 34, 249–264. [Google Scholar] [CrossRef] [PubMed]
- O’ Mahony, S.M.; Dinan, T.G.; Cryan, J.F. The gut microbiota as a key regulator of visceral pain. Pain 2017, 158 (Suppl. S1), S19–S28. [Google Scholar] [CrossRef]
- Hao, X.; Shang, X.; Liu, J.; Chi, R.; Zhang, J.; Xu, T. The gut microbiota in osteoarthritis: Where do we stand and what can we do? Arthritis Res. Ther. 2021, 23, 42. [Google Scholar] [CrossRef]
- Yamauchi, Y.; Qin, L.H.; Nishihara, M.; Sawada, K.; Kato, K.; Inoue, S. Vulnerability of synaptic plasticity in the complexin II knockout mouse to maternal deprivation stress. Brain Res. 2005, 1056, 59–67. [Google Scholar] [CrossRef]
- Seo, E.H.; Piao, L.; Cho, E.H.; Hong, S.W.; Kim, S.H. The Effect of Ketamine on Endoplasmic Reticulum Stress in Rats with Neuropathic Pain. Int. J. Mol. Sci. 2023, 24, 5336. [Google Scholar] [CrossRef]
- Chaplan, S.R.; Bach, F.W.; Pogrel, J.W.; Chung, J.M.; Yaksh, T.L. Quantitative assessment of tactile allodynia in the rat paw. J. Neurosci. Methods 1994, 53, 55–63. [Google Scholar] [CrossRef] [PubMed]
- Deuis, J.R.; Dvorakova, L.S.; Vetter, I. Methods Used to Evaluate Pain Behaviors in Rodents. Front. Mol. Neurosci. 2017, 10, 284. [Google Scholar] [CrossRef] [PubMed]
- Decosterd, I.; Woolf, C.J. Spared nerve injury: An animal model of persistent peripheral neuropathic pain. Pain 2000, 87, 149–158. [Google Scholar] [CrossRef] [PubMed]
 ) Control group, (
 ) treatment group. Data are presented as means ± standard deviation (n = 6 per group). Statistical significance was determined by two-way repeated analysis of variance (ANOVA) followed by Tukey’s post hoc test for intra-group comparisons and unpaired t-test for inter-group comparisons. Abbreviations: Control, control group; treatment, treatment group; D0, before the surgery; D, day after the surgery; before, before the treatment of normal saline or pregabalin; after, 60 min after the treatment of normal saline or pregabalin. * p < 0.05 compared with D0 within the same group. † p < 0.05 compared with the control group at the same time point.
) Control group, () treatment group. Data are presented as means ± standard deviation (n = 6 per group). Statistical significance was determined by two-way repeated analysis of variance (ANOVA) followed by Tukey’s post hoc test for intra-group comparisons and unpaired t-test for inter-group comparisons. Abbreviations: Control, control group; treatment, treatment group; D0, before the surgery; D, day after the surgery; before, before the treatment of normal saline or pregabalin; after, 60 min after the treatment of normal saline or pregabalin. * p < 0.05 compared with D0 within the same group. † p < 0.05 compared with the control group at the same time point.
) treatment group. Data are presented as means ± standard deviation (n = 6 per group). Statistical significance was determined by two-way repeated analysis of variance (ANOVA) followed by Tukey’s post hoc test for intra-group comparisons and unpaired t-test for inter-group comparisons. Abbreviations: Control, control group; treatment, treatment group; D0, before the surgery; D, day after the surgery; before, before the treatment of normal saline or pregabalin; after, 60 min after the treatment of normal saline or pregabalin. * p < 0.05 compared with D0 within the same group. † p < 0.05 compared with the control group at the same time point.
) Control group, () treatment group. Data are presented as means ± standard deviation (n = 6 per group). Statistical significance was determined by two-way repeated analysis of variance (ANOVA) followed by Tukey’s post hoc test for intra-group comparisons and unpaired t-test for inter-group comparisons. Abbreviations: Control, control group; treatment, treatment group; D0, before the surgery; D, day after the surgery; before, before the treatment of normal saline or pregabalin; after, 60 min after the treatment of normal saline or pregabalin. * p < 0.05 compared with D0 within the same group. † p < 0.05 compared with the control group at the same time point. ) Control group, () treatment group. Abbreviations: Control, control group; treatment, treatment group; D0, before the surgery; D, day after the surgery; before, before the treatment of normal saline or pregabalin; after, 60 min after the treatment of normal saline or pregabalin. Data are presented as means ± standard deviation (n = 6 per group). Statistical significance was determined by two-way repeated ANOVA followed by Tukey’s post hoc test for intra-group comparisons and unpaired t-test for inter-group comparisons.* p < 0.05 compared with D0 within the same group. † p < 0.05 compared with the control group at the same time point.
) Control group, () treatment group. Abbreviations: Control, control group; treatment, treatment group; D0, before the surgery; D, day after the surgery; before, before the treatment of normal saline or pregabalin; after, 60 min after the treatment of normal saline or pregabalin. Data are presented as means ± standard deviation (n = 6 per group). Statistical significance was determined by two-way repeated ANOVA followed by Tukey’s post hoc test for intra-group comparisons and unpaired t-test for inter-group comparisons.* p < 0.05 compared with D0 within the same group. † p < 0.05 compared with the control group at the same time point.
) Control group, () treatment group. Abbreviations: Control, control group; treatment, treatment group; D0, before the surgery; D, day after the surgery; before, before the treatment of normal saline or pregabalin; after, 60 min after the treatment of normal saline or pregabalin. Data are presented as means ± standard deviation (n = 6 per group). Statistical significance was determined by two-way repeated ANOVA followed by Tukey’s post hoc test for intra-group comparisons and unpaired t-test for inter-group comparisons.* p < 0.05 compared with D0 within the same group. † p < 0.05 compared with the control group at the same time point.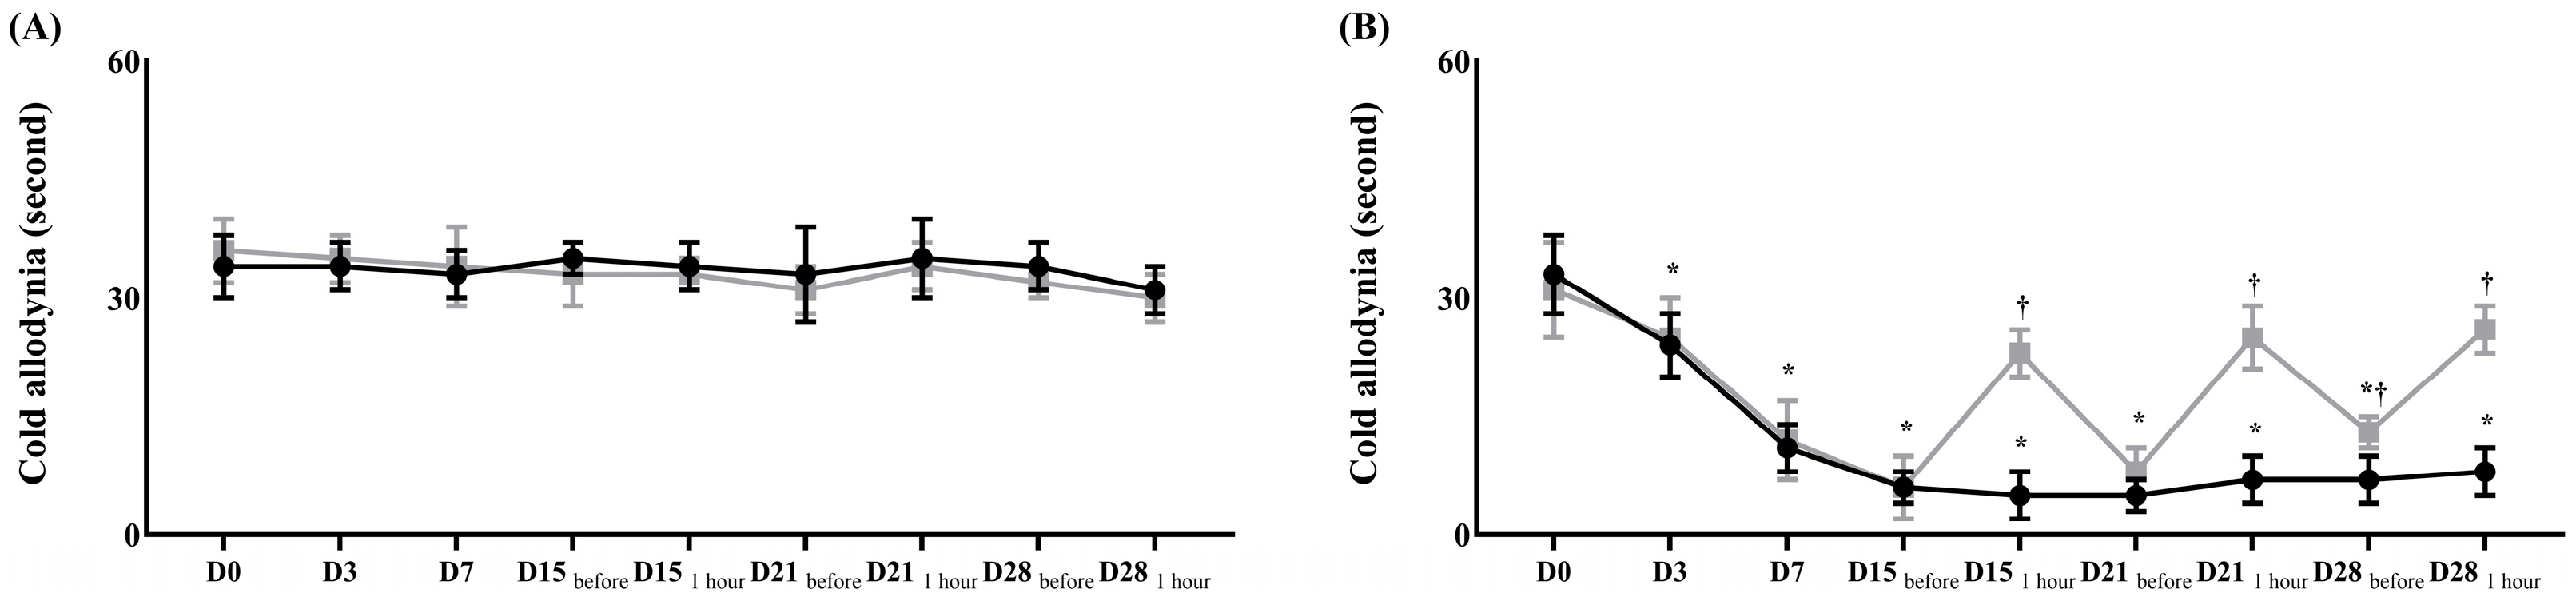
 ) Control group, () treatment group. Data are presented as means ± standard deviation (n = 6 per group). Statistical significance was determined by two-way repeated ANOVA (followed by Tukey’s post hoc test for within-group comparisons over time and for between-group comparisons at specific time points). Abbreviations: D0, before the surgery; D, day after the surgery. * p < 0.05 compared with D0 within the same group. † p < 0.05 compared with D15 within the same group. ‡ p < 0.05 compared with the control group at the same time point.
) Control group, () treatment group. Data are presented as means ± standard deviation (n = 6 per group). Statistical significance was determined by two-way repeated ANOVA (followed by Tukey’s post hoc test for within-group comparisons over time and for between-group comparisons at specific time points). Abbreviations: D0, before the surgery; D, day after the surgery. * p < 0.05 compared with D0 within the same group. † p < 0.05 compared with D15 within the same group. ‡ p < 0.05 compared with the control group at the same time point.
) Control group, () treatment group. Data are presented as means ± standard deviation (n = 6 per group). Statistical significance was determined by two-way repeated ANOVA (followed by Tukey’s post hoc test for within-group comparisons over time and for between-group comparisons at specific time points). Abbreviations: D0, before the surgery; D, day after the surgery. * p < 0.05 compared with D0 within the same group. † p < 0.05 compared with D15 within the same group. ‡ p < 0.05 compared with the control group at the same time point.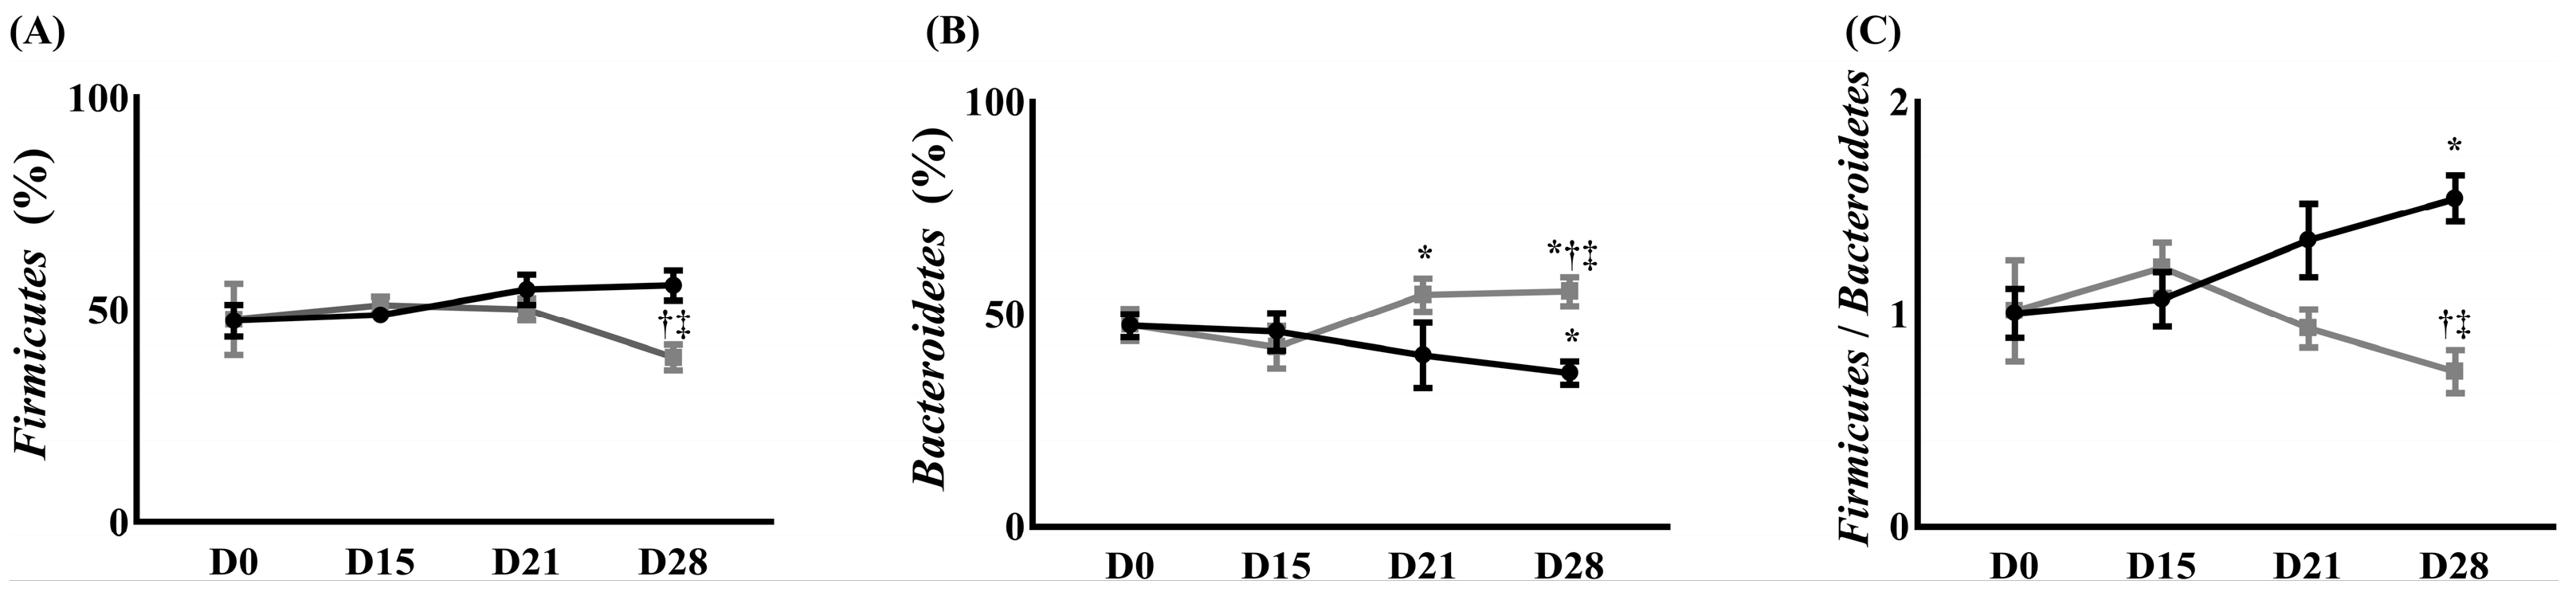

| Control Group | Treatment Group | p-Value | |
|---|---|---|---|
| Pro-inflammatory cytokines | |||
| TNF-α (pg/mL) | 1746.00 ± 139.30 | 1002.00 ± 134.40 | <0.05 |
| IL-1β (pg/mL) | 385.40 ± 17.93 | 118.20 ± 16.33 | <0.05 |
| Anti-inflammatory cytokines | |||
| IL-4 (pg/mL) | 2.80 ± 1.02 | 10.33 ± 0.60 | <0.05 |
| IL-10 (pg/mL) | 168.50 ± 9.60 | 280.10 ± 12.95 | <0.05 |
Disclaimer/Publisher’s Note: The statements, opinions and data contained in all publications are solely those of the individual author(s) and contributor(s) and not of MDPI and/or the editor(s). MDPI and/or the editor(s) disclaim responsibility for any injury to people or property resulting from any ideas, methods, instructions or products referred to in the content. |
© 2025 by the authors. Licensee MDPI, Basel, Switzerland. This article is an open access article distributed under the terms and conditions of the Creative Commons Attribution (CC BY) license (https://creativecommons.org/licenses/by/4.0/).
Share and Cite
Hong, S.-W.; Piao, L.; Cho, E.-H.; Seo, E.-H.; Kim, S.-H. Effect of Microglial Activity on Gut Microbiota in Rats with Neuropathic Pain. Int. J. Mol. Sci. 2025, 26, 5181. https://doi.org/10.3390/ijms26115181
Hong S-W, Piao L, Cho E-H, Seo E-H, Kim S-H. Effect of Microglial Activity on Gut Microbiota in Rats with Neuropathic Pain. International Journal of Molecular Sciences. 2025; 26(11):5181. https://doi.org/10.3390/ijms26115181
Chicago/Turabian StyleHong, Seung-Wan, Liyun Piao, Eun-Hwa Cho, Eun-Hye Seo, and Seong-Hyop Kim. 2025. "Effect of Microglial Activity on Gut Microbiota in Rats with Neuropathic Pain" International Journal of Molecular Sciences 26, no. 11: 5181. https://doi.org/10.3390/ijms26115181
APA StyleHong, S.-W., Piao, L., Cho, E.-H., Seo, E.-H., & Kim, S.-H. (2025). Effect of Microglial Activity on Gut Microbiota in Rats with Neuropathic Pain. International Journal of Molecular Sciences, 26(11), 5181. https://doi.org/10.3390/ijms26115181