
Flexible Parametric Survival Modeling of Transaminases as Predictive Biomarkers for Non-Alcoholic Fatty Liver Disease: A Retrospective Longitudinal Study (2012–2022)

 ,
,  , ,
, ,  , and
, and
Abstract
1. Introduction
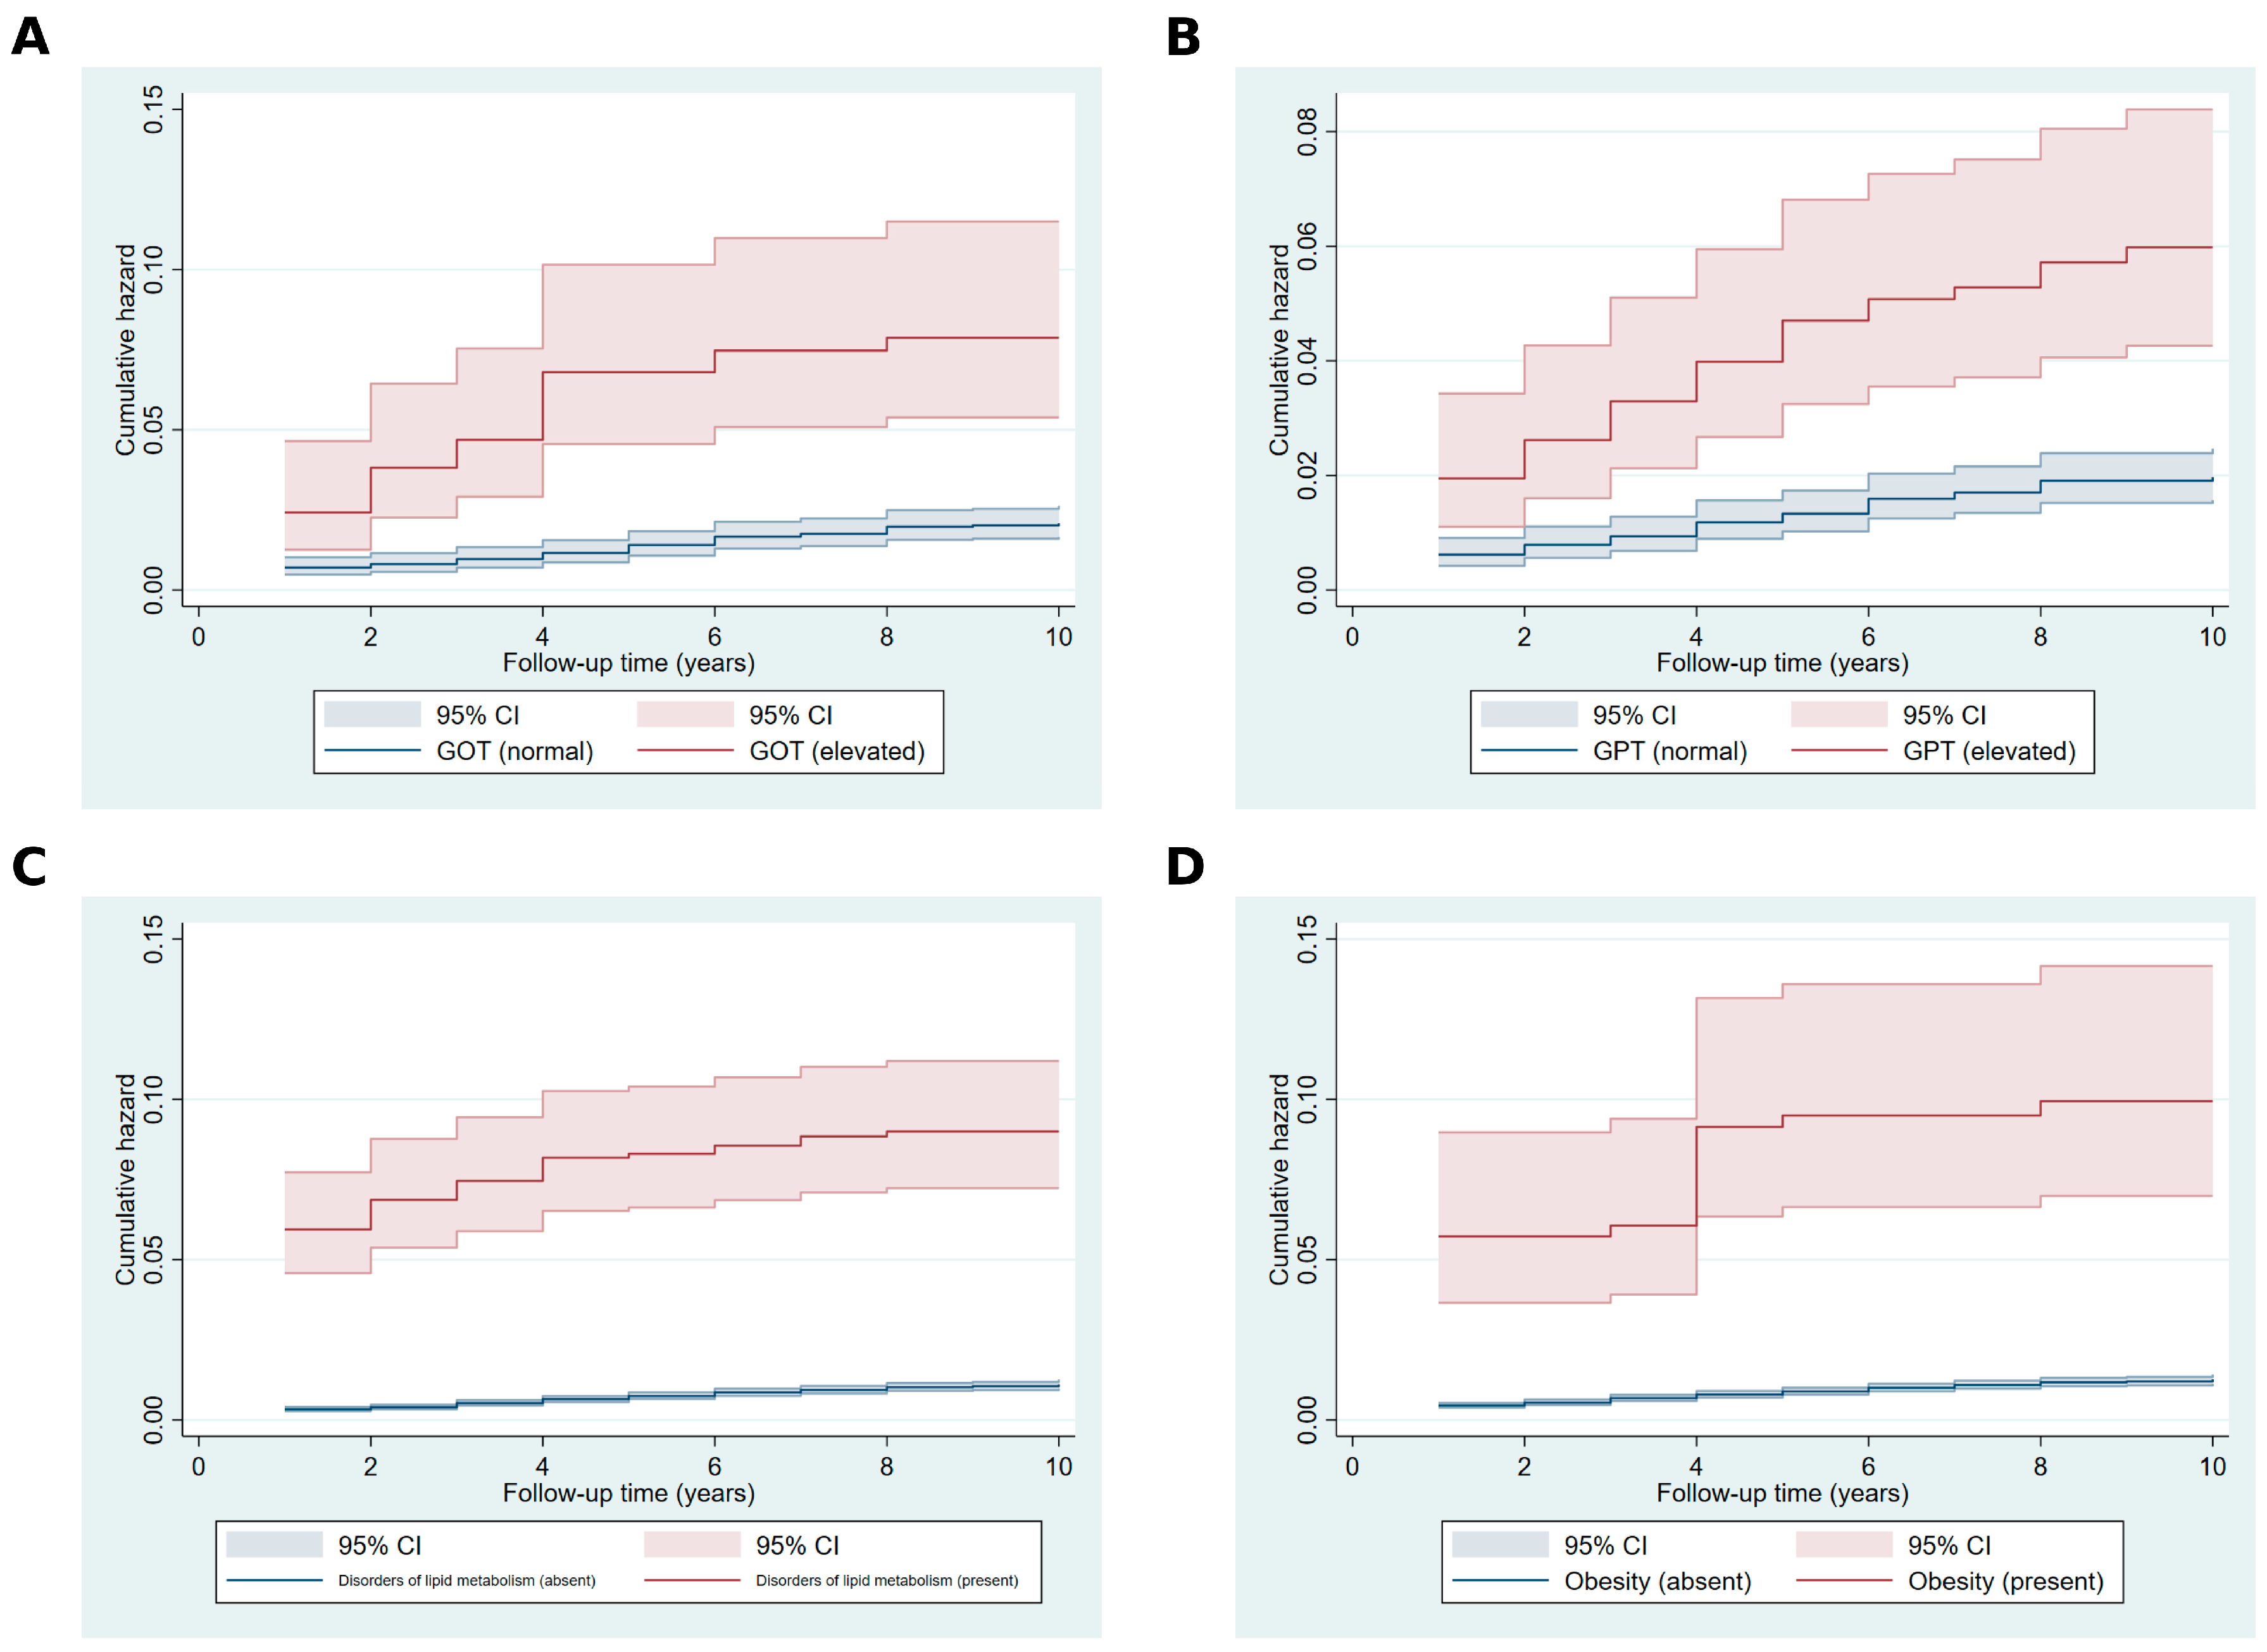
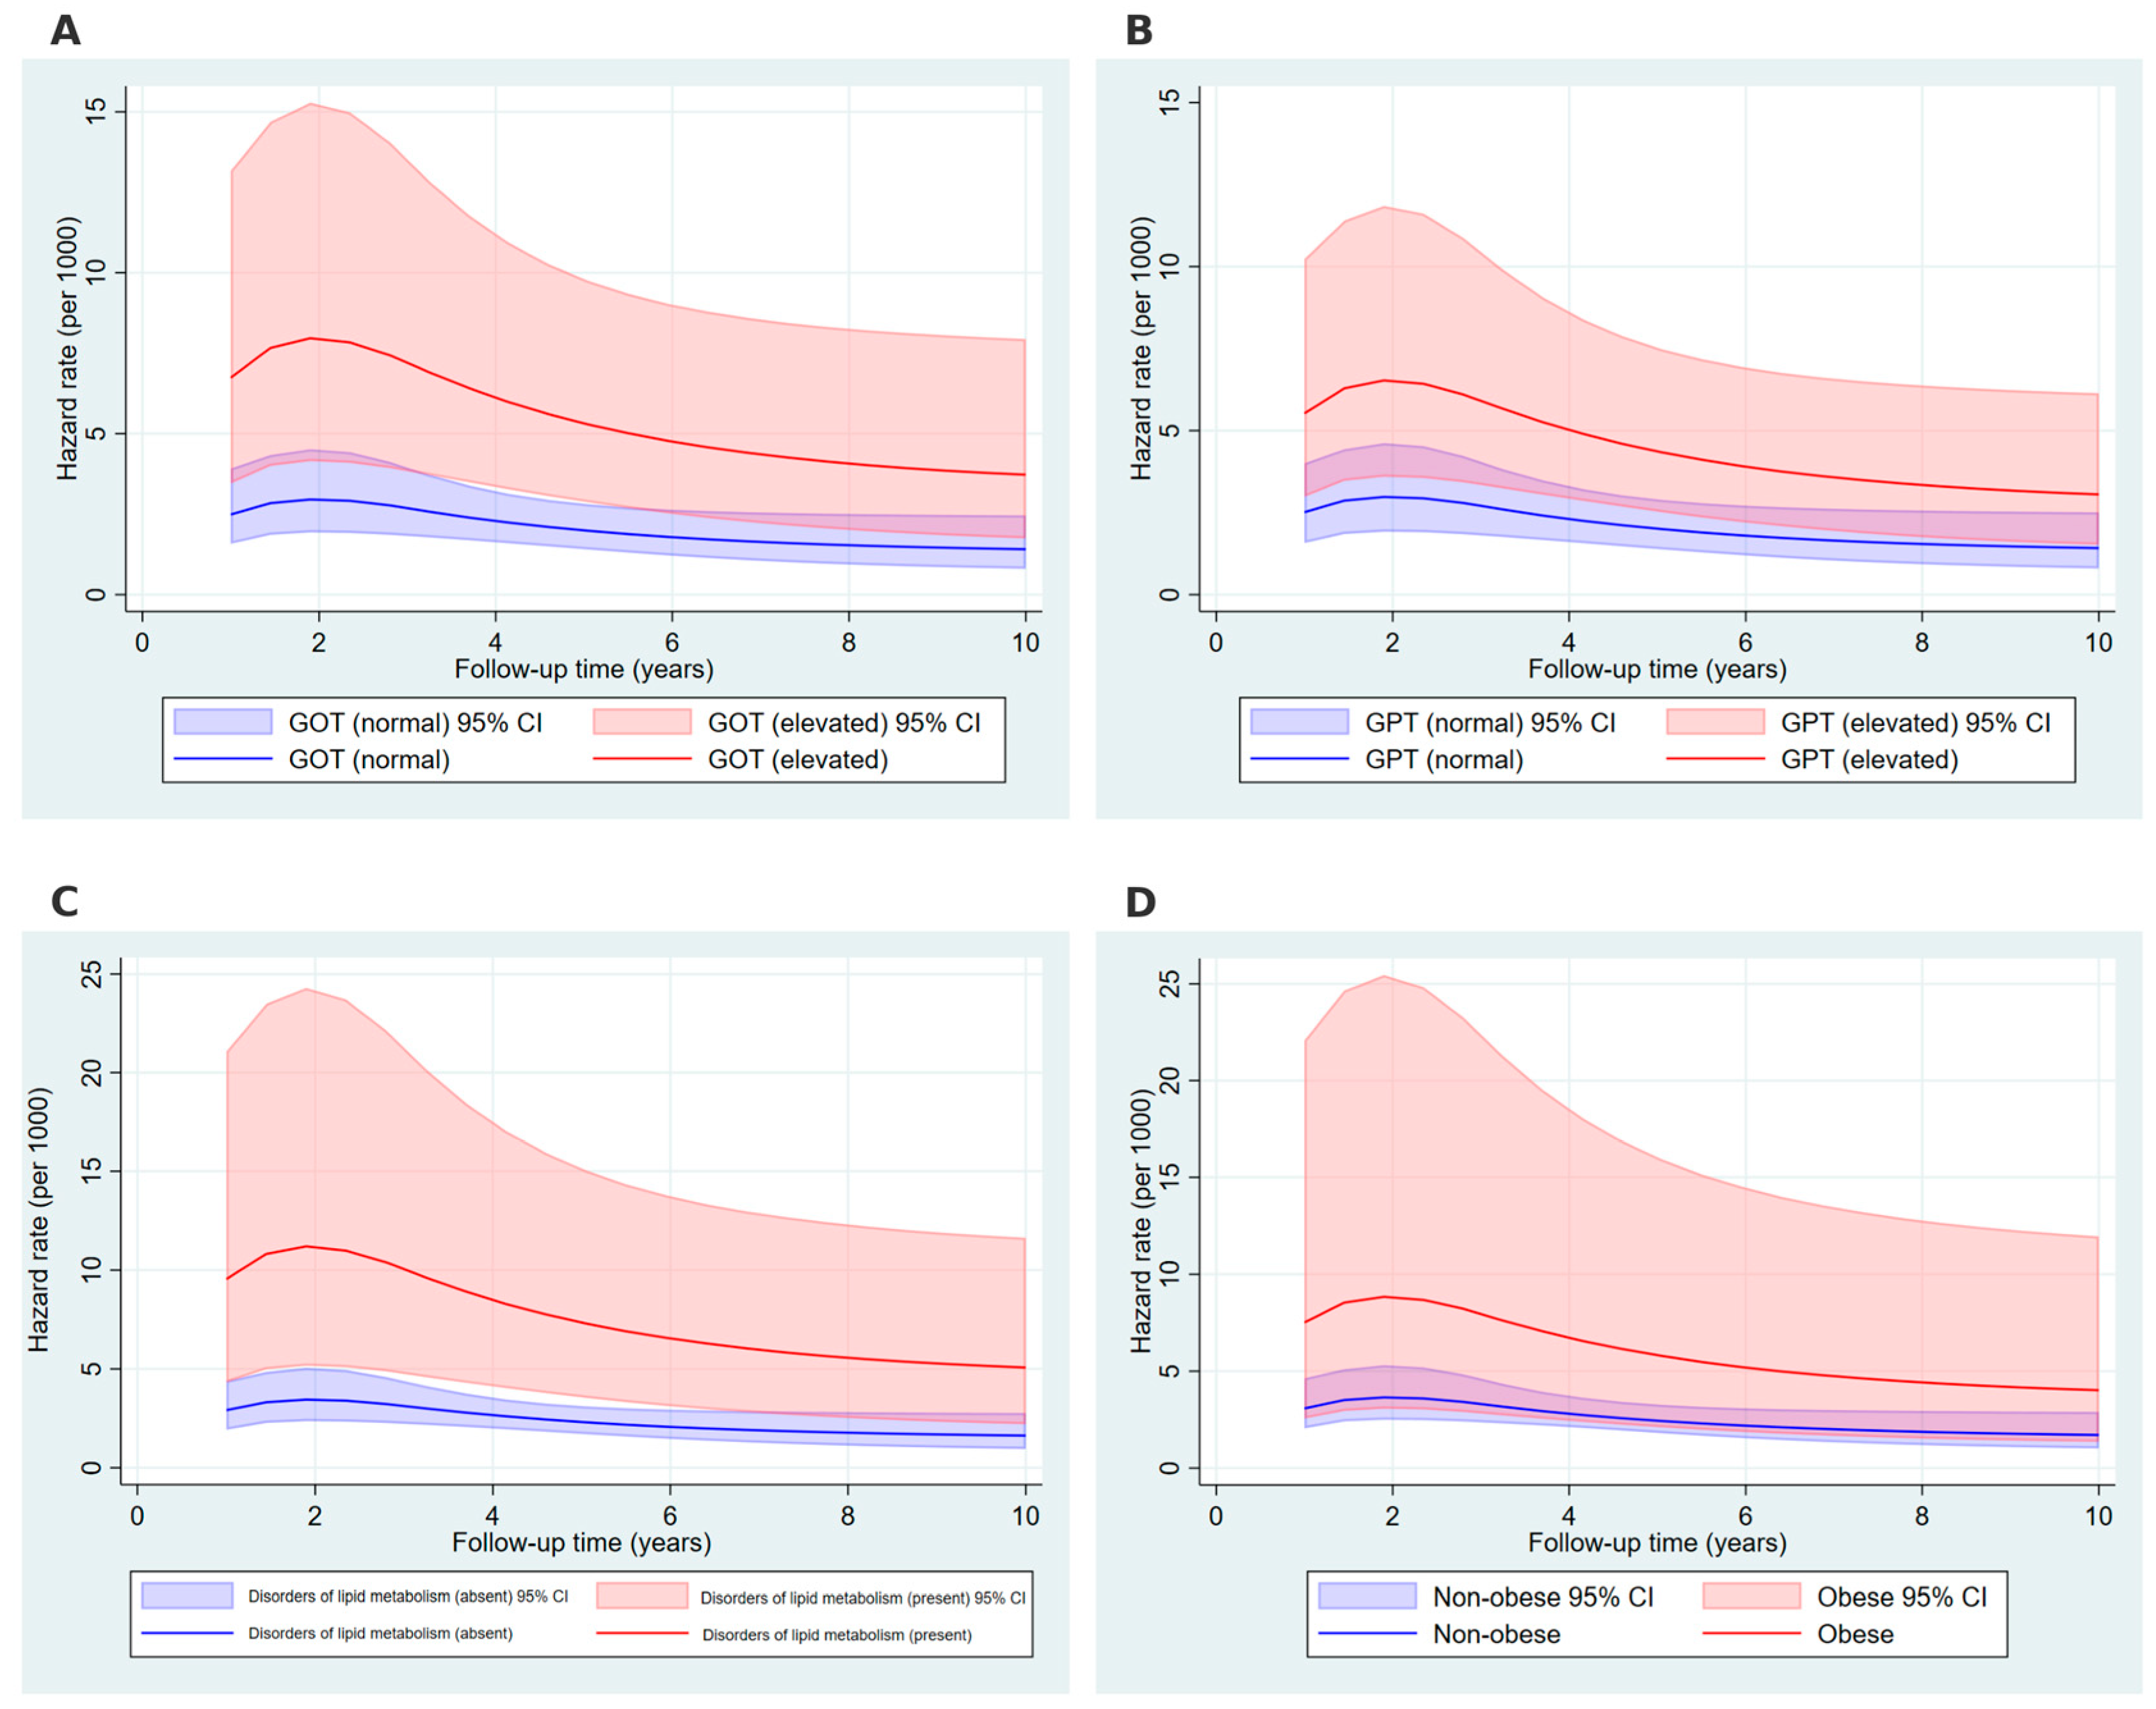
2. Results
3. Discussion
4. Materials and Methods
4.1. Data Cleaning and Processing
4.2. Variables of Interest
4.3. Inclusion and Exclusion Criteria
4.4. Statistical Analysis
4.4.1. Fleming–Harrington Test and Visualizations
4.4.2. Restricted Mean Survival Time Analysis and Standardized Survival Curves
4.4.3. Flexible Parametric Survival Modeling and Time Dependent Hazard Rate Curves
5. Conclusions
Author Contributions
Funding
Institutional Review Board Statement
Informed Consent Statement
Data Availability Statement
Conflicts of Interest
References
- Definition & Facts of NAFLD & NASH—NIDDK. Available online: https://www.niddk.nih.gov/health-information/liver-disease/nafld-nash/definition-facts (accessed on 26 January 2025).
- Park, H.J.; Lee, S.; Lee, J.S. Differences in the Prevalence of NAFLD, MAFLD, and MASLD According to Changes in the Nomenclature in a Health Check-up Using MRI-Derived Proton Density Fat Fraction. Abdom. Radiol. 2024, 49, 3036–3044. [Google Scholar] [CrossRef] [PubMed]
- Eslam, M.; Sarin, S.K.; Wong, V.W.-S.; Fan, J.-G.; Kawaguchi, T.; Ahn, S.H.; Zheng, M.-H.; Shiha, G.; Yilmaz, Y.; Gani, R.; et al. The Asian Pacific Association for the Study of the Liver Clinical Practice Guidelines for the Diagnosis and Management of Metabolic Associated Fatty Liver Disease. Hepatol. Int. 2020, 14, 889–919. [Google Scholar] [CrossRef] [PubMed]
- Eslam, M.; Newsome, P.N.; Sarin, S.K.; Anstee, Q.M.; Targher, G.; Romero-Gomez, M.; Zelber-Sagi, S.; Wong, V.W.-S.; Dufour, J.-F.; Schattenberg, J.M.; et al. A New Definition for Metabolic Dysfunction-Associated Fatty Liver Disease: An International Expert Consensus Statement. J. Hepatol. 2020, 73, 202–209. [Google Scholar] [CrossRef]
- Rinella, M.E.; Lazarus, J.V.; Ratziu, V.; Francque, S.M.; Sanyal, A.J.; Kanwal, F.; Romero, D.; Abdelmalek, M.F.; Anstee, Q.M.; Arab, J.P.; et al. A Multisociety Delphi Consensus Statement on New Fatty Liver Disease Nomenclature. J. Hepatol. 2023, 79, 1542–1556. [Google Scholar] [CrossRef]
- Takahashi, Y.; Dungubat, E.; Kusano, H.; Fukusato, T. Pathology and Pathogenesis of Metabolic Dysfunction-Associated Steatotic Liver Disease-Associated Hepatic Tumors. Biomedicines 2023, 11, 2761. [Google Scholar] [CrossRef]
- Younossi, Z.M.; Koenig, A.B.; Abdelatif, D.; Fazel, Y.; Henry, L.; Wymer, M. Global Epidemiology of Nonalcoholic Fatty Liver Disease—Meta-analytic Assessment of Prevalence, Incidence, and Outcomes. Hepatology 2016, 64, 73. [Google Scholar] [CrossRef]
- Cotter, T.G.; Rinella, M. Nonalcoholic Fatty Liver Disease 2020: The State of the Disease. Gastroenterology 2020, 158, 1851–1864. [Google Scholar] [CrossRef]
- Younossi, Z.M.; Golabi, P.; Paik, J.M.; Henry, A.; Van Dongen, C.; Henry, L. The Global Epidemiology of Nonalcoholic Fatty Liver Disease (NAFLD) and Nonalcoholic Steatohepatitis (NASH): A Systematic Review. Hepatology 2023, 77, 1335. [Google Scholar] [CrossRef]
- Global Burden of Disease (GBD). Available online: https://www.healthdata.org/research-analysis/gbd (accessed on 27 June 2024).
- Mitrovic, B.; Gluvic, Z.; Obradovic, M.M.; Radunovic, M.; Rizzo, M.; Banach, M.; Isenovic, E.R. Non-Alcoholic Fatty Liver Disease, Metabolic Syndrome, and Type 2 Diabetes Mellitus: Where Do We Stand Today? Arch. Med. Sci. 2023, 19, 884–894. [Google Scholar] [CrossRef]
- Suwała, S.; Junik, R. Assessment of the Liver Steatosis and Fibrosis Risk in Metabolic Syndrome and Its Individual Components, Considering the Varying Definitions Used in Clinical Practice throughout Time: A Retrospective Cross-Sectional Study. Biomedicines 2024, 12, 1739. [Google Scholar] [CrossRef]
- Younossi, Z.M.; Henry, L. Understanding the Burden of Nonalcoholic Fatty Liver Disease: Time for Action. Diabetes Spectr. 2024, 37, 9–19. [Google Scholar] [CrossRef] [PubMed]
- Martin, A.; Lang, S.; Goeser, T.; Demir, M.; Steffen, H.-M.; Kasper, P. Management of Dyslipidemia in Patients with Non-Alcoholic Fatty Liver Disease. Curr. Atheroscler. Rep. 2022, 24, 533–546. [Google Scholar] [CrossRef]
- Dharmalingam, M.; Yamasandhi, P.G. Nonalcoholic Fatty Liver Disease and Type 2 Diabetes Mellitus. Indian. J. Endocrinol. Metab. 2018, 22, 421–428. [Google Scholar] [CrossRef]
- Zeng, P.; Cai, X.; Yu, X.; Gong, L. Markers of Insulin Resistance Associated with Non-Alcoholic Fatty Liver Disease in Non-Diabetic Population. Sci. Rep. 2023, 13, 20470. [Google Scholar] [CrossRef]
- Koo, D.-J.; Lee, M.Y.; Jung, I.; Moon, S.J.; Kwon, H.; Park, S.E.; Rhee, E.-J.; Lee, W.-Y. Baseline Homeostasis Model Assessment of Insulin Resistance Associated with Fibrosis Progression in Patients with Nonalcoholic Fatty Liver Disease without Diabetes: A Cohort Study. PLoS ONE 2021, 16, e0255535. [Google Scholar] [CrossRef]
- Salem, A.A.; Abdelmageed, K.H.; Badawy, M.N.; Mohammed Dabiesh, M.A.A. Serum Ferritin and Cellular Reactive Protein (CRP) in Non Alcoholic Fatty Liver Disease (NAFLD) and Non Alcoholic Steatohepatitis (NASH) Patients. QJM Int. J. Med. 2024, 117, hcae070.331. [Google Scholar] [CrossRef]
- Xia, G.; Xu, Y.; Zhang, C.; Li, M.; Li, H.; Chen, C. High Levels of Serum Hypersensitive C-Reactive Protein Are Associated with Non-Alcoholic Fatty Liver Disease in Non-Obese People: A Cross-Sectional Study. Eur. J. Med. Res. 2024, 29, 496. [Google Scholar] [CrossRef]
- Mantovani, A.; Scorletti, E.; Mosca, A.; Alisi, A.; Byrne, C.D.; Targher, G. Complications, Morbidity and Mortality of Nonalcoholic Fatty Liver Disease. Metabolism 2020, 111, 154170. [Google Scholar] [CrossRef]
- Todisco, S.; Santarsiero, A.; Convertini, P.; De Stefano, G.; Gilio, M.; Iacobazzi, V.; Infantino, V. PPAR Alpha as a Metabolic Modulator of the Liver: Role in the Pathogenesis of Nonalcoholic Steatohepatitis (NASH). Biology 2022, 11, 792. [Google Scholar] [CrossRef]
- Montagner, A.; Polizzi, A.; Fouché, E.; Ducheix, S.; Lippi, Y.; Lasserre, F.; Barquissau, V.; Régnier, M.; Lukowicz, C.; Benhamed, F.; et al. Liver PPARα Is Crucial for Whole-Body Fatty Acid Homeostasis and Is Protective against NAFLD. Gut 2016, 65, 1202–1214. [Google Scholar] [CrossRef]
- Ye, J.-H.; Chao, J.; Chang, M.-L.; Peng, W.-H.; Cheng, H.-Y.; Liao, J.-W.; Pao, L.-H. Pentoxifylline Ameliorates Non-Alcoholic Fatty Liver Disease in Hyperglycaemic and Dyslipidaemic Mice by Upregulating Fatty Acid β-Oxidation. Sci. Rep. 2016, 6, 33102. [Google Scholar] [CrossRef] [PubMed]
- Lonardo, A. Alanine Aminotransferase Predicts Incident Steatotic Liver Disease of Metabolic Etiology: Long Life to the Old Biomarker! World J. Gastroenterol. 2024, 30, 3016–3021. [Google Scholar] [CrossRef] [PubMed]
- Sogabe, M.; Okahisa, T.; Kurihara, T.; Takehara, M.; Kagemoto, K.; Okazaki, J.; Kida, Y.; Hirao, A.; Tanaka, H.; Tomonari, T.; et al. Differences among Patients with and without Nonalcoholic Fatty Liver Disease Having Elevated Alanine Aminotransferase Levels at Various Stages of Metabolic Syndrome. PLoS ONE 2020, 15, e0238388. [Google Scholar] [CrossRef]
- Lertsakulbunlue, S.; Mungthin, M.; Rangsin, R.; Kantiwong, A.; Sakboonyarat, B. Relationship between Triglyceride-Glucose Index and Aminotransferase among Royal Thai Army Personnel 2017–2021: A Serial Cross-Sectional Study. Lipids Health Dis. 2023, 22, 47. [Google Scholar] [CrossRef]
- Huang, L.-L.; Guo, D.-H.; Xu, H.-Y.; Tang, S.-T.; Wang, X.X.; Jin, Y.-P.; Wang, P. Association of Liver Enzymes Levels with Fasting Plasma Glucose Levels in Southern China: A Cross-Sectional Study. BMJ Open 2019, 9, e025524. [Google Scholar] [CrossRef]
- Porter, S.A.; Pedley, A.; Massaro, J.M.; Vasan, R.S.; Hoffmann, U.; Fox, C.S. Aminotransferase Levels Are Associated with Cardiometabolic Risk above and beyond Visceral Fat and Insulin Resistance: The Framingham Heart Study. Arterioscler. Thromb. Vasc. Biol. 2013, 33, 139–146. [Google Scholar] [CrossRef]
- Diagnosis of NAFLD & NASH—NIDDK. Available online: https://www.niddk.nih.gov/health-information/liver-disease/nafld-nash/diagnosis (accessed on 26 January 2025).
- Vilar-Gomez, E.; Chalasani, N. Non-Invasive Assessment of Non-Alcoholic Fatty Liver Disease: Clinical Prediction Rules and Blood-Based Biomarkers. J. Hepatol. 2018, 68, 305–315. [Google Scholar] [CrossRef]
- Xuan, Y.; Wu, D.; Zhang, Q.; Yu, Z.; Yu, J.; Zhou, D. Elevated ALT/AST Ratio as a Marker for NAFLD Risk and Severity: Insights from a Cross-Sectional Analysis in the United States. Front. Endocrinol. Lausanne 2024, 15, 1457598. [Google Scholar] [CrossRef]
- Huang, D.Q.; El-Serag, H.B.; Loomba, R. Global Epidemiology of NAFLD-Related HCC: Trends, Predictions, Risk Factors and Prevention. Nat. Rev. Gastroenterol. Hepatol. 2021, 18, 223–238. [Google Scholar] [CrossRef]
- Mitra, S.; De, A.; Chowdhury, A. Epidemiology of Non-Alcoholic and Alcoholic Fatty Liver Diseases. Transl. Gastroenterol. Hepatol. 2020, 5, 16. [Google Scholar] [CrossRef]
- Unalp-Arida, A.; Ruhl, C.E. Noninvasive Fatty Liver Markers Predict Liver Disease Mortality in the U.S. Population. Hepatology 2016, 63, 1170–1183. [Google Scholar] [CrossRef] [PubMed]
- Huang, Y.-H.; Chan, C.; Lee, H.-W.; Huang, C.; Chen, Y.-J.; Liu, P.-C.; Lu, S.-N.; Chuang, W.-L.; Huang, J.-F.; Yu, M.-L.; et al. Influence of Nonalcoholic Fatty Liver Disease with Elevated Liver Enzyme Levels on Risk of Cirrhosis and Hepatocellular Carcinoma. Clin. Gastroenterol. Hepatol. 2023, 21, 960–969.e1. [Google Scholar] [CrossRef]
- Yun, K.E.; Shin, C.Y.; Yoon, Y.S.; Park, H.S. Elevated Alanine Aminotransferase Levels Predict Mortality from Cardiovascular Disease and Diabetes in Koreans. Atherosclerosis 2009, 205, 533–537. [Google Scholar] [CrossRef]
- Godoy-Matos, A.F.; Silva Júnior, W.S.; Valerio, C.M. NAFLD as a Continuum: From Obesity to Metabolic Syndrome and Diabetes. Diabetol. Metab. Syndr. 2020, 12, 60. [Google Scholar] [CrossRef]
- Kawano, Y.; Cohen, D.E. Mechanisms of Hepatic Triglyceride Accumulation in Non-Alcoholic Fatty Liver Disease. J. Gastroenterol. 2013, 48, 434–441. [Google Scholar] [CrossRef]
- Deprince, A.; Haas, J.T.; Staels, B. Dysregulated Lipid Metabolism Links NAFLD to Cardiovascular Disease. Mol. Metab. 2020, 42, 101092. [Google Scholar] [CrossRef]
- Polyzos, S.A.; Kountouras, J.; Mantzoros, C.S. Obesity and Nonalcoholic Fatty Liver Disease: From Pathophysiology to Therapeutics. Metabolism 2019, 92, 82–97. [Google Scholar] [CrossRef]
- Sookoian, S.; Pirola, C.J. Systematic Review with Meta-Analysis: The Significance of Histological Disease Severity in Lean Patients with Nonalcoholic Fatty Liver Disease. Aliment. Pharmacol. Ther. 2018, 47, 16–25. [Google Scholar] [CrossRef]
- Lonardo, A.; Nascimbeni, F.; Ballestri, S.; Fairweather, D.; Win, S.; Than, T.A.; Abdelmalek, M.F.; Suzuki, A. Sex Differences in NAFLD: State of the Art and Identification of Research Gaps. Hepatology 2019, 70, 1457–1469. [Google Scholar] [CrossRef]
- Ng, C.H.; Wong, Z.Y.; Chew, N.W.S.; Chan, K.E.; Xiao, J.; Sayed, N.; Lim, W.H.; Tan, D.J.H.; Loke, R.W.K.; Tay, P.W.L.; et al. Hypertension Is Prevalent in Non-Alcoholic Fatty Liver Disease and Increases All-Cause and Cardiovascular Mortality. Front. Cardiovasc. Med. 2022, 9, 942753. [Google Scholar] [CrossRef]
- Kasper, P.; Martin, A.; Lang, S.; Kütting, F.; Goeser, T.; Demir, M.; Steffen, H.-M. NAFLD and Cardiovascular Diseases: A Clinical Review. Clin. Res. Cardiol. 2021, 110, 921–937. [Google Scholar] [CrossRef] [PubMed]
- Lv, Q.; Han, Q.; Wen, Z.; Pan, Y.; Chen, J. The Association between Atherosclerosis and Nonalcoholic Fatty Liver Disease. Medicine 2024, 103, e36815. [Google Scholar] [CrossRef] [PubMed]
- Stahl, E.P.; Dhindsa, D.S.; Lee, S.K.; Sandesara, P.B.; Chalasani, N.P.; Sperling, L.S. Nonalcoholic Fatty Liver Disease and the Heart. J. Am. Coll. Cardiol. 2019, 73, 948–963. [Google Scholar] [CrossRef]
- Kumar, G.; Vaishya, G.P.; Vijayavarman, V.; Ahmad, S.; Kumar, P.; Kumar, R. Relation between non-alcoholic fatty liver disease and ischemic heart disease studied at rural tertiary care centre in Uttar Pradesh, India. Int. J. Res. Med. Sci. 2020, 8, 1696–1701. [Google Scholar] [CrossRef]
- Zhang, Z.; Wang, P.; Guo, F.; Liu, X.; Luo, T.; Guan, Y.; Chen, H.; Wang, Z.; Zhao, L.; Ma, X.; et al. Chronic Heart Failure in Patients with Nonalcoholic Fatty Liver Disease: Prevalence, Clinical Features, and Relevance. J. Int. Med. Res. 2018, 46, 3959–3969. [Google Scholar] [CrossRef]
- Byrne, C.D.; Targher, G. Non-Alcoholic Fatty Liver Disease-Related Risk of Cardiovascular Disease and Other Cardiac Complications. Diabetes Obes. Metab. 2022, 24, 28–43. [Google Scholar] [CrossRef]
- Kim, H.; Lee, D.S.; An, T.H.; Park, H.-J.; Kim, W.K.; Bae, K.-H.; Oh, K.-J. Metabolic Spectrum of Liver Failure in Type 2 Diabetes and Obesity: From NAFLD to NASH to HCC. Int. J. Mol. Sci. 2021, 22, 4495. [Google Scholar] [CrossRef]
- Daousi, C.; Casson, I.F.; Gill, G.V.; MacFarlane, I.A.; Wilding, J.P.H.; Pinkney, J.H. Prevalence of Obesity in Type 2 Diabetes in Secondary Care: Association with Cardiovascular Risk Factors. Postgrad. Med. J. 2006, 82, 280–284. [Google Scholar] [CrossRef]
- Ziolkowska, S.; Binienda, A.; Jabłkowski, M.; Szemraj, J.; Czarny, P. The Interplay between Insulin Resistance, Inflammation, Oxidative Stress, Base Excision Repair and Metabolic Syndrome in Nonalcoholic Fatty Liver Disease. Int. J. Mol. Sci. 2021, 22, 11128. [Google Scholar] [CrossRef]
- Luyendyk, J.P.; Guo, G.L. Steatosis deLIVERs High Sensitivity C-Reactive Protein. Arterioscler. Thromb. Vasc. Biol. 2011, 31, 1714–1715. [Google Scholar] [CrossRef]
- Tarantino, G.; Citro, V. What Are the Common Downstream Molecular Events between Alcoholic and Nonalcoholic Fatty Liver? Lipids Health Dis. 2024, 23, 41. [Google Scholar] [CrossRef] [PubMed]
- Fleming, T.R.; Harrington, D.P. Weighted Logrank Statistics. In Counting Processes and Survival Analysis; John Wiley & Sons, Ltd.: Hoboken, NJ, USA, 2005; pp. 255–285. ISBN 978-1-118-15067-2. [Google Scholar]
- Kaplan, E.L.; Meier, P. Nonparametric Estimation from Incomplete Observations. J. Am. Stat. Assoc. 1958, 53, 457–481. [Google Scholar] [CrossRef]
- Aalen, O. Nonparametric Inference for a Family of Counting Processes. Ann. Stat. 1978, 6, 701–726. [Google Scholar] [CrossRef]
- Royston, P.; Parmar, M.K.B. The Use of Restricted Mean Survival Time to Estimate the Treatment Effect in Randomized Clinical Trials When the Proportional Hazards Assumption Is in Doubt. Stat. Med. 2011, 30, 2409–2421. [Google Scholar] [CrossRef]
- Royston, P.; Parmar, M.K.B. Flexible Parametric Proportional-Hazards and Proportional-Odds Models for Censored Survival Data, with Application to Prognostic Modelling and Estimation of Treatment Effects. Stat. Med. 2002, 21, 2175–2197. [Google Scholar] [CrossRef]
- StataCorp. Stata Statistical Software: Release 18; StataCorp LLC.: College Station, TX, USA, 2023. [Google Scholar]


| Variable Name | Categories | n (%) |
|---|---|---|
| Age groups | <45 | 1905 (38.99) |
| 45–64 | 2227 (45.58) | |
| 65+ | 754 (15.43) | |
| Total | 4886 | |
| Sex | Male | 2218 (45.42) |
| Female | 2665 (54.58) | |
| Total | 4883 | |
| GOT | Normal | 464 (87.88) |
| Elevated | 64 (12.12) | |
| Total | 528 | |
| GPT | Normal | 489 (86.55) |
| Elevated | 76 (13.45) | |
| Total | 565 | |
| C-reactive protein | Normal (≤15) | 358 (81.74) |
| High (>15) | 80 (18.26) | |
| Total | 438 | |
| Essential hypertension | absent | 4274 (87.47) |
| present | 612 (12.53) | |
| Total | 4886 | |
| Angina pectoris | absent | 4550 (93.12) |
| present | 336 (6.88) | |
| Total | 4886 | |
| Chronic ischemic heart disease | absent | 4715 (96.50) |
| present | 171 (3.50) | |
| Total | 4886 | |
| Heart failure | absent | 4824 (98.73) |
| present | 62 (1.27) | |
| Total | 4886 | |
| Atherosclerosis | absent | 4790 (98.04) |
| present | 96 (1.96) | |
| Total | 4886 | |
| Type 2 diabetes mellitus | absent | 4785 (97.93) |
| present | 101 (2.07) | |
| Total | 4886 | |
| Obesity | absent | 4768 (97.58) |
| present | 118 (2.42) | |
| Total | 4886 | |
| Disorders of lipid metabolism | absent | 4592 (93.98) |
| present | 294 (6.02) | |
| Total | 4886 |
| Variable | Group | Observed Events | Expected Events | Sum of Ranks | p-Value |
|---|---|---|---|---|---|
| Age groups | <45 | 62 | 91.91 | −0.157 | 0.012 |
| 45–64 | 190 | 164.73 | 0.108 | ||
| 65+ | 107 | 102.35 | 0.049 | ||
| Sex | Male | 185 | 147.42 | 0.148 | 0.014 |
| Female | 174 | 211.58 | −0.148 | ||
| GOT | normal | 74 | 92.59 | −0.146 | <0.001 |
| high | 27 | 8.41 | 0.146 | ||
| GPT | normal | 77 | 97.17 | −0.175 | <0.001 |
| high | 34 | 13.83 | 0.175 | ||
| C-reactive protein | normal | 46 | 53.22 | −0.04 | 0.251 |
| high | 22 | 14.78 | 0.04 | ||
| Essential hypertension | absent | 278 | 340.08 | −0.073 | 0.007 |
| present | 81 | 18.92 | 0.073 | ||
| Angina pectoris | absent | 309 | 347.43 | −0.004 | 0.858 |
| present | 50 | 11.57 | 0.004 | ||
| Chronic ischemic heart disease | absent | 324 | 352.01 | −0.046 | 0.005 |
| present | 35 | 6.99 | 0.046 | ||
| Heart failure | absent | 343 | 355 | −0.048 | <0.001 |
| present | 16 | 4 | 0.048 | ||
| Atherosclerosis | absent | 336 | 354.66 | 0.015 | 0.278 |
| present | 23 | 4.34 | −0.015 | ||
| Type 2 diabetes mellitus | absent | 334 | 354.24 | −0.039 | 0.005 |
| present | 25 | 4.76 | 0.039 | ||
| Obesity | absent | 328 | 355.13 | −0.075 | <0.001 |
| present | 31 | 3.87 | 0.075 | ||
| Disorders of lipid metabolism | absent | 278 | 347.9 | −0.124 | <0.001 |
| present | 81 | 11.1 | 0.124 |
| Variable | Group | RMST Estimate | 95% CI (Lower–Upper) | 95% CI (Lower–Upper) | p-Value | Ratio (Group 1/0) | 95% CI (Lower–Upper) | p-Value |
|---|---|---|---|---|---|---|---|---|
| Age groups | <45 | 6.966 | 6.959–6.972 | |||||
| 45–64 | 6.944 | 6.938–6.950 | −0.031–−0.013 | <0.001 | 0.997 | 0.996–0.998 | <0.001 | |
| 65+ | 6.952 | 6.946–6.959 | −0.023–−0.004 | 0.004 | 0.998 | 0.997–0.999 | 0.004 | |
| Sex | Male | 6.939 | 6.933–6.945 | 0.014–0.030 | <0.001 | 1.003 | 1.002–1.004 | <0.001 |
| Female | 6.961 | 6.957–6.966 | ||||||
| GOT | normal | 6.933 | 6.921–6.945 | −0.352–−0.142 | <0.001 | 0.964 | 0.949–0.980 | <0.001 |
| high | 6.686 | 6.582–6.791 | ||||||
| GPT | normal | 6.936 | 6.923–6.948 | −0.211–−0.087 | <0.001 | 0.978 | 0.970–0.987 | <0.001 |
| high | 6.787 | 6.726–6.847 | ||||||
| C-reactive protein | normal | 6.947 | 6.934–6.960 | −0.103–−0.006 | 0.027 | 0.992 | 0.985–0.999 | 0.027 |
| high | 6.893 | 6.846–6.939 | ||||||
| Essential hypertension | absent | 6.964 | 6.960–6.968 | −0.241–−0.199 | <0.001 | 0.968 | 0.965–0.971 | <0.001 |
| present | 6.744 | 6.723–6.765 | ||||||
| Angina pectoris | absent | 6.96 | 6.956–6.964 | −0.259–−0.216 | <0.001 | 0.966 | 0.963–0.969 | <0.001 |
| present | 6.723 | 6.701–6.744 | ||||||
| Chronic ischemic heart disease | absent | 6.957 | 6.953–6.961 | −0.282–−0.208 | <0.001 | 0.965 | 0.959–0.970 | <0.001 |
| present | 6.712 | 6.675–6.749 | ||||||
| Heart failure (tau = 5) | absent | 4.974 | 4.972–4.976 | −0.107–−0.050 | <0.001 | 0.984 | 0.978–0.990 | <0.001 |
| present | 4.895 | 4.866–4.924 | ||||||
| Atherosclerosis (tau = 3) | absent | 2.99 | 2.990–2.991 | −0.111–−0.110 | <0.001 | 0.963 | 0.963–0.963 | <0.001 |
| present | 2.88 | 2.880–2.880 | ||||||
| Type 2 diabetes mellitus | absent | 6.956 | 6.952–6.959 | −0.322–−0.204 | <0.001 | 0.962 | 0.954–0.971 | <0.001 |
| present | 6.693 | 6.634–6.752 | ||||||
| Obesity | absent | 6.957 | 6.953–6.960 | −0.489–−0.323 | <0.001 | 0.942 | 0.930–0.954 | <0.001 |
| present | 6.551 | 6.467–6.634 | ||||||
| Disorders of lipid metabolism | absent | 6.965 | 6.962–6.969 | −0.461–−0.363 | <0.001 | 0.941 | 0.934–0.948 | <0.001 |
| present | 6.553 | 6.504–6.602 | ||||||
| Variable Name | Categories | HR [95% CI] | p-Value |
|---|---|---|---|
| Age groups | <45 (ref) | ||
| 45–64 | 0.98 [0.68–1.40] | 0.914 | |
| 65+ | 1.05 [0.64–1.74] | 0.838 | |
| Sex | Male (ref) | ||
| Female | 1.05 [0.64–1.74] | 0.838 | |
| GOT | Normal (ref) | ||
| Elevated | 2.71 [1.31–5.58] | 0.007 | |
| GPT | Normal (ref) | ||
| Elevated | 2.21 [1.09–4.43] | 0.027 | |
| C-reactive protein | Normal (≤15, ref) | ||
| High (>15) | 1.20 [0.70–2.08] | 0.511 | |
| Essential hypertension | Absent (ref) | ||
| Present | 1.70 [0.79–3.63] | 0.173 | |
| Angina pectoris | Absent (ref) | ||
| Present | 1.09 [0.32–3.72] | 0.892 | |
| Chronic ischemic heart disease | Absent (ref) | ||
| Present | 1.04 [0.32–3.41] | 0.943 | |
| Heart failure | Absent (ref) | ||
| Present | 0.77 [0.23–2.63] | 0.68 | |
| Atherosclerosis | Absent (ref) | ||
| Present | 1.78 [0.41–7.69] | 0.441 | |
| Type 2 diabetes mellitus | Absent (ref) | ||
| Present | 1.55 [0.52–4.66] | 0.434 | |
| Obesity | Absent (ref) | ||
| Present | 2.46 [0.83–7.24] | 0.106 | |
| Disorders of lipid metabolism | Absent (ref) | ||
| Present | 3.29 [1.51–7.25] | 0.003 | |
| Nonlinear Effect 1 (_rcs1) | - | 1.43 [1.32–1.57] | <0.001 |
| Nonlinear Effect 2 (_rcs2) | - | 1.06 [1.00–1.12] | 0.039 |
Disclaimer/Publisher’s Note: The statements, opinions and data contained in all publications are solely those of the individual author(s) and contributor(s) and not of MDPI and/or the editor(s). MDPI and/or the editor(s) disclaim responsibility for any injury to people or property resulting from any ideas, methods, instructions or products referred to in the content. |
© 2025 by the authors. Licensee MDPI, Basel, Switzerland. This article is an open access article distributed under the terms and conditions of the Creative Commons Attribution (CC BY) license (https://creativecommons.org/licenses/by/4.0/).
Share and Cite
Ghanem, A.S.; Tóth, Á.; Takács, P.; Ulambayar, B.; Móré, M.; Nagy, A.C. Flexible Parametric Survival Modeling of Transaminases as Predictive Biomarkers for Non-Alcoholic Fatty Liver Disease: A Retrospective Longitudinal Study (2012–2022). Int. J. Mol. Sci. 2025, 26, 5057. https://doi.org/10.3390/ijms26115057
Ghanem AS, Tóth Á, Takács P, Ulambayar B, Móré M, Nagy AC. Flexible Parametric Survival Modeling of Transaminases as Predictive Biomarkers for Non-Alcoholic Fatty Liver Disease: A Retrospective Longitudinal Study (2012–2022). International Journal of Molecular Sciences. 2025; 26(11):5057. https://doi.org/10.3390/ijms26115057
Chicago/Turabian StyleGhanem, Amr Sayed, Ágnes Tóth, Péter Takács, Battamir Ulambayar, Marianna Móré, and Attila Csaba Nagy. 2025. "Flexible Parametric Survival Modeling of Transaminases as Predictive Biomarkers for Non-Alcoholic Fatty Liver Disease: A Retrospective Longitudinal Study (2012–2022)" International Journal of Molecular Sciences 26, no. 11: 5057. https://doi.org/10.3390/ijms26115057
APA StyleGhanem, A. S., Tóth, Á., Takács, P., Ulambayar, B., Móré, M., & Nagy, A. C. (2025). Flexible Parametric Survival Modeling of Transaminases as Predictive Biomarkers for Non-Alcoholic Fatty Liver Disease: A Retrospective Longitudinal Study (2012–2022). International Journal of Molecular Sciences, 26(11), 5057. https://doi.org/10.3390/ijms26115057