

DNA Methylation Changes Reflect Aluminum Stress in Triticale and Epigenetic Control of the Trait

Abstract
1. Introduction
2. Results
2.1. Plant’s Response to Aluminum Stress
2.2. MSAP Analysis
2.3. ANOVA Analysis
2.4. Elastic Net Regression Analyses
2.5. Distribution of Markers Assigned to DN-CG, DN-CHG, and DM-CG Regarding Tolerance
3. Discussion
3.1. Uniformity of Plant Materials
3.2. Characteristic of DArTseqMet Approach for DNA Methylation Study
3.3. Epigenetic Alterations in Triticale Under Al Stress
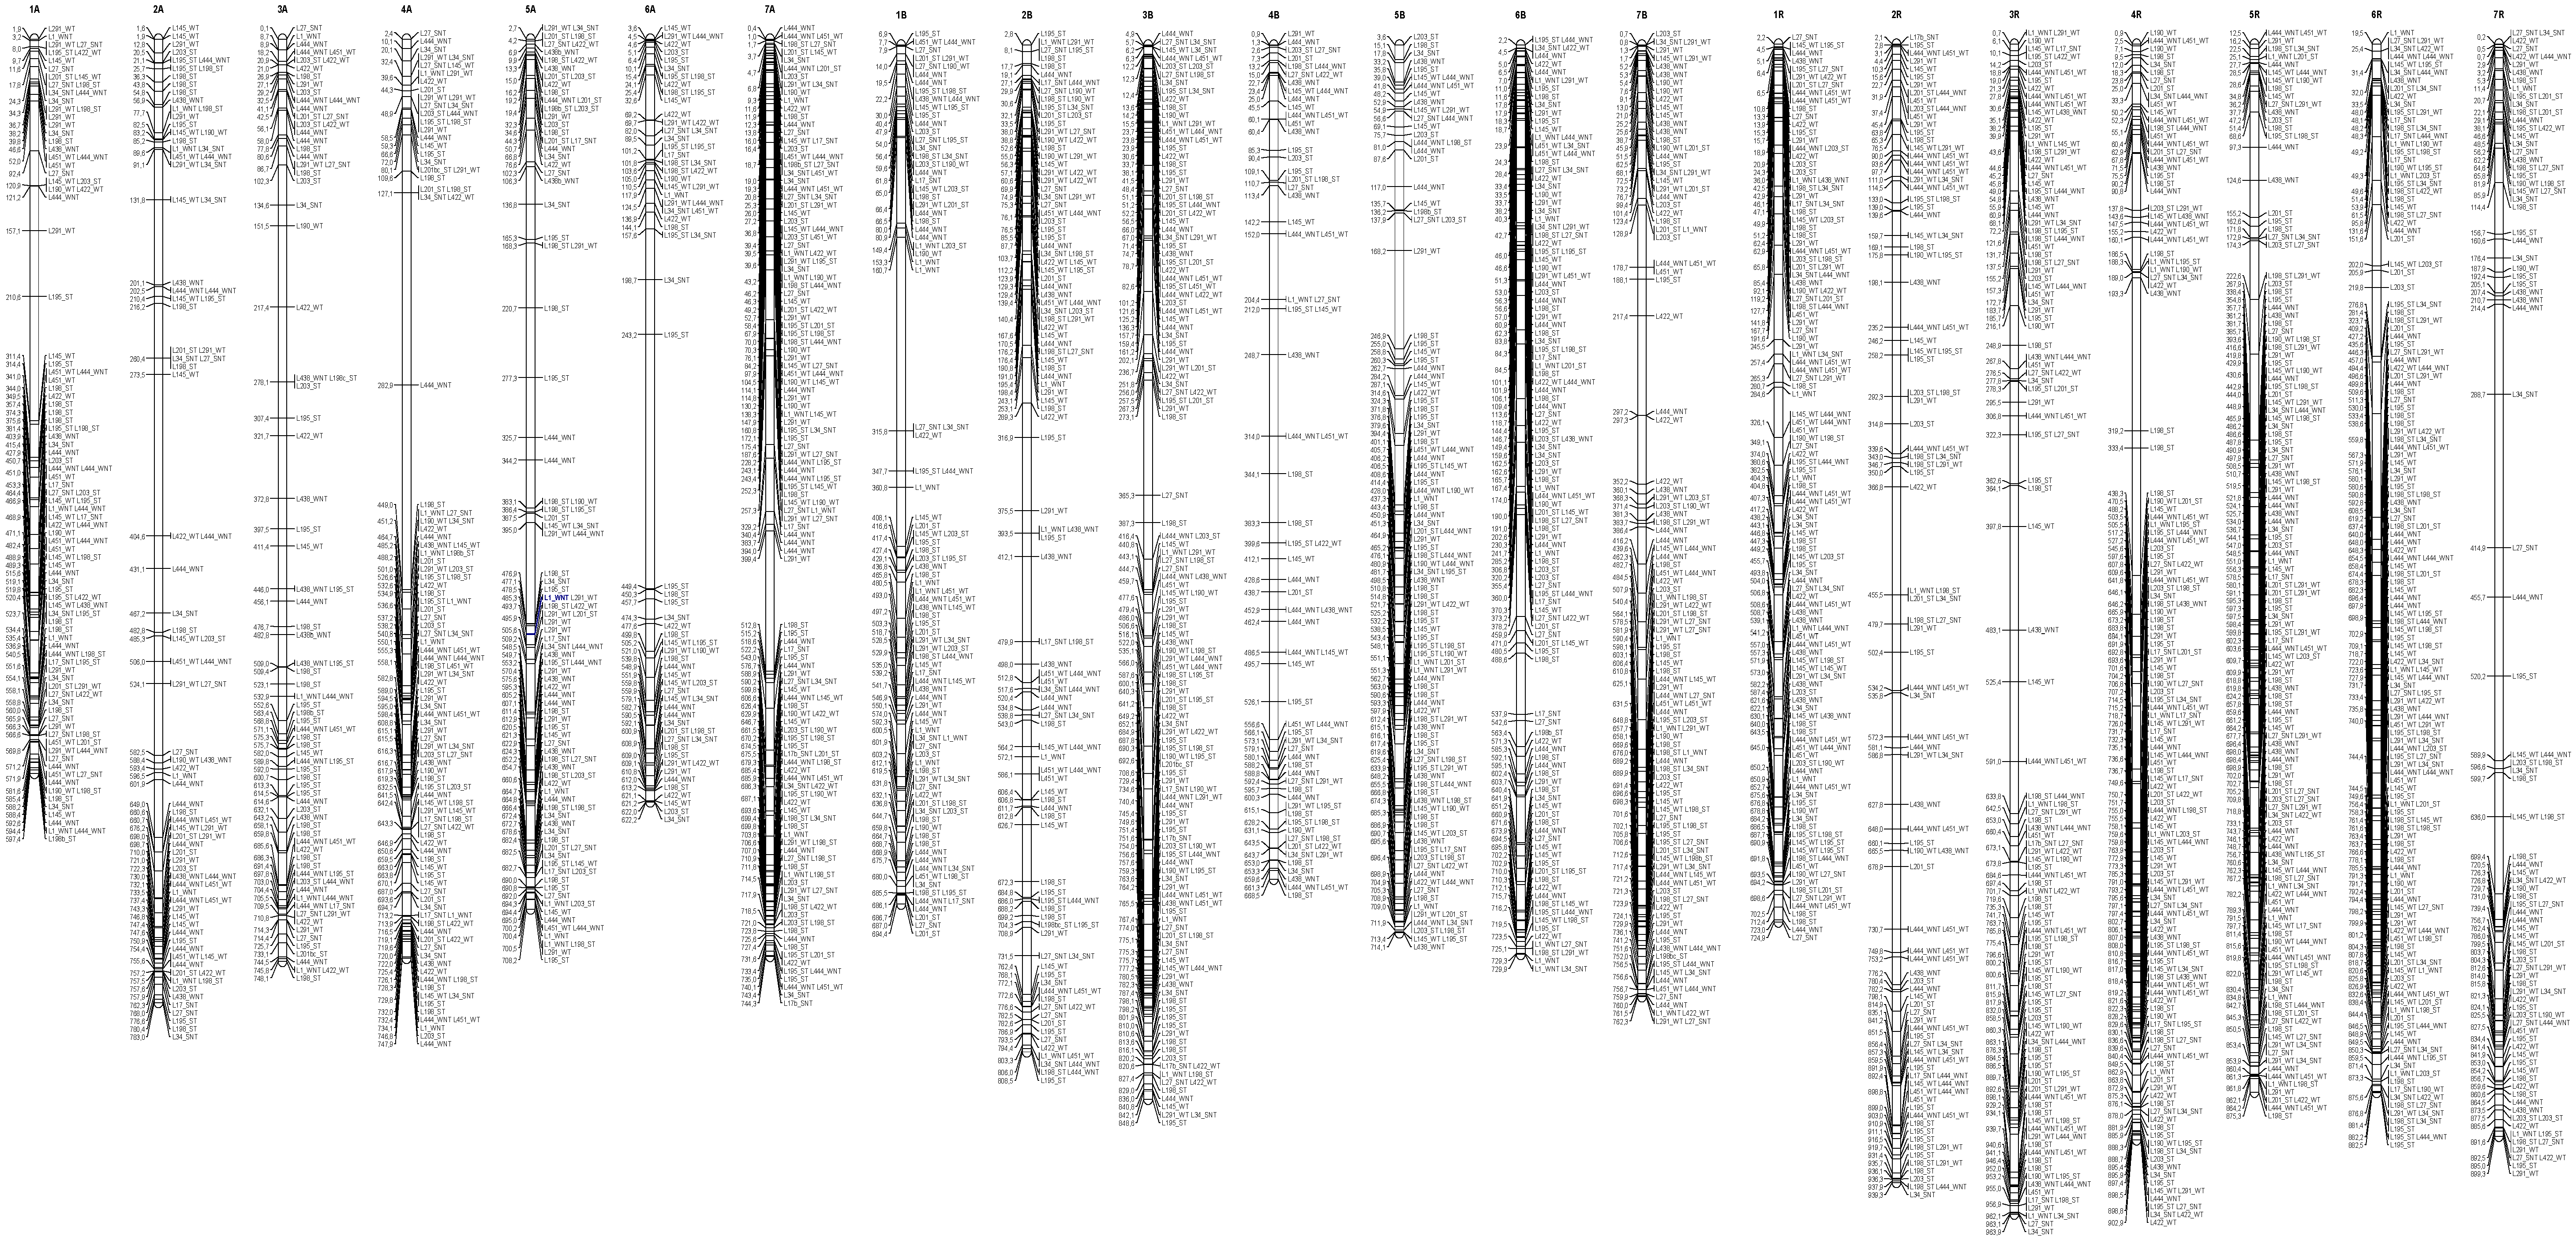
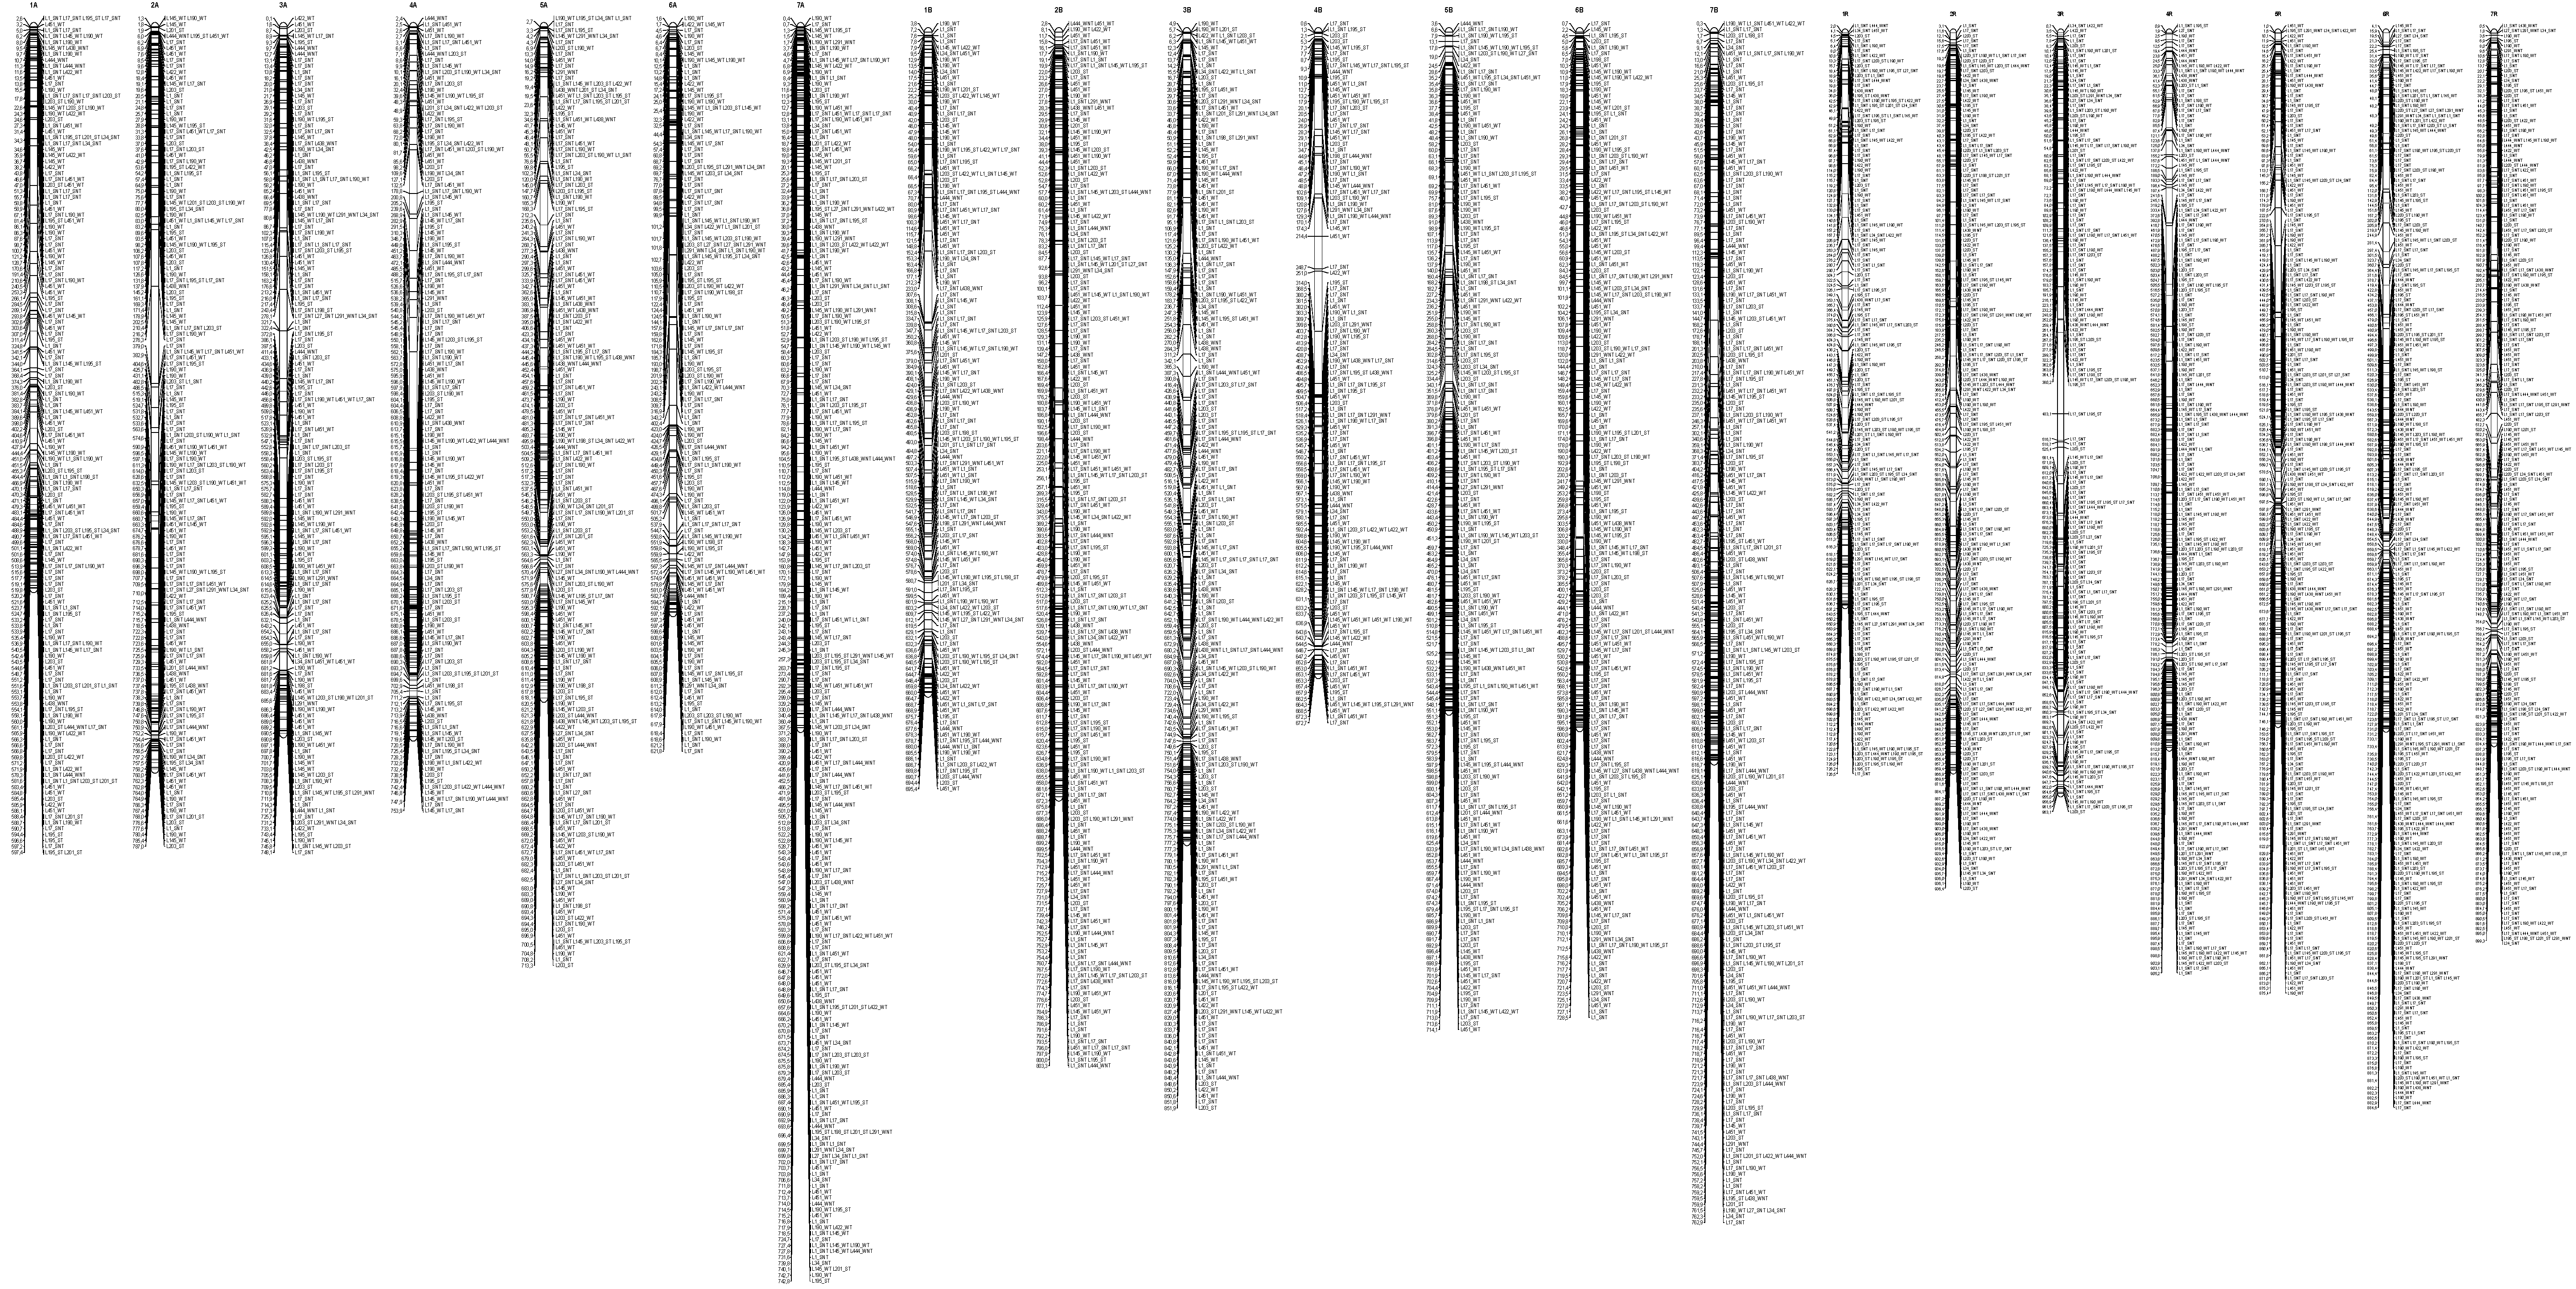
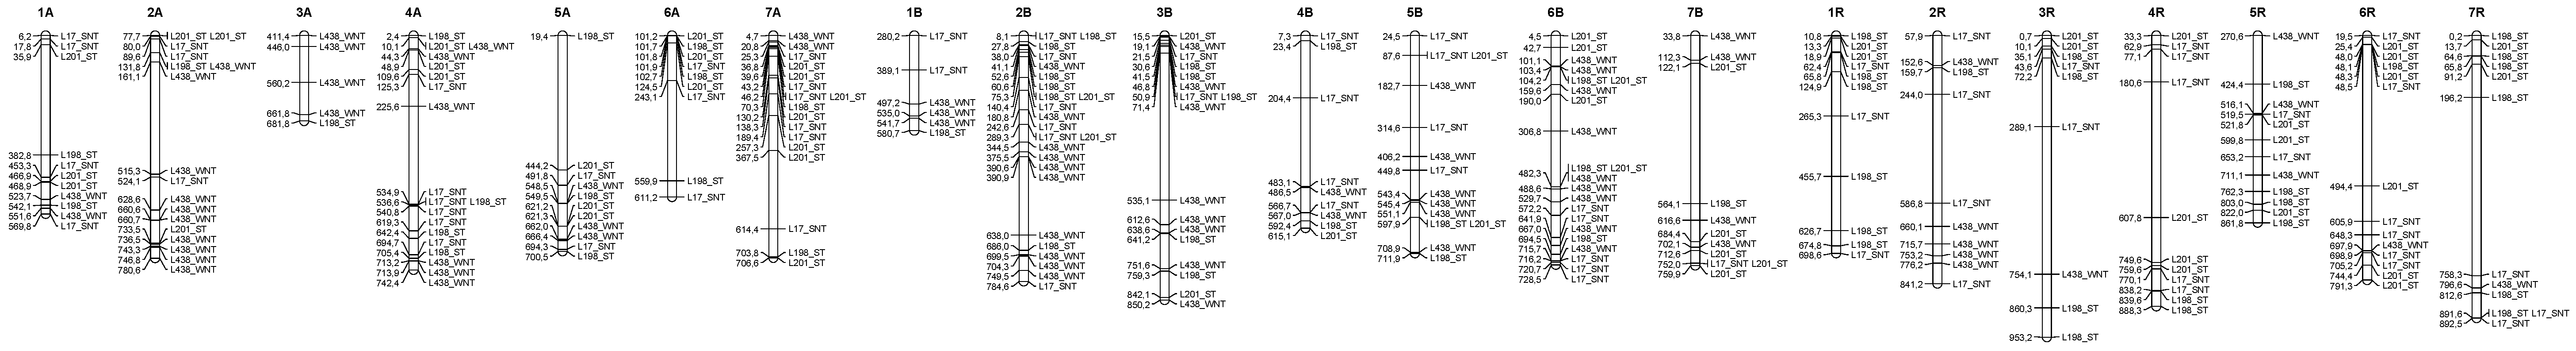
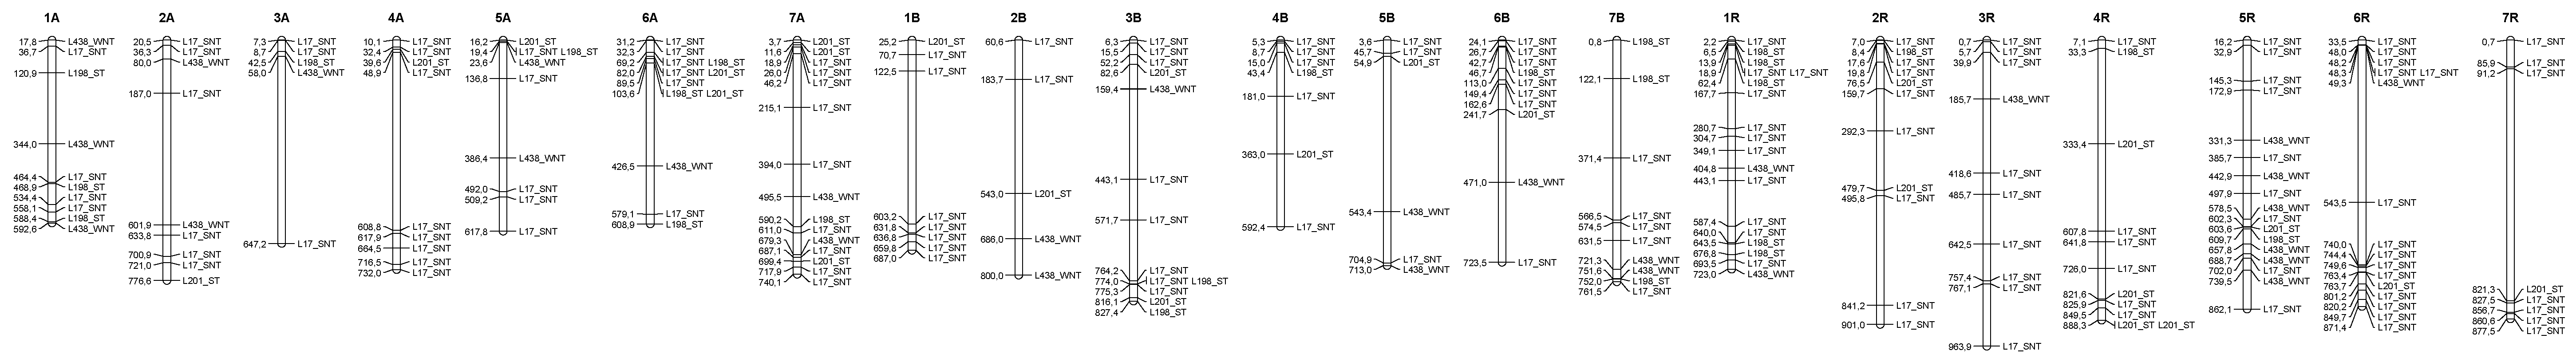
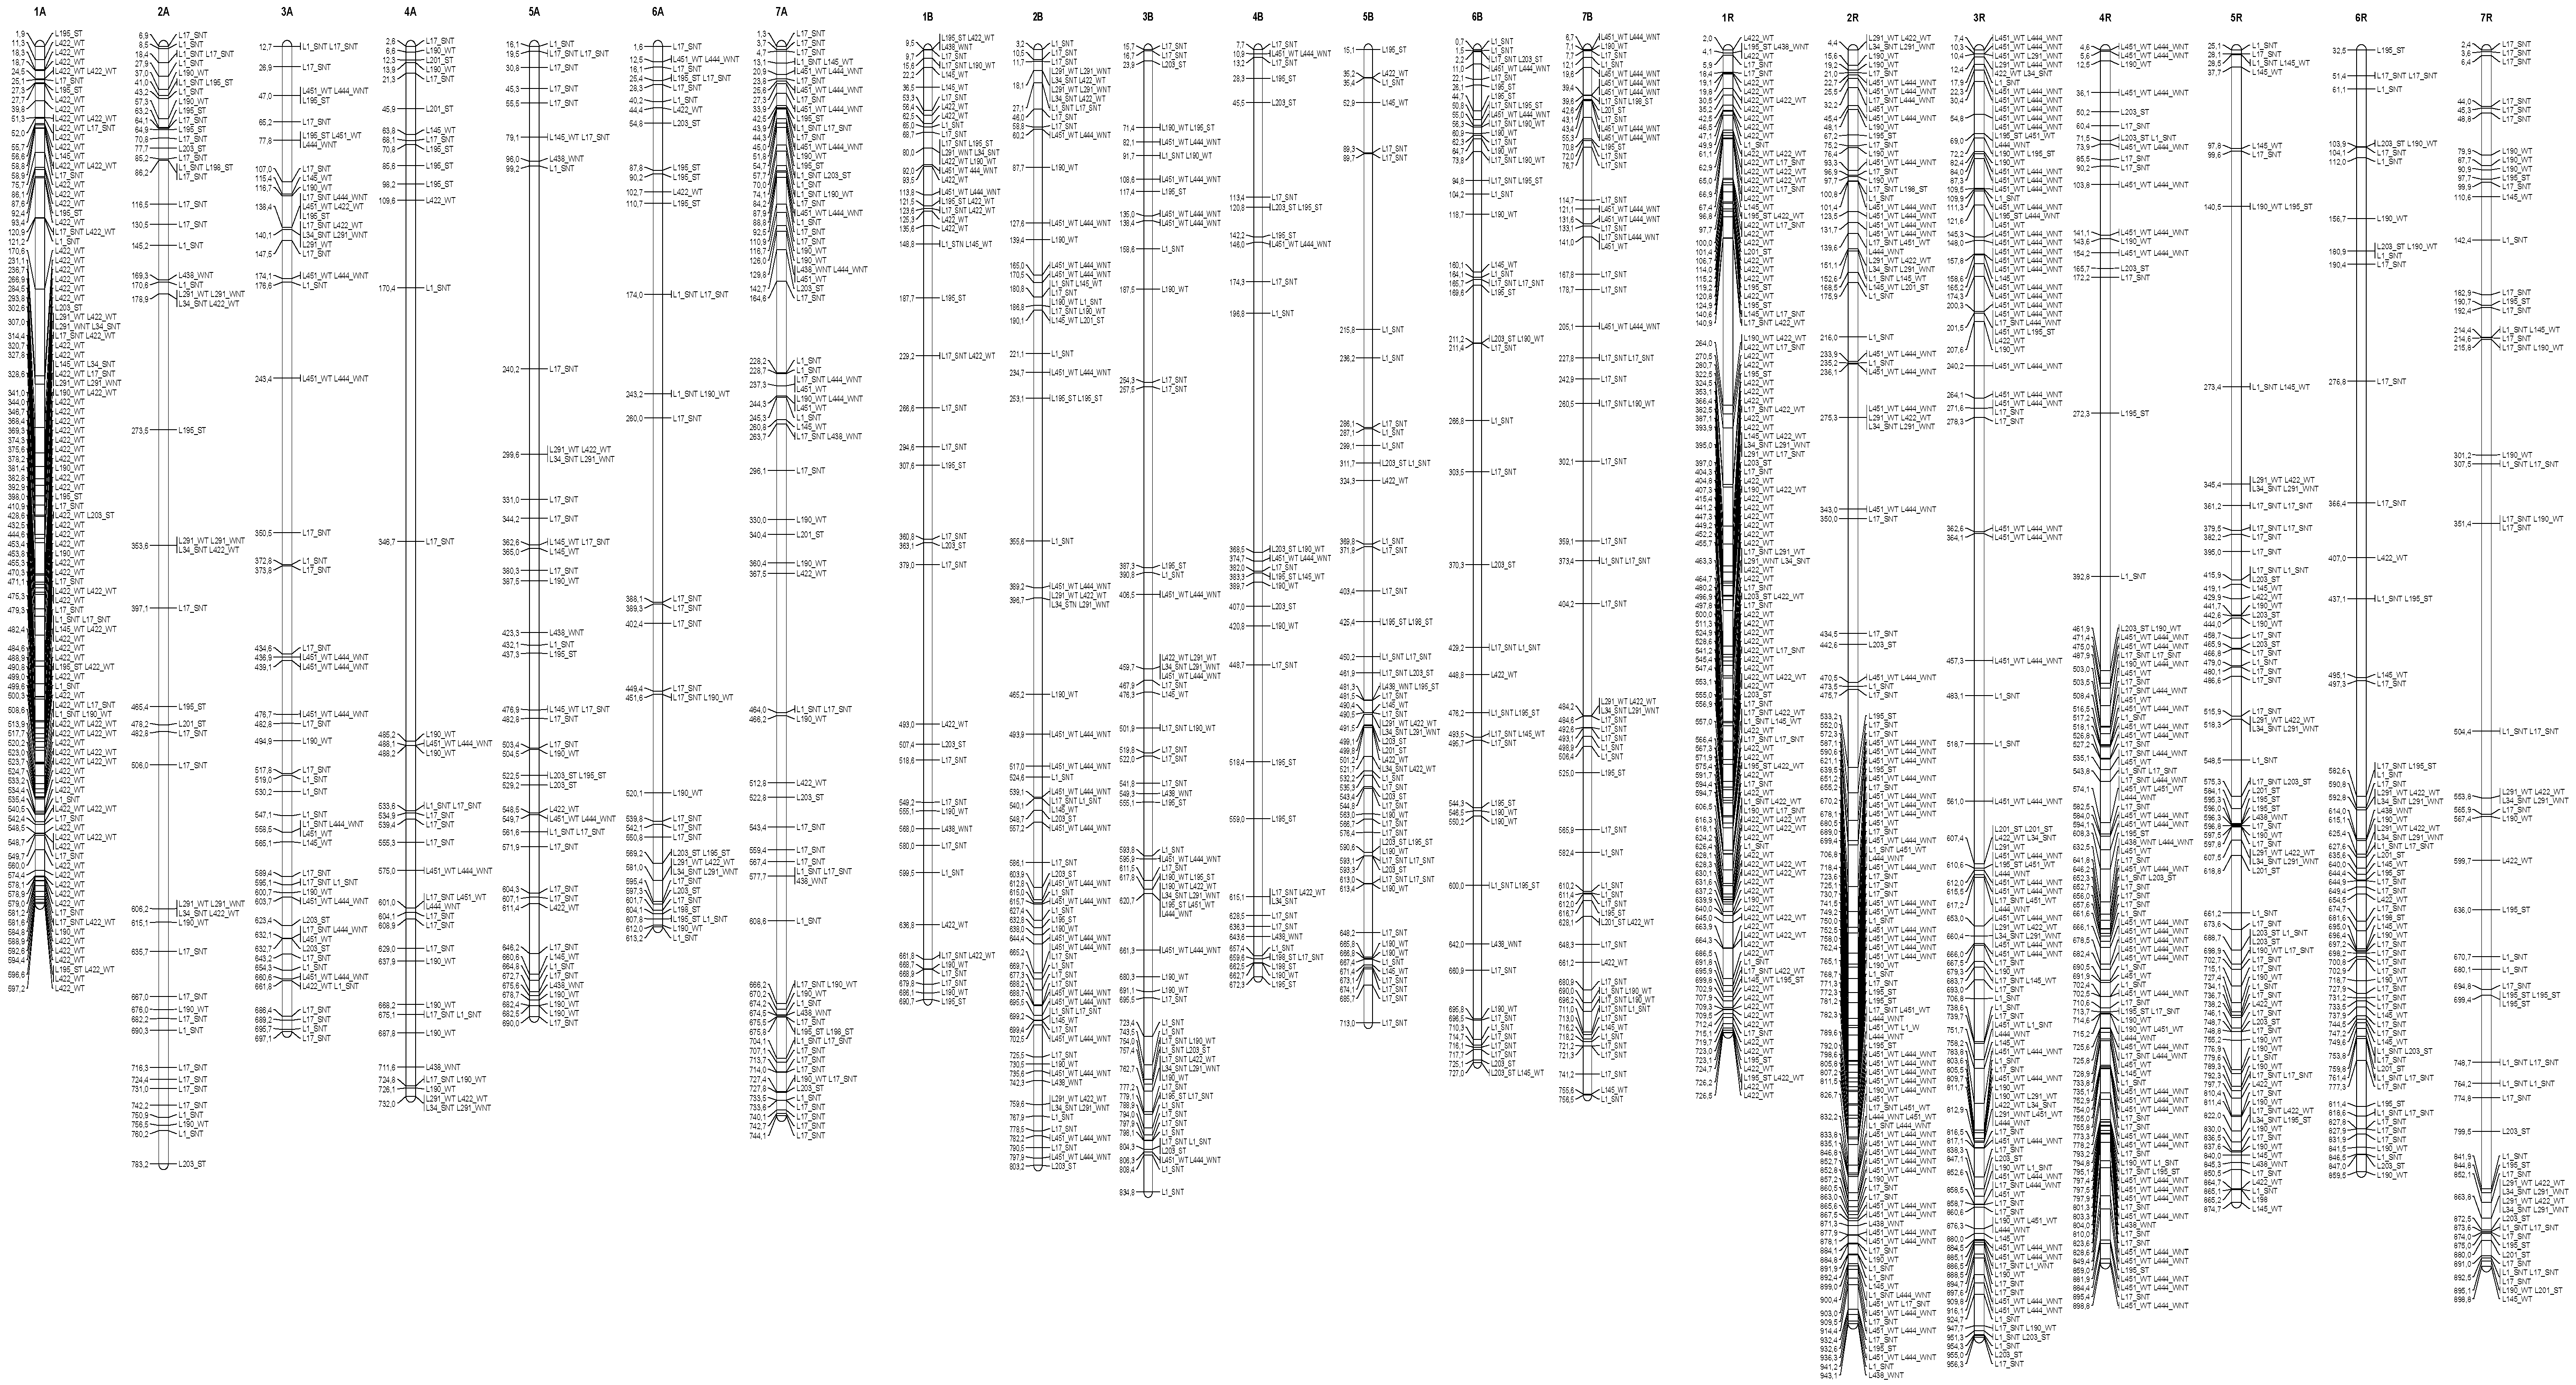
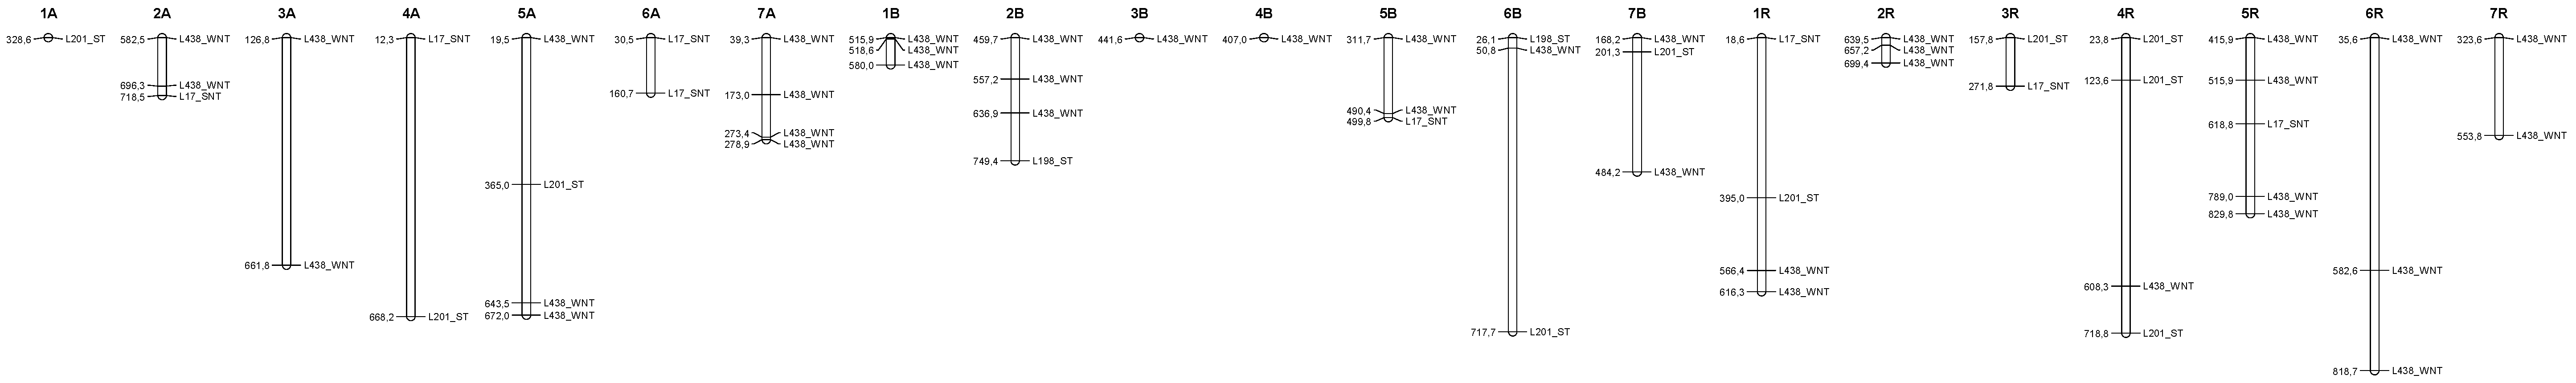
3.4. Distribution of the Epigenetic Markers Linked to Al Tolerance on the Triticale Map
3.5. Tissue-Specific Methylation Level in Triticale Under Al Stress
3.6. Elastic Net Regression Analyses
4. Materials and Methods
4.1. Plant Materials
4.2. Physiological Test
4.3. DNA Isolation
4.4. Methylation Sensitive DArT Sequencing—DArTseqMet
4.5. DArTseqMet Markers Interpretation and Quantification Models
- The Common model is based on the prevailing methylation/non-methylation state/status background explanations for the given transition types, which are used for methylation quantification purposes.
- The General model:
- The Basic variant assumes that all possible explanations regarding the methylation background that stands behind the MSAP profiles are used for calculations following the approach presented earlier [52];
- The Extended variant is based on the same assumptions as the Basic one, but a detailed analysis of restriction site methylation status is conducted to address them in sequence context.
4.6. Statistics
4.7. Map Construction
5. Conclusions
Supplementary Materials
Author Contributions
Funding
Institutional Review Board Statement
Informed Consent Statement
Data Availability Statement
Acknowledgments
Conflicts of Interest
References
- Bartholomé, J.; Ospina, J.O.; Sandoval, M.; Espinosa, N.; Arcos, J.; Ospina, Y.; Frouin, J.; Beartschi, C.; Ghneim, T.; Grenier, C. Genomic selection for tolerance to aluminum toxicity in a synthetic population of upland rice. PLoS ONE 2024, 19, e0307009. [Google Scholar] [CrossRef] [PubMed]
- Kochian, L.V. Cellular mechanisms of aluminium toxicity and resistance in plants. Annu. Rev. Plant. Physiol. Plant Mol. Biol. 1995, 46, 237–260. [Google Scholar] [CrossRef]
- Ma, J.F.; Ryan, P.R.; Delhaize, E. Aluminium tolerance in plants and the complexing role of organic acids. Trends Plant Sci. 2001, 6, 273–278. [Google Scholar] [CrossRef]
- Zhu, F. Triticale: Nutritional composition and food uses. Food Chem. 2018, 241, 468–479. [Google Scholar] [CrossRef]
- Aguirre, A.; Borneo, R.; León, A.E. Properties of triticale protein films and their relation to plasticizing-antiplasticizing effects of glycerol and sorbitol. Ind. Crops Prod. 2013, 50, 297–303. [Google Scholar] [CrossRef]
- Salvucci, E.; Rossi, M.; Colombo, A.; Pérez, G.; Borneo, R.; Aguirre, A. Triticale flour films added with bacteriocin-like substance (BLIS) for active food packaging applications. Food Packag. Shelf Life 2019, 19, 193–199. [Google Scholar] [CrossRef]
- Liard, G.; Lesage, P.; Samson, R.; Stuart, P. Systematic assessment of triticale-based biorefinery strategies: Environmental evaluation using life cycle assessment. Biofuels Bioprod. Biorefin. 2018, 12, S60–S72. [Google Scholar] [CrossRef]
- Sanaei, S.; Chambost, V.; Stuart, P. Systematic assessment of triticale-based biorefinery strategies: Sustainability assessment using multi-criteria decision-making (MCDM). Biofuels Bioprod. Biorefin. 2018, 12, S73–S86. [Google Scholar] [CrossRef]
- Delhaize, E.; Ma, J.F.; Ryan, P.R. Transcriptional regulation of aluminium tolerance genes. Trends Plant Sci. 2012, 17, 341–348. [Google Scholar] [CrossRef]
- Szewińska, J.; Różańska, E.; Papierowska, E.; Labudda, M. Proteolytic and structural changes in rye and triticale roots under aluminium stress. Cells 2021, 10, 3046. [Google Scholar] [CrossRef]
- Niedziela, A.; Domżalska, L.; Dynkowska, W.M.; Pernisová, M.; Rybka, K. Aluminum stress induces irreversible proteomic changes in the roots of the sensitive but not the tolerant genotype of triticale seedlings. Plants 2022, 11, 165. [Google Scholar] [CrossRef] [PubMed]
- Kim, B.; Baier, A.; Somers, D.; Gustafson, J. Aluminum tolerance in triticale, wheat and rye. Euphytica 2001, 120, 329–337. [Google Scholar] [CrossRef]
- Zhang, X.; Jessop, R.; Alter, D. Organic acid exudation associated with aluminium stress tolerance in triticale and wheat. Aust. J. Agric. Res. 2003, 54, 979–985. [Google Scholar] [CrossRef]
- Niedziela, A. The influence of Al3+ on DNA methylation and sequence changes in the triticale (×Triticosecale Wittmack) genome. J. Appl. Genet. 2018, 59, 405–417. [Google Scholar] [CrossRef]
- Sasaki, T.; Yamamoto, Y.; Ezaki, B.; Katsuhara, M.; Ahn, S.J.; Ryan, P.R.; Delhaize, E.; Matsumoto, H. A wheat gene encoding an aluminium-activated malate transporter. Plant J. 2004, 37, 645–653. [Google Scholar] [CrossRef]
- Fontecha, G.; Silva-Navas, J.; Benito, C.; Mestres, M.A.; Espino, F.J.; Hernández-Riquer, M.V.; Gallego, F.J. Candidate gene identification of an aluminum-activated organic acid transporter gene at the Alt4 locus for aluminum tolerance in rye (Secale cereale L.). Theor. Appl. Genet. 2007, 114, 249–260. [Google Scholar] [CrossRef]
- Ligaba, A.; Maron, L.; Shaff, J.; Kochian, L.; Piñeros, M. Maize ZmALMT2 is a root anion transporter that mediates constitutive root malate efflux. Plant Cell Environ. 2012, 35, 1185–1200. [Google Scholar] [CrossRef]
- Ryan, P.R.; Raman, H.; Gupta, S.; Horst, W.J.; Delhaize, E. A second mechanism for aluminum resistance in wheat relies on the constitutive efflux of citrate from roots. Plant Physiol. 2009, 149, 340–351. [Google Scholar] [CrossRef] [PubMed]
- Garcia-Oliveira, A.L.; Benito, C.; Prieto, P.; de Andrade Menezes, R.; Rodrigues-Pousada, C.; Guedes-Pinto, H.; Martins-Lopes, P. Molecular characterization of TaSTOP1 homoeologues and their response to aluminium and proton (H+) toxicity in bread wheat (Triticum aestivum L.). BMC Plant Biol. 2013, 13, 134. [Google Scholar] [CrossRef]
- Ma, J.F.; Taketa, S.; Yang, Z.M. Aluminium tolerance genes on the short arm of chromosome 3R are linked to organic acid release in triticale. Plant Physiol. 2000, 122, 687–694. [Google Scholar] [CrossRef]
- Matos, M.; Camacho, M.V.; Pérez-Flores, V.; Pernaute, B.; Pinto-Carnide, O.; Benito, C. A new aluminium tolerance gene located on rye chromosome arm 7RS. Theor. Appl. Genet. 2005, 111, 360–369. [Google Scholar] [CrossRef] [PubMed]
- Benito, C.; Silva-Navas, J.; Fontecha, G.; Hernández-Riquer, M.V.; Eguren, M.; Salvador, N.; Gallego, F.J. From the rye Alt3 and Alt4 aluminum tolerance loci to orthologous genes in other cereals. Plant Soil 2010, 327, 107–120. [Google Scholar] [CrossRef]
- Silva-Navas, J.; Benito, C.; Téllez-Robledo, B.; El-Moneim, A.; Gallego, F.J. The ScAACT1 gene at the Qalt5 locus as a candidate for increased aluminium tolerance in rye (Secale cereale L.). Mol. Breed. 2011, 30, 845–856. [Google Scholar] [CrossRef]
- Raman, H.; Moroni, S.; Sato, K.; Read, J.; Scott, J. Identification of AFLP and microsatellite markers linked with an aluminium tolerance gene in barley (Hordeum vulgare L.). Theor. Appl. Genet. 2002, 105, 458–464. [Google Scholar] [CrossRef] [PubMed]
- Navakode, S.; Weidner, A.; Varshney, R.K.; Lohwasser, U.; Scholz, U.; Börner, A. A QTL Analysis of aluminium tolerance in barley; using gene-based markers. Cereal Res. Commun. 2009, 37, 531–540. [Google Scholar] [CrossRef]
- Niedziela, A.; Bednarek, P.T.; Labudda, M.; Mańkowski, D.R.; Anioł, A. Genetic mapping of a 7R Al tolerance QTL in triticale (x Triticosecale Wittmack). J. Appl. Genet. 2014, 55, 1–14. [Google Scholar] [CrossRef] [PubMed]
- Bird, A. Perceptions of epigenetics. Nature 2007, 447, 396–398. [Google Scholar] [CrossRef]
- Ma, L.; Xing, L.; Li, Z.; Jiang, D. Epigenetic control of plant abiotic stress responses. J. Genet. Genom. 2025, 52, 129–144. [Google Scholar] [CrossRef]
- Gallo-Franco, J.J.; Sosa, C.C.; Ghneim-Herrera, T.; Quimbaya, M. Epigenetic Control of Plant Response to Heavy Metal Stress: A New View on Aluminum Tolerance. Front. Plant Sci. 2020, 11, 602625. [Google Scholar] [CrossRef]
- Chinnusamy, V.; Zhu, J.K. Epigenetic regulation of stress responses in plants. Curr. Opin. Plant Biol. 2009, 12, 133–139. [Google Scholar] [CrossRef]
- Kumar, S.V.; Wigge, P.A. H2A.Z-containing nucleosomes mediate the thermosensory response in Arabidopsis. Cell 2010, 140, 136–147. [Google Scholar] [CrossRef] [PubMed]
- Nunez-Vazquez, R.; Desvoyes, B.; Gutierrez, C. Histone variants and modifications during abiotic stress response. Front. Plant Sci. 2022, 13, 984702. [Google Scholar] [CrossRef] [PubMed]
- Zhang, H.; Lang, Z.; Zhu, J.K. Dynamics and function of DNA methylation in plants. Nat. Rev. Mol. Cell Biol. 2018, 19, 489–506. [Google Scholar] [CrossRef] [PubMed]
- Law, J.A.; Jacobsen, S.E. Establishing, maintaining and modifying DNA methylation patterns in plants and animals. Nat. Rev. Genet. 2010, 11, 204–220. [Google Scholar] [CrossRef]
- Kashino-Fujii, M.; Yokosho, K.; Yamaji, N.; Yamane, M.; Saisho, D.; Sato, K.; Ma, J.F. Retrotransposon Insertion and DNA Methylation Regulate Aluminum Tolerance in European Barley Accessions. Plant Physiol. 2018, 178, 716–727. [Google Scholar] [CrossRef]
- Ramakrishnan, M.; Satish, L.; Kalendar, R.; Narayanan, M.; Kandasamy, S.; Sharma, A.; Emamverdian, A.; Wei, Q.; Zhou, M. The dynamism of transposon methylation for plant development and stress adaptation. Int. J. Mol. Sci. 2021, 22, 11387. [Google Scholar] [CrossRef]
- Chen, L.; Wang, T.; Zhao, M.; Tian, Q.; Zhang, W.H. Identification of aluminum-responsive microRNAs in Medicago truncatula by genome-wide high-throughput sequencing. Planta 2012, 235, 375–386. [Google Scholar] [CrossRef]
- Taspinar, M.S.; Aydin, M.; Sigmaz, B.; Yagci, S.; Arslan, E.; Agar, G. Aluminum-Induced Changes on DNA Damage; DNA Methylation and LTR Retrotransposon Polymorphism in Maize. Arab. J. Sci. Eng. 2018, 43, 123–131. [Google Scholar] [CrossRef]
- Pour, A.H.; Özkan, G.; Nalci, Ö.; Haliloğlu, K. Estimation of genomic instability and DNA methylation due to aluminum (Al) stress in wheat (Triticum aestivum L.) using iPBS and CRED-iPBS analyses. Turk. J. Bot. 2019, 43, 27–37. [Google Scholar]
- Choi, C.S.; Sano, H. Abiotic-stress induces demethylation and transcriptional activation of a gene encoding a glycerophosphodiesterase-like protein in tobacco plants. Mol. Genet. Genom. 2007, 277, 589–600. [Google Scholar] [CrossRef]
- Ezaki, B.; Higashi, A.; Nanba, N.; Nishiuchi, T. An S-adenosyl methionine synthetase (SAMS) gene from Andropogon virginicus L. confers aluminum stress tolerance and facilitates epigenetic gene regulation in Arabidopsis thaliana. Front. Plant Sci. 2016, 7, 1627. [Google Scholar] [CrossRef] [PubMed]
- Springer, N.M.; Schmitz, R.J. Exploiting induced and natural epigenetic variation for crop improvement. Nat. Rev. Genet. 2017, 18, 563–575. [Google Scholar] [CrossRef] [PubMed]
- Haque, M.N.; Singh, R.K.; Biswas, A. Role of epigenetics in plant stress responses: Implications in crop improvement. Front. Plant Sci. 2022, 13, 873456. [Google Scholar]
- Chwiałkowska, K.; Nowakowska, U.; Mroziewicz, A.; Szarejko, I.; Kwasniewski, M. Water-deficiency conditions differently modulate the methylome of roots and leaves in barley (Hordeum vulgare L.). J. Exp. Bot. 2016, 67, 1109–1121. [Google Scholar] [CrossRef]
- Reyna-López, G.E.; Simpson, J.; Ruiz-Herrera, J. Differences in DNA methylation patterns are detectable during the dimorphic transition of fungi by amplification of restriction polymorphisms. Mol. Gen. Genet. 1997, 253, 703–710. [Google Scholar] [CrossRef]
- Bednarek, P.T.; Orłowska, R.; Koebner, R.M.D.; Zimny, J. Quantification of the tissue-culture induced variation in barley (Hordeum vulgare L.). BMC Plant Biol. 2007, 7, 10. [Google Scholar]
- Vos, P.; Hogers, R.; Bleeker, M.; Reijans, M.; van de Lee, T.; Hornes, M.; Friters, A.; Pot, J.; Paleman, J.; Kuiper, M.; et al. AFLP: A new technique for DNA fingerprinting. Nucleic Acids Res. 1995, 23, 4407–4414. [Google Scholar] [CrossRef]
- Pereira, W.; Pappas, M.; Grattapaglia, D.; Pappas, G., Jr. A cost-effective approach to DNA methylation detection by Methyl Sensitive DArT sequencing. PLoS ONE 2020, 15, e0233800. [Google Scholar] [CrossRef]
- Aceituno, F.F.; Moseyko, N.; Rhee, S.Y.; Gutiérrez, R.A. The rules of gene expression in plants: Organ identity and gene body methylation are key factors for regulation of gene expression in Arabidopsis thaliana. BMC Genom. 2008, 9, 438. [Google Scholar] [CrossRef]
- Liu, J.; Dong, X.-X.; Zhao, Z.-K.; Sun, H.-R.; Yu, L.-X. Analysis of sunflower DNA methylation in response to salt and alkali stresses based on methylation-sensitive amplified polymorphisms. Curr. Plant Biol. 2023, 34, 100282. [Google Scholar] [CrossRef]
- Fulneček, J.; Kovařík, A. How to interpret Methylation Sensitive Amplified Polymorphism (MSAP) profiles? BMC Genet. 2014, 15, 2. [Google Scholar] [CrossRef] [PubMed]
- Bednarek, P.T.; Orłowska, R.; Niedziela, A. A Relative quantitative Methylation-Sensitive Amplified Polymorphism (MSAP) method for the analysis of abiotic stress. BMC Plant Biol. 2017, 17, 79. [Google Scholar] [CrossRef] [PubMed]
- Hermawaty, D.; Meitha, K.; Esyanti, R.R. The Potential of Methylation Sensitive Amplification Polymorphism (MSAP) Technique to Study Global DNA Methylation Changes in Plants: Basic Principles and Perspective. Rev. Agric. Sci. 2024, 12, 93–110. [Google Scholar] [CrossRef]
- Niedziela, A.; Bednarek, P.; Cichy, H.; Budzianowski, G.; Kilian, A.; Aniol, A. Aluminum tolerance association mapping in triticale. BMC Genom. 2012, 13, 67. [Google Scholar] [CrossRef]
- Silva, A.; Paterniani, M.; Camargo, C. Genetic variability and inheritance to aluminum tolerance in nutrient solution in triticale. Bragantia 2014, 73, 8–13. [Google Scholar] [CrossRef]
- Shafiq, S.; Zeb, Q.; Ali, A.; Sajjad, Y.; Nazir, R.; Widemann, E.; Liu, L. Lead, Cadmium and Zinc Phytotoxicity Alter DNA Methylation Levels to Confer Heavy Metal Tolerance in Wheat. Int. J. Mol. Sci. 2019, 20, 4676. [Google Scholar] [CrossRef]
- Zimny, J.; Oleszczuk, S.; Makowska, K.; Zimny, A.; Michalski, K.; Bednarek, P.; Sowa, S. Identification of an elite rye genotype with high androgenesis efficiency. In Proceedings of the Abstracts, Eucarpia General Congress, “Global Chellenges for Crop Improvement”, Leipzig, Germany, 18–23 August 2024; p. 82. [Google Scholar]
- Kilian, A.; Wenzl, P.; Huttner, E.; Carling, J.; Xia, L.; Blois, H.; Caig, V.; Heller-Uszynska, K.; Jaccoud, D.; Hopper, C.; et al. Diversity Arrays Technology: A Generic Genome Profiling Technology on Open Platforms. In Data Production and Analysis in Population Genomics, Methods in Molecular Biology; Pompanon, F., Bonin, A., Eds.; Humana Press: Totowa, NJ, USA, 2012; Volume 888, pp. 67–89. [Google Scholar]
- Bera, S.; De, A.K.; Adak, M.K. Modulation of Glycine Betaine Accumulation with Oxidative Stress Induced by Aluminium Toxicity in Rice. Proc. Natl. Acad. Sci. India Sect. B—Biol. Sci. 2019, 89, 291–301. [Google Scholar] [CrossRef]
- Rahman, R.; Upadhyaya, H. Aluminium toxicity and its tolerance in plant: A review. J. Plant Biol. 2021, 64, 101–121. [Google Scholar] [CrossRef]
- You, J.; Chanz, Z. ROS regulation during abiotic stress responses in crop plants. Front. Plant Sci. 2015, 6, 1092. [Google Scholar] [CrossRef]
- Szurman-Zubrzycka, M.; Chwiałkowska, K.; Niemira, M.; Kwaśniewski, M.; Nawrot, M.; Gajecka, M.; Larsen, P.B.; Szarejko, I. Aluminum or low pH—Which is the bigger enemy of barley? Transcriptome analysis of barley root meristem under Al and low pH stress. Front. Genet. 2021, 12, 675260. [Google Scholar] [CrossRef]
- Kocjan, A.N.; Kwaśniewska, J.; Szurman-Zubrzycka, M.E. Understanding plant tolerance to aluminum: Exploring mechanisms and perspectives. Plant Soil 2025, 507, 195–219. [Google Scholar] [CrossRef]
- Docimo, T.; De Stefano, R.; De Palma, M.; Cappetta, E.; Villano, C.; Aversano, R.; Tucci, M. Transcriptional; metabolic and DNA methylation changes underpinning the response of Arundo donax ecotypes to NaCl excess. Planta 2019, 251, 34. [Google Scholar] [CrossRef] [PubMed]
- Anioł, A. Induction of aluminium tolerance in wheat seedlings by low doses of aluminium in the nutrient solution. Plant Physiol. 1984, 75, 551–555. [Google Scholar] [CrossRef] [PubMed]
- XLSTAT Statistical Software for Excel. 2007. Available online: https://www.xlstat.com (accessed on 1 May 2025).
- Voorrips, R.E. MapChart: Software for the graphical presentation of linkage maps and QTLs. J. Hered. 2002, 93, 77–78. [Google Scholar] [CrossRef]

| Line | L195 | L198 | L201 | L203 | L1 | L17 | L27 | L34 | L145 | L190 | L422 | L451 | L291 | L438 | L444 |
|---|---|---|---|---|---|---|---|---|---|---|---|---|---|---|---|
| Cl * | S/T | S/T | S/T | S/T | S/NT | S/NT | S/NT | S/NT | W/T | W/T | W/T | W/T | W/NT | W/NT | W/NT |
| RG | 1.8 ± 0.4 | 2.9 ± 0.4 | 2.8 ± 0.5 | 0.9 ± 0.2 | 0.1 ± 0.1 | 0.0 ± 0.0 | 0.0 ± 0.0 | 0.0 ± 0.0 | 2.2 ± 0.3 | 1.7 ± 0.2 | 2.1 ± 0.3 | 1.9 ± 0.4 | 0.1 ± 0.1 | 0.0 ± 0.0 | 0.0 ± 0.0 |
| Plant Materials | Common Model | General Model | ||||||||||||||||
|---|---|---|---|---|---|---|---|---|---|---|---|---|---|---|---|---|---|---|
| Basic | Extended | |||||||||||||||||
| Tolerance | S/W | Plant Part | DM (%) | DNM (%) | MP (%) | NMP (%) | M (%) | NM (%) | DM (%) | DNM (%) | MP (%) | NMP (%) | M (%) | NM (%) | DN-CHG (%) | DN-CG (%) | DM-CHG (%) | DM-CG (%) |
| T | S | R | 4.25 | 3.26 | 33.38 | 59.92 | 36.34 | 63.66 | 9.79 | 9.11 | 36.27 | 44.82 | 45.38 | 54.62 | 0.86 | 8.22 | 1.32 | 8.48 |
| T | S | R | 4.64 | 2.74 | 33.69 | 60.09 | 36.01 | 63.99 | 9.56 | 8.79 | 37.24 | 44.40 | 46.03 | 53.97 | 0.55 | 8.19 | 0.87 | 8.69 |
| T | S | R | 2.14 | 3.89 | 33.47 | 62.46 | 36.64 | 63.36 | 8.53 | 9.43 | 36.88 | 45.16 | 46.31 | 53.69 | 0.88 | 8.45 | 0.60 | 7.93 |
| T | S | R | 1.82 | 5.37 | 35.00 | 60.24 | 39.41 | 60.59 | 8.53 | 10.56 | 37.82 | 43.08 | 48.38 | 51.62 | 1.41 | 9.01 | 0.44 | 8.10 |
| NT | S | R | 2.55 | 7.65 | 34.29 | 59.21 | 40.45 | 59.55 | 8.88 | 11.70 | 36.84 | 42.59 | 48.53 | 51.47 | 2.03 | 9.55 | 0.65 | 8.23 |
| NT | S | R | 1.78 | 9.49 | 35.74 | 57.15 | 43.40 | 56.60 | 8.52 | 12.57 | 37.25 | 41.66 | 49.82 | 50.18 | 2.13 | 10.31 | 0.45 | 8.07 |
| NT | S | R | 6.65 | 4.63 | 38.86 | 51.64 | 42.73 | 57.27 | 12.42 | 10.37 | 40.45 | 36.76 | 50.82 | 49.18 | 1.28 | 9.01 | 2.68 | 9.73 |
| NT | S | R | 7.04 | 3.92 | 38.94 | 51.06 | 42.45 | 57.55 | 12.14 | 9.95 | 40.33 | 37.58 | 50.28 | 49.72 | 1.04 | 8.78 | 2.40 | 9.74 |
| T | W | R | 1.74 | 4.23 | 35.32 | 60.81 | 38.73 | 61.27 | 8.50 | 9.89 | 37.80 | 43.81 | 47.69 | 52.31 | 1.11 | 8.70 | 0.32 | 8.18 |
| T | W | R | 2.45 | 5.73 | 35.09 | 59.59 | 39.69 | 60.31 | 8.73 | 10.63 | 37.58 | 43.06 | 48.21 | 51.79 | 1.32 | 9.21 | 0.58 | 8.15 |
| T | W | R | 2.19 | 6.66 | 35.02 | 57.17 | 41.25 | 58.75 | 8.78 | 11.71 | 38.25 | 41.26 | 49.96 | 50.04 | 2.14 | 9.40 | 0.51 | 8.27 |
| T | W | R | 1.52 | 4.82 | 36.84 | 60.01 | 40.38 | 59.62 | 8.52 | 10.03 | 39.23 | 42.21 | 49.27 | 50.73 | 0.60 | 9.40 | 0.31 | 8.21 |
| NT | W | R | 12.92 | 9.34 | 35.26 | 44.04 | 43.92 | 56.08 | 14.93 | 12.40 | 38.46 | 34.22 | 50.85 | 49.15 | 2.18 | 10.09 | 4.26 | 10.67 |
| NT | W | R | 10.06 | 4.97 | 34.23 | 49.52 | 39.69 | 60.31 | 12.59 | 11.02 | 40.53 | 35.86 | 51.55 | 48.45 | 1.62 | 9.31 | 3.08 | 9.51 |
| NT | W | R | 6.75 | 4.41 | 39.27 | 51.21 | 42.97 | 57.03 | 12.40 | 10.20 | 40.65 | 36.75 | 50.85 | 49.15 | 1.09 | 9.02 | 2.65 | 9.75 |
| NT | S | L | 3.19 | 3.48 | 35.75 | 58.06 | 39.04 | 60.96 | 9.23 | 9.64 | 38.94 | 42.18 | 48.58 | 51.42 | 0.84 | 8.72 | 0.69 | 8.55 |
| T | S | L | 3.11 | 3.85 | 33.01 | 61.34 | 36.39 | 63.61 | 8.87 | 9.35 | 36.82 | 44.96 | 46.16 | 53.84 | 0.77 | 8.51 | 0.76 | 8.11 |
| T | S | L | 8.16 | 2.98 | 33.73 | 56.81 | 36.10 | 63.90 | 12.18 | 8.55 | 37.04 | 42.24 | 45.58 | 54.42 | 0.29 | 8.22 | 2.94 | 9.24 |
| NT | W | L | 3.91 | 5.85 | 35.88 | 54.76 | 41.61 | 58.39 | 9.79 | 11.30 | 38.95 | 39.96 | 50.25 | 49.75 | 1.84 | 9.37 | 0.88 | 8.91 |
| Model | Variation Type (%) | Minimum | Maximum | Mean | SD | |
|---|---|---|---|---|---|---|
| Common | DM | 1.52 | 12.92 | 4.57 | 3.21 | |
| DNM | 2.74 | 9.49 | 5.12 | 1.96 | ||
| MP | 33.01 | 39.27 | 35.41 | 1.89 | ||
| NMP | 44.04 | 62.46 | 56.58 | 4.93 | ||
| M | 36.01 | 43.92 | 39.85 | 2.64 | ||
| NM | 56.08 | 63.99 | 60.15 | 2.64 | ||
| General | Basic variant | DM | 8.50 | 14.93 | 10.15 | 1.96 |
| DNM | 8.55 | 12.57 | 10.38 | 1.16 | ||
| MP | 36.27 | 40.65 | 38.28 | 1.42 | ||
| NMP | 34.22 | 45.16 | 41.19 | 3.36 | ||
| M | 45.38 | 51.55 | 48.66 | 1.99 | ||
| NM | 48.45 | 54.62 | 51.34 | 1.99 | ||
| Extended variant | DN-CHG | 0.29 | 2.18 | 1.26 | 0.56 | |
| DN-CG | 8.19 | 10.31 | 9.06 | 0.59 | ||
| DM-CHG | 0.31 | 4.26 | 1.40 | 1.20 | ||
| DM-CG | 7.93 | 10.67 | 8.76 | 0.78 | ||
| Model | Dependent Variable | ANOVA Statistics Description | Main Effects/Interactions | Statistics | |||||
|---|---|---|---|---|---|---|---|---|---|
| MSE | MS | F(2,16) | p | R2 | R2adj | ||||
| Common | DM% | Model | 4.95 | 53.08 | 10.73 | 0.001 | 0.573 | 0.519 | |
| interactions | tolerance * tissue | 27.66 | 5.59 | 0.008 | |||||
| tolerance * W-S * tissue | 50.08 | 10.12 | 0.006 | ||||||
| DNM% | Model | 2.76 | 12.52 | 4.53 | 0.028 | 0.361 | 0.281 | ||
| interactions | W-S | 7.81 | 2.83 | 0.110 | |||||
| tolerance * W-S * tissue | 19.53 | 7.07 | 0.017 | ||||||
| MP% | Model | 2.3 | 13.72 | 5.96 | 0.011 | 0.427 | 0.355 | ||
| Main effects | W-S | 1.94 | 0.84 | 0.370 | |||||
| interactions | tolerance * W-S | 24.58 | 10.68 | 0.005 | |||||
| NMP% | Model | 8.05 | 153.97 | 19.12 | 0.0001 | 0.700 | 0.668 | ||
| interactions | tolerance * tissue | 94.65 | 11.75 | 0.0002 | |||||
| tolerance * W-S * tissue | 72.61 | 9.02 | 0.008 | ||||||
| M% | Model | 2.45 | 43.00 | 17.55 | 0.0001 | 0.686 | 0.647 | ||
| Main effects | W-S | 22.66 | 9.25 | 0.008 | |||||
| interactions | tolerance * W-S * tissue | 66.84 | 27.28 | 0.00008 | |||||
| NM% | Model | 2.45 | 43.00 | 17.54 | 0.00009 | 0.686 | 0.647 | ||
| Main effects | W-S | 22.66 | 9.25 | 0.008 | |||||
| interactions | tolerance * W-S * tissue | 66.85 | 27.28 | 0.00008 | |||||
| General (basic variant) | DM% | Model | 1.81 | 20.03 | 11.08 | 0.001 | 0.581 | 0.528 | |
| interactions | tolerance * tissue | 11.71 | 6.48 | 0.004 | |||||
| tolerance * W-S * tissue | 13.6 | 7.52 | 0.014 | ||||||
| DNM% | Model | 0.77 | 5.98 | 7.75 | 0.004 | 0.492 | 0.428 | ||
| interactions | W-S | 4.96 | 6.42 | 0.022 | |||||
| tolerance * W-S * tissue | 8.25 | 10.69 | 0.005 | ||||||
| MP% | Model | 1.13 | 9.10 | 8.07 | 0.004 | 0.5 | 0.44 | ||
| Main effect | W-S | 5.1 | 4.53 | 0.049 | |||||
| NMP% | Model | 3.26 | 75.7 | 23.22 | 0.00001 | 0.743 | 0.712 | ||
| interactions | tolerance * tissue | 62.28 | 19.1 | 0.00005 | |||||
| W-S * tissue | 32.88 | 10.08 | 0.006 | ||||||
| M% | Model | 0.98 | 27.85 | 28.49 | 0.0001 | 0.781 | 0.753 | ||
| Main effects | W-S | 16.61 | 16.99 | 0.001 | |||||
| NM% | Model | 0.98 | 27.85 | 28.49 | 0.0001 | 0.781 | 0.753 | ||
| Main effects | W-S | 16.61 | 16.99 | 0.001 | |||||
| General (extended) | DN-CHG% | Model | 0.23 | 1.21 | 5.15 | 0.019 | 0.391 | 0.315 | |
| Main effects | W-S | 0.70 | 2.99 | 0.100 | |||||
| interactions | tolerance * W-S * tissue | 1.71 | 7.3 | 0.016 | |||||
| DN-CG% | Model | 0.19 | 1.69 | 8.91 | 0.003 | 0.526 | 0.468 | ||
| Main effects | W-S | 1.19 | 6.28 | 0.023 | |||||
| interactions | tolerance * W-S * tissue | 2.24 | 11.79 | 0.003 | |||||
| DM-CHG% | Model | 0.69 | 7.43 | 10.79 | 0.001 | 0.574 | 0.521 | ||
| interactions | tolerance * tissue | 9.4 | 13.65 | 0.002 | |||||
| tolerance * W-S * tissue | 5.46 | 7.93 | 0.012 | ||||||
| DM-CG% | Model | 0.31 | 3.06 | 9.96 | 0.001 | 0.555 | 0.499 | ||
| interactions | tolerance * tissue | 4.28 | 13.94 | 0.002 | |||||
| tolerance * W-S * tissue | 1.83 | 5.97 | 0.026 | ||||||
| Classification | DNA Methylation Quantitative Models | ||||||||
|---|---|---|---|---|---|---|---|---|---|
| Common | General | ||||||||
| Basic Variant | Extended Variant | ||||||||
| T-NT | S-W | Root-Leaves | T-NT | S-W | Root-Leaves | T-NT | S-W | Root-Leaves | |
| Optimal Lambda | 0.0511 | 0.1931 | 0.1285 | 0.0578 | 0.0833 | 0.1244 | 0.0419 | 0.2083 | 0.1209 |
| Intercept. | 0.2028 | −0.3184 | −1.3218 | 5.1232 | −19.9417 | −1.3218 | −38.316 | −0.3185 | −1.3217 |
| DM | 0 | 0 | 0 | 0 | 0 | 0 | |||
| DM-CHG | 0 | 0 | 0 | ||||||
| DM-CG | 2.3539 | 0 | 0 | ||||||
| DNM | 0 | 0 | 0 | 0.2477 | 0 | 0 | |||
| DN-CHG | 0.5351 | 0 | 0 | ||||||
| DN-CG | 1.8941 | 0 | 0 | ||||||
| MP | 0 | 0 | 0 | 0 | 0 | 0 | |||
| NMP | −0.2853 | 0 | 0 | −0.4391 | 0 | 0 | |||
| M | 0.4006 | 0 | 0 | 0.2128 | 0.4021 | 0 | |||
| NM | 0 | 0 | 0 | −1.6 × 10⁻¹⁶ | −3.9 × 10⁻¹⁶ | 0 | |||
Disclaimer/Publisher’s Note: The statements, opinions and data contained in all publications are solely those of the individual author(s) and contributor(s) and not of MDPI and/or the editor(s). MDPI and/or the editor(s) disclaim responsibility for any injury to people or property resulting from any ideas, methods, instructions or products referred to in the content. |
© 2025 by the authors. Licensee MDPI, Basel, Switzerland. This article is an open access article distributed under the terms and conditions of the Creative Commons Attribution (CC BY) license (https://creativecommons.org/licenses/by/4.0/).
Share and Cite
Niedziela, A.; Orłowska, R.; Bednarek, P.T. DNA Methylation Changes Reflect Aluminum Stress in Triticale and Epigenetic Control of the Trait. Int. J. Mol. Sci. 2025, 26, 4995. https://doi.org/10.3390/ijms26114995
Niedziela A, Orłowska R, Bednarek PT. DNA Methylation Changes Reflect Aluminum Stress in Triticale and Epigenetic Control of the Trait. International Journal of Molecular Sciences. 2025; 26(11):4995. https://doi.org/10.3390/ijms26114995
Chicago/Turabian StyleNiedziela, Agnieszka, Renata Orłowska, and Piotr Tomasz Bednarek. 2025. "DNA Methylation Changes Reflect Aluminum Stress in Triticale and Epigenetic Control of the Trait" International Journal of Molecular Sciences 26, no. 11: 4995. https://doi.org/10.3390/ijms26114995
APA StyleNiedziela, A., Orłowska, R., & Bednarek, P. T. (2025). DNA Methylation Changes Reflect Aluminum Stress in Triticale and Epigenetic Control of the Trait. International Journal of Molecular Sciences, 26(11), 4995. https://doi.org/10.3390/ijms26114995