Article

Reference Genes Selection and Validation for Cinnamomum burmanni by Real-Time Quantitative Polymerase Chain Reaction

1
College of Biological Sciences and Biotechnology, National Engineering Laboratory for Tree Breeding, Key Laboratory of Genetics and Breeding in Forest Trees and Ornamental Plants, Ministry of Education, Tree and Ornamental Plant Breeding and Biotechnology Laboratory of National Forestry and Grassland Administration, Beijing Forestry University, Beijing 100083, China
2
Guangdong Provincial Key Laboratory of Silviculture, Protection and Utilization, Guangdong Academy of Forestry, Guangzhou 510520, China
*
Authors to whom correspondence should be addressed.
These authors contributed equally to this work.
Int. J. Mol. Sci. 2024, 25(6), 3500; https://doi.org/10.3390/ijms25063500
Submission received: 26 December 2023 / Revised: 12 March 2024 / Accepted: 15 March 2024 / Published: 20 March 2024
(This article belongs to the Section Molecular Biology)

Abstract

:
In recent years, the field of biology has witnessed a surge of interest in genomics research due to the advancements in biotechnology. Gene expression pattern analysis plays a crucial role in this research, as it enables us to understand the regulatory mechanism of gene expression and the associated biological processes. Real-time quantitative polymerase chain reaction (q-PCR) is an efficient method to analyze the gene expression patterns, for which accuracy relies on the standardized analysis of reference genes. However, numerous studies have shown that no reference gene is universal in all conditions, so screening a suitable reference gene under certain conditions is of great importance. Cinnamomum burmannii (C. burmannii) is rich in volatile components and has high medicinal and economic value. However, knowledge of the screening of reference genes for the gene expression analysis of C. burmannii is insufficient. Aiming at this problem, we evaluated and screened the reference genes in C. burmannii under different experimental conditions, including different abiotic stresses (Cold-treated, PEG-treated and Nacl-treated), different tissues, leaves at different developmental stages and different chemical types. In this study, different algorithms (∆Ct, geNorm, NormFinder and BestKeeper) were used to evaluate the stability of the candidate reference genes, and RefFinder further merged the output data to screen out the optimum reference gene under various experimental conditions in C. burmannii. The results showed that the optimal reference gene number for gene standardization was 2 under different experimental conditions. RPL27|RPS15 was the most suitable combination under the Nacl-treated and PEG-treated samples. RPL27|APT was the optimum combination under the Cold-treated samples. The optimal combinations of other samples were EF1α|ACT7 for different tissues, eIF-5A|Gllα for different borneol clones in C. burmannii, RPS15|ACT7 for leaves at different developmental stages and RPS15|TATA for all samples. Additionally, two terpenoid synthesis-related genes (CbWRKY4 and CbDXS2) were standardized to verify the feasibility of the selected reference genes under different experimental conditions. This study will be helpful for the subsequent molecular genetic mechanism study of C. burmannii.

1. Introduction

Real-time quantitative polymerase chain reaction (q-PCR) is a widely utilized method in molecular biology for investigating gene expression differences across various cell types, tissues, organs or developmental stages [1,2,3]. By comparing gene expression in different samples, researchers can identify genes that are activated or inhibited under specific physiological or pathological conditions, which is of great significance for studying the mechanisms of human diseases, finding treatments and improving crop traits. Compared with traditional PCR, a q-PCR has the advantages of rapidity, sensitivity, specificity and quantification [4]. However, the reliability of a q-PCR is affected by many factors, such as RNA quality, PCR amplification efficiency and differences between samples [5]. Currently, the most common method for correcting and standardizing the q-PCR data is to select appropriate reference genes [6]. Reference genes are expressed in various cells of organisms, and their products are proteins necessary to maintain the basic life activities of cells. Ideally, the expression level of a selected reference gene should be relatively constant in various tissues, cells and experimental conditions. However, multiple forms of evidence suggested that it was difficult to have a single reference gene that was universal for all conditions. For instance, glycerol-aldehyde-3-phosphate dehydrogenase (GAPDH), a commonly used reference gene, was selected as having the best stability in Carex rigescens under salt-treated leaves [7] but not suitable for Salsola ferganica under six abiotic stresses [8] and Betula platyphylla under salt and osmotic stress conditions [9]. In addition, actin (ACT) was selected as the optimum reference gene for leaves in Solanum lycopersicum exposed to UV-B María [10], but its stability was poor in most experiments with pecan [11]. Such phenomena have urged more and more studies to focus on the screening of reference genes in biological samples under certain circumstances. At present, attempts have been made to screen reliable reference genes for a q-PCR analysis in many plants, such as sweetpotato [12], Siberian Apricot [13], Sorghum [14], pecan [11], Metasequoia [15], Rubus [16], Schima superba [17,18], etc.
Cinnamomum burmannii (C. burmnnii), a Cinnamomum species in Lauraceae, is an important aromatic medicinal and green tree species, mainly distributed in the Guangdong, Guangxi and Fujian provinces in China. C. burmannii leaves contain a variety of volatile compounds and extensive research showed that C. burmannii had potential health benefits, such as antibacterial, antioxidant, antidiabetic and antitumor [19,20,21,22]. In particular, the borneol-type essential oil is an important raw material for cosmetics and medicine due to the better permeability and antibacterial properties of borneol [23]. In the past few decades, the studies of C. burmannii mainly focused on the extraction, composition analysis of the compounds and biological activity [21,24,25,26], but there is only limited research on gene regulation [27,28,29]. To some extent, this hindered the genetic improvement of the crop, and understanding the biological function of this crop is very important for further molecular breeding. An accurate gene expression analysis will provide a powerful and valuable approach to understand the molecular biological mechanisms of growth and development, as well as signal transduction and metabolism [30,31]. However, to our best knowledge, there is no report on the systematic reference gene screening of C. burmannii. Hence, it is very necessary to study the reference gene selection of C. burmannii in order to improve the reliability of the gene expression analysis.
In this study, the stability of 13 candidate reference genes was evaluated under a series of experimental conditions. In order to verify the reliability and accuracy of the reference genes, the expression trends of two terpenoid synthesis-related genes CbWRKY4 and CbDXS2 were detected under different experimental conditions. Terpenoids are a kind of natural compound that exist widely in nature and have great value to plants, animals and humans. As the first enzyme of the MEP pathway, 1-deoxyxylose-5-phosphate synthetase (DXS) is a rate-limiting enzyme of this pathway, which plays a key role in regulating the synthesis of terpenoids [32]. WRKY is a class of DNA-specific binding transcription factors that regulate metabolic processes by binding promoter elements of key enzyme genes in the plant secondary metabolic biosynthesis pathway [33]. The reference genes identified through this study will facilitate the future gene function analysis in C. burmannii.

2. Results

2.1. Primer Specificity and Amplification Efficiency of Candidate Reference Genes

The agarose gel electrophoresis results showed that the PCR amplification product of the reference genes was consistent with the expected size and had a single band (Figure S1). A q-PCR analysis showed that each pair of primers had a single peak (Figure S2). The amplification efficiency (E) and the regression coefficient values R2 of each pair of primers are shown in Table 1. All the results suggested that the candidate gene primers used in this study can be used for further q-PCR analysis.

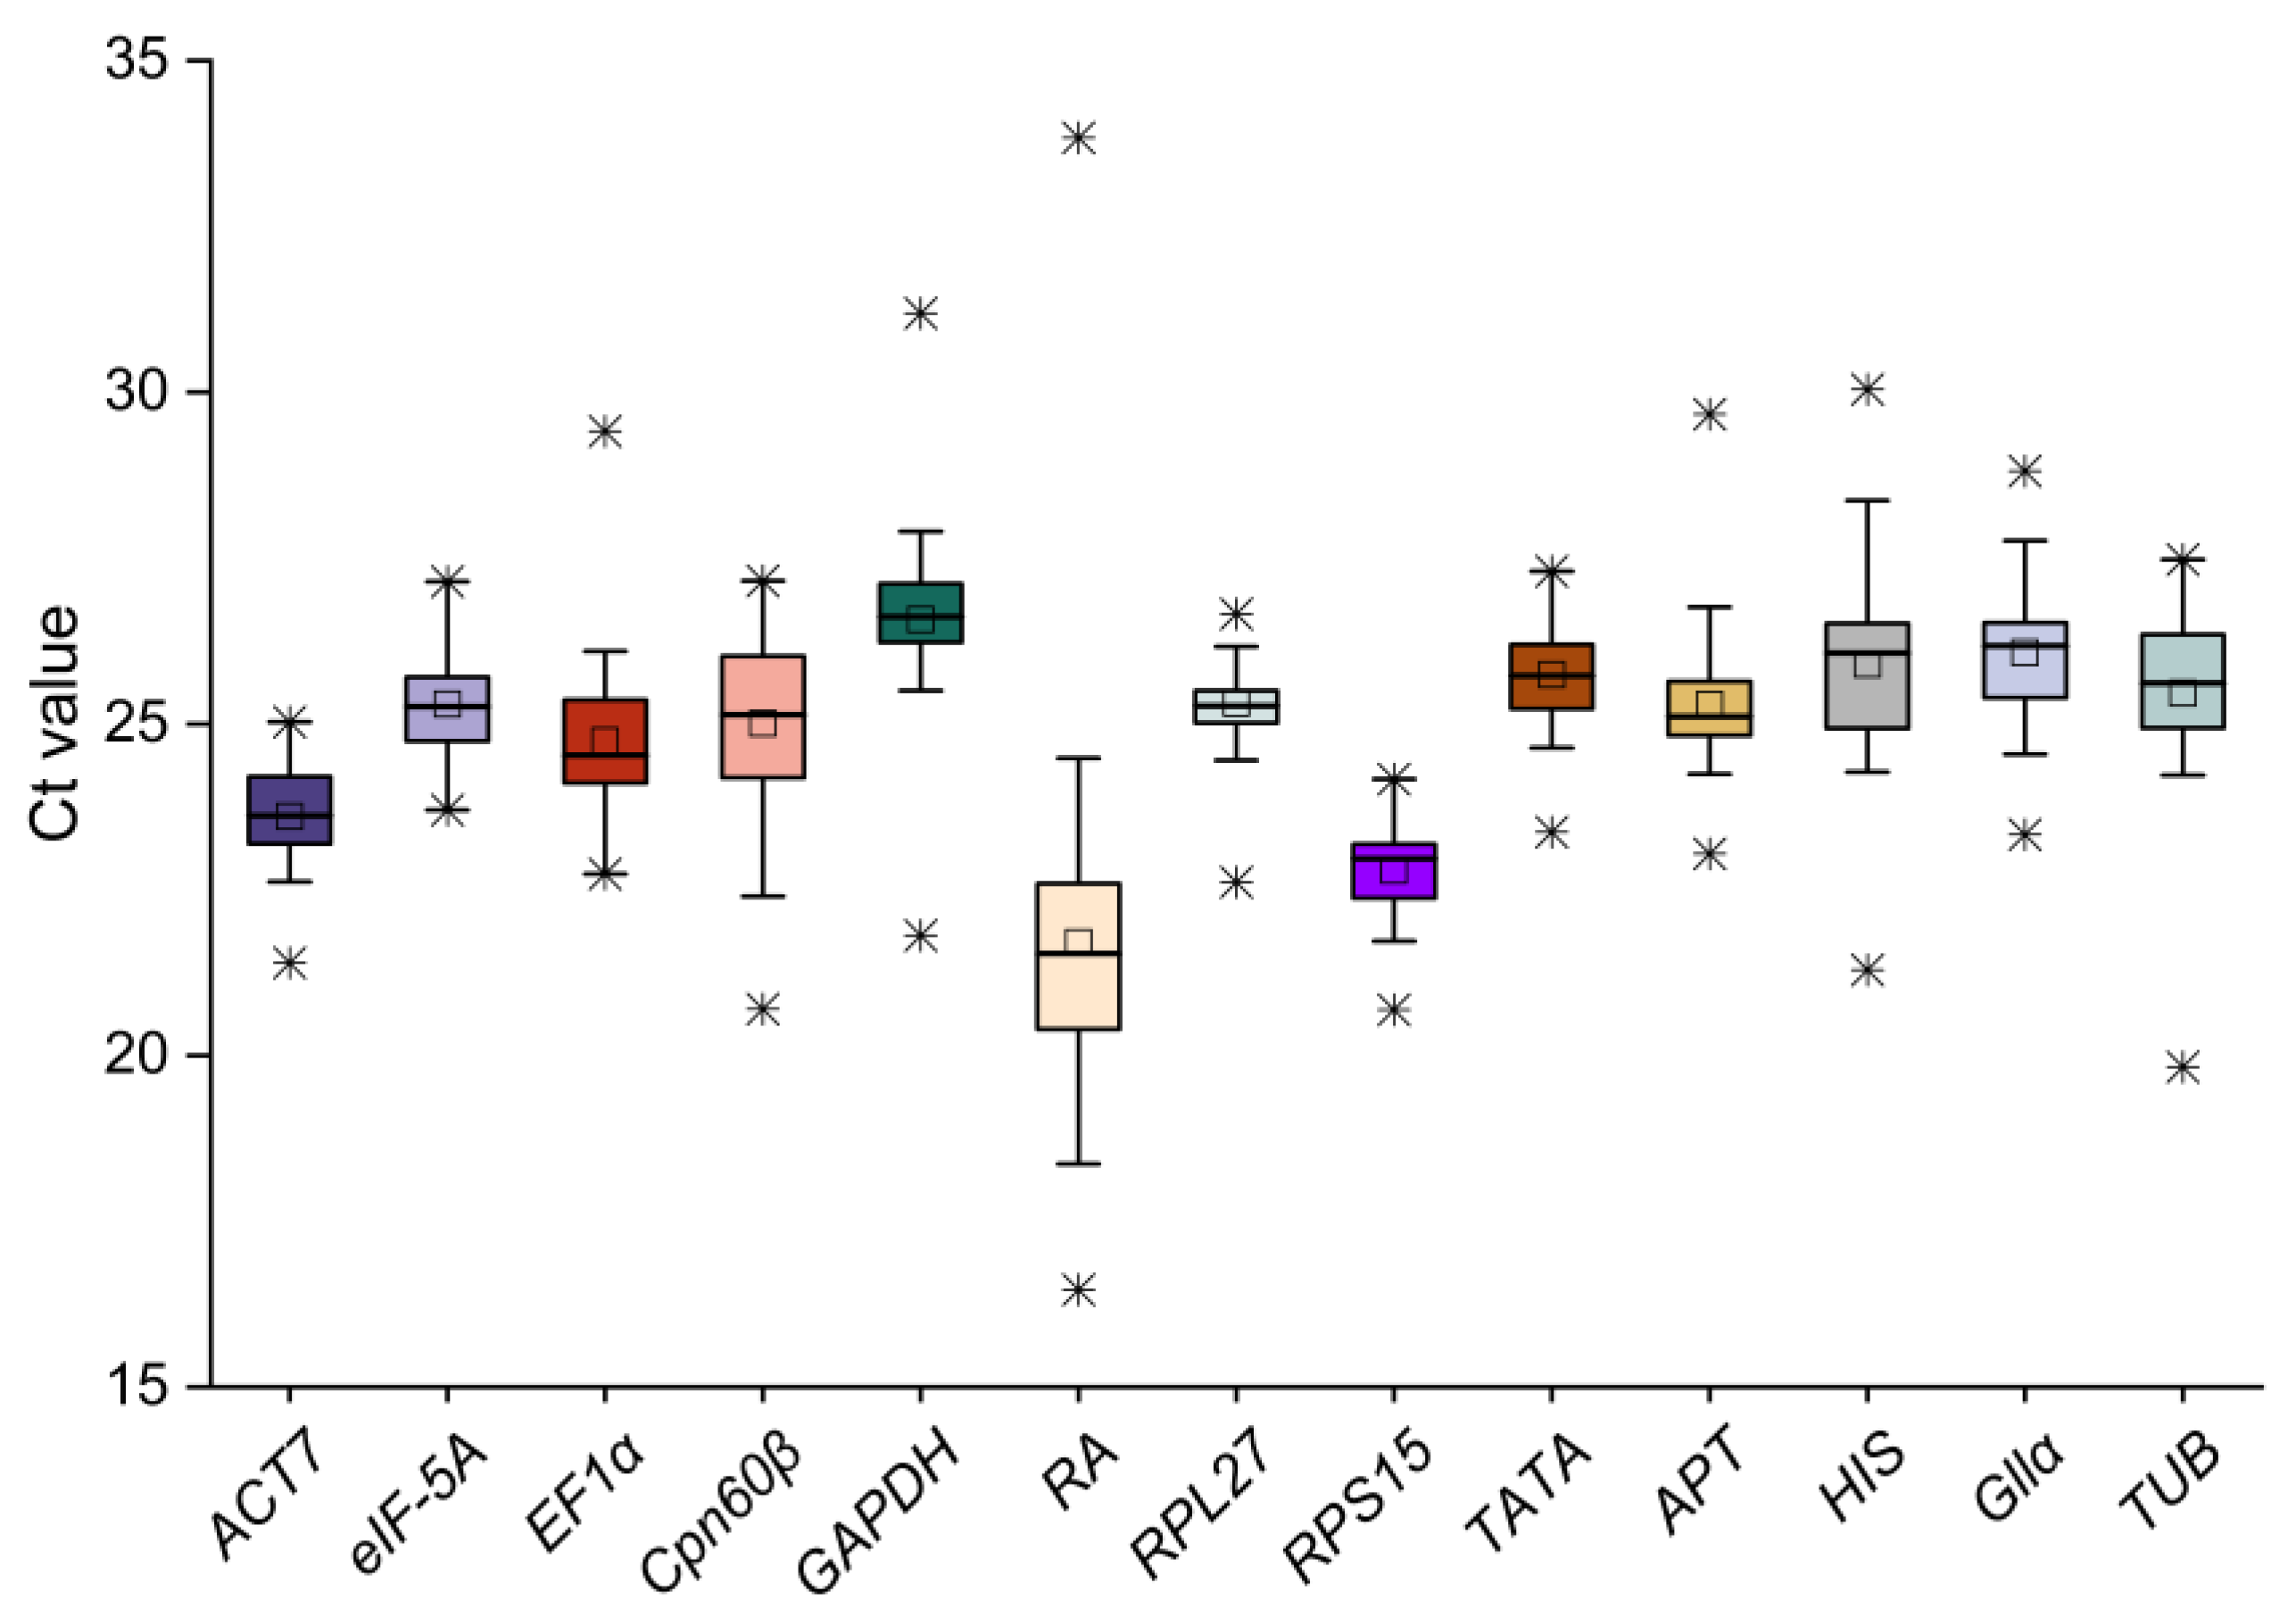
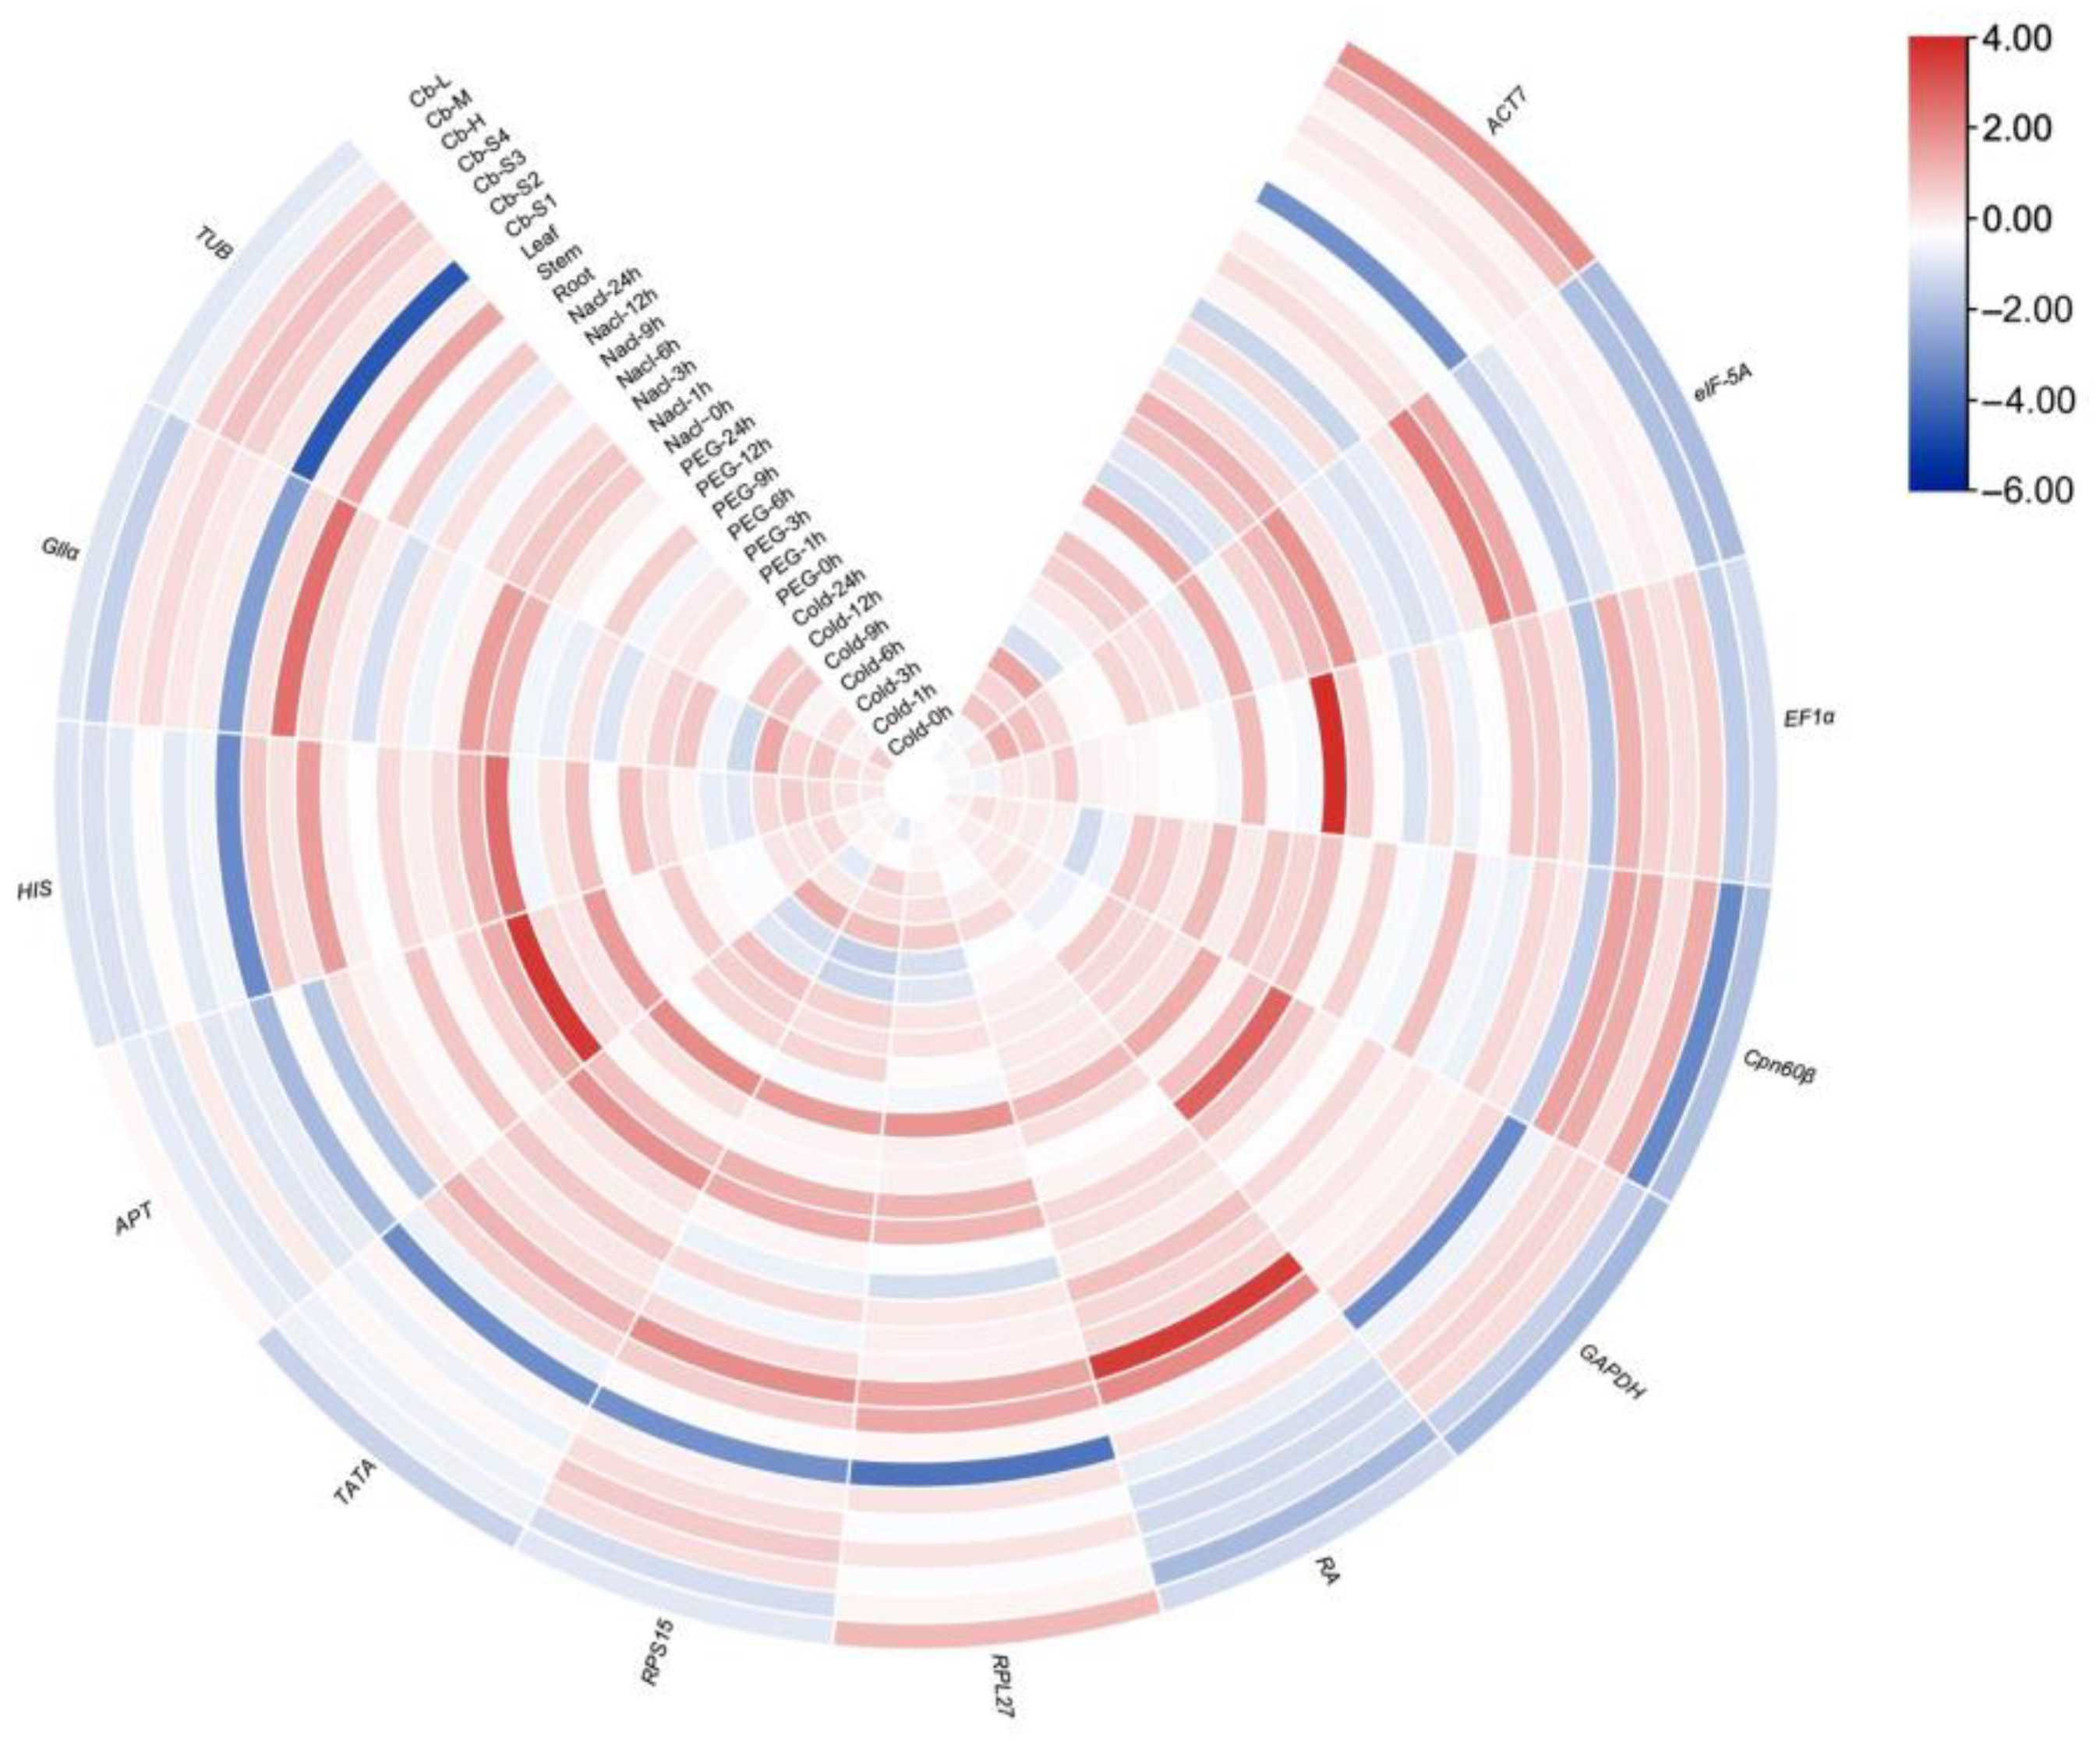
2.2. Expression Analysis of Candidate Reference Genes of C. burmannii

The transcriptional levels of the candidate reference genes in different materials were determined by the Ct values, and the gene expression varied from sample to sample (Figure 1). Among these, the expression level of RA was the highest with the mean Ct (21.70) across all materials, while the expression abundance of GAPDH was the lowest with the mean Ct (26.57). The results suggested that for the gene expression level exists obvious divergence in all the samples. Meanwhile, the transcription level of the reference genes also showed different expression variation, and ACT7, RPL27, RPS15, TATA and eIF-5A had a relative narrower Ct range, indicating that these genes might be expressed more stably. Furthermore, the Log2 Fold method was used to calculate the expression levels of the candidate genes in all the materials to analyze their expression stability, and the heat map clearly shows the expression level of each gene in each sample (Figure 2).

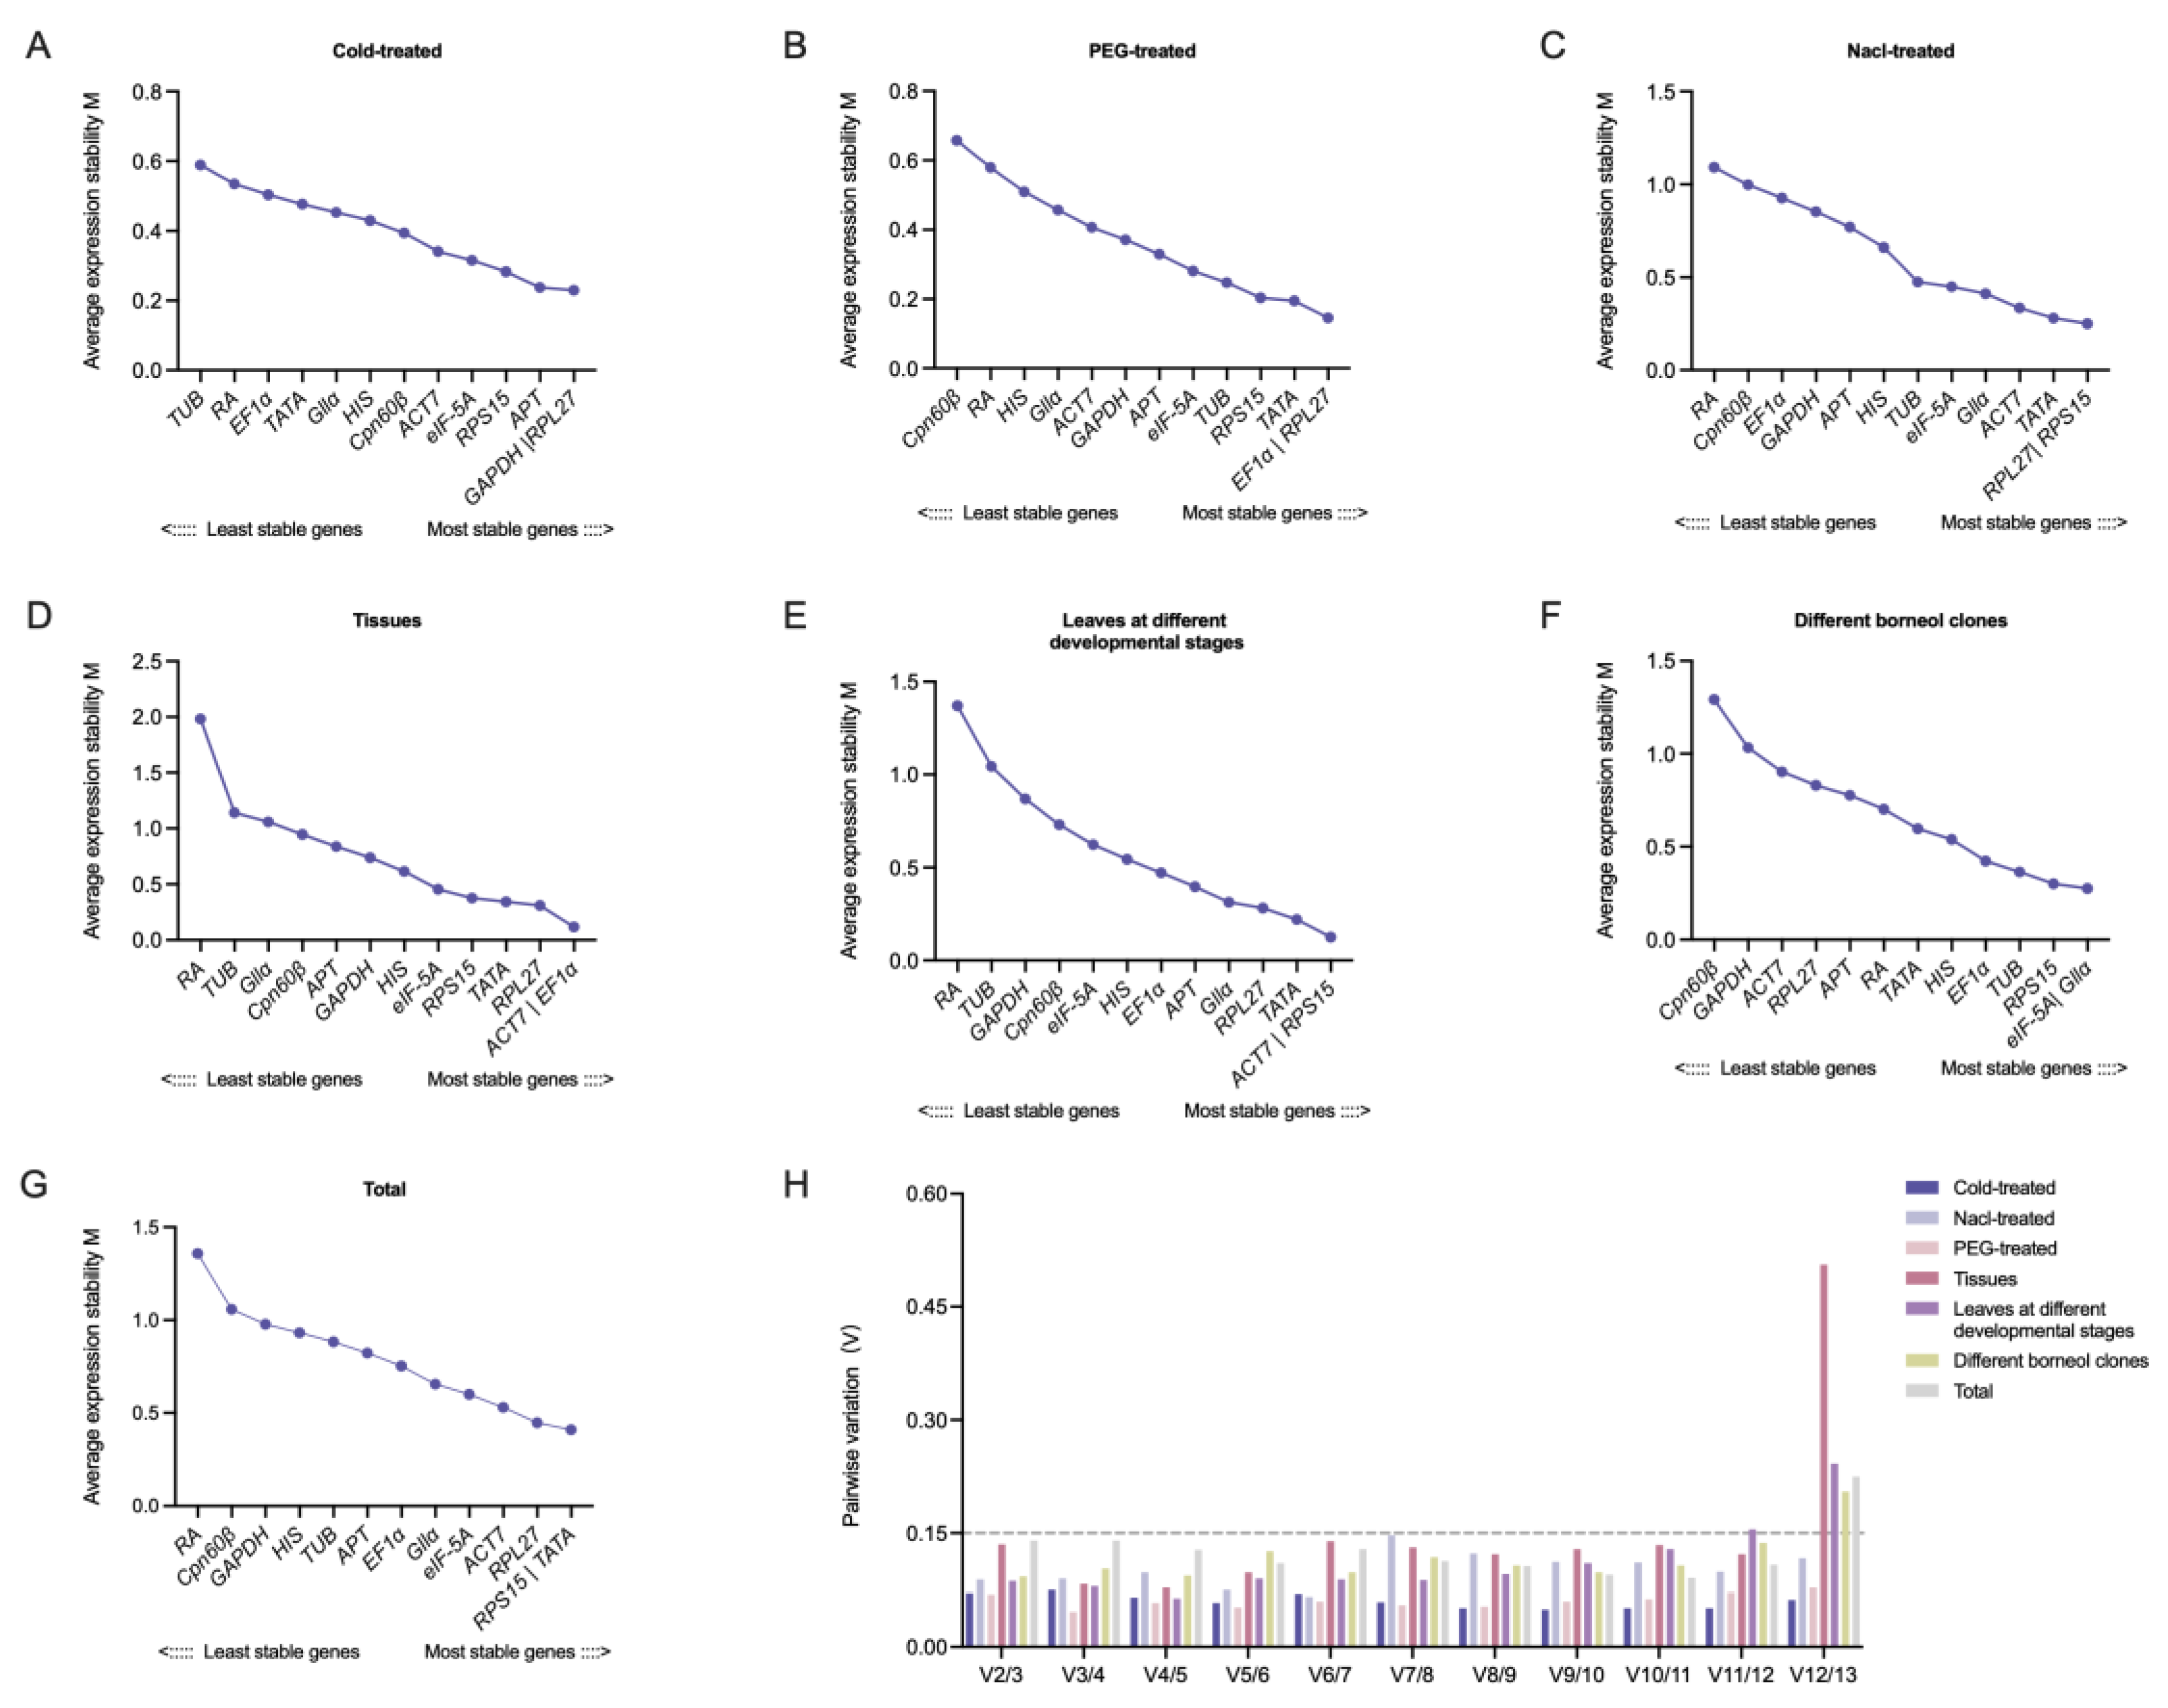
2.3. Gene Expression Stability Analysis

The stability of the reference gene was evaluated by ∆Ct, and the gene associated with the lowest mean standard deviation (mSD) was thought to be the optimum. The results of the ∆Ct analysis showed that RPS15 was the most stable gene in Nacl-treated, PEG-treated, leaves at different developmental stages, different borneol clones and total samples (Table 2). RPL27 was the most stable gene in the Cold-treated samples and EF1α had the best stability among the different tissues.
Meanwhile, geNorm analyzed the expression stability of the 13 candidate genes according to the M value (threshold value was 1.5) (Table S1 and Figure 3). The candidate genes with M < 1.5 could be used for the standardized analysis, and the smaller the M value, the better the gene stability. In this study, the lowest M of RPL27|RPS15 in the Nacl-treated samples indicated the highest stability, while the highest M of RA indicated the lowest stability. In the PEG-treated samples, EF1α|RPL27 showed the most stable expression, and Cpn60β was the most unstable. GAPDH|RPL27 was the most suitable combination in the Cold-treated samples, while TUB was the least suitable. In the plant tissues, ACT7|EF1α was the optimum combination and RA was the poor one. The stability of eIF-5A|Gllα was higher than that of the other genes in different borneol clones. ACT7|RPS15 was the best rank in the leaves at different developmental stages, while RA was the worst. After a comprehensive evaluation of all the samples, the stability of RPS15|TATA was the best, while that of RA was the worst. In addition to determining the expression stability of the candidate reference genes, geNorm could also determine the optimum number of reference genes by analyzing the pairwise variation (Vn/Vn + 1). In this study, the V2/3 were all less than 0.15, indicating that the standardized analysis of the q-PCR in C. burmannii could be met by using two reference genes (Figure 3H).
Furthermore, NormFinder further determined the stability of the candidate genes via SV and a lower SV indicated more stability (Table 3). In the Nacl-treated samples, RPL27 (0.328) was expressed most stably, with RA (1.499) the most unstable. In the PEG-treated samples, RPS15 (0.082) was stable, and Cpn60β (1.005) was the least stable. In the Cold-treated samples, RPL27 (0.115) was the optimum, and TUB (0.803) was expressed most unstably. EF1α (0.058) was expressed most stably in the different tissues, while RA (6.568) expression was the most unstable. In different borneol clones, the stability of eIF-5A (0.128) was most stable, and Cpn60β (2.66) was the most unstable. RPS15 (0.063) was expressed most stably in the leaves at different developmental stages, and RA (3.132) was the most unstable. The NormFinder analysis of all the samples showed that RPS15 (0.21) was expressed most stably and RA (2.918) was the least stable.
Moreover, BestKeeper calculated the standard coefficient of variation (SD) and coefficient of variation correlation (CV) of the Ct values of all the candidate genes, and the relatively low SD values (less than 1) were generally considered to be in the acceptable range (Table 4). In the Nacl-treated samples, TATA (0.38) was the most stable, while EF1α (1.28) was the least stable. In the PEG-treated samples, RPL27 (0.35) was stable, while RA (0.8) was the least stable. In the Cold-treated samples, APT (0.27) was expressed most stably, but the expression of HIS (0.74) was the most unstable. ACT7 (0.19) was expressed stably in the different tissues, and the expression of RA (4.74) was the most unstable. Among the different borneol clones, HIS (0.1) ranked the best, while Cpn60β (2.37) ranked the worst. In the leaves at different developmental stages, eIF-5A (0.46) was the most stable, while TUB (2.38) was the most unstable. The BestKeeper analysis of all the samples showed that RPL27 (0.47) was the most stable, while RA (1.87) was the least stable.
Ultimately, RefFinder further merged the output data to screen out the optimum reference gene in the different experimental materials (Figure 4). The expression stability of RPL27|RPS15 was higher than that of the other genes in the Nacl-treated and PEG-treated samples. RPL27|APT ranked best in the Cold-treated samples and EF1α|ACT7 was the most suitable combination in the different tissues. eIF-5A|Gllα was suitable for different borneol clones and RPS15|ACT7 was the optimum in leaves at different developmental stages. When analyzing all the samples, RPS15|TATA was the best combination in all the samples. The Ct values of all the candidate reference genes in various materials for reference gene screening can be found in Table S2 of the Supplementary Material.

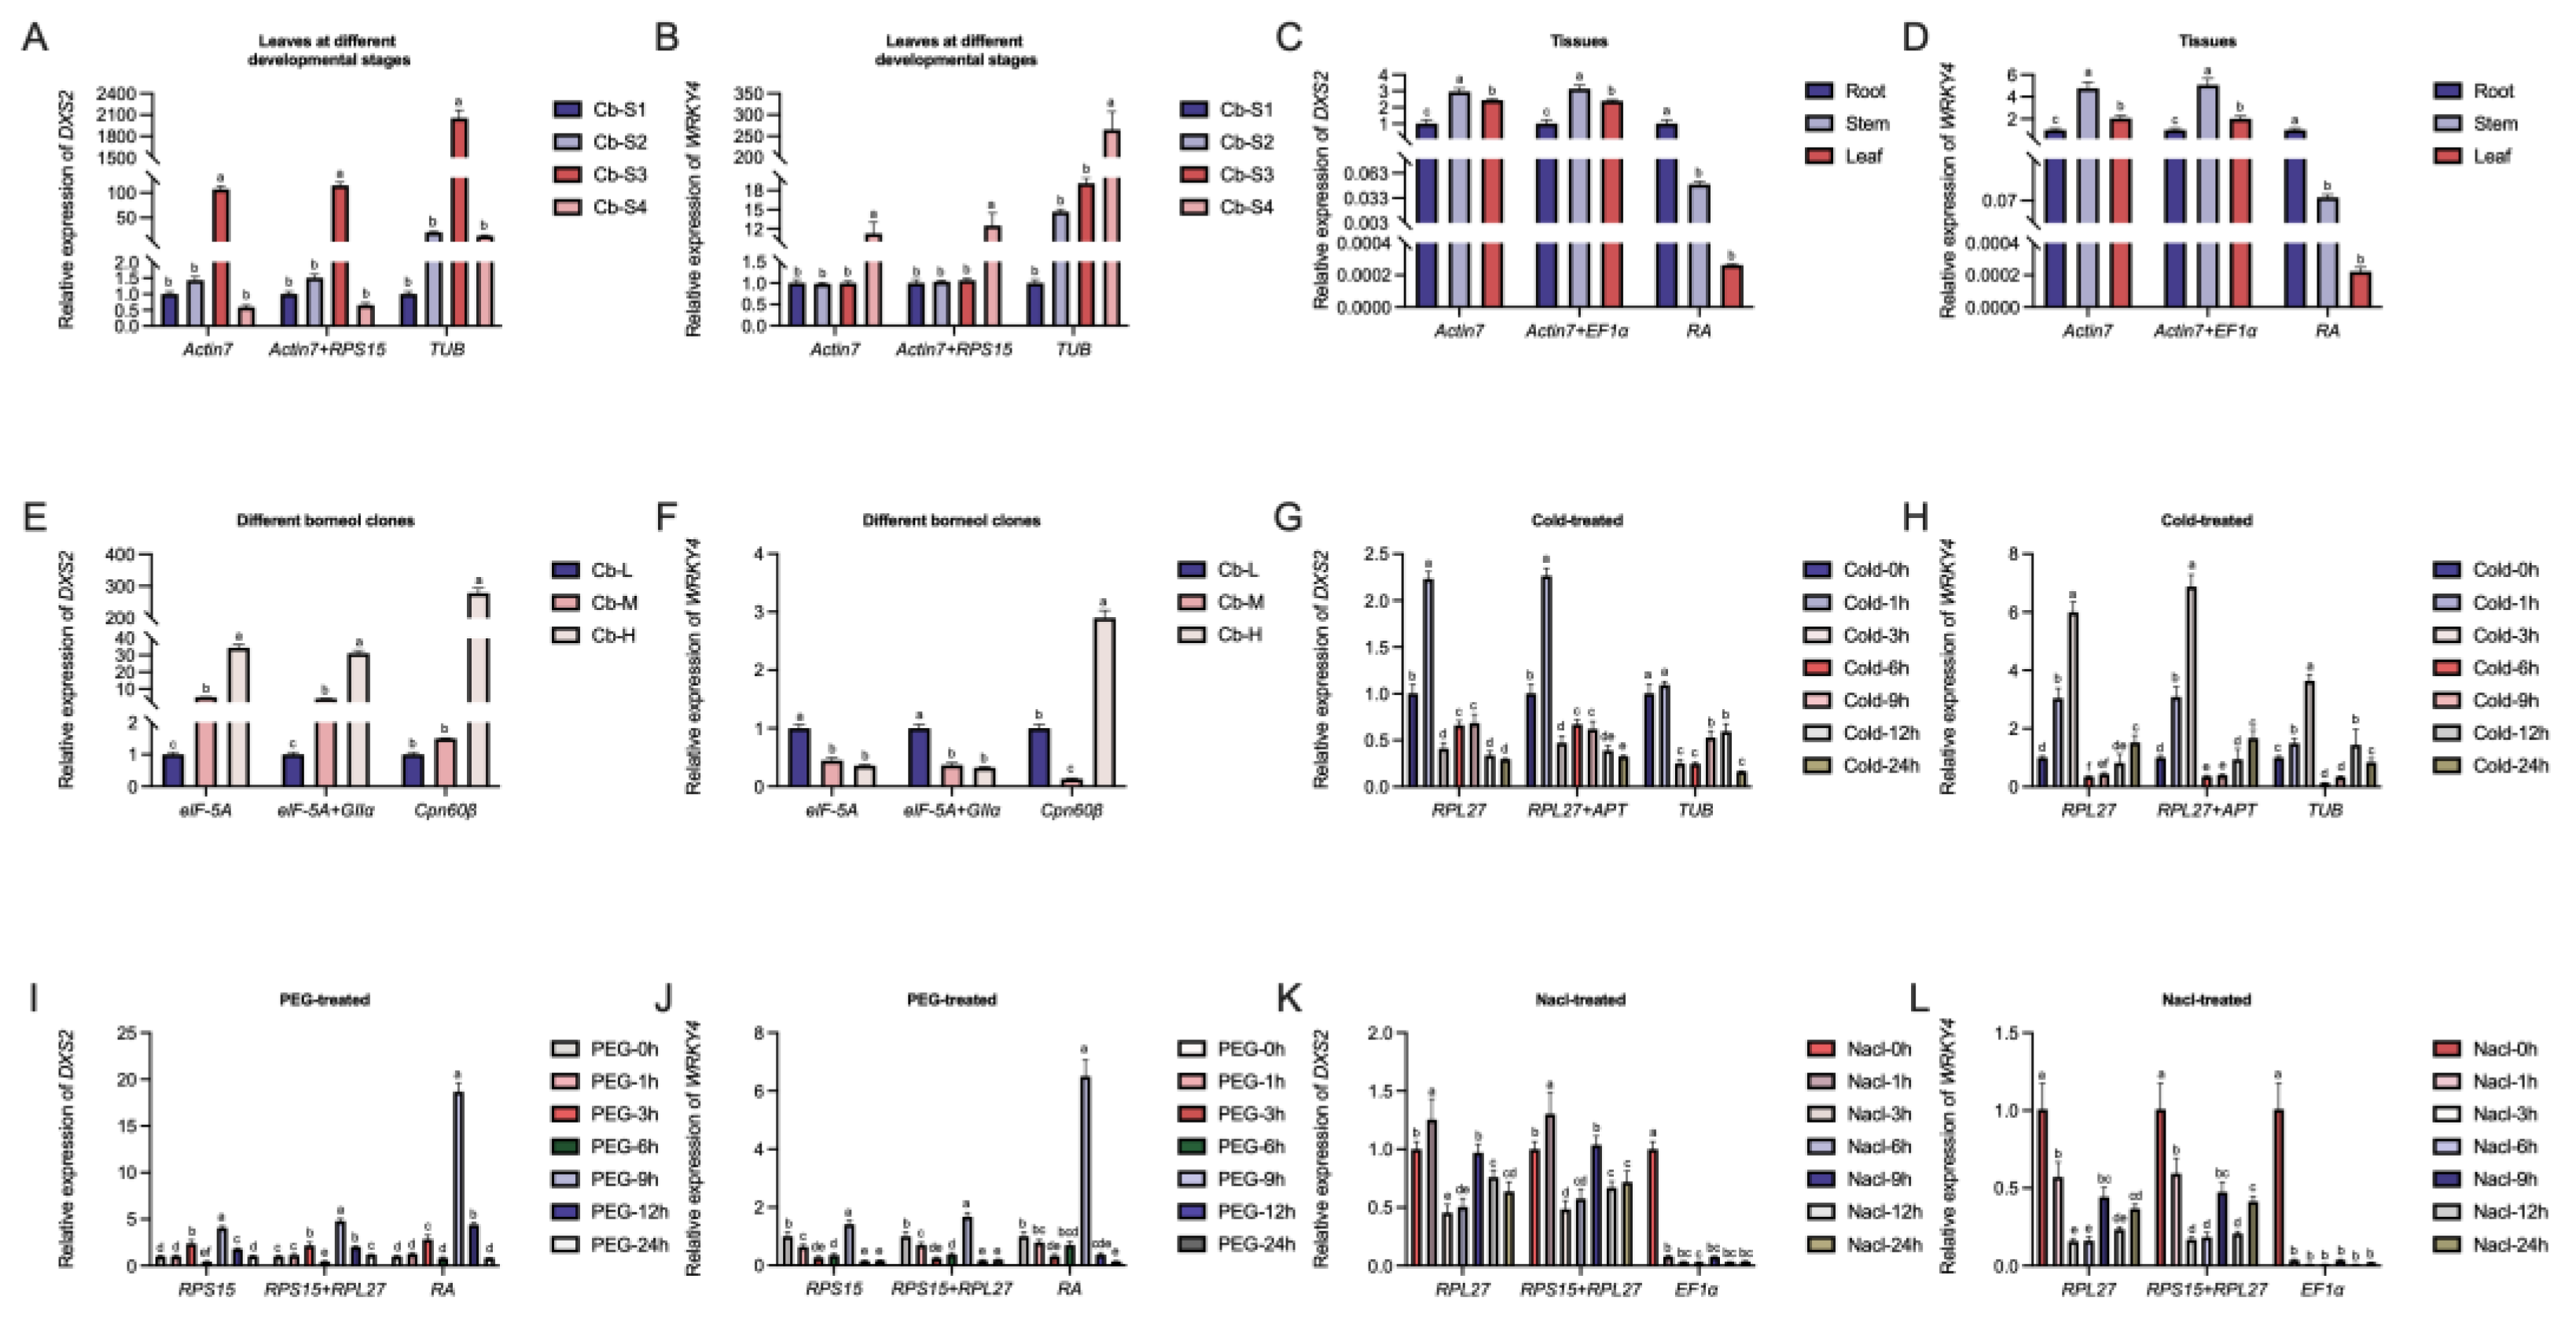
2.4. Reference Gene Validation

To verify the accuracy and suitability of the selected reference genes, the expression levels of two terpenoid synthesis-related genes (CbWRKY4 and CbDXS2) were evaluated using two stable reference genes and the unstable reference gene under different experimental conditions. DXS, a key rate-limiting enzyme, is pivotal in the MEP pathway for terpenoid synthesis and exerts influence on the downstream metabolite content [34,35]. WRKY transcription factors play a crucial role in terpenoid synthesis by specifically binding to the promoter elements of key genes involved in the terpenoid synthesis pathway [36,37]. Our results show that the expression patterns of CbDXS2 and CbWRKY4 differ significantly using different reference genes for q-PCR normalization in all the experimental treatments (Figure 5). The expression patterns of CbDXS2 and CbWRKY4 were similar using the optimal and the best combination reference genes. However, after the normalization of the unstable reference genes, the expression patterns of CbDXS2 and CbWRKY4 were significantly different from those of the optimal reference gene combination. For instance, the expression levels of CbDXS2 and CbWRKY4 in roots were the lowest when normalized by ACT7 and EF1α, while the expression levels of CbDXS2 and CbWRKY4 in roots were the highest when normalized by RA in different tissues (Figure 5C,D). CbDXS2 had the highest expression at 1 h using RPL27 and RPS15 for q-PCR normalization, while CbDXS2 was hardly expressed at 1 h using EF1α under the Nacl-treated samples (Figure 5K). All the results showed that the selection of appropriate reference genes was crucial for the accurate normalization of gene expression.

3. Discussion

Nowadays, a q-PCR is regarded as an efficient tool to understand the molecular biology research [38,39], for which accuracy relies on the normalization of reference genes [40]. However, numerous studies have shown that the gene expression level of a reference gene differs in different experimental conditions [41,42,43], which was also confirmed in our study where the stability of 13 reference genes was different under certain conditions. Therefore, screening appropriate reference genes under specific conditions is of great significance for subsequent gene expression analysis. The identification of appropriate reference genes in C. burmannii will promote the study of the gene regulation of this species.
In this study, ∆Ct [44], BestKeeper [6], geNorm [45] and NormFinder [46] were used to evaluate the candidate reference genes in C. burmannii under different experimental conditions. The results demonstrated that there were some differences in the stability of the reference genes among the different software. The reason for this may be due to the differences in algorithms between the software [47] and the similar phenomena were often seen in other research, such as in Carex rigescens [7], Luffa [48] and Rubia yunnanensis Diels [49]. In this case, a further comprehensive analysis of the results based on the geometric means of the results to reduce the bias caused by differences in the software algorithms better reflects the expression stability of the reference genes under certain conditions (Figure 4). Considering the reliability and accuracy of q-PCR normalization, a growing number of studies showed that a single reference gene sometimes cannot guarantee the accuracy of experimental results; two or more reference genes were needed for a q-PCR standardized analysis [50,51]. In this study, the comprehensive verification analysis showed that two reference genes could meet the requirements of a q-PCR normalization analysis (Figure 3H).
According to the results of the stability evaluation in this study, no reference gene was suitable for all experimental conditions. Under most experimental conditions, ribosomal proteins (RPs) showed good expression stability, for example, RPS15 was the most stably expressed in the total sample, PEG-treated sample and leaves at different developmental stages, and RPL27 showed relatively high stability in the Cold-treated and Nacl-treated samples (Figure 4). As genes encoding ribosomal protein, RPs have an important role in cellular protein biosynthesis, and previous studies also identified RPs as the reference genes, such as RPL19 for potato tissues [52], RPL5 for MeJA, cold and hot stress in Rubia yunnanensis Diels [49] and RPS15 for developmental stages, RPL32 for tissues and temperature stress and RPS3 for insecticide stress and starvation stress in Lymantria dispar [53]. Actin is highly conserved and expressed in almost all eukaryotic cells [54] and is usually used as a reference gene for q-PCR normalization. However, in this study, ACT7 was the proper gene only under specific conditions; just like in Scutellaria baicalensis Georgi, ACT7 showed high stability under hormonal conditions but was not the best choice in other conditions [42], and in Haloxylon ammodendron, ACT7 was stable under salt treatment but poor under other conditions [55]. In addition, we compared the expression levels of AtACT2 (Arabidopsis) with those of ACT7 and the stable reference genes RPL27 and RPS15 (C. burmnnii) under the Nacl-treated samples (Figure S3), showing that the stability of AtACT2 was relatively lower. Based on the previous research, TATA-box, as the first promoter found in eukaryotes, was more suitable for q−PCR analysis in a variety of species, such as in Monomorium pharaonic [1], Gleditsia microphylla [56] and Dendrobium huoshanense [57], but in our study it was not the optimum reference gene for some experimental conditions. In addition, eIF-5A was just the best reference gene in different borneol clones and EF1α was the optimum gene for studying different tissues. Moreover, the common reference gene GAPDH was highly stable in many species [58,59,60], but the stability was not as expected in this study, indicating that the reference gene needed to be re-screeded in different species. All the results suggested the importance of a suitable reference gene for the gene function research, and it was of great significance to evaluate and screen reference genes under certain experimental conditions.
A validation experiment is the prerequisite to evaluate the accuracy and stability of reference genes. Therefore, we examined the expression trends of two terpenoid synthesis-related genes CbWRKY4 and CbDXS2 under different experimental conditions to determine the accuracy of the selected reference genes. The results in Figure 5 showed that the expression patterns of target genes were significantly different after the normalization using the stable reference gene and the unstable reference gene under different experimental conditions. There was little difference in the expression levels when the stable reference genes were normalized alone or in combination, while the least stable reference genes were normalized with greater difference in the expression levels. This phenomenon further revealed that the reliable gene expression analysis depended on the stable reference gene and the necessity of screening reference genes for the accuracy of q-PCR results. This process of reference gene screening under various experiment conditions can provide guidance for researchers to study the genetic breeding of C. burmannii.

4. Materials and Methods

4.1. Plant Materials

C. burmannii was obtained from a nursery managed by the Guangdong Academy of Forestry. Seedlings of 1–2 years were selected for cultivation in an artificial climate chamber (light/dark = 16 h/8 h and relative humidity = 65–75%). To induce different abiotic stress conditions, the seedlings were exposed to various treatments. Seedlings treated with cold were grown at 16 °C, and those treated with 200 mM NaCl and 20% PEG 6000 were grown at 25 °C. Leaves from all abiotically stressed seedlings were collected at 0, 1, 3, 6, 9, 12 and 24 h after treatment. Samples of plant tissues were collected from distinct parts of the plant, encompassing mature leaves, stems and roots. Mature leaves from different borneol clones of C. burmannii (Cb-H, 51.96%; Cb-M, 27.65%; and Cb-L, 0.00%) were collected. Leaves at different developmental stages (Cb-S1, Cb-S2, Cb-S3 and Cb-S4) were collected from the same material, in accordance with our previous research [27]. All the samples were frozen immediately in liquid nitrogen and stored at −80 °C and all the treatments were conducted in triplicate.

4.2. RNA Extraction and cDNA Synthesis

The total RNA was extracted using an RNAprep Pure Plant kit (Polysaccharides and Polyphenolics rich) (Tiangen, Beijing, China). The RNA integrity and purity was determined by 1% agarose gel electrophoresis and OD260/280. cDNA was synthesized using a PrimeScript™ RT reagent Kit with gDNA Eraser (Perfect Real Time) (Takara, Beijing, China) and stored at −20 °C for the subsequent q-PCR analysis.

4.3. Candidate Reference Genes Selection and Primer Design

The candidate reference genes were selected based on our previous transcriptome and other common reference genes information. Primer Premier 5.0 was used to design the primers for q-PCR (Table 1), and the primer design criteria were G + C (40–60%), PCR product (80–300 bp), TM (58–62 °C), and primer length (17–25 bp). The specificity of each primer was verified by 1% agarose gel electrophoresis and melting curve. The amplification efficiency (E) of the candidate genes was calculated using a standard curve (a 5-fold dilution series cDNA was used as the template) by q-PCR. E (%) = (10−1/slope –1) ×100% [61].

4.4. q-PCR Amplification

A q-PCR was performed on CFX ConnectTM real-time systems (Bio-Rad, Singapore) with Biomike fluorescent quantitative SYBR reagent under the following reaction system: Biomarker 2× SYBR Green Fast qPCR MIX (10 μL), Forward Primer (0.4 μL), Reverse Primer (0.4 μL), cDNA (1 μL), and Nuclease-free H2O (8.2 μL). The reaction conditions were as follows: 95 °C for 3 min; 40 cycles: 95 °C for 5 s and 60 °C for 30 s; melting curve: instrument default. Three techniques were repeated for each sample.

4.5. Data Analysis and Validation of Selected Reference Genes

The stability of the candidate reference genes was assessed using different algorithms: ∆Ct [44], BestKeeper [6], geNorm [45], NormFinder [46] and RefFinder [62]. The ∆Ct method calculates the average standard deviation (SD) of all potential reference gene pairings, with the gene displaying the lowest SD considered the most stable. The algorithms of geNorm and NormFinder rely on the transformation of Ct values into 2−∆Ct values. geNorm is utilized for evaluating the stability of reference genes through the calculation of the M value, where a lower M value suggests better stability. Furthermore, geNorm is capable of determining the optimal number of normalization genes. NormFinder evaluates the expression stability of candidate genes by calculating the stability value (SV), where the lower SV of the reference gene indicates greater stability. In contrast to geNorm and NormFinder, the analysis conducted by BestKeeper utilizes the Ct values in order to calculate the standard deviation (SD) and coefficient of variance (CV). A smaller SD value indicates a higher level of stability in the expression of reference genes. The RefFinder is utilized to conduct a comparative analysis of the aforementioned data. The final overall ranking is determined by RefFinder through calculating the geometric mean, which helps identify the optimal reference gene. Finally, two terpenoid synthesis-related genes (CbWRYK4 and CbDXS2) were analyzed to verify the reliability and suitability of the selected reference genes under the above different conditions.

5. Conclusions

In this study, the expression stability of 13 candidate genes under different experimental conditions was evaluated for a standardized q-PCR analysis of C. burmanni. ∆Ct, geNorm, NormFinder and BestKeeper were used to evaluate the gene stability, and the results were further ranked based on the geometric mean to screen out the optimum reference genes in the diverse experimental conditions. The expression stability of RPL27|RPS15 was higher than that of the other genes in the Nacl-treated and PEG-treated samples. RPL27|APT ranked best in the Cold-treated samples and EF1α|ACT7 was the most suitable combination in different tissues. eIF-5A|Gllα was suitable for different borneol clones and RPS15|ACT7 was the optimum in leaves at different developmental stages. In all the samples, RPS15|TATA was the best combination. All the results suggested the importance of selecting appropriate reference genes under specific experimental conditions for q-PCR analysis. This study will contribute to the subsequent research on the genetic molecular mechanism and genetic breeding of C. burmannii.

Supplementary Materials

The following supporting information can be downloaded at: https://www.mdpi.com/article/10.3390/ijms25063500/s1.

Author Contributions

L.S.: investigation, data curation, software, visualization, writing—original draft preparation. Y.C.: investigation, data curation, software, visualization, writing—original draft preparation. J.Y.: investigation, data curation, visualization. Q.Z.: software, visualization. B.H.: visualization, validation. S.L.: software, validation. All authors have read and agreed to the published version of the manuscript.

Funding

This work was supported by the Technology Program from the Forestry Administration of Guangdong Province (NO. 2020KJCX001 to Boxiang HE) and the Technology Program from the Forestry Administration of Guangdong Province (NO. 2022KJCX006 to Qian Zhang).

Institutional Review Board Statement

Not applicable.

Informed Consent Statement

Not applicable.

Data Availability Statement

Data are contained within the article and Supplementary Materials.

Conflicts of Interest

The authors declare no conflicts of interest.

References

  1. Ding, G.; Gao, Q.; Chen, J.; Zhao, J.; Zhang, G.; Liu, W. Validation of Potential Reference Genes for Real-Time qPCR Analysis in Pharaoh Ant, Monomorium pharaonis (Hymenoptera: Formicidae). Front. Physiol. 2022, 13, 852357. [Google Scholar] [CrossRef] [PubMed]
  2. Valifard, M.; Hir, R.L.; Müller, J.; Scheuring, D.; Neuhaus, H.E.; Pommerrenig, B. Vacuolar fructose transporter SWEET17 is critical for root development and drought tolerance. Plant Physiol. 2021, 187, 2716–2730. [Google Scholar] [CrossRef] [PubMed]
  3. Wang, Z.; Mao, Y.; Guo, Y.; Gao, J.; Liu, X.; Li, S.; Lin, Y.; Chen, H.; Wang, J.P.; Chiang, V.L. MYB transcription factor 161 mediates feedback regulation of Secondary wall-associated NAC-Domain 1 family genes for wood formation. Plant Physiol. 2020, 184, 1389–1406. [Google Scholar] [CrossRef] [PubMed]
  4. Gachon, C.; Mingam, A.; Charrier, B. Real-time PCR: What relevance to plant studies? J. Exp. Bot. 2004, 55, 1445–1454. [Google Scholar] [CrossRef] [PubMed]
  5. Udvardi, M.K.; Czechowski, T.; Scheible, W.R. Eleven golden rules of quantitative RT-PCR. Plant Cell 2008, 20, 1736–1737. [Google Scholar] [CrossRef] [PubMed]
  6. Pfaffl, M.W.; Tichopad, A.; Prgomet, C.; Neuvians, T.P. Determination of stable housekeeping genes, differentially regulated target genes and sample integrity: BestKeeper-Excel-Based tool using pair-wise correlations. Biotechnol. Lett. 2004, 26, 509–515. [Google Scholar] [CrossRef]
  7. Zhang, K.; Li, M.; Cao, S.; Sun, Y.; Long, R.; Kang, J.; Yan, L.; Cui, H. Selection and validation of reference genes for target gene analysis with quantitative real-time PCR in the leaves and roots of Carex rigescens under abiotic stress. Ecotoxicol. Environ. Saf. 2019, 168, 127–137. [Google Scholar] [CrossRef]
  8. Wang, S.; Zhang, S. Selection of the Reference Gene for Expression Normalization in Salsola ferganica under Abiotic Stress. Genes 2022, 13, 571. [Google Scholar] [CrossRef]
  9. Li, Z.; Lu, H.; He, Z.; Wang, C.; Wang, Y.; Ji, X. Selection of appropriate reference genes for quantitative real-time reverse transcription PCR in Betula platyphylla under salt and osmotic stress conditions. PLoS ONE 2019, 14, e0225926. [Google Scholar] [CrossRef]
  10. Belén, F.; Germán, L.; Lorenzo, L.; Raúl, C. Selection and optimization of reference genes for RT-qPCR normalization: A case study in Solanum lycopersicum exposed to UV-B. Plant Physiol. Biochem. 2021, 160, 269–280. [Google Scholar]
  11. Mo, Z.; Chen, Y.; Lou, W.; Jia, X.; Zhai, M.; Xuan, J.; Guo, Z.; Li, Y. Identification of suitable reference genes for normalization of real-time quantitative PCR data in pecan (Carya illinoinensis). Trees 2020, 34, 1233–1241. [Google Scholar] [CrossRef]
  12. Liu, X.; Liu, S.; Zhang, J.; Wu, Y.; Jia, X. Optimization of reference genes for qRT-PCR analysis of microRNA expression under abiotic stress conditions in sweetpotato. Plant Physiol. Biochem. 2020, 154, 379–386. [Google Scholar] [CrossRef]
  13. Jun, N.; Baoqing, Z.; Jian, C.; Peixue, L.; Libing, W.; Huitang, D.; Lin, Q.; Haiyan, Y.; Denglong, H.; Haiyan, Z. Selection of Reference Genes for Gene Expression Studies in Siberian Apricot (Prunus sibirica L.) Germplasm Using Quantitative Real-Time PCR. PLoS ONE 2014, 9, e103900. [Google Scholar]
  14. Palakolanu, S.R.; Dumbala, S.R.; Kaliamoorthy, S.; Pooja, B.M.; Vincent, V.; Sharma, K.K. Evaluation of Sorghum [Sorghum bicolor (L.)] Reference Genes in Various Tissues and under Abiotic Stress Conditions for Quantitative Real-Time PCR Data Normalization. Front. Plant Sci. 2016, 7, 529. [Google Scholar]
  15. Wang, J.J.; Han, S.; Yin, W.; Xia, X.; Liu, C. Comparison of Reliable Reference Genes Following Different Hormone Treatments by Various Algorithms for qRT-PCR Analysis of Metasequoia. Int. J. Mol. Sci. 2019, 20, 34. [Google Scholar] [CrossRef]
  16. Wu, Y.; Zhang, C.; Yang, H.; Lyu, L.; Li, W.; Wu, W. Selection and Validation of Candidate Reference Genes for Gene Expression Analysis by RT-qPCR inRubus. Int. J. Mol. Sci. 2021, 22, 10533. [Google Scholar] [CrossRef]
  17. Yang, Z.; Zhang, R.; Zhou, Z. Identification and Validation of Reference Genes for Gene Expression Analysis in Schima superba. Genes 2021, 12, 732. [Google Scholar] [CrossRef]
  18. Yao, J.; Zhu, G.; Liang, D.; He, B.; Wang, Y.; Cai, Y.; Zhang, Q. Reference Gene Selection for qPCR Analysis in Schima superba under Abiotic Stress. Genes 2022, 13, 1887. [Google Scholar] [CrossRef]
  19. Al-Dhubiab, B.E. Pharmaceutical applications and phytochemical profile of Cinnamomum burmannii. Pharmacogn. Rev. 2012, 6, 125–131. [Google Scholar] [CrossRef]
  20. Muhammad, D.; Lemarcq, V.; Alderweireldt, E.; Vanoverberghe, P.; Dewettinck, K. Antioxidant activity and quality attributes of white chocolate incorporated with Cinnamomum burmannii Blume essential oil. J. Food Sci. Technol. 2019, 57, 1731–1739. [Google Scholar] [CrossRef]
  21. Muhammad, D.R.A.; Tuenter, E.; Patria, G.D.; Foubert, K.; Pieters, L.; Dewettinck, K. Phytochemical composition and antioxidant activity of Cinnamomum burmannii Blume extracts and their potential application in white chocolate. Food Chem. 2021, 340, 127983. [Google Scholar] [CrossRef]
  22. Shan, B.; Cai, Y.; Brooks, J.; Corke, H. Antibacterial properties and major bioactive components of cinnamon stick (Cinnamomum burmannii): Activity against foodborne pathogenic bacteria. J. Agric. Food Chem. 2007, 55, 5484–5490. [Google Scholar] [CrossRef]
  23. Chen, L.; Su, J.; Li, L.; Li, B.; Li, W. A new source of natural D-borneol and its characteristic. J. Med. Plant Res. 2010, 5, 7. [Google Scholar]
  24. Ji, X.D.; Pu, Q.L.; Garraffo, H.M.; Pannell, L.K. Essential Oils of the Leaf, Bark and Branch of Cinnamomum buramannii Blume. J. Essent. Oil Res. 1991, 3, 373–375. [Google Scholar] [CrossRef]
  25. Liu, Z.; Li, H.; Cui, G.; Wei, M.; Ni, H. Efficient extraction of essential oil from Cinnamomum burmannii leaves using enzymolysis pretreatment and followed by microwave-assisted method. LWT- Food Sci. Technol. 2021, 147, 111497. [Google Scholar] [CrossRef]
  26. Wang, R. Extraction of essential oils from five cinnamon leaves and identification of their volatile compound compositions. Innov. Food Sci. Emerg. Technol. 2009, 10, 289–292. [Google Scholar] [CrossRef]
  27. Hou, C.; Zhang, Q.; Xie, P.; Lian, H.; Wang, Y.; Liang, D.; Cai, Y.; He, B. Full-length transcriptome sequencing reveals the molecular mechanism of monoterpene and sesquiterpene biosynthesis in Cinnamomum burmannii. Front. Genet. 2022, 13, 1087495. [Google Scholar] [CrossRef] [PubMed]
  28. Ma, Q.; Ma, R.; Su, P.; Jin, B.; Guo, J.; Tang, J.; Chen, T.; Zeng, W.; Lai, C.; Ling, F. Elucidation of the essential oil biosynthetic pathways in Cinnamomum burmannii through identification of six terpene synthases. Plant Sci. Int. J. Exp. Plant Biol. 2022, 317, 111203. [Google Scholar] [CrossRef] [PubMed]
  29. Yang, Z.; An, W.; Liu, S.; Huang, Y.; Zheng, X. Mining of candidate genes involved in the biosynthesis of dextrorotatory borneol in Cinnamomum burmannii by transcriptomic analysis on three chemotypes. PeerJ 2020, 8, e9311. [Google Scholar] [CrossRef]
  30. Derveaux, S.; Vandesompele, J.; Hellemans, J. How to do successful gene expression analysis using real-time PCR. Methods A Companion Methods Enzymol. 2010, 50, 227–230. [Google Scholar] [CrossRef]
  31. Huggett, J.; Dheda, K.; Bustin, S.; Zumla, A. Real-time RT-PCR normalisation; strategies and considerations. Genes Immun. 2005, 6, 279–284. [Google Scholar] [CrossRef]
  32. Pan, X.; Li, Y.; Pan, G.; Yang, A. Bioinformatics study of 1-deoxy-D-xylulose-5-phosphate synthase (DXS) genes in Solanaceae. Mol. Biol. Rep. 2019, 46, 5175–5184. [Google Scholar] [CrossRef] [PubMed]
  33. Ren, L.; Wan, W.; Yin, D.; Deng, X.; Ma, Z.; Gao, T.; Cao, X. Genome-wide analysis of WRKY transcription factor genes in Toona sinensis: An insight into evolutionary characteristics and terpene synthesis. Front. Plant Sci. 2022, 13, 1063850. [Google Scholar] [CrossRef] [PubMed]
  34. Muhlemann, J.K.; Klempien, A.; Dudareva, N. Floral volatiles: From biosynthesis to function. Plant Cell Environ. 2014, 37, 1936–1949. [Google Scholar] [CrossRef] [PubMed]
  35. Zhao, Y.; Yang, J.; Qin, B.; Li, Y.; Sun, Y.; Su, S.; Xian, M. Biosynthesis of isoprene in Escherichia coli via methylerythritol phosphate (MEP) pathway. Appl. Microbiol. Biotechnol. 2011, 90, 1915. [Google Scholar] [CrossRef] [PubMed]
  36. Xu, Y.H.; Wang, J.W.; Wang, S.; Chen, W.X.Y. Characterization of GaWRKY1, a Cotton Transcription Factor That Regulates the Sesquiterpene Synthase Gene (+)-δ-Cadinene Synthase. Plant Physiol. 2004, 135, 507–515. [Google Scholar] [CrossRef]
  37. Ma, D.; Pu, G.; Lei, C.; Ma, L.; Wang, H.; Guo, Y.; Chen, J.; Du, Z.; Wang, H.; Li, G. Isolation and Characterization of AaWRKY1, an Artemisia annua Transcription Factor that Regulates the Amorpha-4,11-diene Synthase Gene, a Key Gene of Artemisinin Biosynthesis. Plant Cell Physiol. 2009, 50, 2146–2161. [Google Scholar] [CrossRef]
  38. Ye, M.; Gao, R.; Chen, S.; Wei, M.; Wang, J.; Zhang, B.; Wu, S.; Xu, Y.; Wu, P.; Chen, X.; et al. Downregulation of MEG3 and upregulation of EZH2 cooperatively promote neuroblastoma progression. J. Cell. Mol. Med. 2022, 26, 2377–2391. [Google Scholar] [CrossRef] [PubMed]
  39. Taylor, S.C.; Nadeau, K.; Abbasi, M.; Lachance, C.; Nguyen, M.; Fenrich, J. The Ultimate qPCR Experiment: Producing Publication Quality, Reproducible Data the First Time. Trends Biotechnol. 2019, 37, 761–774. [Google Scholar] [CrossRef]
  40. Kozera, B.; Rapacz, M. Reference genes in real-time PCR. J. Appl. Genet. 2013, 54, 391–406. [Google Scholar] [CrossRef]
  41. Liu, H.; Lu, Y.; Wang, X.; Wang, X.; Li, R.; Lu, C.; Lan, X.; Chen, Y. Selection and Validation of Reference Genes for RT-qPCR Analysis in Tibetan Medicinal Plant Saussurea Laniceps Callus under Abiotic Stresses and Hormone Treatments. Genes 2022, 13, 904. [Google Scholar] [CrossRef] [PubMed]
  42. Wang, W.; Hu, S.; Cao, Y.; Chen, R.; Wang, Z.; Cao, X. Selection and evaluation of reference genes for qRT-PCR of Scutellaria baicalensis Georgi under different experimental conditions. Mol. Biol. Rep. 2021, 48, 1115–1126. [Google Scholar] [CrossRef] [PubMed]
  43. Song, H.; Mao, W.; Duan, Z.; Que, Q.; Li, P. Selection and validation of reference genes for measuring gene expression in Toona ciliata under different experimental conditions by quantitative real-time PCR analysis. BMC Plant Biol. 2020, 20, 450. [Google Scholar] [CrossRef] [PubMed]
  44. Silver, N.; Best, S.; Jiang, J.; Thein, S. Selection of housekeeping genes for gene expression studies in human reticulocytes using real-time PCR. BMC Mol. Biol. 2006, 7, 33. [Google Scholar] [CrossRef]
  45. Vandesompele, J.; Preter, K.D.; Pattyn, F.; Poppe, B.; Roy, N.V.; Paepe, A.D.; Speleman, F. Accurate normalization of real-time quantitative RT-PCR data by geometric averaging of multiple internal control genes. Genome Biol. 2002, 3, research0034.1. [Google Scholar] [CrossRef]
  46. Andersen, C.L.; Jensen, J.L.; Rntoft, T.F. Normalization of Real-Time Quantitative Reverse Transcription-PCR Data: A Model-Based Variance Estimation Approach to Identify Genes Suited for Normalization, Applied to Bladder and Colon Cancer Data Sets. Am. Assoc. Cancer Res. 2004, 64, 5245–5250. [Google Scholar] [CrossRef]
  47. Ward, D.S.; Jutta, D.W.; Roswitha, W.; Valérie, S.; Hubert, S.; Daniel, N.; Martin, B.; Ralph, B.; Sabine, K.; Linos, V. Reference Gene Validation for RT-qPCR, a Note on Different Available Software Packages. PLoS ONE 2015, 10, e0122515. [Google Scholar]
  48. Chen, M.; Wang, B.; Li, Y.; Zeng, M.; Wen, Q. Reference Gene Selection for qRT-PCR Analyses of Luffa (Luffa cylindrica) Plants Under Abiotic Stress Conditions. Sci. Rep. 2021, 11, 3161. [Google Scholar] [CrossRef] [PubMed]
  49. Yi, S.; Lin, Q.; Zhang, X.; Wang, J.; Miao, Y.; Tan, N. Selection and Validation of Appropriate Reference Genes for Quantitative RT-PCR Analysis in Rubia yunnanensis Diels Based on Transcriptome Data. Biomed. Res. Int. 2020, 2020, 5824841. [Google Scholar] [CrossRef]
  50. Nicot, N.; Hausman, J.-F.; Hoffmann, L.; Evers, D. Housekeeping gene selection for real-time RT-PCR normalization in potato during biotic and abiotic stress. J. Exp. Bot. 2005, 56, 2907–2914. [Google Scholar] [CrossRef] [PubMed]
  51. Chao, J.; Yang, S.; Chen, Y.; Tian, W. Evaluation of Reference Genes for Quantitative Real-Time PCR Analysis of the Gene Expression in Laticifers on the Basis of Latex Flow in Rubber Tree (Hevea brasiliensis Muell. Arg.). Front. Plant Sci. 2016, 7, 1149. [Google Scholar] [CrossRef]
  52. Li, G.; Zhou, Y.; Zhao, Y.; Liu, Y.; Ma, H. Internal Reference Gene Selection for Quantitative Real-Time RT-PCR Normalization in Potato Tissues. Phyton 2020, 89, 329–344. [Google Scholar] [CrossRef]
  53. Yin, J.; Sun, L.; Zhang, Q.; Cao, C. Screening and evaluation of the stability of expression of reference genes in Lymantria dispar (Lepidoptera: Erebidae) using qRT-PCR. Gene 2020, 749, 144712. [Google Scholar] [CrossRef]
  54. Hunter, T.; Garrels, J.I. Characterization of the mRNAs for alpha-, beta- and gamma-actin. Cell 1977, 12, 767–781. [Google Scholar] [CrossRef]
  55. Wang, B.; Du, H.; Yao, Z.; Ren, C.; Ma, L.; Wang, J.; Zhang, H.; Ma, H. Validation of reference genes for accurate normalization of gene expression with quantitative real-time PCR in Haloxylon ammodendron under different abiotic stresses. Physiol. Mol. Biol. Plants 2018, 24, 455. [Google Scholar] [CrossRef] [PubMed]
  56. Yang, J.; Han, F.; Yang, L.; Wang, J.; Jin, F.; Luo, A.; Zhao, F. Identification of Reference Genes for RT-qPCR Analysis in Gleditsia microphylla under Abiotic Stress and Hormone Treatment. Genes 2022, 13, 1227. [Google Scholar] [CrossRef]
  57. Yi, S.; Lu, H.; Tian, C.; Xu, T.; Song, C.; Wang, W.; Wei, P.; Gu, F.; Liu, D.; Cai, Y.; et al. Selection of Suitable Reference Genes for Gene Expression Normalization Studies in Dendrobium huoshanense. Genes 2022, 13, 1486. [Google Scholar] [CrossRef] [PubMed]
  58. Chen, X.; Mao, Y.; Huang, S.; Ni, J.; Lu, W.; Hou, J.; Wang, Y.; Zhao, W.; Li, M.; Wang, Q.; et al. Selection of Suitable Reference Genes for Quantitative Real-time PCR in Sapium sebiferum. Front. Plant Sci. 2017, 8, 637. [Google Scholar] [CrossRef]
  59. Li, M.; Li, X.; Wang, C.; Li, Q.; Zhu, S.; Zhang, Y.; Li, X.; Yang, F.; Zhu, X. Selection and Validation of Reference Genes for qRT-PCR Analysis of Rhopalosiphum padi (Hemiptera: Aphididae). Front. Physiol. 2021, 12, 663338. [Google Scholar] [CrossRef] [PubMed]
  60. Yulia, P.; Arno, G.; Shinji, M.; Watanabe, T.M. Validation of Common Housekeeping Genes as Reference for qPCR Gene Expression Analysis during iPS Reprogramming Process. Sci. Rep. 2018, 8, 8716. [Google Scholar]
  61. Radoni, A.; Thulke, S.; Mackay, I.M.; Landt, O.; Siegert, W.; Nitsche, A. Guideline to reference gene selection for quantitative real-time PCR. Biochem. Biophys. Res. Commun. 2004, 313, 856–862. [Google Scholar] [CrossRef] [PubMed]
  62. Xie, F.; Xiao, P.; Chen, D.; Xu, L.; Zhang, B. miRDeepFinder: A miRNA analysis tool for deep sequencing of plant small RNAs. Plant Mol. Biol. 2012, 80, 75–84. [Google Scholar] [CrossRef] [PubMed]
Figure 1. The Ct values of the candidate reference genes in all the materials. The boxes indicate the 25th and 75th percentiles in all the samples. The square represents the median. The * represents the maximum and minimum values.
Ijms 25 03500 g001
Figure 2. Heat map of expression levels of reference genes in all samples.
Ijms 25 03500 g002
Figure 3. Gene stability values of reference genes and determination of the optimum number of reference genes for q-PCR based on geNorm in different experiment conditions. (A): Cold-treated samples; (B): PEG-treated samples; (C): Nacl-treated samples; (D): different tissues; (E): leaves at different developmental stages; (F): different borneol clones; (G): total samples; and (H): the pairwise variation (Vn/n + 1) was analyzed between the normalization factors to determine the optimal number of reference genes for q-PCR normalization by geNorm.
Ijms 25 03500 g003
Figure 4. Comprehensive stability analysis of reference genes based on RefFinder in different experiment conditions.
Ijms 25 03500 g004
Figure 5. Normalization of relative expression levels of CbWRKY4 and CbDXS2 using the identified reference gene. (A): CbDXS2 for leaves at different developmental stages; (B): CbWRKY4 for leaves at different developmental stages; (C): CbDXS2 for tissues; (D): CbWRKY4 for tissues; (E): CbDXS2 for different borneol clones; (F): CbWRKY4 for different borneol clones; (G): CbDXS2 for Cold-treated samples; (H): CbWRKY4 for Cold-treated samples; (I): CbDXS2 for PEG-treated samples; (J): CbWRKY4 for PEG-treated samples; (K): CbDXS2 for Nacl-treated samples; and (L): CbWRKY4 for Nacl-treated samples. a, b, c, d, e and f indicate significant differences at p < 0.05.
Ijms 25 03500 g005
Table 1. Primer sequences and PCR amplification characteristics of 13 reference genes.
Gene-IDGene
Abbreviation
Tentative AnnotationPrimer Sequence of ForwardPrimer Sequence of RewardAmplicon Length (bp)Tm (°C)ER2
Cbur01G028330ACT7actin7CAACCCAAAAGCCAACAGGTCACCCGAGTCCAGAACAATAC14158.7/59.198.76%0.9968
Cbur02G019900Cpn60βchaperonin 60 subunit beta 2CAACAAGGATGGGCTGGCTATTGGCCACAGTCACTCCATC15660/6098.05%0.9979
Cbur01G001170EF1αelongation factor 1-alphaGGTACAAGGGCCCAACTCTCCTGGAGAGCTTCATGGTGCA23660/6089.99%0.9983
Cbur05G032970eIF-5Aeukaryotic translation initiation factor 5ACCAAGTGTCACTTTGTGGCGAGTGGGGAGCCTCAGATCAT19160/6086.05%0.9993
Cbur10G024220GAPDHglyceraldehyde-3-phosphate dehydrogenaseAAGGGTGGTGCCAAGAAAGTGTTGCAGTGATGGAGTGGACAG21558.6/60.292.81%0.9917
Cbur06G016220GIIαglucan 1,3-alpha-glucosidaseCCTTATCGCCTTTTCAACCTTAGCGTATCAATCCGCCCTC22158.3/59.990.63%0.9983
Cbur08G011150HIShistone superfamily protein H3GGAGGGAAGGCTCCTAGGAACAACTGTTCCAGGGCGGTAT10660/6096.01%0.9985
Cbur10G000690RArubisco activaseACAGACCGACAAGGACAAATGGCGGAGACCCGTGCTCAAGTAT16861.3/61.679.95%0.9926
Cbur10G003920RPL27ribosomal protein L27GCCGTCATCGTACGATCCTTTGCCGTCTTCTTTGCAGAGT12360.0/59.998.39%0.9969
Cbur07G013210RPS15ribosomal protein S15GCAGCCGAAGAGGAGAACAGGCTTCCGCTTCAAACCAC14458.4//60.492.04%0.9972
Cbur04G009020TATATATA-box-binding proteinCCGTAATGCAGAGTATAACCCCTTTGACATCACAAGAGCCCAC14660.1/59.582.13%0.9989
Cbur08G006150TUBtubulin β chainTGGGAATAACTGGGCTAAGGGAAGCATCATCCGATCAGGGTA20560.9/59.595.11%0.9964
Cbur02G028660APTadenine phosphoribosy ltransferase 1TGCTTGATCCCGAGGCATTTACTTCGAACCAAGGGCCAAA14160.1/6089.03%0.9993
Table 2. Stability evaluation of 13 reference genes analyzed using ∆Ct.
TotalCold-treatedNacl-treatedPEG-treatedTissuesLeaves at Different Developmental
Stages
Different
Borneol
Clones
GenemSDGenemSDGenemSDGenemSDGenemSDGenemSDGenemSD
ACT71.21ACT70.51ACT70.87ACT70.62ACT71.30ACT70.94ACT71.56
APT1.29APT0.49APT1.14APT0.64APT1.93APT1.14APT1.22
Cpn60β1.61Cpn60β0.63Cpn60β1.37Cpn60β1.09Cpn60β1.81Cpn60β1.43Cpn60β2.72
EF1α1.22EF1α0.63EF1α1.41EF1α0.49EF1α1.29EF1α1.10EF1α1.10
eIF-5A1.10eIF-5A0.58eIF-5A0.95eIF-5A0.55eIF-5A1.52eIF-5A1.32eIF-5A0.94
GAPDH1.37GAPDH0.49GAPDH1.24GAPDH0.68GAPDH1.67GAPDH1.67GAPDH1.69
Gllα1.13Gllα0.62Gllα0.90Gllα0.75Gllα1.91Gllα0.94Gllα0.93
HIS1.31HIS0.66HIS1.14HIS0.81HIS1.73HIS1.14HIS1.01
RA3.01RA0.71RA1.61RA0.98RA6.61RA3.17RA1.26
RPL271.05RPL270.43RP L270.85RP L270.48RP L271.32RPL270.93RPL271.30
RPS150.98RPS150.46RPS150.83RPS150.47RPS151.36RPS150.93RPS150.90
TATA1.04TATA0.57TATA0.92TATA0.49TATA1.31TATA0.95TATA1.11
TUB1.34TUB0.89TUB0.97TUB0.51TUB2.03TUB2.16TUB1.05
Table 3. Stability evaluation of 13 reference genes based on NormFinder.
TotalCold-treatedNacl-treatedPEG-treatedTissuesLeaves at Different Developmental StagesDifferent
Borneol
Clones
GeneSVGeneSVGeneSVGeneSVGeneSVGeneSVGeneSV
ACT70.811ACT70.285ACT70.438ACT70.401ACT70.058ACT70.063ACT71.482
APT0.877APT0.247APT0.934APT0.448APT1.380APT0.547APT1.007
Cpn60β1.314Cpn60β0.506Cpn60β1.114Cpn60β1.005Cpn60β1.445Cpn60β1.034Cpn60β2.660
EF1α0.745EF1α0.476EF1α1.311EF1α0.102EF1α0.058EF1α0.439EF1α0.499
eIF-5A0.436eIF-5A0.427eIF-5A0.559eIF-5A0.308eIF-5A0.208eIF-5A0.834eIF-5A0.128
GAPDH0.995GAPDH0.255GAPDH1.082GAPDH0.521GAPDH1.205GAPDH1.448GAPDH1.440
Gllα0.564Gllα0.473Gllα0.429Gllα0.603Gllα1.390Gllα0.131Gllα0.138
HIS0.834HIS0.545HIS0.899HIS0.673HIS0.948HIS0.617HIS0.542
RA2.918RA0.593RA1.499RA0.887RA6.568RA3.132RA0.760
RPL270.467RPL270.115RPL270.328RPL270.114RPL270.126RPL270.131RPL271.134
RPS150.210RPS150.171RPS150.340RPS150.082RPS150.099RPS150.063RPS150.153
TATA0.344TATA0.378TATA0.570TATA0.107TATA0.099TATA0.119TATA0.700
TUB0.969TUB0.803TUB0.601TUB0.194TUB1.644TUB2.086TUB0.426
Table 4. Stability analysis of 13 reference genes based on BestKeeper.
TotalCold-treatedNacl-treatedPEG-treatedTissuesLeaves at Different Developmental StagesDifferent
Borneol
Clones
GeneSD
[±CP]
GeneSD
[±CP]
GeneSD
[±CP]
GeneSD
[±CP]
GeneSD
[±CP]
GeneSD
[±CP]
GeneSD
[±CP]
ACT70.56ACT70.58ACT70.52ACT70.58ACT70.19ACT70.79ACT70.53
APT0.73APT0.27APT1.13APT0.54APT0.85APT0.60APT0.32
Cpn60β1.00Cpn60β0.56Cpn60β0.83Cpn60β0.38Cpn60β0.61Cpn60β1.43Cpn60β2.37
EF1α0.78EF1α0.36EF1α1.28EF1α0.38EF1α0.26EF1α1.03EF1α0.96
eIF-5A0.64eIF-5A0.42eIF-5A0.66eIF-5A0.40eIF-5A0.83eIF-5A0.46eIF-5A0.63
GAPDH0.96GAPDH0.37GAPDH1.21GAPDH0.57GAPDH0.32GAPDH1.80GAPDH1.45
Gllα0.76Gllα0.67Gllα0.75Gllα0.59Gllα1.04Gllα1.09Gllα0.62
HIS1.09HIS0.74HIS1.21HIS0.71HIS0.79HIS1.38HIS0.10
RA1.87RA0.53RA0.68RA0.80RA4.74RA1.20RA0.89
RPL270.47RPL270.35RPL270.44RPL270.35RPL270.53RPL271.01RPL270.43
RPS150.53RPS150.55RPS150.45RPS150.36RPS150.56RPS150.87RPS150.41
TATA0.57TATA0.48TATA0.38TATA0.43TATA0.52TATA0.79TATA0.26
TUB0.83TUB0.55TUB0.65TUB0.37TUB1.05TUB2.38TUB0.80
Disclaimer/Publisher’s Note: The statements, opinions and data contained in all publications are solely those of the individual author(s) and contributor(s) and not of MDPI and/or the editor(s). MDPI and/or the editor(s) disclaim responsibility for any injury to people or property resulting from any ideas, methods, instructions or products referred to in the content.

