

Molecular Basis for the Involvement of Mammalian Serum Albumin in the AGE/RAGE Axis: A Comprehensive Computational Study
Abstract
1. Introduction
- (1)
- to perform multiple macromolecular docking between gHSA and RAGE;
- (2)
- to study the conformational characteristics of the complexes using molecular dynamics (MD) simulation;
- (3)
- to determine the most likely binding sites on the surface of gHSA;
- (4)
- to construct presumptive structures of gHSA–RAGE dimers;
- (5)
- to perform a detailed comparative analysis of the primary sequences of albumin from different species in order to determine whether there are interspecific differences in the molecular characteristics of albumin that determine its interaction with RAGE.
2. Results
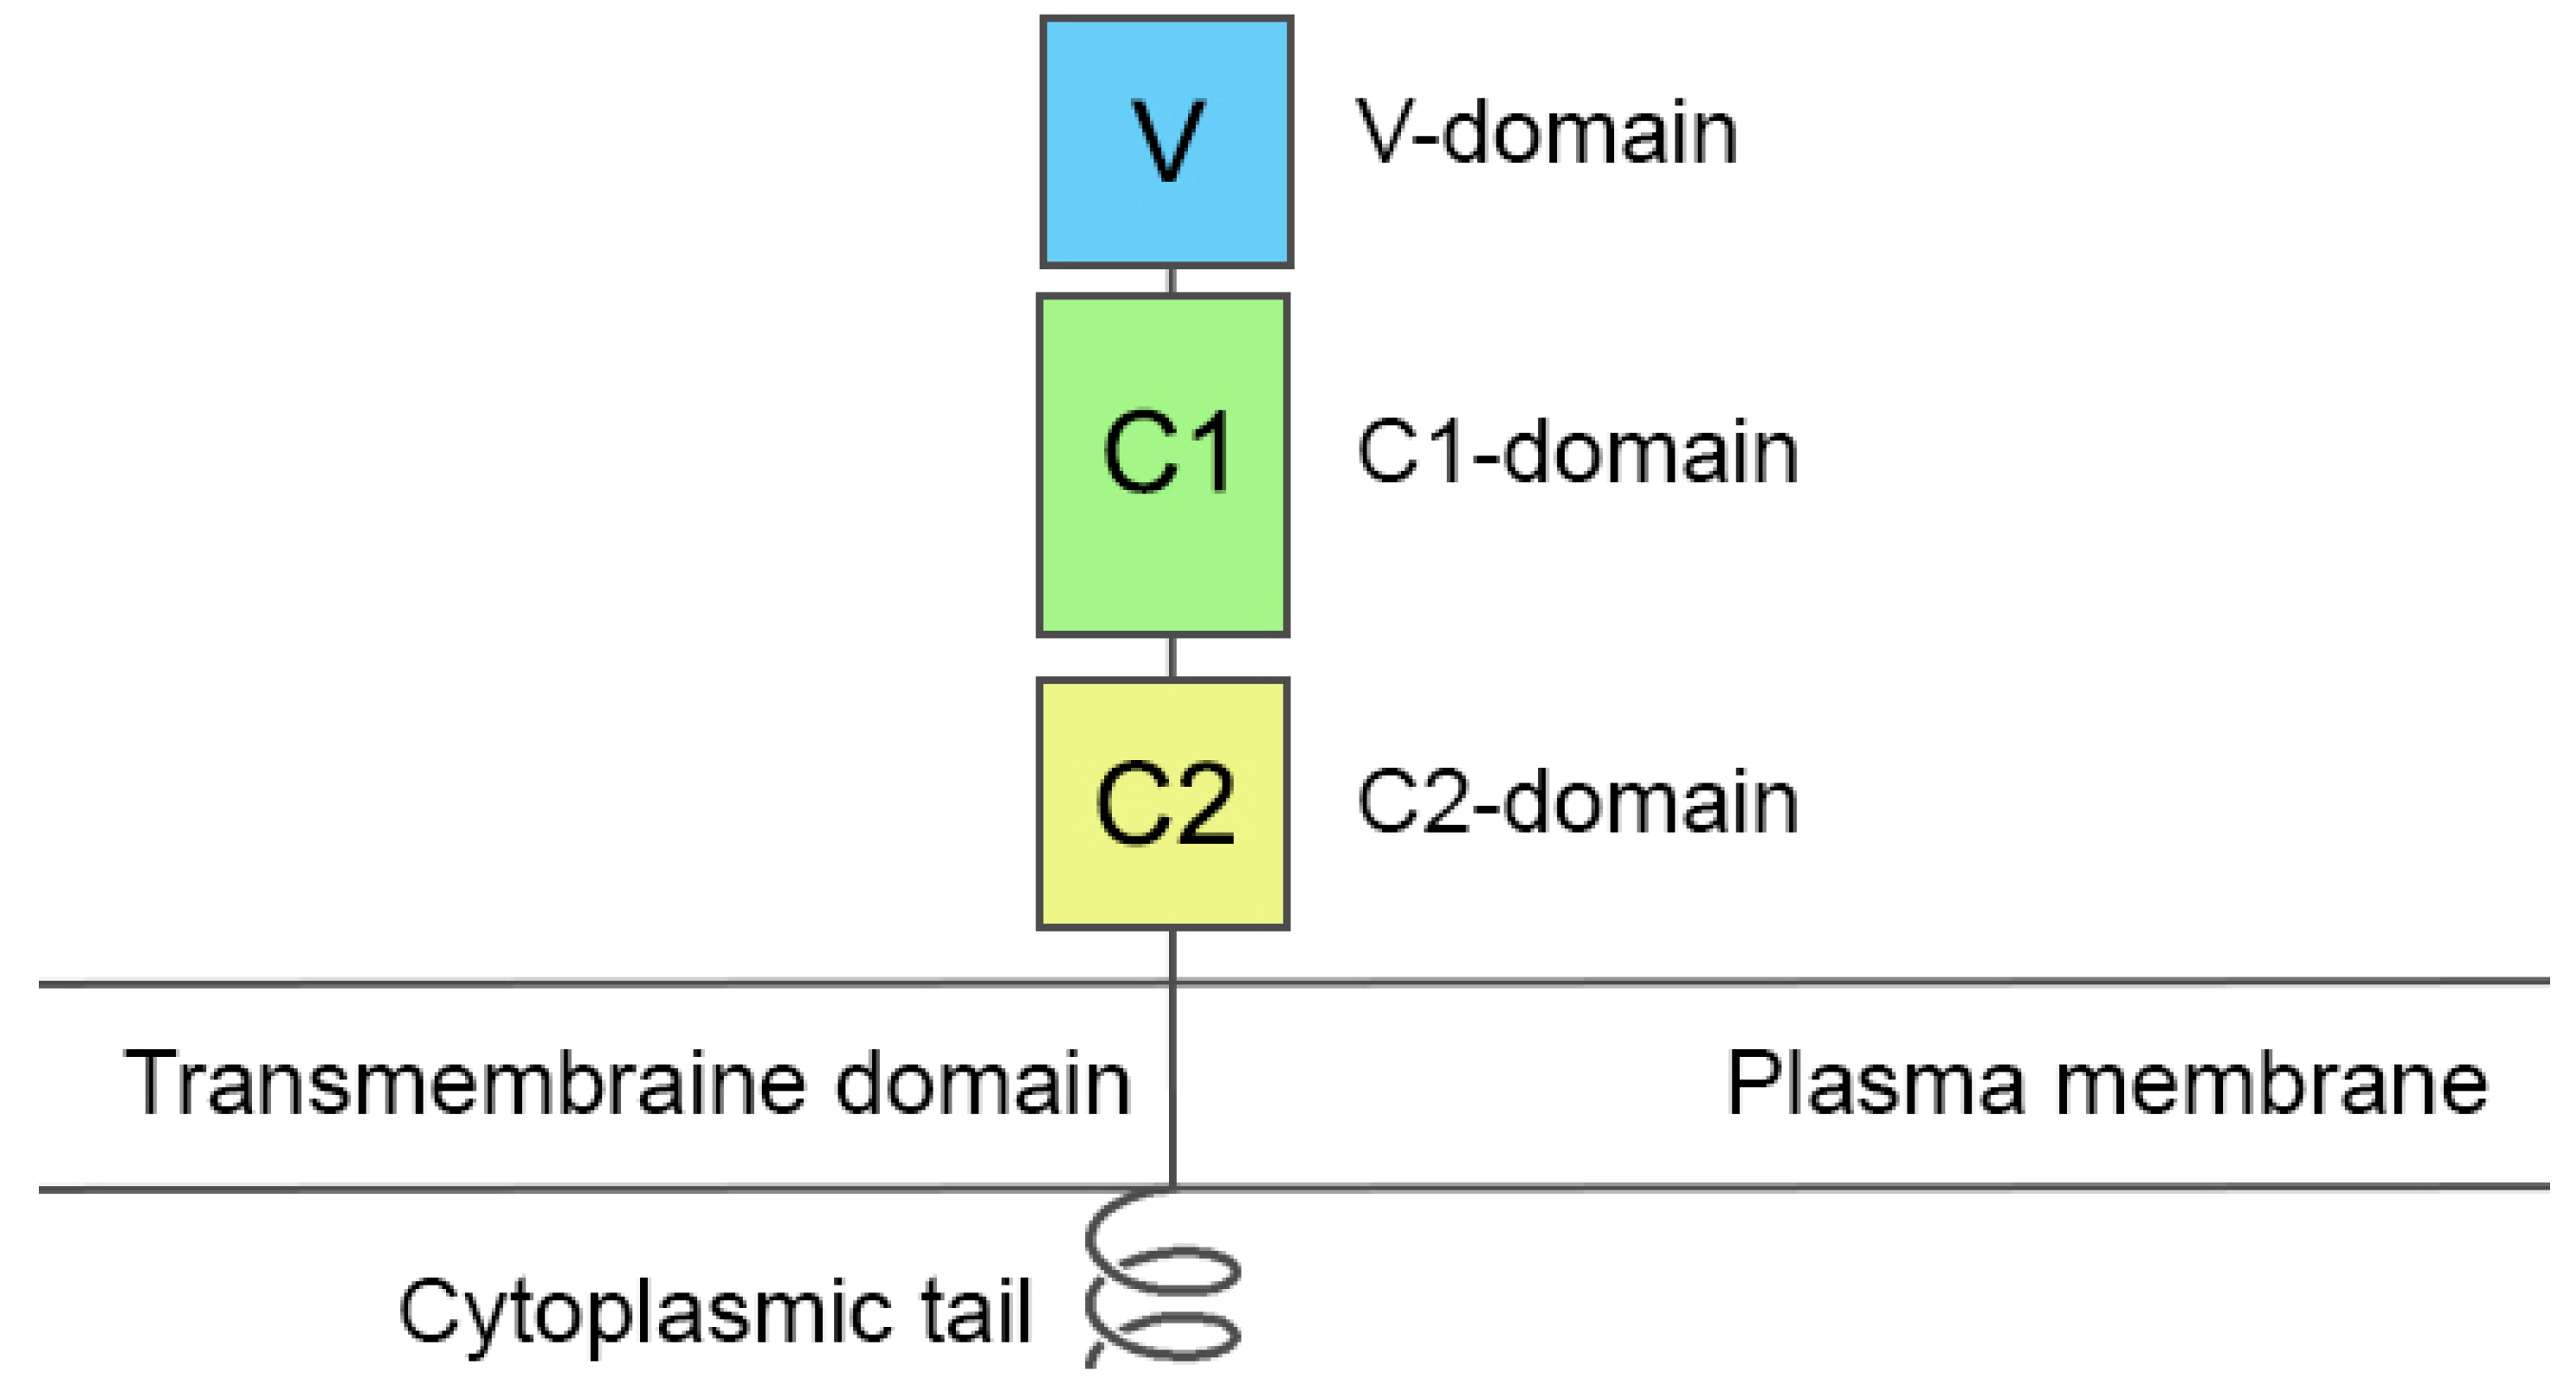
2.1. Choosing a Model of RAGE
2.2. Building Glycated Albumin Models
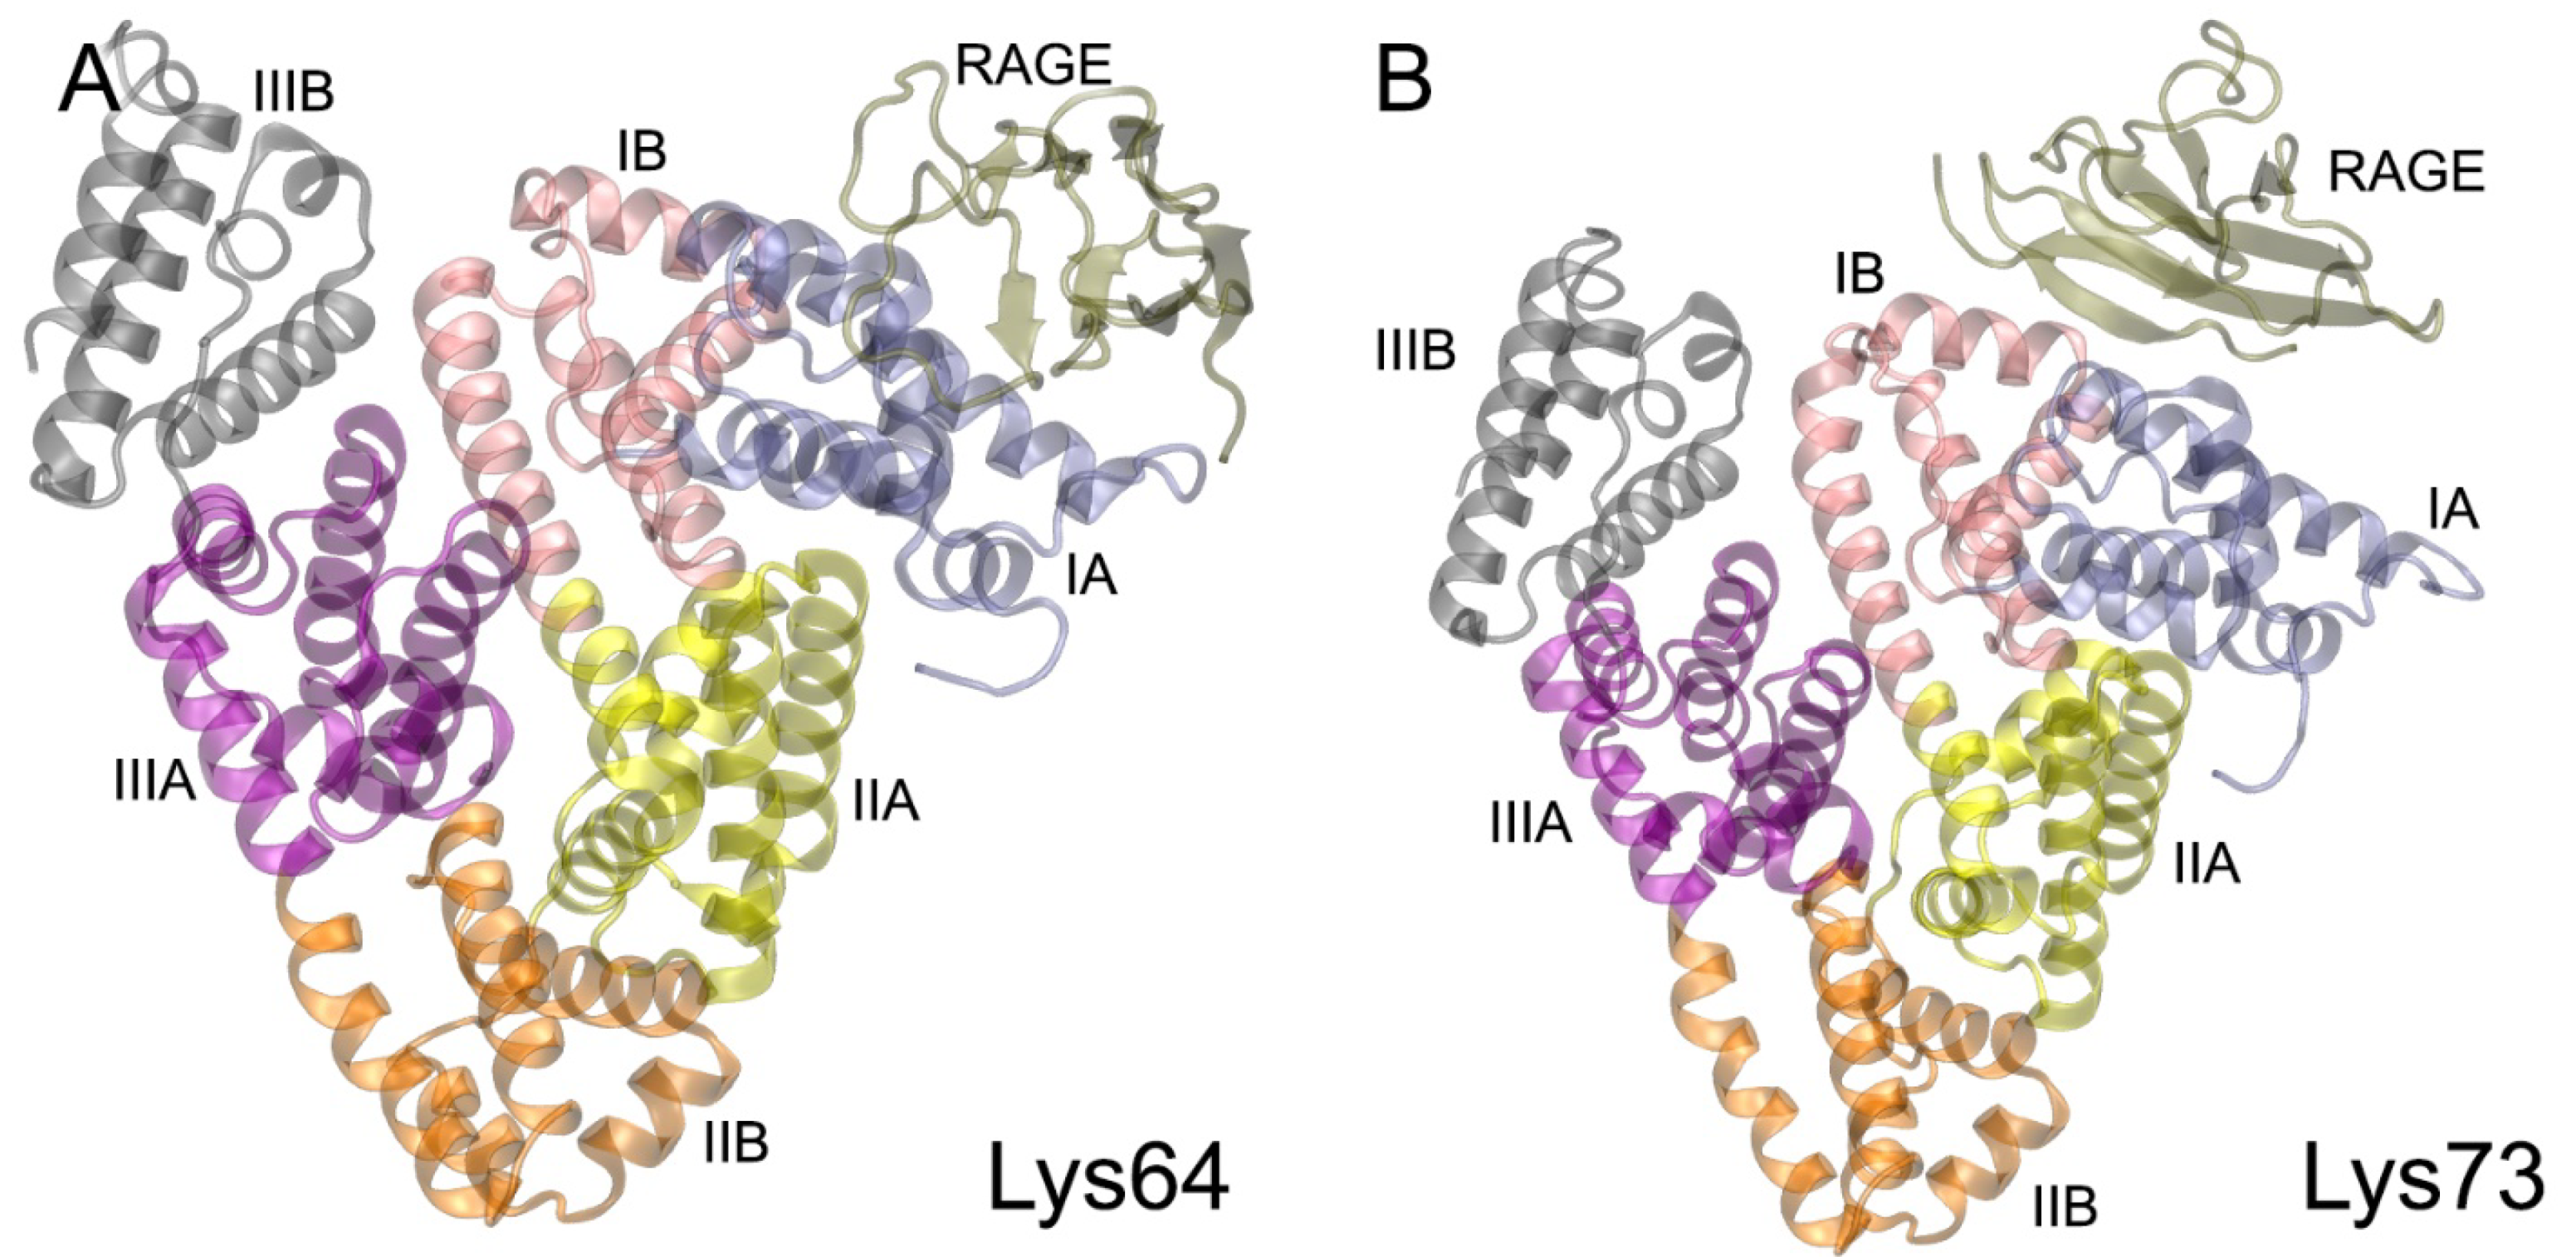
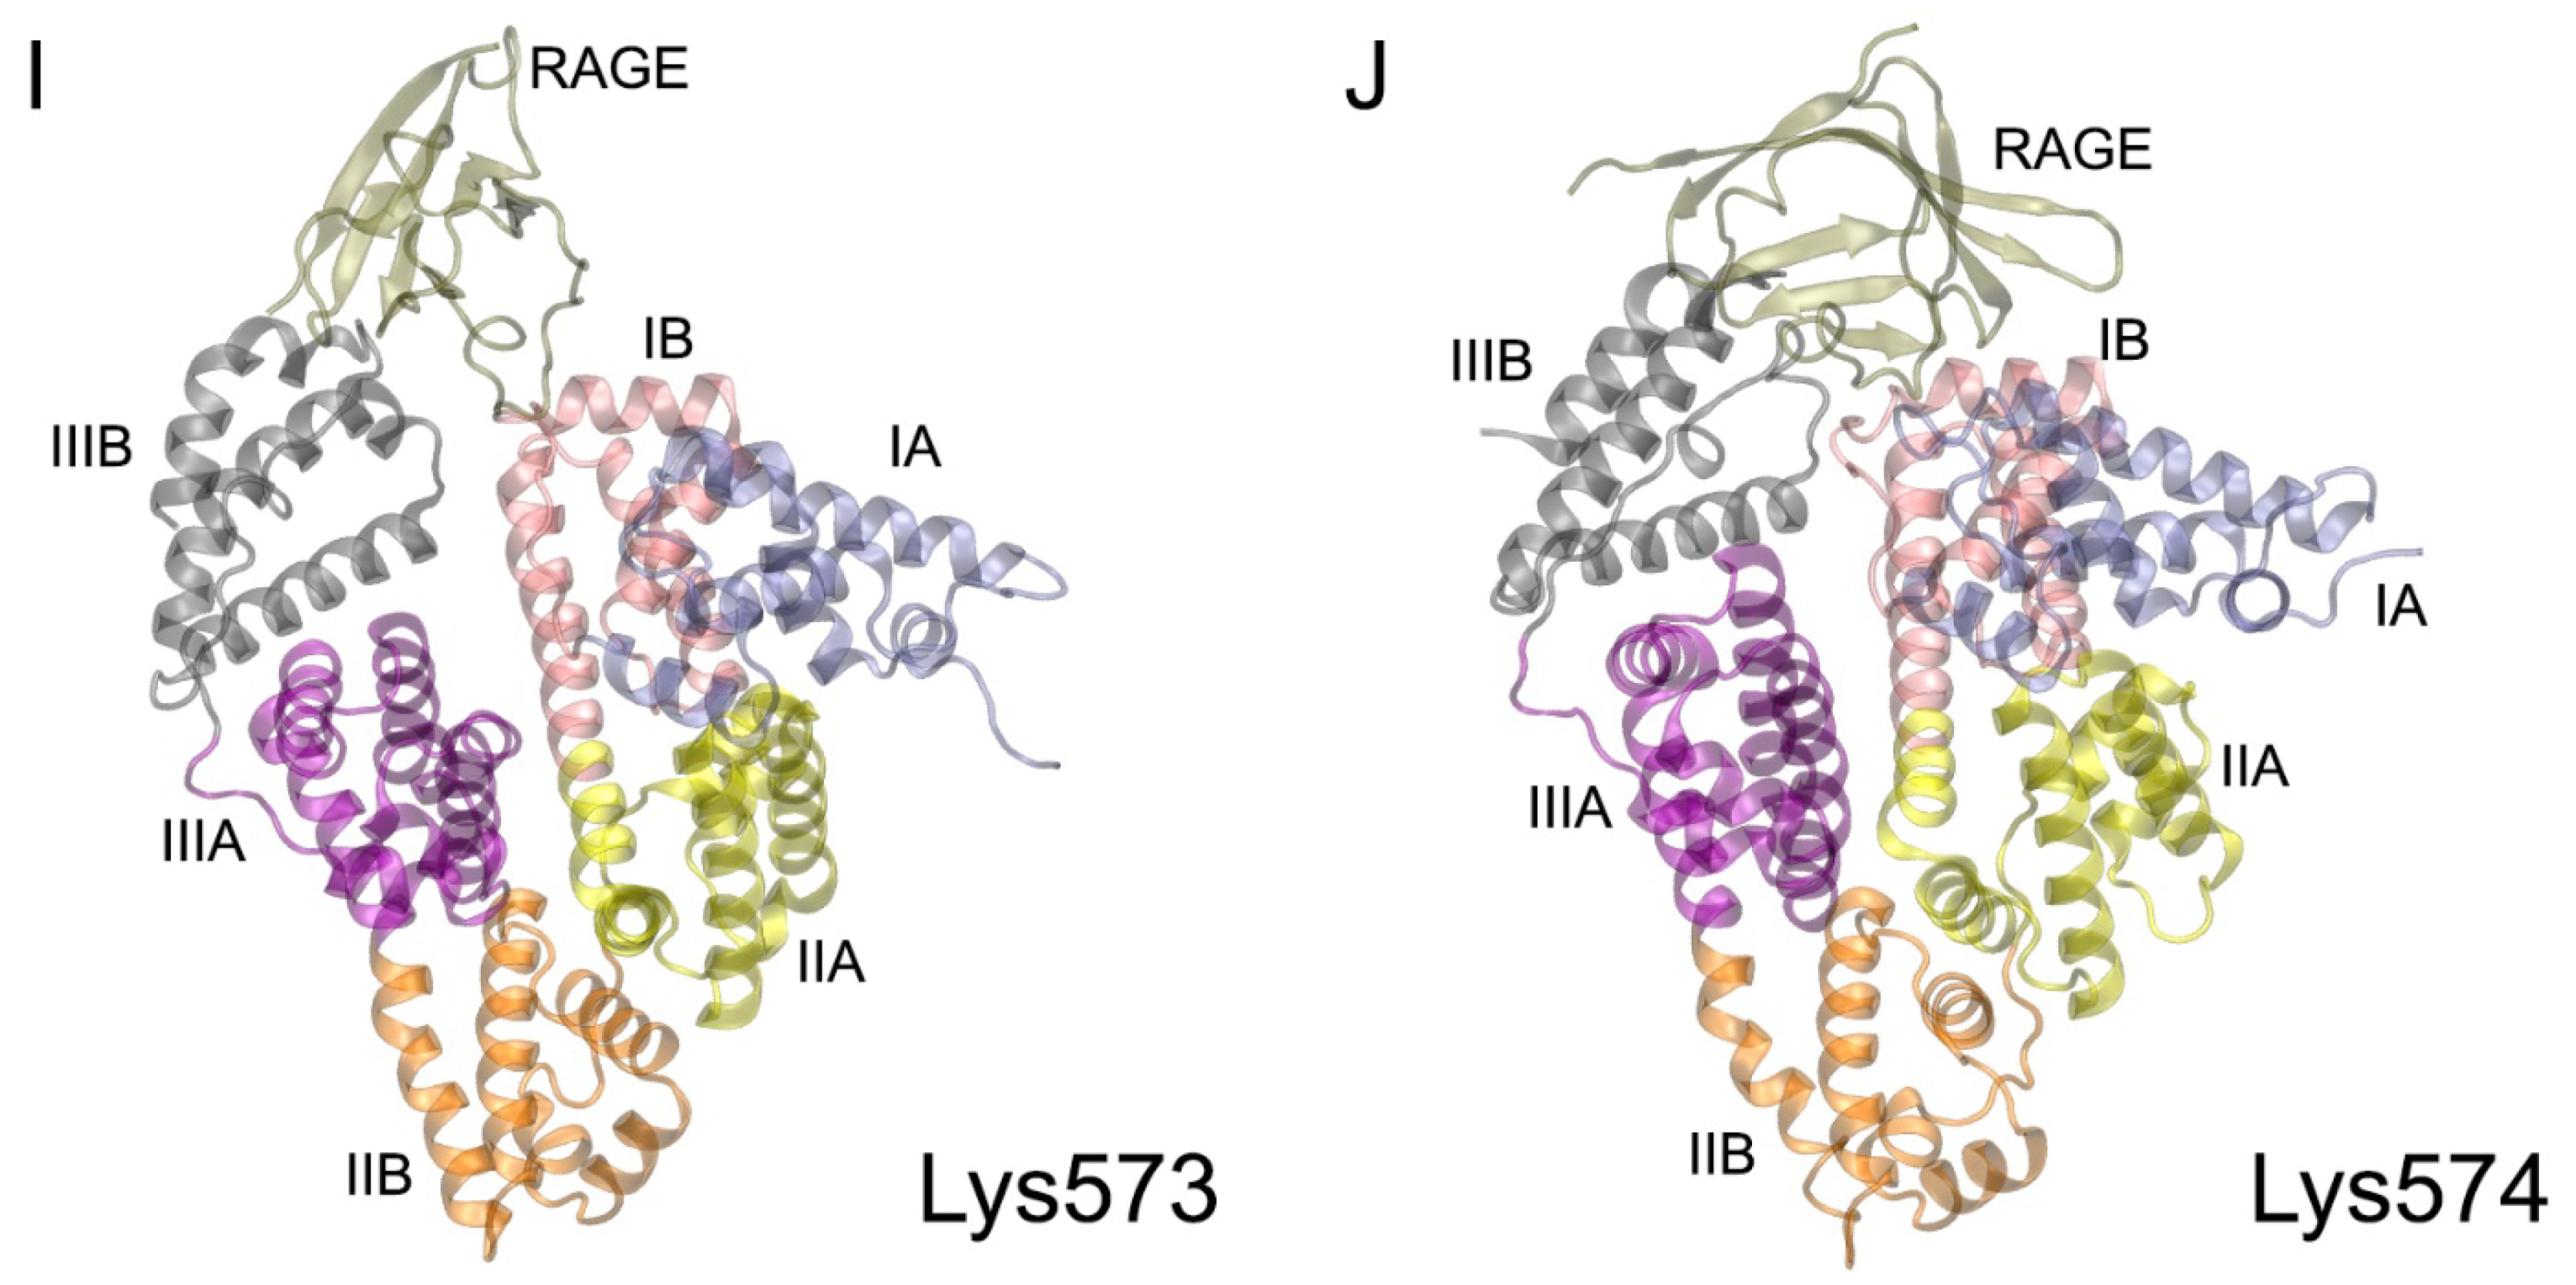
2.3. Macromolecular Docking of gHSA with the V-Domain of RAGE
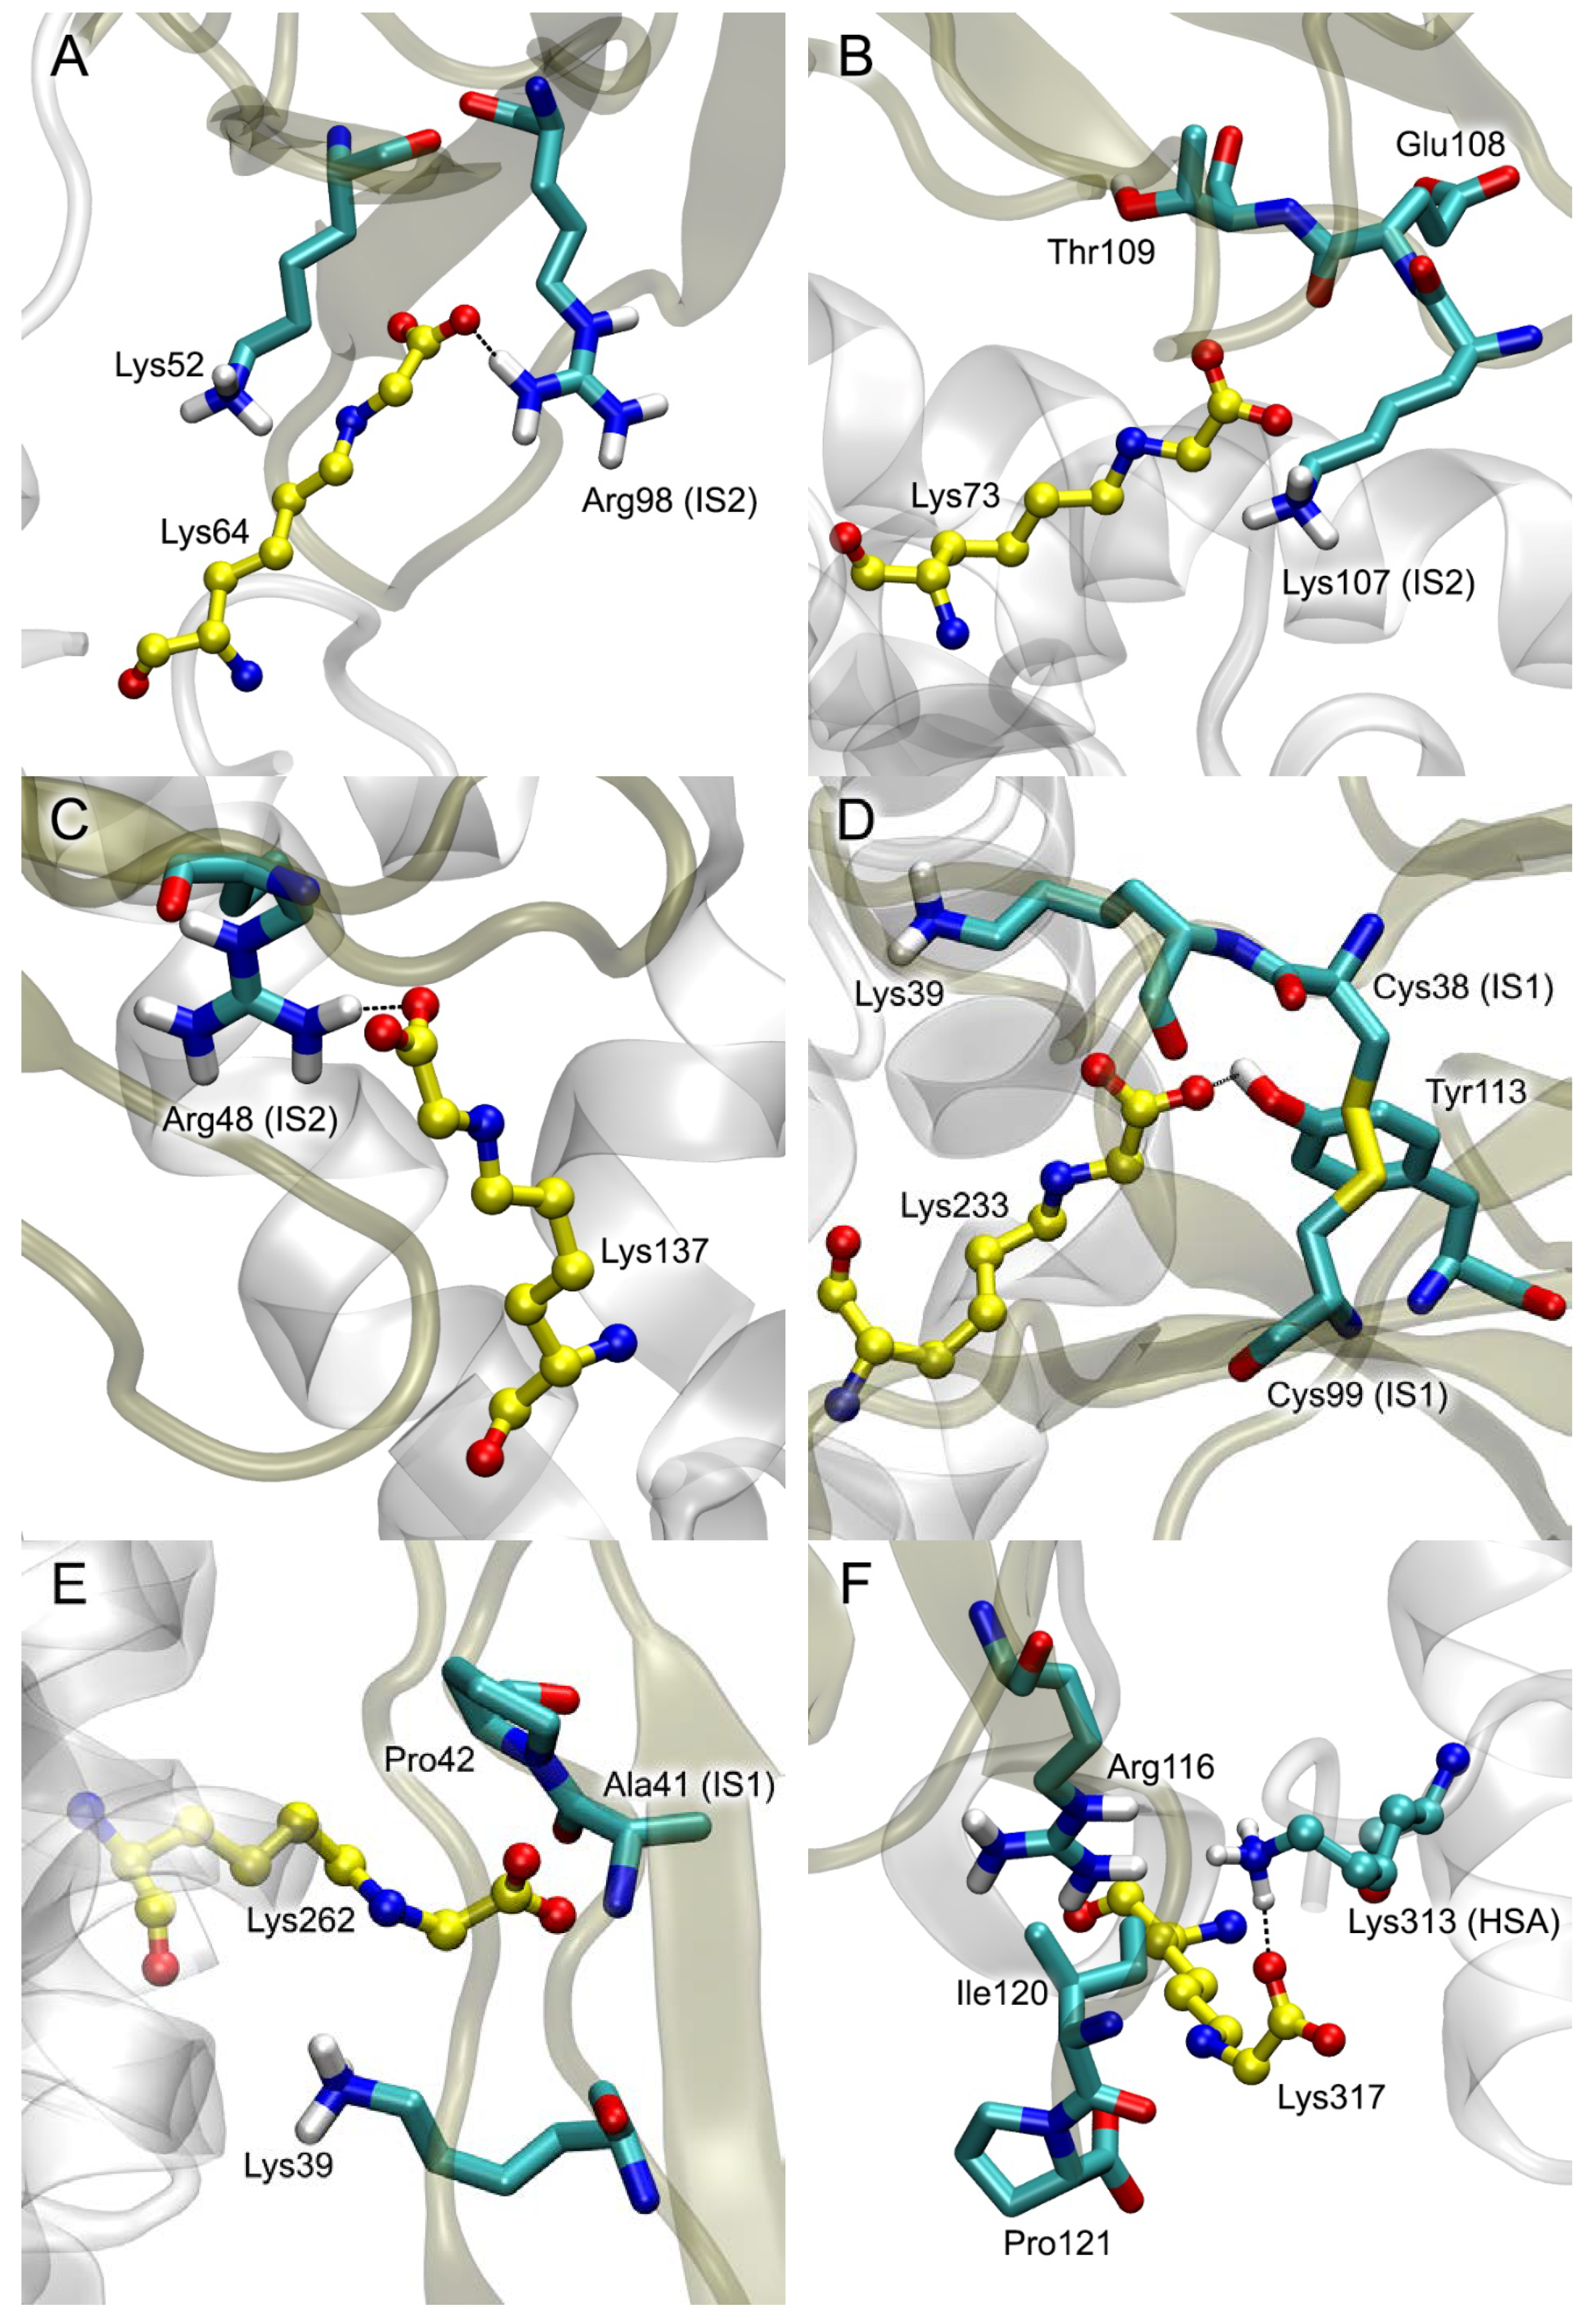
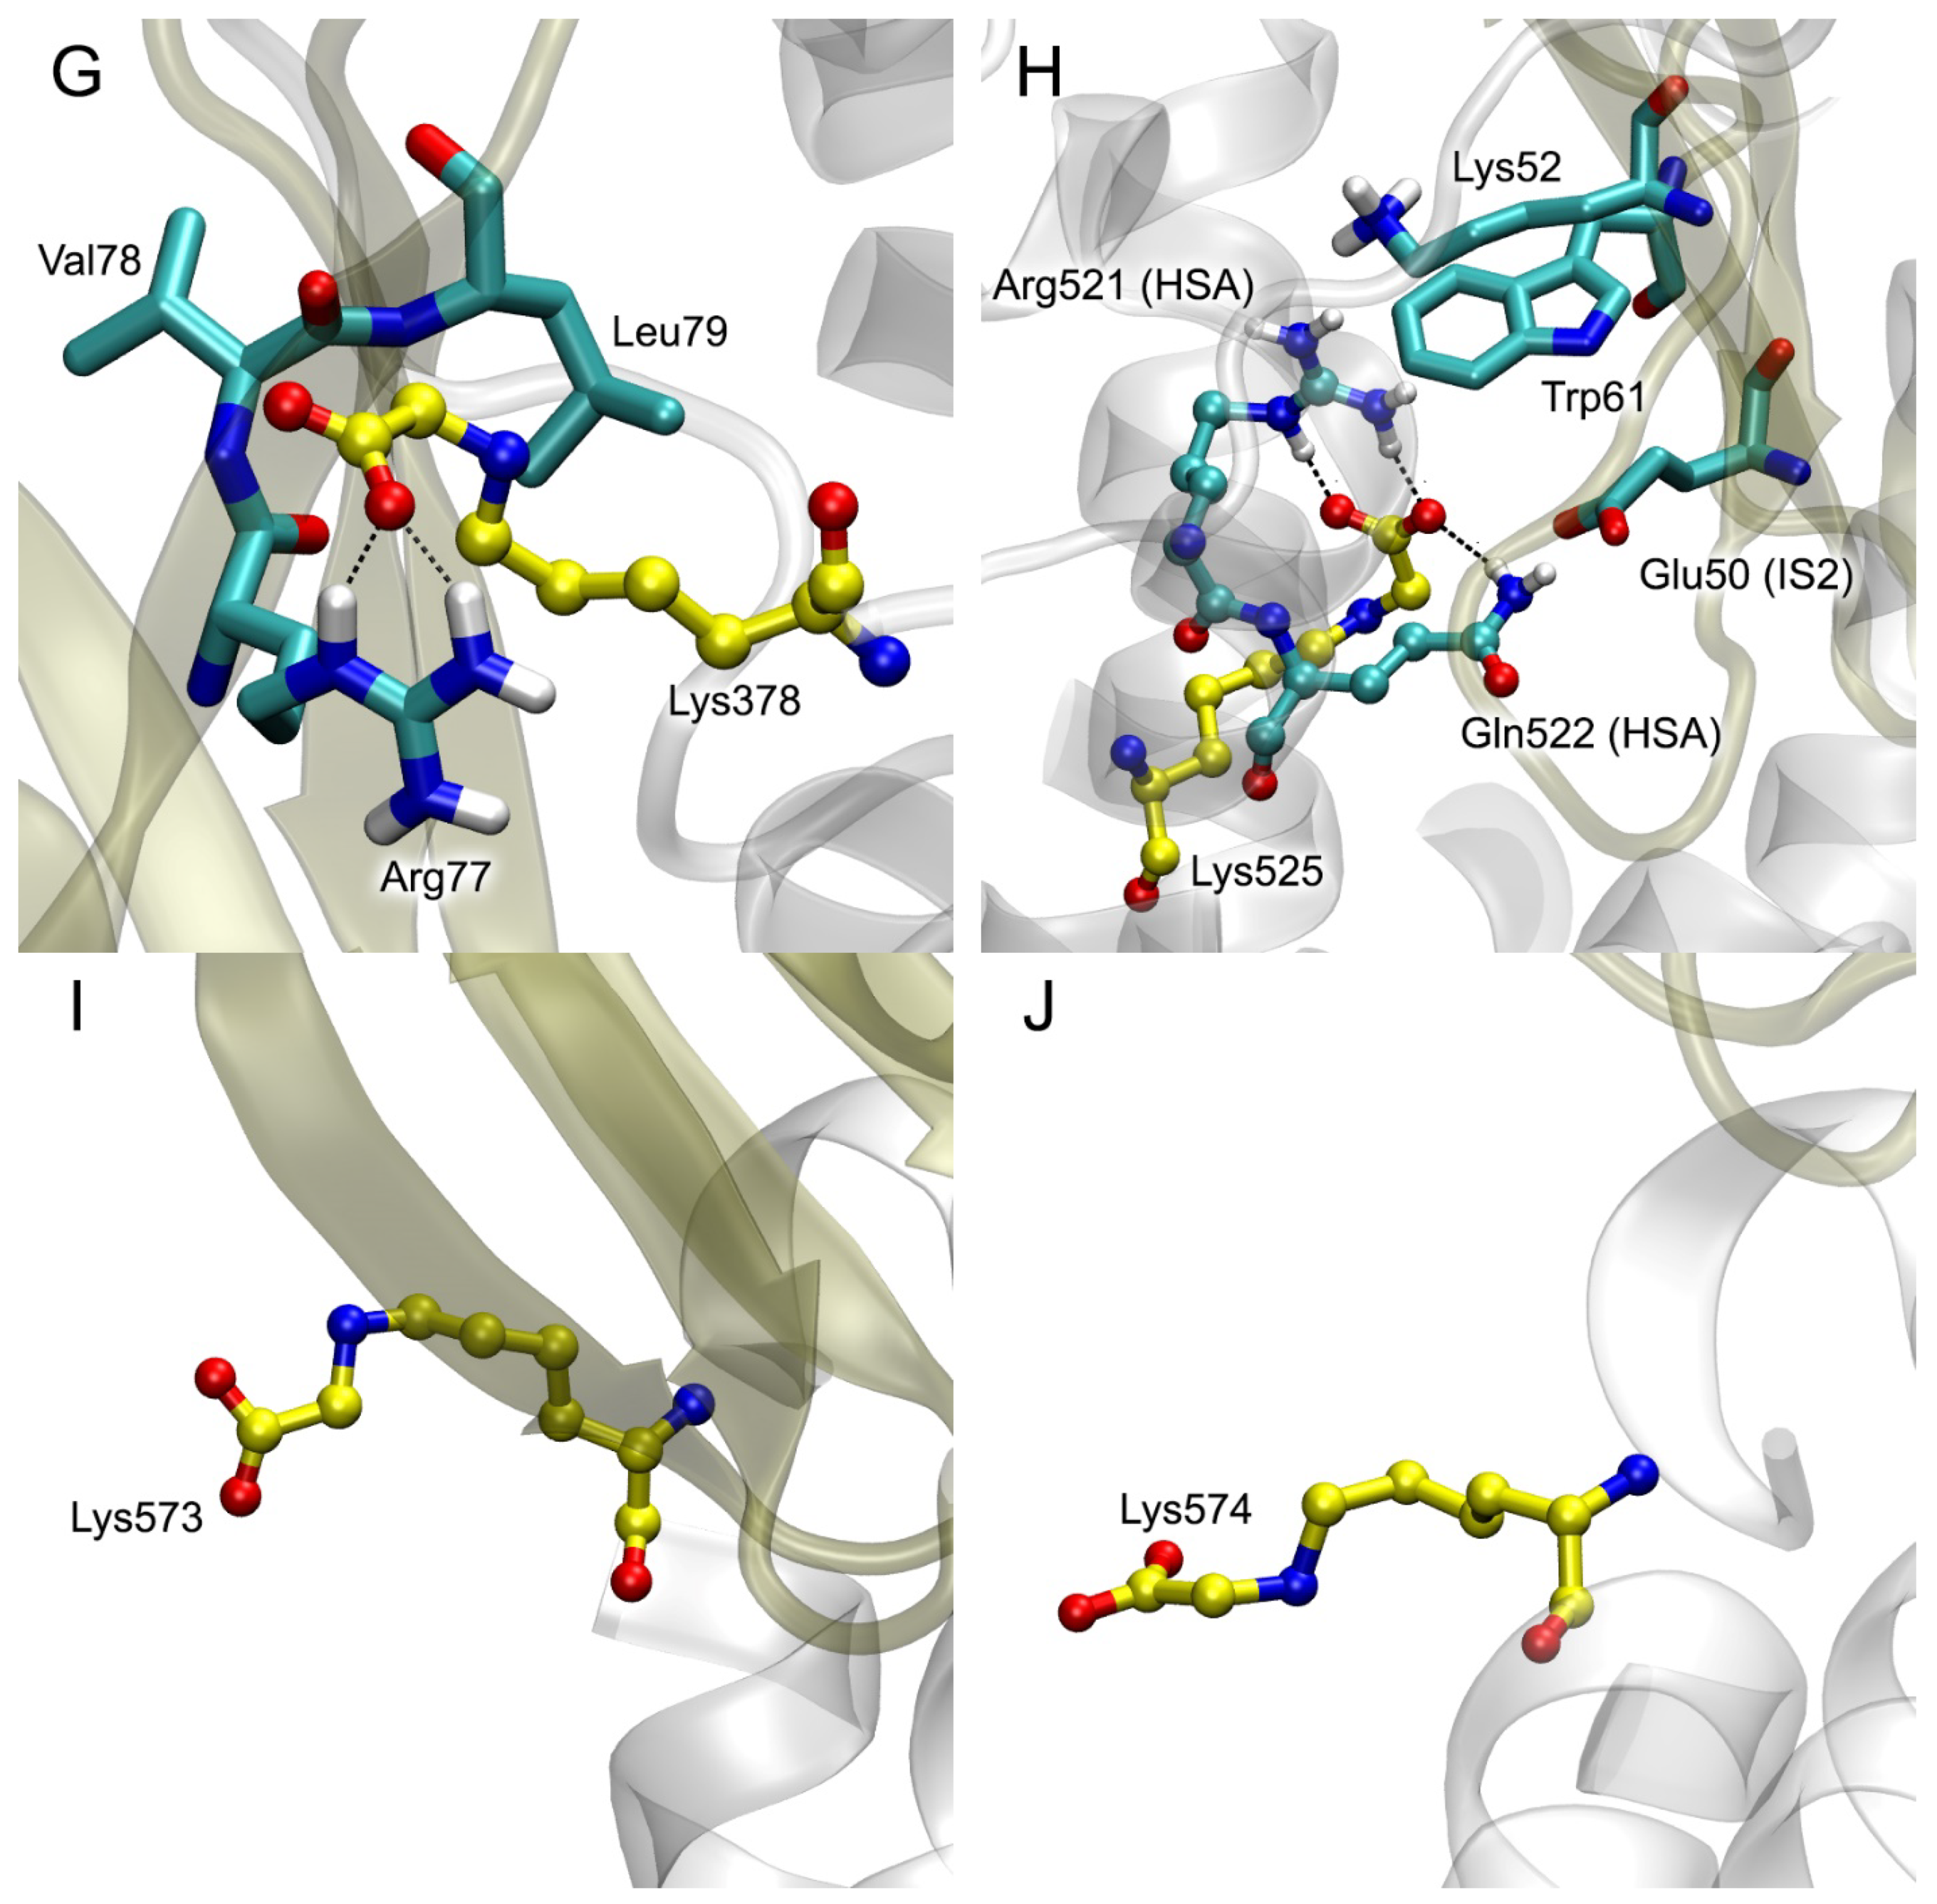
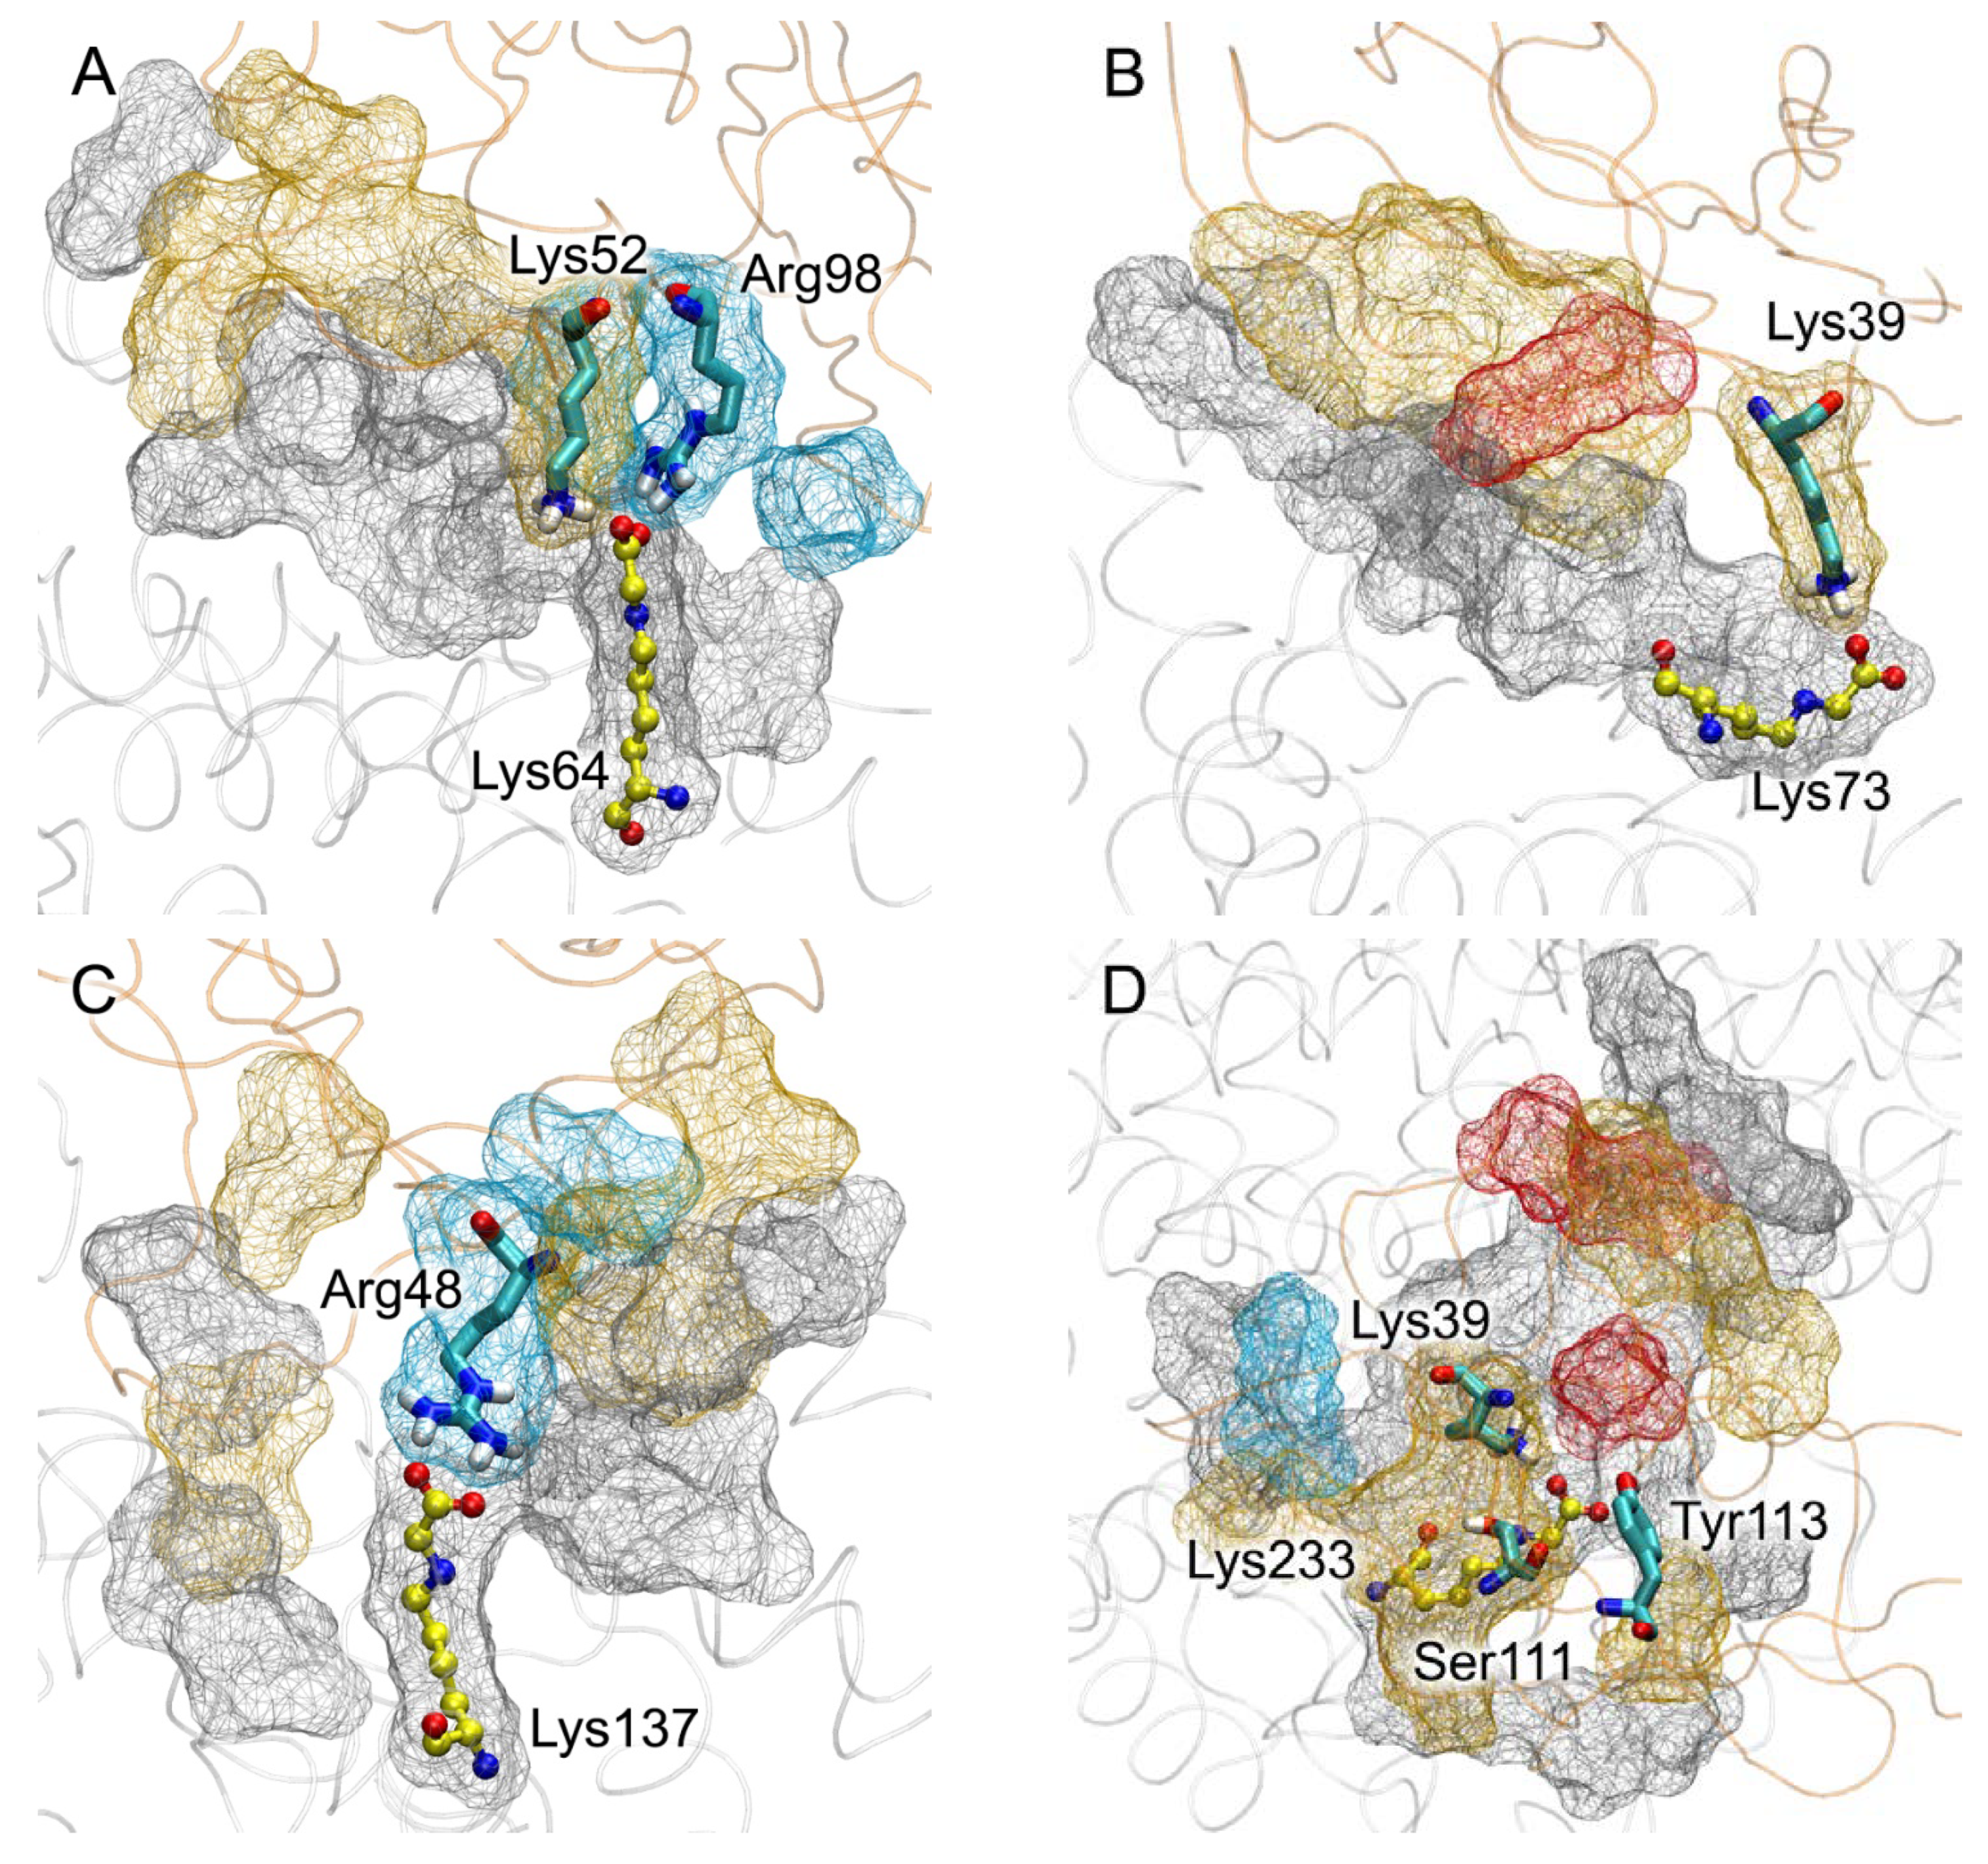
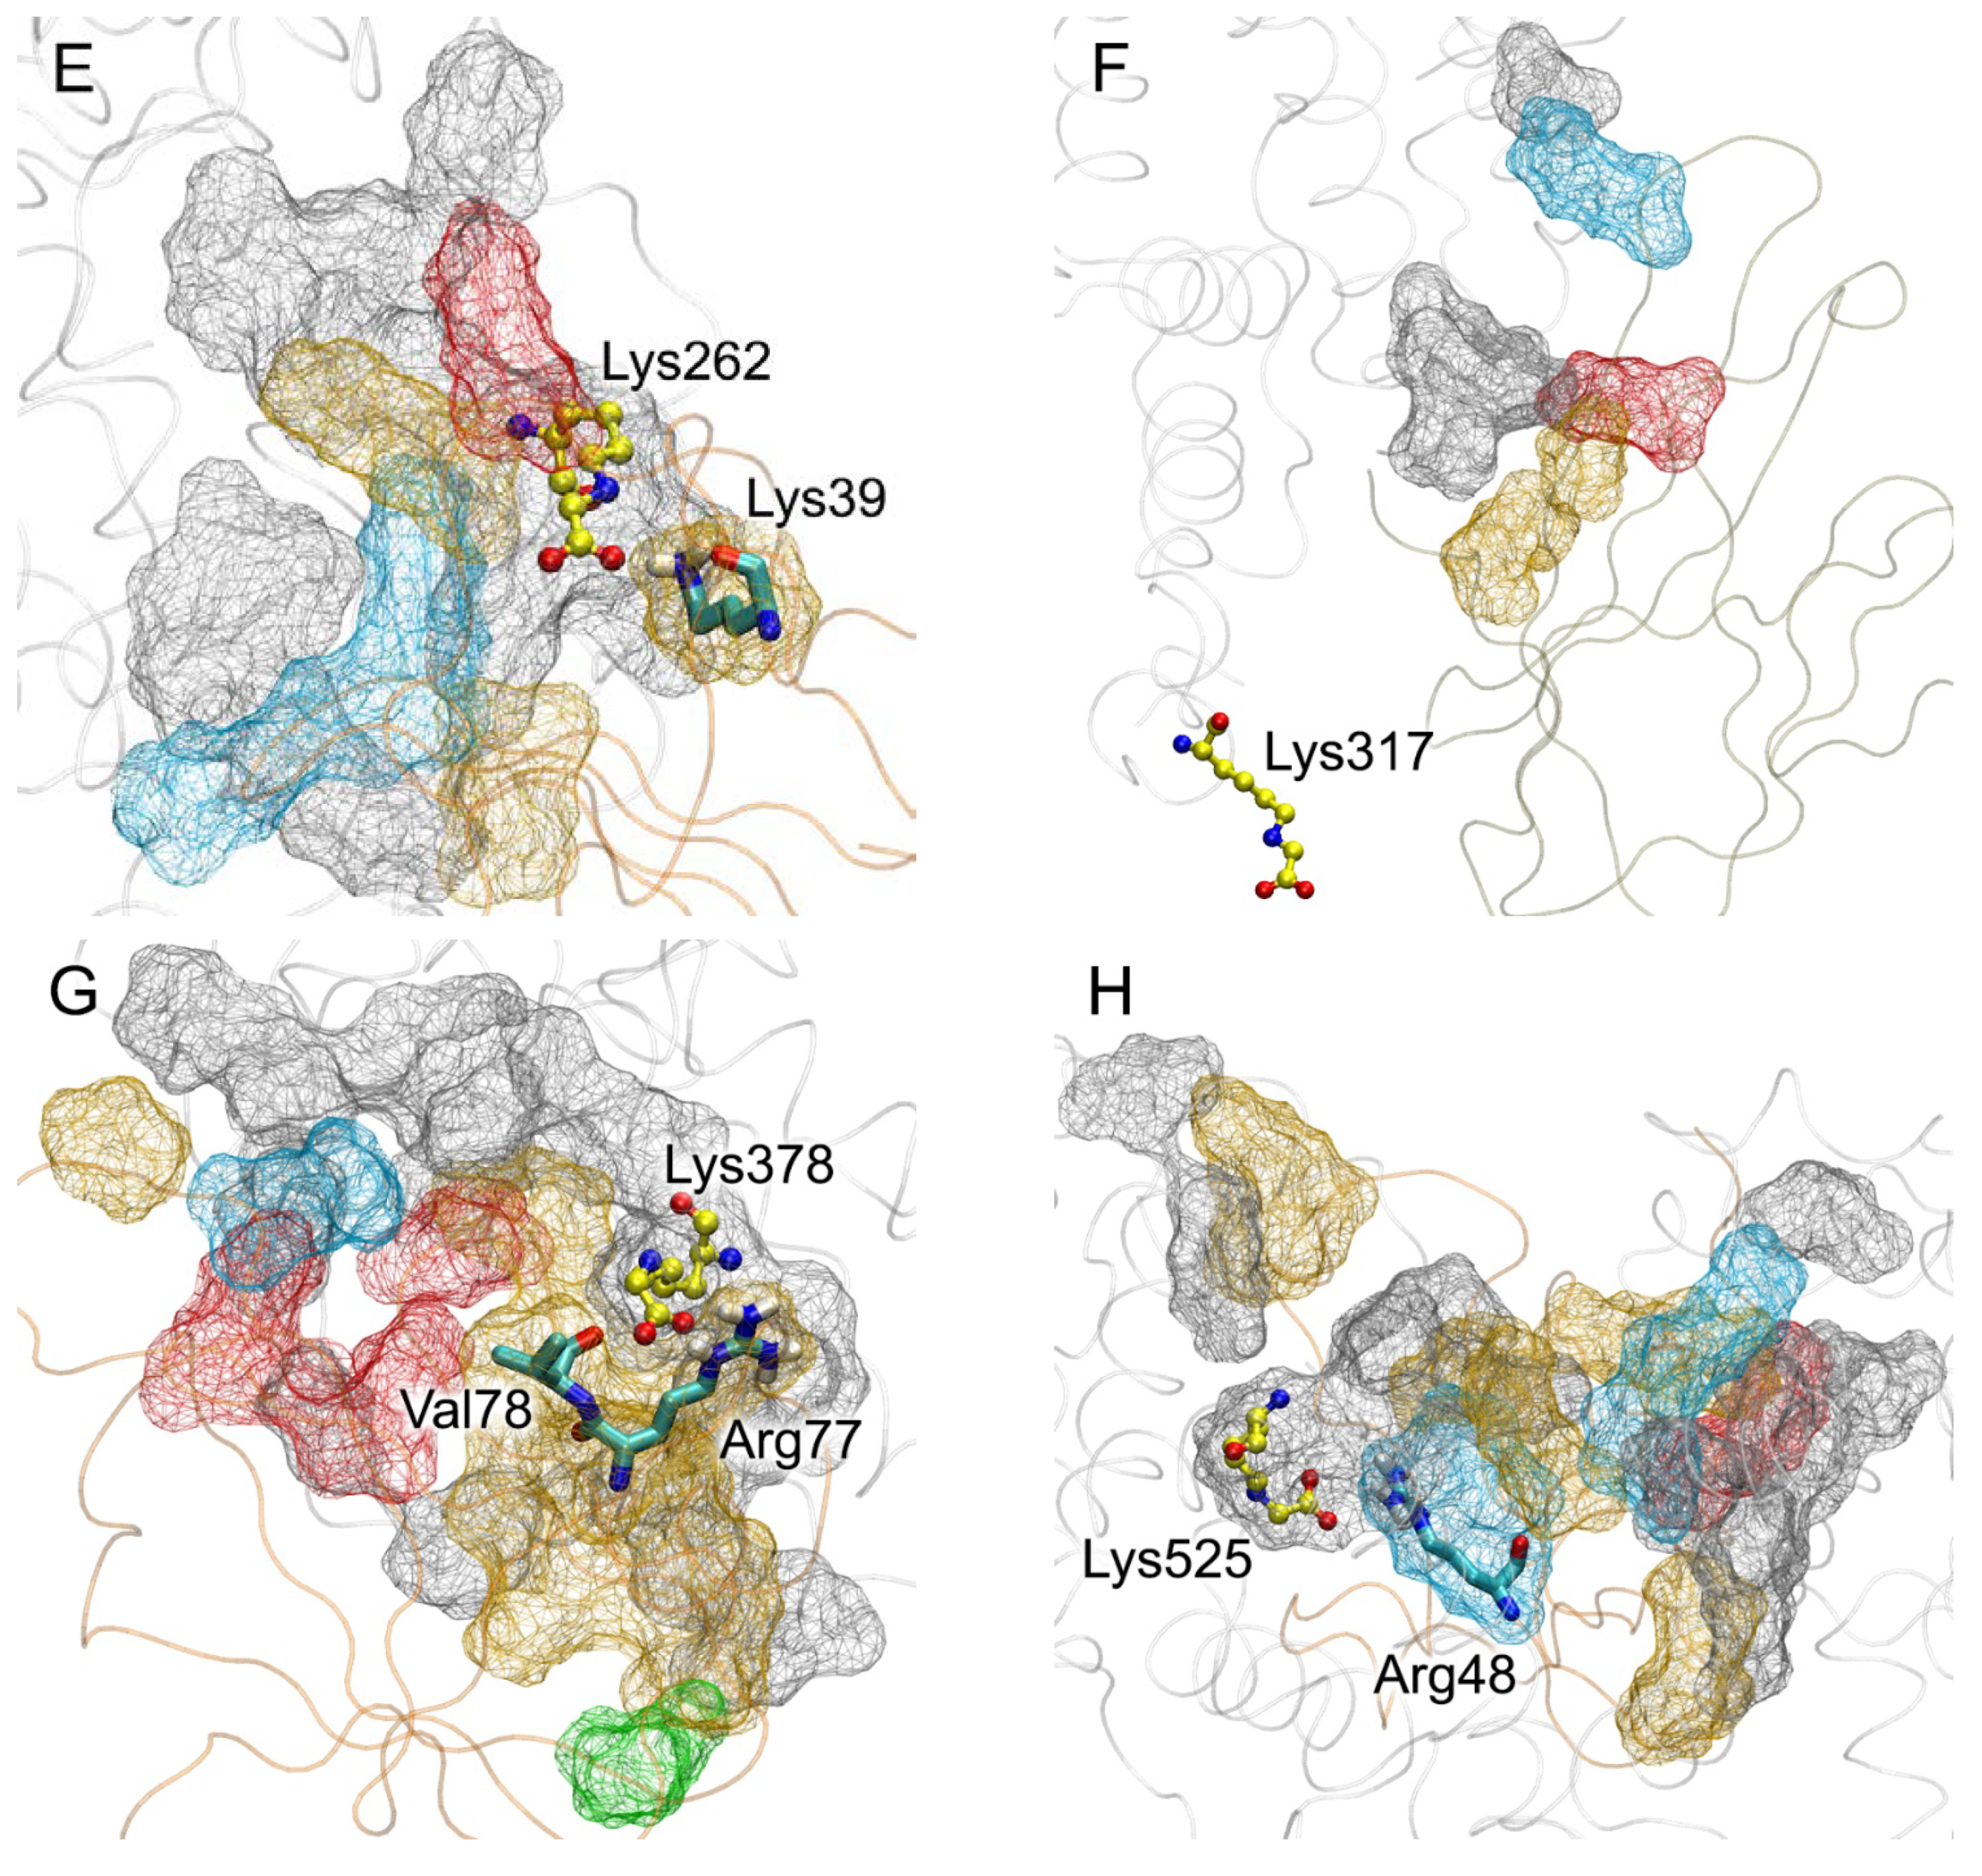
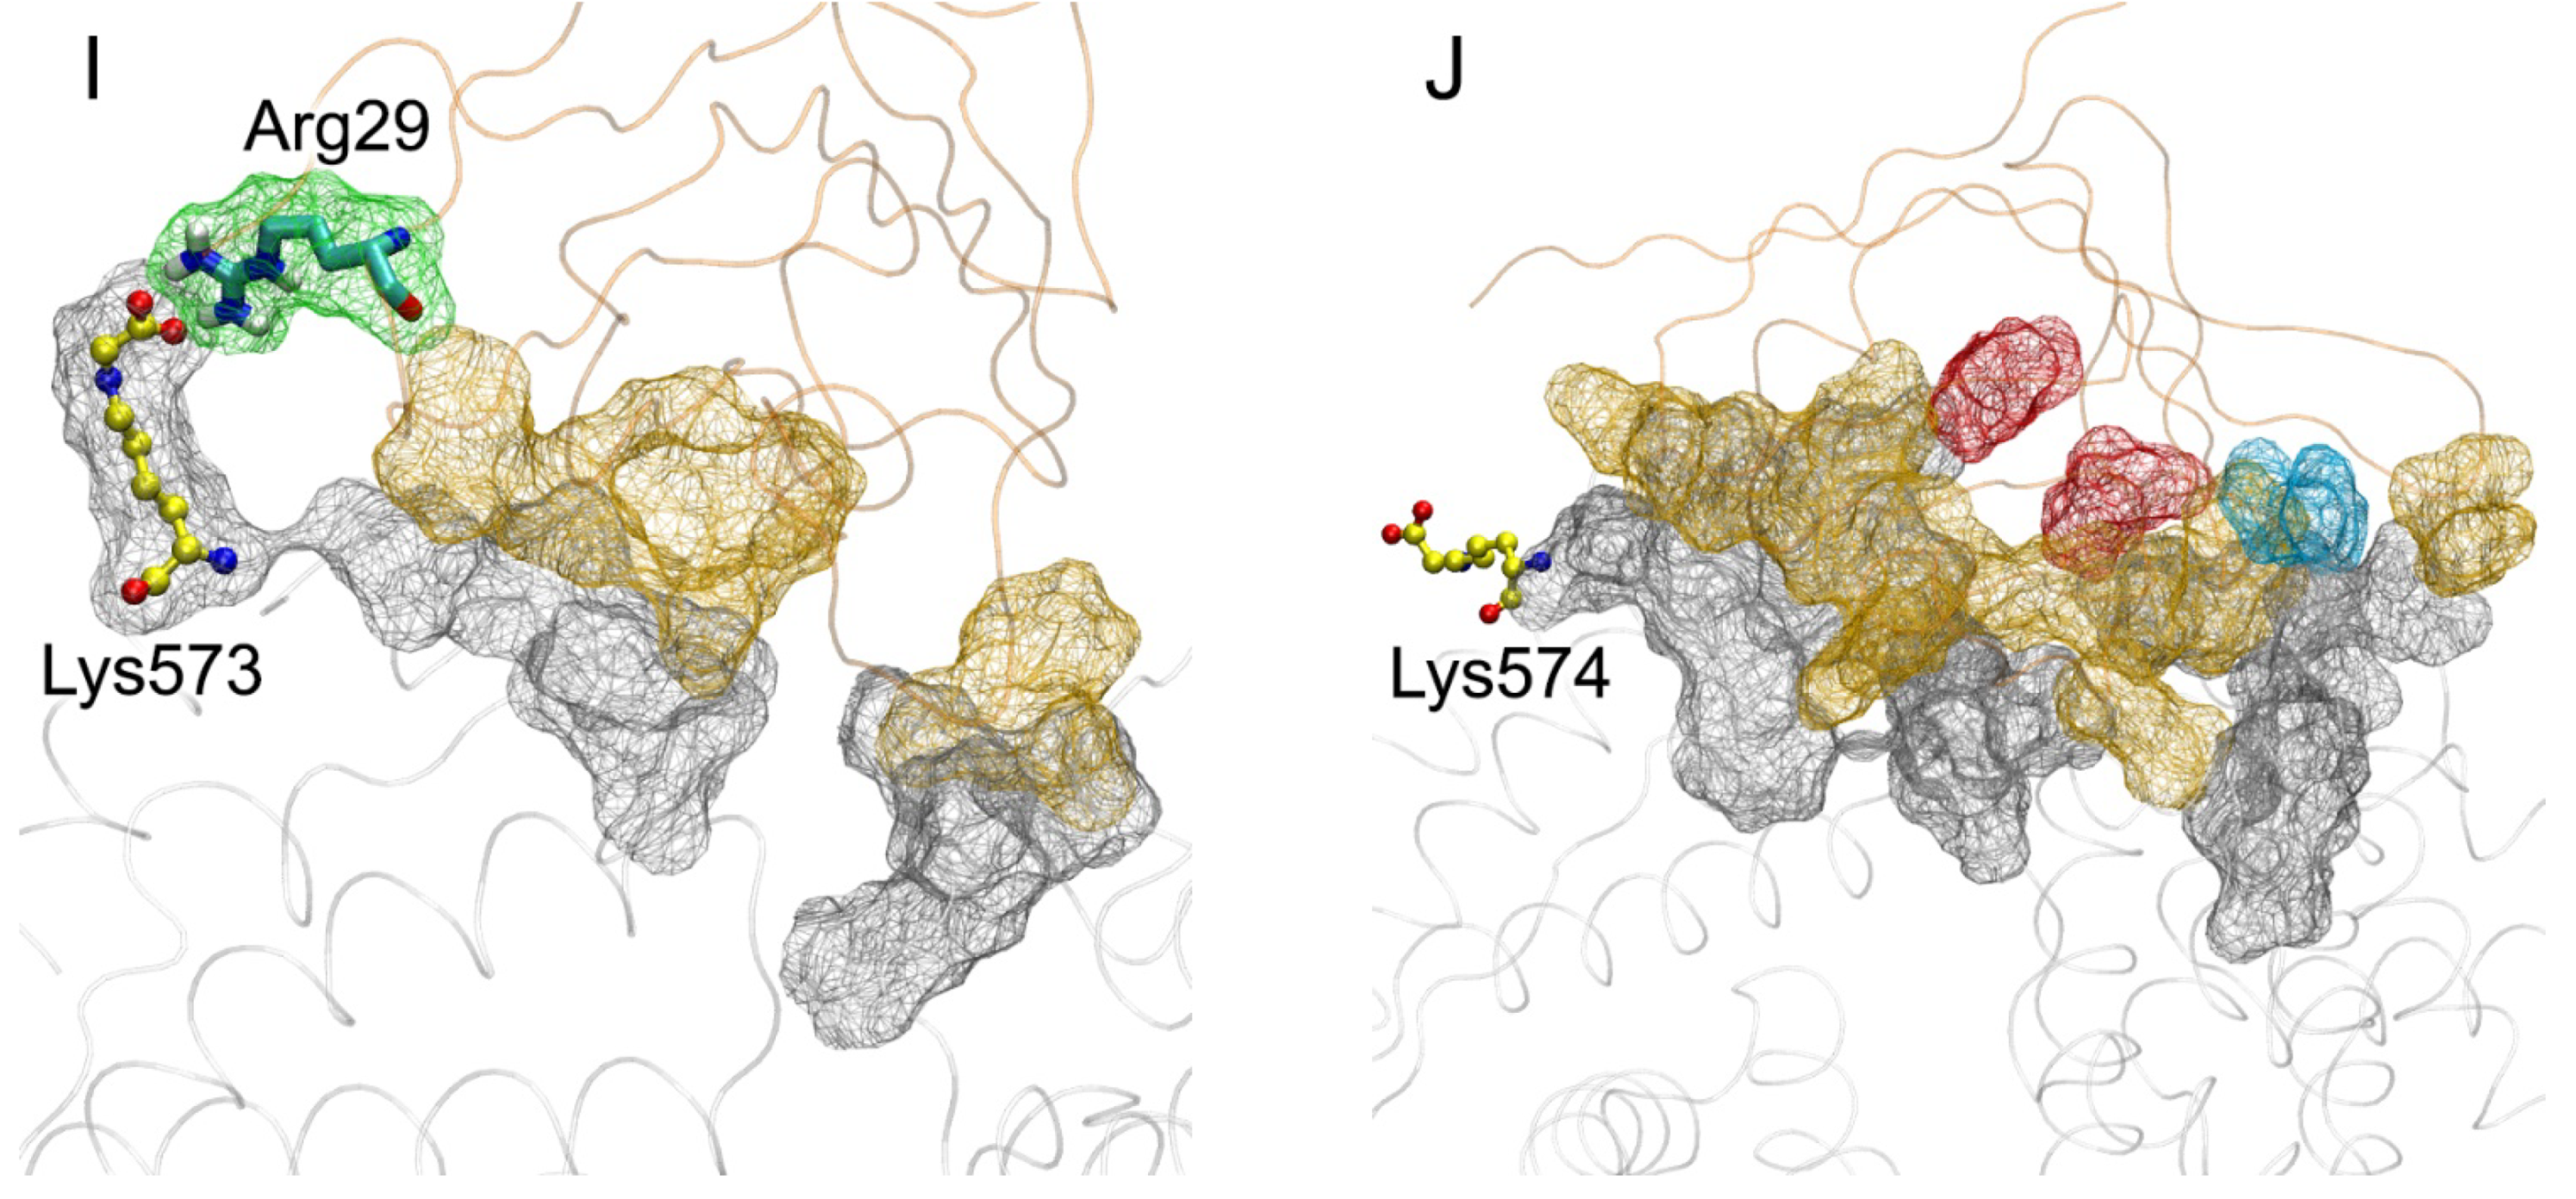
2.4. Interaction of gHSA with RAGE according to MD Simulation
2.5. Interplay between Glycation and Binding of Fatty Acids to HSA.
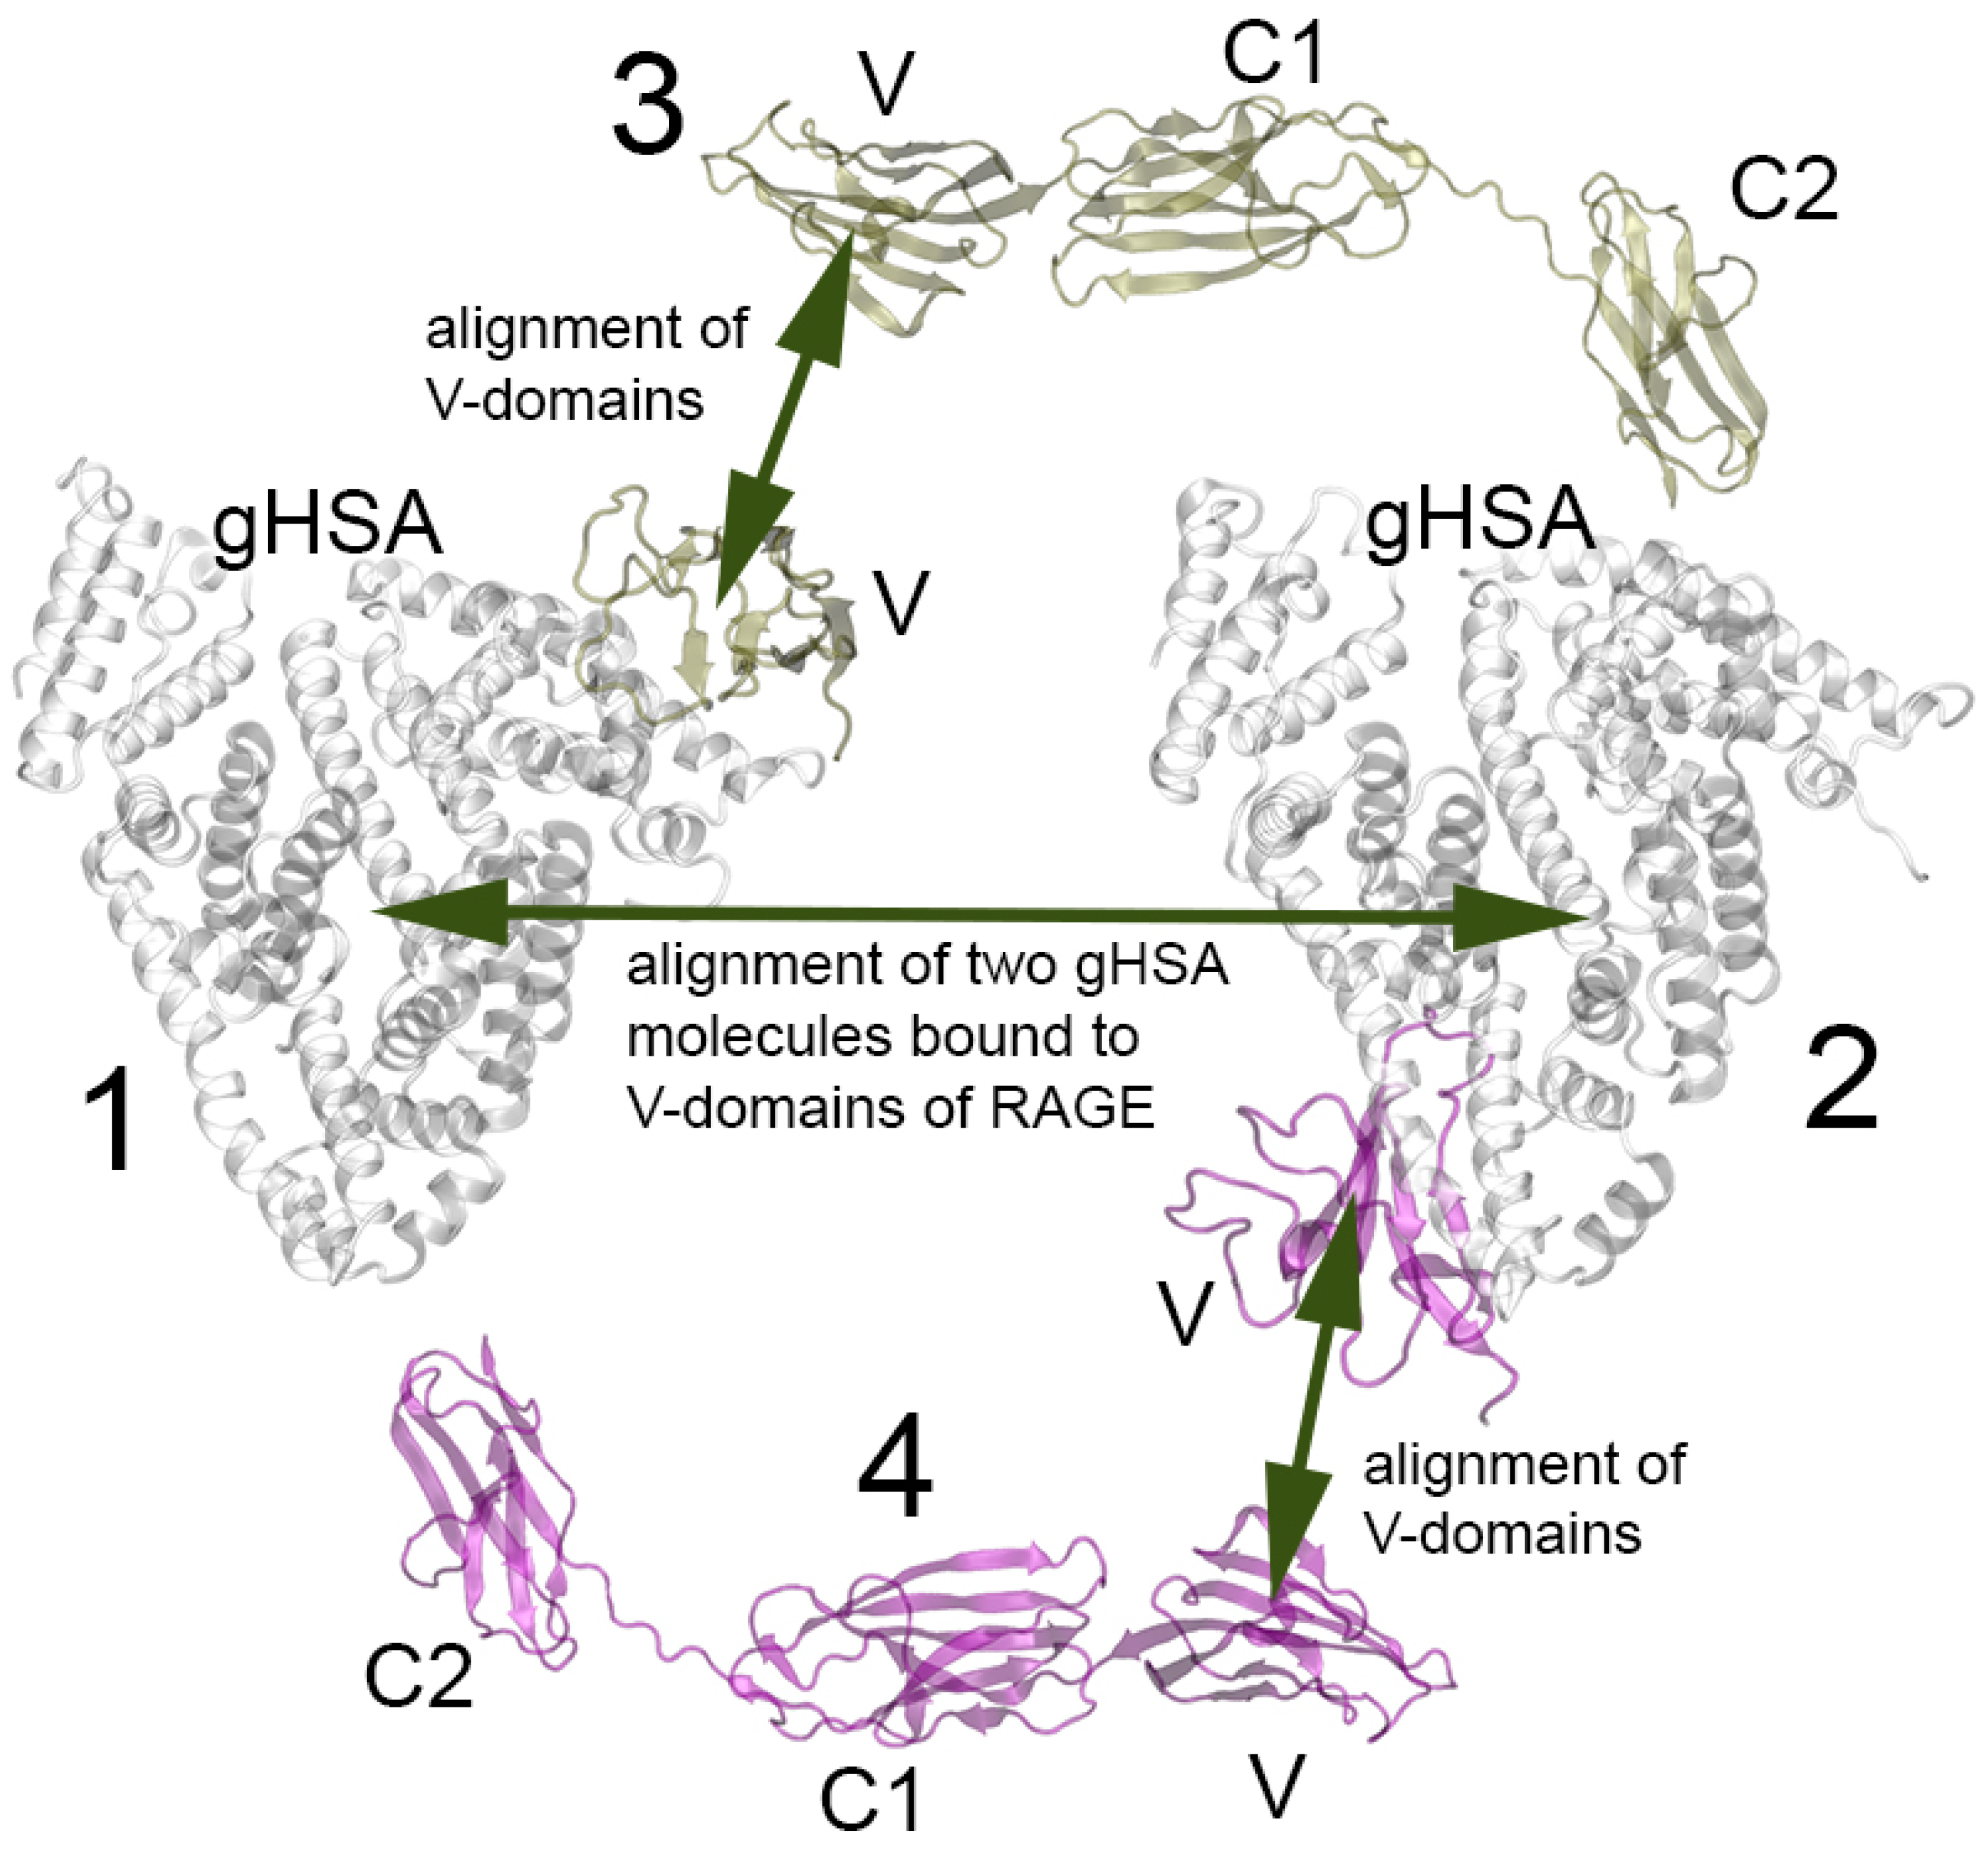
2.6. Probing of HSA–RAGE Dimers’ Structure
2.7. Comparative Analysis of Primary Sequences of Albumins from Various Species
3. Discussion
4. Materials and Methods
4.1. Preparation of the Three-Dimensional Models of Ligands and Proteins
4.2. Building of the gHSA Model
4.3. Molecular Docking
4.4. Macromolecular (Protein–Protein) Docking
4.5. Molecular Dynamics
5. Conclusions
Supplementary Materials
Author Contributions
Funding
Institutional Review Board Statement
Informed Consent Statement
Data Availability Statement
Acknowledgments
Conflicts of Interest
Abbreviations
| AGEs | advanced glycation end products |
| BSA | bovine serum albumin |
| BSA124–130 | BSA peptide including residues 124–130 with Lys127 glycated into CEL |
| CAPRI | critical assessment of predicted interactions |
| CEL | carboxyethyl lysine |
| CML | carboxymethyl lysine |
| CSA | chicken serum albumin |
| DM | diabetes mellitus |
| ESA | equine serum albumin |
| FA | fatty acid |
| FA1–7 | fatty acid binding sites 1–7 in serum albumin |
| gBSA | glycated bovine serum albumin |
| gHSA | glycated human serum albumin |
| gHSA–V | complex of gHSA with the V-domain of RAGE |
| gSA | glycated serum albumin |
| GLUC | β-D-glucopyranose |
| HMGB1 | high-mobility group protein B1 |
| HSA | human serum albumin |
| IS1–3 | interaction surface 1–3 (experimentally obtained areas on the surface of RAGE interacting with AGE-peptides and gBSA) |
| IUPAC | international union of pure and applied chemistry |
| LINCS | linear constraint solver for molecular simulations |
| LSA | leporine serum albumin |
| MD | molecular dynamics |
| NMR | nuclear magnetic resonance |
| NPT | constant number of particles N, pressure P and temperature T |
| NVT | constant number of particles N, volume V and temperature T |
| OLA | oleic acid |
| PDB | Protein Data Bank |
| RAGE | receptor for advanced glycation end products |
| Rg | radius of gyration; |
| RMSD | root mean square deviation |
| RMSF | root mean square fluctuation |
| SASA | solvent accessible surface area |
| SF | scoring function |
| TIP3P | transferable intermolecular potential with 3 points |
| VMD | visual molecular dynamics |
References
- Neviere, R.; Yu, Y.; Wang, L.; Tessier, F.; Boulanger, E. Implication of advanced glycation end products (Ages) and their receptor (Rage) on myocardial contractile and mitochondrial functions. Glycoconj. J. 2016, 33, 607–617. [Google Scholar] [CrossRef]
- Ahmad, S.; Siddiqui, Z.; Rehman, S.; Khan, M.Y.; Khan, H.; Khanum, S.; Alouffi, S.; Saeed, M. A Glycation Angle to Look into the Diabetic Vasculopathy: Cause and Cure. Curr. Vasc. Pharmacol. 2017, 15, 352–364. [Google Scholar] [CrossRef]
- Ramasamy, R.; Yan, S.F.; Schmidt, A.M. Advanced glycation endproducts: From precursors to RAGE: Round and round we go. Amino Acids 2012, 42, 1151–1161. [Google Scholar] [CrossRef]
- Gill, V.; Kumar, V.; Singh, K.; Kumar, A.; Kim, J.J. Advanced Glycation End Products (AGEs) May Be a Striking Link Between Modern Diet and Health. Biomolecules 2019, 9, 888. [Google Scholar] [CrossRef]
- Smith, P.K. Do advanced glycation end-products cause food allergy? Curr. Opin. Allergy Clin. Immunol. 2017, 17, 325–331. [Google Scholar] [CrossRef]
- Sukkar, M.B.; Wood, L.G.; Tooze, M.; Simpson, J.L.; McDonald, V.M.; Gibson, P.G.; Wark, P.A. Soluble RAGE is deficient in neutrophilic asthma and COPD. Eur. Respir. J. 2012, 39, 721–729. [Google Scholar] [CrossRef] [PubMed]
- Schmidt, A.M.; Hasu, M.; Popov, D.; Zhang, J.H.; Chen, J.; Yan, S.D.; Brett, J.; Cao, R.; Kuwabara, K.; Costache, G.; et al. Receptor for advanced glycation end products (AGEs) has a central role in vessel wall interactions and gene activation in response to circulating AGE proteins. Proc. Natl. Acad. Sci. USA 1994, 91, 8807–8811. [Google Scholar] [CrossRef] [PubMed]
- Kislinger, T.; Fu, C.; Huber, B.; Qu, W.; Taguchi, A.; Du Yan, S.; Hofmann, M.; Yan, S.F.; Pischetsrieder, M.; Stern, D.; et al. N(epsilon)-(carboxymethyl)lysine adducts of proteins are ligands for receptor for advanced glycation end products that activate cell signaling pathways and modulate gene expression. J. Biol. Chem. 1999, 274, 31740–31749. [Google Scholar] [CrossRef] [PubMed]
- Chen, C.Y.; Abell, A.M.; Moon, Y.S.; Kim, K.H. An advanced glycation end product (AGE)-receptor for AGEs (RAGE) axis restores adipogenic potential of senescent preadipocytes through modulation of p53 protein function. J. Biol. Chem. 2012, 287, 44498–44507. [Google Scholar] [CrossRef] [PubMed]
- Xie, J.; Reverdatto, S.; Frolov, A.; Hoffmann, R.; Burz, D.S.; Shekhtman, A. Structural basis for pattern recognition by the receptor for advanced glycation end products (RAGE). J. Biol. Chem. 2008, 283, 27255–27269. [Google Scholar] [CrossRef] [PubMed]
- Fritz, G. RAGE: A single receptor fits multiple ligands. Trends Biochem. Sci. 2011, 36, 625–632. [Google Scholar] [CrossRef]
- Yatime, L.; Andersen, G.R. Structural insights into the oligomerization mode of the human receptor for advanced glycation end-products. FEBS J. 2013, 280, 6556–6568. [Google Scholar] [CrossRef]
- Mohan, S.K.; Gupta, A.A.; Yu, C. Interaction of the S100A6 mutant (C3S) with the V domain of the receptor for advanced glycation end products (RAGE). Biochem. Biophys. Res. Commun. 2013, 434, 328–333. [Google Scholar] [CrossRef]
- Penumutchu, S.R.; Chou, R.H.; Yu, C. Structural insights into calcium-bound S100P and the V domain of the RAGE complex. PLoS ONE 2014, 9, e103947. [Google Scholar] [CrossRef] [PubMed]
- Sirois, C.M.; Jin, T.; Miller, A.L.; Bertheloot, D.; Nakamura, H.; Horvath, G.L.; Mian, A.; Jiang, J.; Schrum, J.; Bossaller, L.; et al. RAGE is a nucleic acid receptor that promotes inflammatory responses to DNA. J. Exp. Med. 2013, 210, 2447–2463. [Google Scholar] [CrossRef] [PubMed]
- Xue, J.; Manigrasso, M.; Scalabrin, M.; Rai, V.; Reverdatto, S.; Burz, D.S.; Fabris, D.; Schmidt, A.M.; Shekhtman, A. Change in the Molecular Dimension of a RAGE-Ligand Complex Triggers RAGE Signaling. Structure 2016, 24, 1509–1522. [Google Scholar] [CrossRef] [PubMed]
- Kozlyuk, N.; Gilston, B.A.; Salay, L.E.; Gogliotti, R.D.; Christov, P.P.; Kim, K.; Ovee, M.; Waterson, A.G.; Chazin, W.J. A fragment-based approach to discovery of Receptor for Advanced Glycation End products inhibitors. Proteins 2021, 89, 1399–1412. [Google Scholar] [CrossRef] [PubMed]
- Ansari, N.A.; Moinuddin; Ali, R. Glycated lysine residues: A marker for non-enzymatic protein glycation in age-related diseases. Dis. Markers 2011, 30, 317–324. [Google Scholar] [CrossRef] [PubMed]
- Arasteh, A.; Farahi, S.; Habibi-Rezaei, M.; Moosavi-Movahedi, A.A. Glycated albumin: An overview of the In Vitro models of an In Vivo potential disease marker. J. Diabetes Metab. Disord. 2014, 13, 49. [Google Scholar] [CrossRef] [PubMed]
- Chubarov, A.; Spitsyna, A.; Krumkacheva, O.; Mitin, D.; Suvorov, D.; Tormyshev, V.; Fedin, M.; Bowman, M.K.; Bagryanskaya, E. Reversible Dimerization of Human Serum Albumin. Molecules 2020, 26, 108. [Google Scholar] [CrossRef] [PubMed]
- Qiu, H.Y.; Hou, N.N.; Shi, J.F.; Liu, Y.P.; Kan, C.X.; Han, F.; Sun, X.D. Comprehensive overview of human serum albumin glycation in diabetes mellitus. World J. Diabetes 2021, 12, 1057–1069. [Google Scholar] [CrossRef]
- Caridi, G.; Lugani, F.; Angeletti, A.; Campagnoli, M.; Galliano, M.; Minchiotti, L. Variations in the Human Serum Albumin Gene: Molecular and Functional Aspects. Int. J. Mol. Sci. 2022, 23, 1159. [Google Scholar] [CrossRef]
- Abraham, M.J.; Murtola, T.; Schulz, R.; Páll, S.; Smith, J.C.; Hess, B.; Lindahl, E. GROMACS: High performance molecular simulations through multi-level parallelism from laptops to supercomputers. SoftwareX 2015, 1–2, 19–25. [Google Scholar] [CrossRef]
- Sartore, G.; Bassani, D.; Ragazzi, E.; Traldi, P.; Lapolla, A.; Moro, S. In silico evaluation of the interaction between ACE2 and SARS-CoV-2 Spike protein in a hyperglycemic environment. Sci. Rep. 2021, 11, 22860. [Google Scholar] [CrossRef]
- Zsila, F. Subdomain IB is the third major drug binding region of human serum albumin: Toward the three-sites model. Mol. Pharm. 2013, 10, 1668–1682. [Google Scholar] [CrossRef]
- Wu, D.; Gucwa, M.; Czub, M.P.; Cooper, D.R.; Shabalin, I.G.; Fritzen, R.; Arya, S.; Schwarz-Linek, U.; Blindauer, C.A.; Minor, W.; et al. Structural and biochemical characterisation of Co2+-binding sites on serum albumins and their interplay with fatty acids. Chem. Sci. 2023, 14, 6244–6258. [Google Scholar] [CrossRef]
- van der Vusse, G.J. Albumin as fatty acid transporter. Drug Metab. Pharmacokinet. 2009, 24, 300–307. [Google Scholar] [CrossRef] [PubMed]
- Simard, J.R.; Zunszain, P.A.; Ha, C.E.; Yang, J.S.; Bhagavan, N.V.; Petitpas, I.; Curry, S.; Hamilton, J.A. Locating high-affinity fatty acid-binding sites on albumin by x-ray crystallography and NMR spectroscopy. Proc. Natl. Acad. Sci. USA 2005, 102, 17958–17963. [Google Scholar] [CrossRef]
- Dobretsov, G.E.; Syrejshchikova, T.I.; Smolina, N.V.; Uzbekov, M.G. Effects of fatty acids on human serum albumin binding centers. Bull. Exp. Biol. Med. 2012, 153, 323–326. [Google Scholar] [CrossRef] [PubMed]
- Yamasaki, K.; Hyodo, S.; Taguchi, K.; Nishi, K.; Yamaotsu, N.; Hirono, S.; Chuang, V.T.G.; Seo, H.; Maruyama, T.; Otagiri, M. Long chain fatty acids alter the interactive binding of ligands to the two principal drug binding sites of human serum albumin. PLoS ONE 2017, 12, e0180404. [Google Scholar] [CrossRef]
- Petitpas, I.; Grüne, T.; Bhattacharya, A.A.; Curry, S. Crystal structures of human serum albumin complexed with monounsaturated and polyunsaturated fatty acids. J. Mol. Biol. 2001, 314, 955–960. [Google Scholar] [CrossRef] [PubMed]
- Sievers, F.; Wilm, A.; Dineen, D.; Gibson, T.J.; Karplus, K.; Li, W.; Lopez, R.; McWilliam, H.; Remmert, M.; Söding, J.; et al. Fast, scalable generation of high-quality protein multiple sequence alignments using Clustal Omega. Mol. Syst. Biol. 2011, 7, 539. [Google Scholar] [CrossRef]
- UniProt Consortium. UniProt: A worldwide hub of protein knowledge. Nucleic Acids Res. 2019, 47, D506–D515. [Google Scholar] [CrossRef] [PubMed]
- Hein, K.L.; Kragh-Hansen, U.; Morth, J.P.; Jeppesen, M.D.; Otzen, D.; Møller, J.V.; Nissen, P. Crystallographic analysis reveals a unique lidocaine binding site on human serum albumin. J. Struct. Biol. 2010, 171, 353–360. [Google Scholar] [CrossRef] [PubMed]
- Castagna, R.; Donini, S.; Colnago, P.; Serafini, A.; Parisini, E.; Bertarelli, C. Biohybrid Electrospun Membrane for the Filtration of Ketoprofen Drug from Water. ACS Omega 2019, 4, 13270–13278. [Google Scholar] [CrossRef] [PubMed]
- Shabalin, I.G.; Czub, M.P.; Majorek, K.A.; Brzezinski, D.; Grabowski, M.; Cooper, D.R.; Panasiuk, M.; Chruszcz, M.; Minor, W. Molecular determinants of vascular transport of dexamethasone in COVID-19 therapy. IUCrJ 2020, 7 Pt 6, 1048–1058. [Google Scholar] [CrossRef]
- Talaj, J.A.; Zielinski, K.; Bujacz, A. Structural Investigation of Diclofenac Binding to Ovine, Caprine, and Leporine Serum Albumins. Int. J. Mol. Sci. 2023, 24, 1534. [Google Scholar] [CrossRef]
- Taborskaya, K.I.; Belinskaya, D.A.; Goncharov, N.V.; Avdonin, P.V. Building a three-dimensional model of rat albumin molecule by homology modeling. J. Evol. Biochem. Physiol. 2017, 53, 384–393. [Google Scholar] [CrossRef]
- Jumper, J.; Evans, R.; Pritzel, A.; Green, T.; Figurnov, M.; Ronneberger, O.; Tunyasuvunakool, K.; Bates, R.; Žídek, A.; Potapenko, A.; et al. Highly accurate protein structure prediction with AlphaFold. Nature 2021, 596, 583–589. [Google Scholar] [CrossRef]
- Anthony-Regnitz, C.M.; Wilson, A.E.; Sweazea, K.L.; Braun, E.J. Fewer Exposed Lysine Residues May Explain Relative Resistance of Chicken Serum Albumin to In Vitro Protein Glycation in Comparison to Bovine Serum Albumin. J. Mol. Evol. 2020, 88, 653–661. [Google Scholar] [CrossRef]
- Martinez Del Rio, C.; Gutiérrez-Guerrero, Y.T. An Evolutionary Remedy for an Abominable Physiological Mystery: Benign Hyperglycemia in Birds. J. Mol. Evol. 2020, 88, 715–719. [Google Scholar] [CrossRef]
- Pierce, B.G.; Wiehe, K.; Hwang, H.; Kim, B.H.; Vreven, T.; Weng, Z. ZDOCK server: Interactive docking prediction of protein-protein complexes and symmetric multimers. Bioinformatics 2014, 30, 1771–1773. [Google Scholar] [CrossRef]
- Vreven, T.; Pierce, B.G.; Hwang, H.; Weng, Z. Performance of ZDOCK in CAPRI rounds 20–26. Proteins 2013, 81, 2175–2182. [Google Scholar] [CrossRef] [PubMed]
- Vreven, T.; Pierce, B.G.; Borrman, T.M.; Weng, Z. Performance of ZDOCK and IRAD in CAPRI rounds 28–34. Proteins 2017, 85, 408–416. [Google Scholar] [CrossRef] [PubMed]
- Vreven, T.; Vangaveti, S.; Borrman, T.M.; Gaines, J.C.; Weng, Z. Performance of ZDOCK and IRAD in CAPRI rounds 39–45. Proteins 2020, 88, 1050–1054. [Google Scholar] [CrossRef] [PubMed]
- Belinskaia, D.A.; Voronina, P.A.; Shmurak, V.I.; Jenkins, R.O.; Goncharov, N.V. Serum Albumin in Health and Disease: Esterase, Antioxidant, Transporting and Signaling Properties. Int. J. Mol. Sci. 2021, 22, 10318. [Google Scholar] [CrossRef]
- Gutowska, K.; Czajkowski, K.; Kuryłowicz, A. Receptor for the Advanced Glycation End Products (RAGE) Pathway in Adipose Tissue Metabolism. Int. J. Mol. Sci. 2023, 24, 10982. [Google Scholar] [CrossRef] [PubMed]
- Oldfield, M.D.; Bach, L.A.; Forbes, J.M.; Nikolic-Paterson, D.; McRobert, A.; Thallas, V.; Atkins, R.C.; Osicka, T.; Jerums, G.; Cooper, M.E. Advanced glycation end products cause epithelial-myofibroblast transdifferentiation via the receptor for advanced glycation end products (RAGE). J. Clin. Investig. 2001, 108, 1853–1863. [Google Scholar] [CrossRef]
- Tramarin, A.; Naldi, M.; Degani, G.; Lupu, L.; Wiegand, P.; Mazzolari, A.; Altomare, A.; Aldini, G.; Popolo, L.; Vistoli, G.; et al. Unveiling the molecular mechanisms underpinning biorecognition of early-glycated human serum albumin and receptor for advanced glycation end products. Anal. Bioanal. Chem. 2020, 412, 4245–4259. [Google Scholar] [CrossRef]
- Mol, M.; Degani, G.; Coppa, C.; Baron, G.; Popolo, L.; Carini, M.; Aldini, G.; Vistoli, G.; Altomare, A. Advanced lipoxidation end products (ALEs) as RAGE binders: Mass spectrometric and computational studies to explain the reasons why. Redox Biol. 2019, 23, 101083. [Google Scholar] [CrossRef]
- Goncharov, N.V.; Terpilovskii, M.A.; Belinskaya, D.A.; Shmurak, V.I.; Avdonin, P.V. Comparative analysis of esterase and paraoxonase activities of different serum albumin species. J. Evol. Biochem. Physiol. 2017, 53, 271–281. [Google Scholar] [CrossRef]
- Batalova, N.A. Modulation of Esterase Activity of Serum Albumin. Ph.D. Thesis, V.I. Vernadsky Crimean Federal University, Simferopol, Republic of Crimea, 2023. (In Russian). [Google Scholar]
- Xu, L.; Zang, P.; Feng, B.; Qian, Q. Atorvastatin inhibits the expression of RAGE induced by advanced glycation end products on aortas in healthy Sprague-Dawley rats. Diabetol. Metab. Syndr. 2014, 6, 102. [Google Scholar] [CrossRef] [PubMed]
- Adamopoulos, C.; Piperi, C.; Gargalionis, A.N.; Dalagiorgou, G.; Spilioti, E.; Korkolopoulou, P.; Diamanti-Kandarakis, E.; Papavassiliou, A.G. Advanced glycation end products upregulate lysyl oxidase and endothelin-1 in human aortic endothelial cells via parallel activation of ERK1/2-NF-κB and JNK-AP-1 signaling pathways. Cell Mol. Life Sci. 2016, 73, 1685–1698. [Google Scholar] [CrossRef] [PubMed]
- Xue, J.; Rai, V.; Singer, D.; Chabierski, S.; Xie, J.; Reverdatto, S.; Burz, D.S.; Schmidt, A.M.; Hoffmann, R.; Shekhtman, A. Advanced glycation end product recognition by the receptor for AGEs. Structure 2011, 19, 722–732. [Google Scholar] [CrossRef] [PubMed]
- Blache, D.; Bourdon, E.; Salloignon, P.; Lucchi, G.; Ducoroy, P.; Petit, J.M.; Verges, B.; Lagrost, L. Glycated albumin with loss of fatty acid binding capacity contributes to enhanced arachidonate oxygenation and platelet hyperactivity: Relevance in patients with type 2 diabetes. Diabetes 2015, 64, 960–972. [Google Scholar] [CrossRef] [PubMed]
- Shaklai, N.; Garlick, R.L.; Bunn, H.F. Nonenzymatic glycosylation of human serum albumin alters its conformation and function. J. Biol. Chem. 1984, 259, 3812–3817. [Google Scholar] [CrossRef]
- Yamazaki, E.; Inagaki, M.; Kurita, O.; Inoue, T. Kinetics of fatty acid binding ability of glycated human serum albumin. J. Biosci. 2005, 30, 475–481. [Google Scholar] [CrossRef]
- Henning, C.; Stübner, C.; Arabi, S.H.; Reichenwallner, J.; Hinderberger, D.; Fiedler, R.; Girndt, M.; Di Sanzo, S.; Ori, A.; Glomb, M.A. Glycation Alters the Fatty Acid Binding Capacity of Human Serum Albumin. J. Agric. Food. Chem. 2022, 70, 3033–3046. [Google Scholar] [CrossRef]
- Henderson, G.C. Plasma Free Fatty Acid Concentration as a Modifiable Risk Factor for Metabolic Disease. Nutrients 2021, 13, 2590. [Google Scholar] [CrossRef]
- Lu, Z.; Li, Y.; Li, A.J.; Syn, W.K.; Wank, S.A.; Lopes-Virella, M.F.; Huang, Y. Loss of GPR40 in LDL receptor-deficient mice exacerbates high-fat diet-induced hyperlipidemia and nonalcoholic steatohepatitis. PLoS ONE 2022, 17, e0277251. [Google Scholar] [CrossRef]
- Li, H.; Herrmann, T.; Seeßle, J.; Liebisch, G.; Merle, U.; Stremmel, W.; Chamulitrat, W. Role of fatty acid transport protein 4 in metabolic tissues: Insights into obesity and fatty liver disease. Biosci. Rep. 2022, 42, BSR20211854. [Google Scholar] [CrossRef]
- Belinskaia, D.A.; Voronina, P.A.; Shmurak, V.I.; Vovk, M.A.; Batalova, A.A.; Jenkins, R.O.; Goncharov, N.V. The Universal Soldier: Enzymatic and Non-Enzymatic Antioxidant Functions of Serum Albumin. Antioxidants 2020, 9, 966. [Google Scholar] [CrossRef]
- Di Simplicio, P.; Frosali, S.; Priora, R.; Summa, D.; Cherubini Di Simplicio, F.; Di Giuseppe, D.; Di Stefano, A. Biochemical and biological aspects of protein thiolation in cells and plasma. Antioxid. Redox Signal. 2005, 7, 951–963. [Google Scholar] [CrossRef]
- Nagumo, K.; Tanaka, M.; Chuang, V.T.G.; Setoyama, H.; Watanabe, H.; Yamada, N.; Kubota, K.; Matsushita, K.; Yoshida, A.; Jinnouchi, H.; et al. Cys34-Cysteinylated Human Serum Albumin Is a Sensitive Plasma Marker in Oxidative Stress-Related Chronic Diseases. PLoS ONE 2014, 9, e85216. [Google Scholar] [CrossRef]
- Bourdon, E.; Loreau, N.; Blache, D. Glucose and free radicals impair the antioxidant properties of serum albumin. FASEB J. 1999, 13, 233–244. [Google Scholar] [CrossRef]
- Chesne, S.; Rondeau, P.; Armenta, S.; Bourdon, E. Effects of oxidative modifications induced by the glycation of bovine serum albumin on its structure and on cultured adipose cells. Biochimie 2006, 88, 1467–1477. [Google Scholar] [CrossRef] [PubMed]
- Rondeau, P.; Singh, N.R.; Caillens, H.; Tallet, F.; Bourdon, E. Oxidative stresses induced by glycoxidized human or bovine serum albumin on human monocytes. Free Radic. Biol. Med. 2008, 45, 799–812. [Google Scholar] [CrossRef] [PubMed]
- Martinez Fernandez, A.; Regazzoni, L.; Brioschi, M.; Gianazza, E.; Agostoni, P.; Aldini, G.; Banfi, C. Pro-oxidant and pro-inflammatory effects of glycated albumin on cardiomyocytes. Free Radic. Biol. Med. 2019, 144, 245–255. [Google Scholar] [CrossRef]
- Rondeau, P.; Bourdon, E. The glycation of albumin: Structural and functional impacts. Biochimie 2011, 93, 645–658. [Google Scholar] [CrossRef] [PubMed]
- Jeevanandam, J.; Burra, V.L.S.P.; Saraswathi, N.T. Conformational variation of site specific glycated albumin: A Molecular dynamics approach. Comput. Biol. Med. 2023, 164, 107276. [Google Scholar] [CrossRef]
- Lyons, T.J.; Jenkins, A.J. Glycation, oxidation, and lipoxidation in the development of the complications of diabetes: A carbonyl stress hypothesis. Diabetes Rev. 1997, 5, 365–391. [Google Scholar]
- Ascenzi, P.; Fasano, M. Allostery in a monomeric protein: The case of human serum albumin. Biophys. Chem. 2010, 148, 16–22. [Google Scholar] [CrossRef] [PubMed]
- Baraka-Vidot, J.; Guerin-Dubourg, A.; Bourdon, E.; Rondeau, P. Impaired drug-binding capacities of in vitro and in vivo glycated albumin. Biochimie 2012, 94, 1960–1967. [Google Scholar] [CrossRef] [PubMed]
- Hanwell, M.D.; Curtis, D.E.; Lonie, D.C.; Vandermeersch, T.; Zurek, E.; Hutchison, G.R. Avogadro: An advanced semantic chemical editor, visualization, and analysis platform. J. Cheminform. 2012, 4, 17. [Google Scholar] [CrossRef]
- Humphrey, W.; Dalke, A.; Schulten, K. VMD: Visual molecular dynamics. J. Mol. Graph. 1996, 14, 28–33. [Google Scholar] [CrossRef]
- Foloppe, N.; MacKerell, A.D., Jr. All-atom empirical force field for nucleic acids: I. Parameter optimization based on small molecule and condensed phase macromolecular target data. J. Comput. Chem. 2000, 21, 86–104. [Google Scholar] [CrossRef]
- Eberhardt, J.; Santos-Martins, D.; Tillack, A.F.; Forli, S. AutoDock Vina 1.2.0: New Docking Methods, Expanded Force Field, and Python Bindings. J. Chem. Inf. Model. 2021, 61, 3891–3898. [Google Scholar] [CrossRef]
- Pierce, B.G.; Hourai, Y.; Weng, Z. Accelerating protein docking in ZDOCK using an advanced 3D convolution library. PLoS ONE 2011, 6, e24657. [Google Scholar] [CrossRef]
- Jorgensen, W.L. Quantum and statistical mechanical studies of liquids. 10. Transferable intermolecular potential functions for water, alcohols, and ethers. Application to liquid water. J. Am. Chem. Soc. 1981, 103, 335–340. [Google Scholar] [CrossRef]
- Bussi, G.; Zykova-Timan, T.; Parrinello, M. Isothermal-isobaric molecular dynamics using stochastic velocity rescaling. J. Chem. Phys. 2009, 130, 074101. [Google Scholar] [CrossRef]
- Parrinello, M.; Rahman, A. Polymorphic Transitions in Single Crystals: A New Molecular Dynamics Method. J. Appl. Phys. 1981, 52, 7182–7190. [Google Scholar] [CrossRef]
- Darden, T.; York, D.; Pedersen, L. Particle mesh Ewald: An N⋅log(N) method for Ewald sums in large systems. J. Chem. Phys. 1993, 3, 10089–10092. [Google Scholar] [CrossRef]
- Hess, B.; Bekker, H.; Berendsen, H.J.C.; Fraaije, J.G.E.M. LINCS: A linear constraint solver for molecular simulations. J. Comput. Chem. 1997, 18, 1463–1473. [Google Scholar] [CrossRef]
- Laskowski, R.A.; Swindells, M.B. LigPlot+: Multiple ligand-protein interaction diagrams for drug discovery. J. Chem. Inf. Model. 2011, 51, 2778–2786. [Google Scholar] [CrossRef] [PubMed]


| PDB Entry | Structure Determination Method | Description of the Structure | Reference |
|---|---|---|---|
| 2M1K | NMR | Dimer of the V-domain of RAGE in complex with dimer of protein S100A6 | [13] |
| 2MJW | NMR | Dimer of the V-domain of RAGE in complex with dimer of protein S100P | [14] |
| 4OI7 and 4OI8 | X-Ray | Dimer of the VC1-domains of RAGE in complex with DNA | [15] |
| Glycated Lys of gHSA | ZDOCK Score |
|---|---|
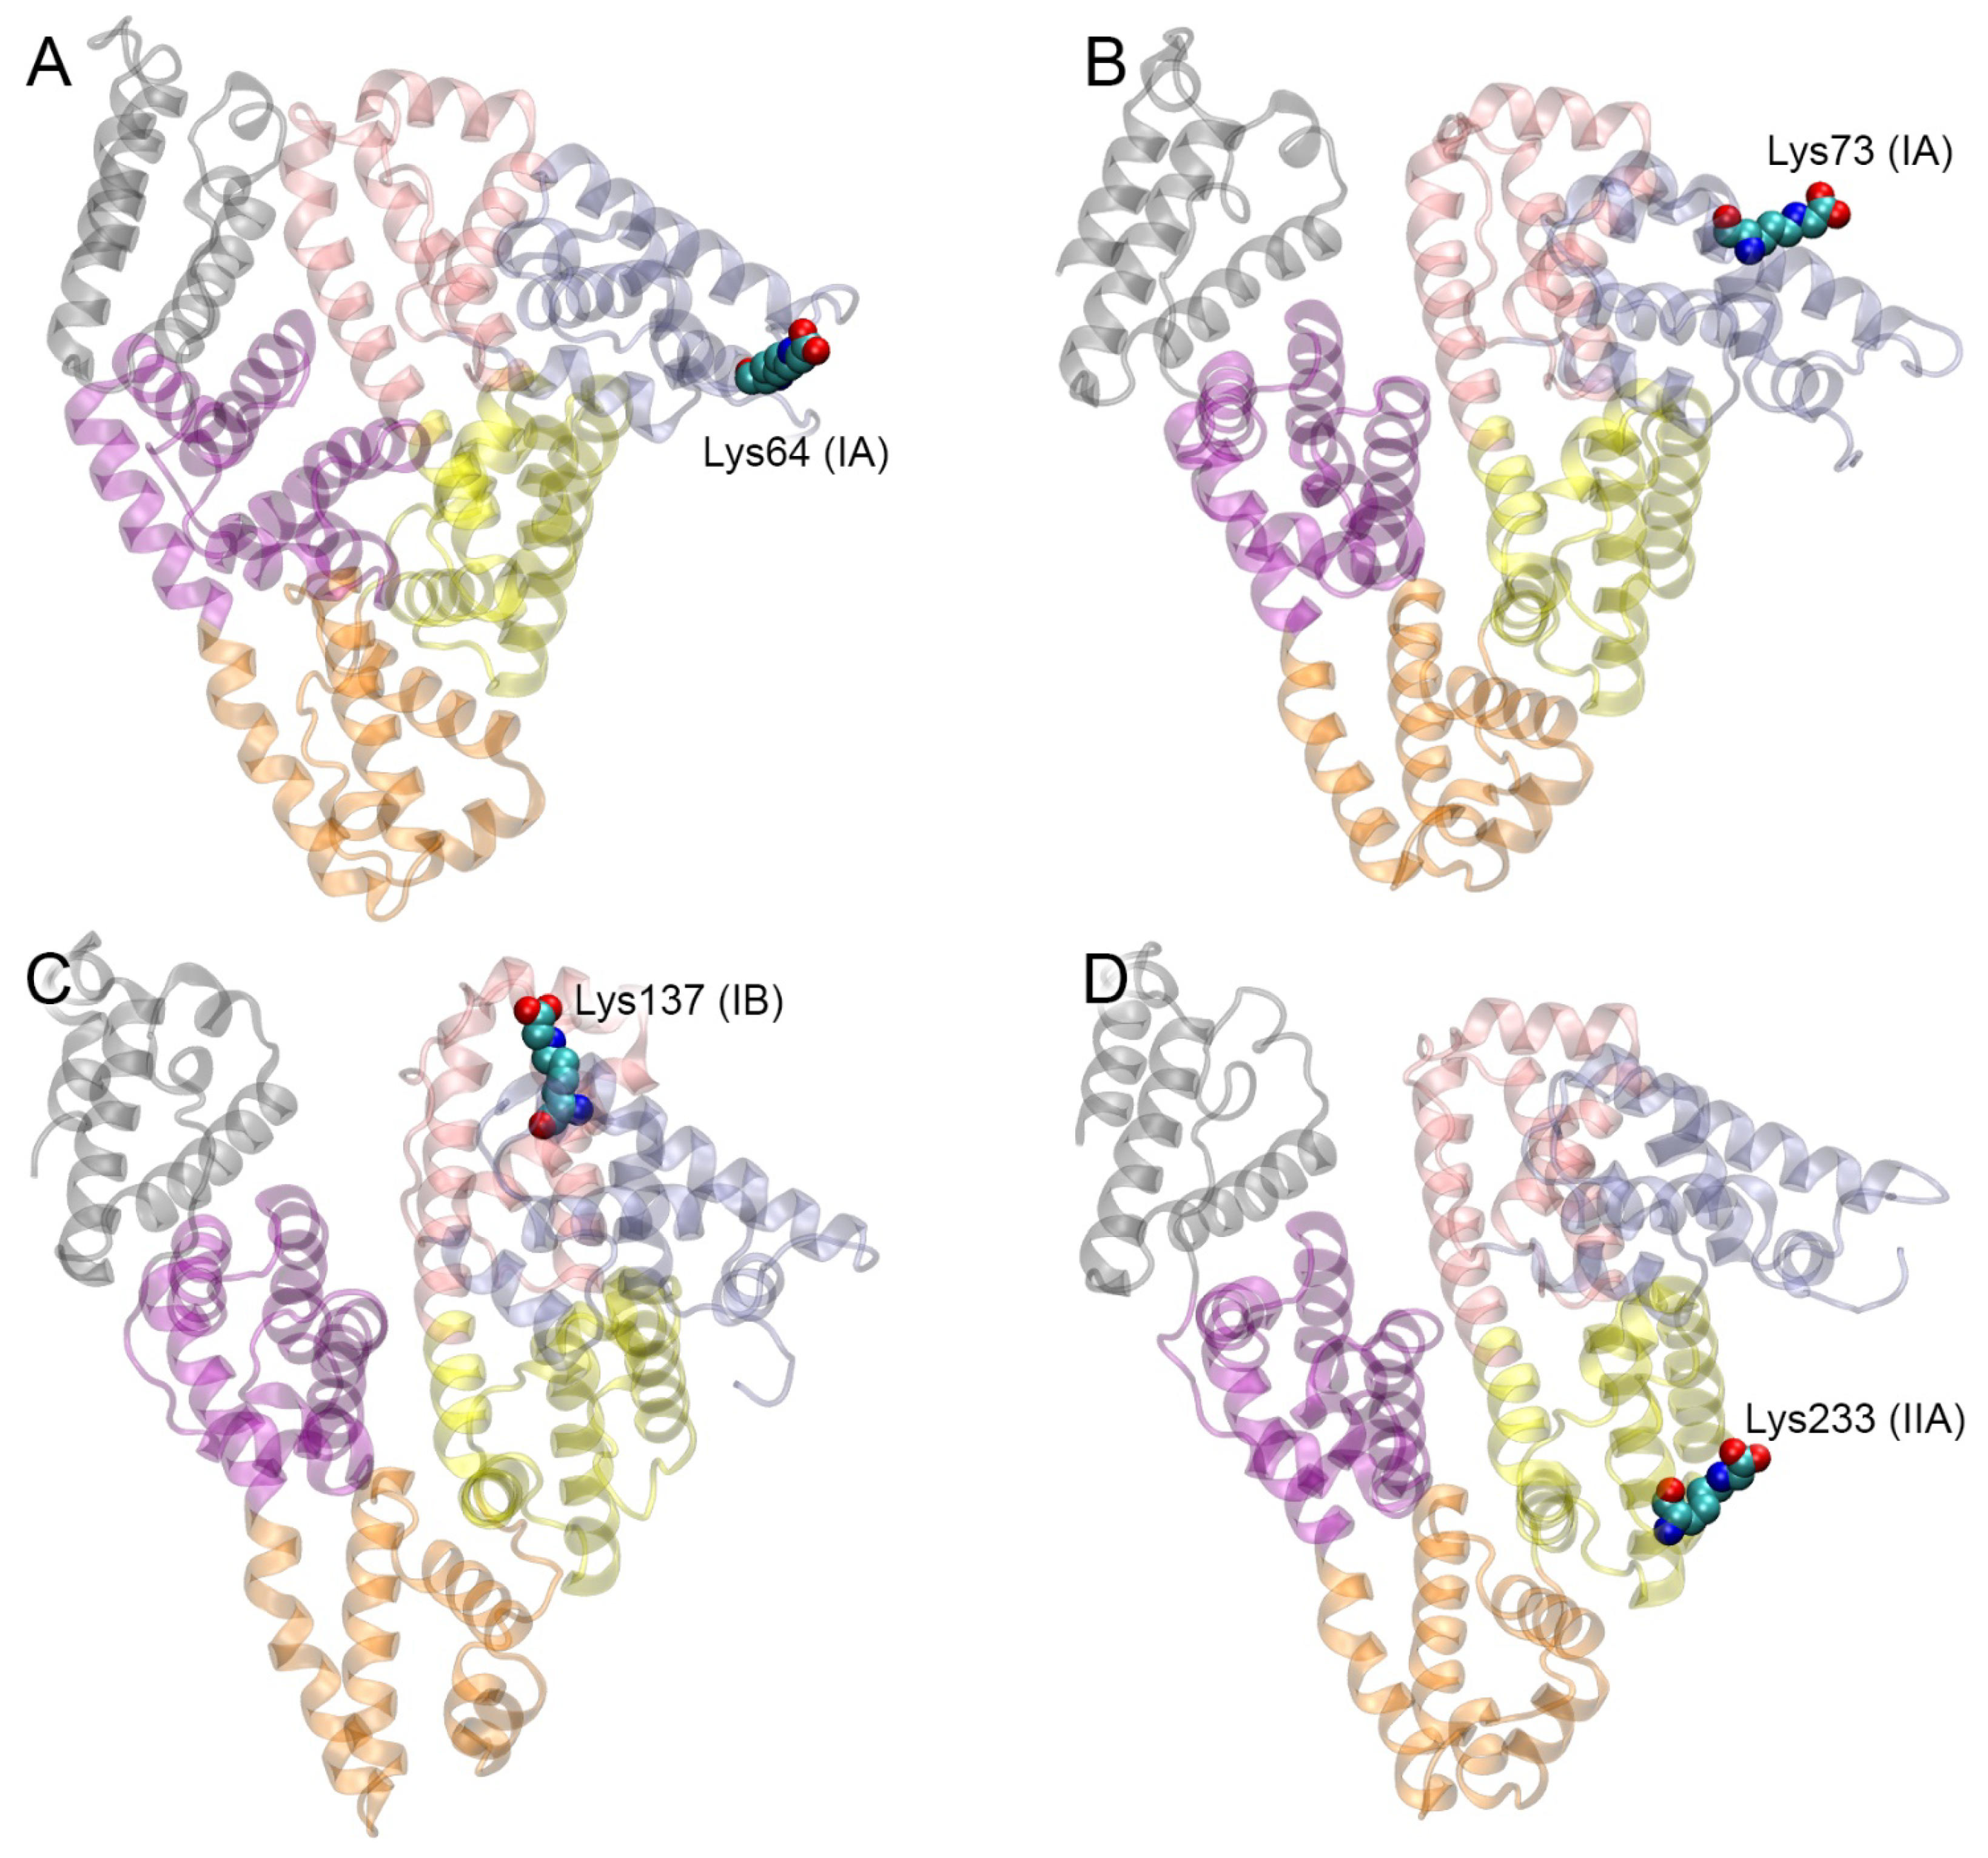
| Lys64 | 741.0 |
| Lys73 | 888.3 |
| Lys137 | 1011.2 |
| Lys233 | 1059.3 |
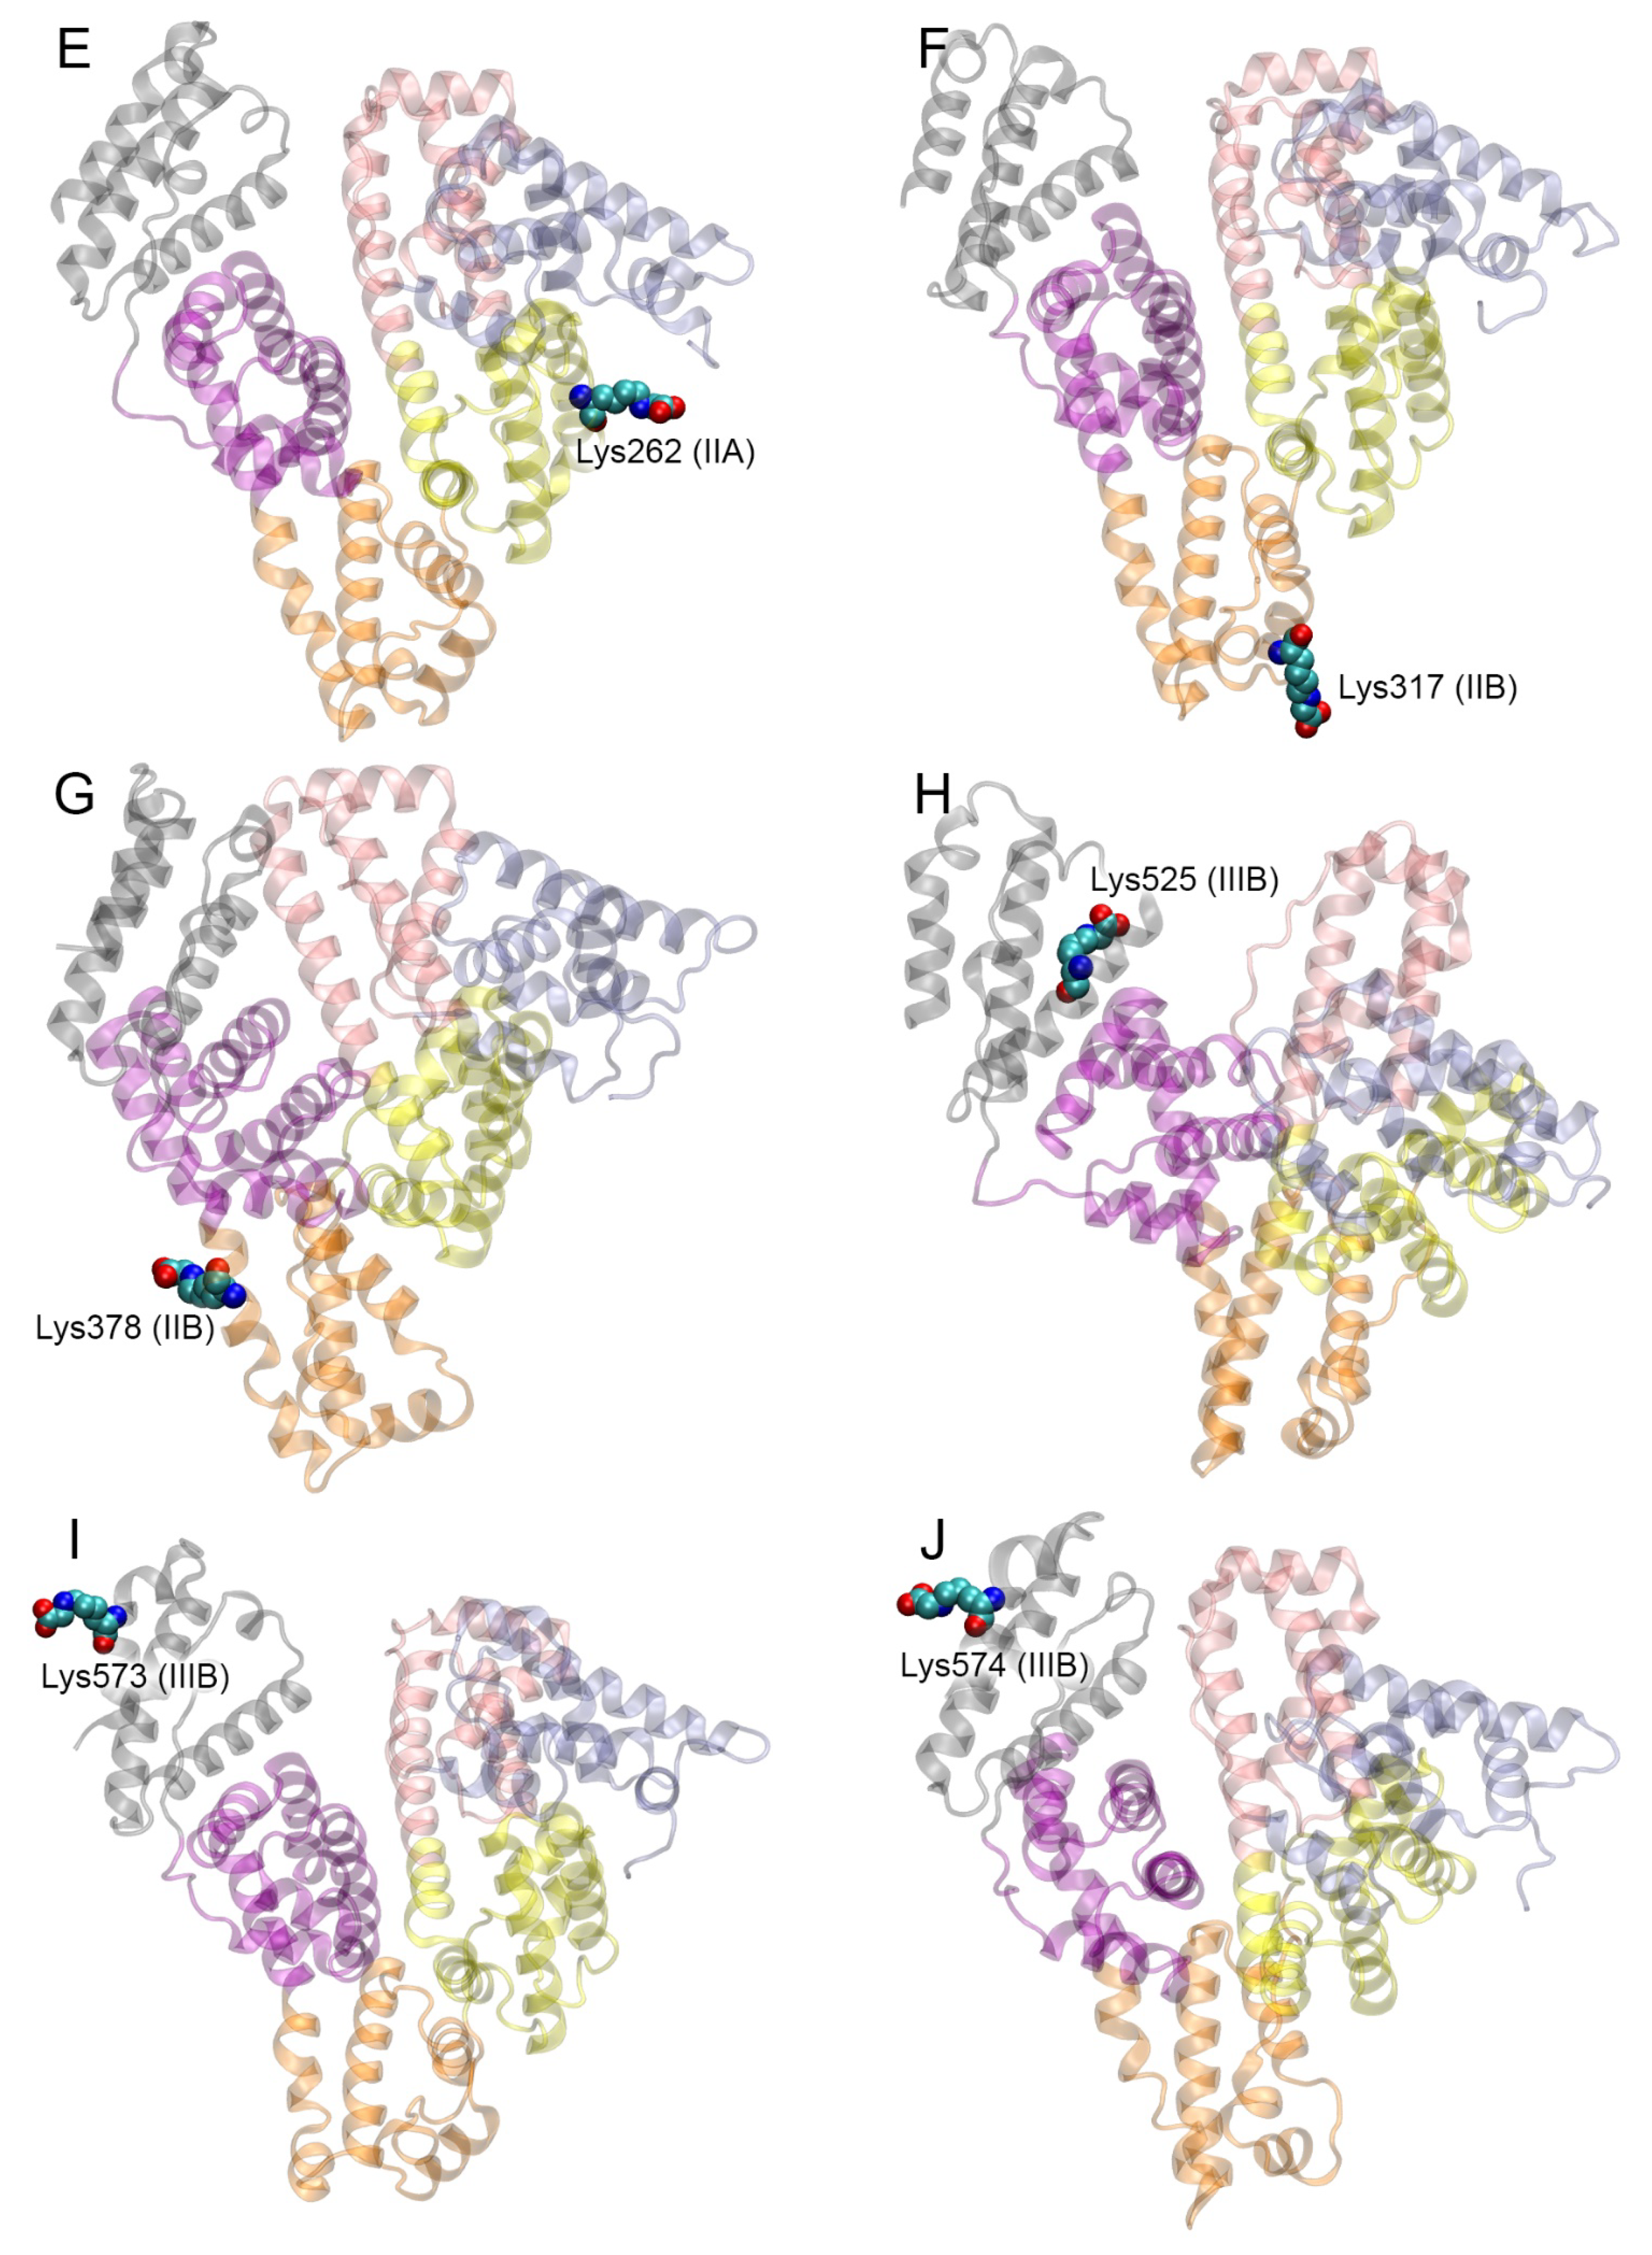
| Lys262 | 963.0 |
| Lys317 | 1034.8 |
| Lys378 | 878.7 |
| Lys525 | 828.5 |
| Lys573 | 895.5 |
| Lys574 | 828.6 |
| Glycated Lys of gHSA | gHSA | RAGE | Specific Contacts gHSA-RAGE |
|---|---|---|---|
| Lys64 | 63 Glu48, Glu45, Lys64, Asp72, Thr76, Val77, Glu86, Cys91, Val92, Lys93, Gln94, Glu95 | 73 Arg48, Lys52, Glu59, Ala60, Trp61, Lys62, Arg98, Lys107 | Glu45-Arg48 (SB, 100%); Glu48-Lys107 (SB, 30%); Lys64-Lys52 (SB, 80%); Lys64-Arg98 (SB, 95%); Asp72-Lys52 (SB, 80%); Glu86-Lys62 (SB, 50%); Glu95-Lys52 (SB, 70%) |
| Lys73 | 66 Glu37, Asp38, Val40, Lys41, Glu45, Lys73, Glu82, Val122, Thr125, Ala126, Asp129, Thr133 | 68 Gln24, Asn25, Lys37, Lys39, Arg114, Arg116 | Glu37-Gln24 (HB, 40%); Asp38-Lys37 (SB, 40%); Glu45-Lys39 (SB, 65%); Lys73-Lys39 (SB, 30%); Glu82-Lys37 (SB, 40%); Asp129-Arg114 (SB, 85%); Asp129-Arg116 (SB, 60%) |
| Lys137 | 68 Glu37, Pro35, Asp38, Glu82, Thr83, Tyr84, Arg114, Val122, Thr125, Lys137 | 58 Lys44, Gln47, Arg48, Gln67, Met102, Arg104, Asn105, Glu108, | Glu37-Arg48 (SB, 5%); Asp38-Arg104 (SB, 50%); Asp38-Gln47 (HB, 10%); Glu82-Lys44 (SB, 5%); Glu83-Asn105 (HB, 5%); Arg114-Glu108 (SB, 20%); Lys137-Arg48 (SB, 95%) |
| Lys233 | 104 His3, Lys4, Glu6, His9, Glu208, Lys212, Glu230, Lys233, Thr236, Asp237, Lys240, Glu252, Asp255, Asp256, Asp259, Lys262, Glu266, Asn267 | 103 Gln24, Val35, Lys37, Lys39, Lys43, Leu79, Pro80, Asn81, Lys107, Glu108, Thr109, Lys110, Ser111, Tyr113 | His3-Asn81 (HB, 95%); Glu6-Lys83 (SB, 95%); Glu208-Lys107 (SB, 95%); Lys212-Glu108 (SB, 75%); Glu230-Lys110 (SB, 20%); Lys233-Lys39 (SB, 80%); Lys233-Ser111 (HB, 65%); Lys233-Tyr113 (HB, 40%); Thr236-Glu108 (HB, 60%); Asp237-Lys39 (SB, 80%); Glu252-Lys43 (SB, 98%); Asp255-Lys37 (SB, 60%); Asp256-Lys37 (SB, 60%); Asp259-Lys37 (SB, 60%) |
| Lys262 | 65 Asp13, Lys233, Thr236, Asp237, Glu252, Asp255, Asp256, Asp259, Lys262, Tyr263, Glu266 | 54 Lys39, Lys43, Lys44, Asn105, Gly106, Lys107, Glu108 | Asp13-Lys43 (SB, 90%); Lys233-Glu108 (SB, 90%); Thr236-Asn105 (HB, 90%); Glu252-Lys44 (SB, 70%); Asp255-Lys43 (SB, 90%); Asp256-Lys44 (SB, 75%); Asp259-Lys107 (SB, 10%); Lys262-Lys39 (SB, 10%); Tyr263-Glu108 (HB, 90%); Glu266-Lys39 (SB, 70%) |
| Lys317 | 21 Ala229, Glu230, Lys233, Asp259 | 27 Gln24, Lys39, Lys107, Ser111 | Glu230-Lys39 (SB, 2%); Lys233-Ser111 (HB, 10%); Asp259-Lys107 (SB, 70%) |
| Lys378 | 116 Glu297, Ala300, Pro303, Ala306, Ala307, Glu311, Asp340, Phe374, Asp375, Lys378, Val381, Gln385, Pro441, Glu442, Met446 | 109 Arg29, Glu32, Pro33, Leu34, Val35, Lys37, Lys39, Pro46, Arg48, Arg77, Val78, Pro80, Asn81, Phe85 | Glu297-Lys39 (SB, 50%); Glu311-Arg29 (SB, 80%); Phe374-Phe85 (PP, 20%); Asp375-Arg77 (SB, 95%); Lys378-Arg77 (SB, 20%); Gln385-Pro80 (HB, 60%); Glu442-Arg48 (SB, 30%) |
| Lys525 | 101 Glu119, Asp173, Ala175, Ala176, Leu179, Pro180, Asp183, Glu184, Arg186, Glu518, Lys519, Glu520, Lys525, Gln522, Lys560, Asp562 | 109 Lys39, Gly40, Pro42, Lys44, Arg48, Lys52, Arg57, Glu59, Met102, Arg104, Asn105, Gly106, Lys107, Glu108, Thr109 | Glu119-Lys107 (SB, 80%); Asp173-Lys39 (SB, 90%); Asp183-Asn105 (HB, 60%); Glu184-Lys44 (SB, 65%); Glu518-Lys52 (SB, 80%); Lys519-Glu108 (SB, 90%); Glu520-Arg104 (SB, 80%); Lys525-Arg48 (SB, 5%); Asp562-Arg57 (SB, 90%) |
| Lys573 | 47 Pro113, Arg114, Leu115, Val116, Ala511, Asp512, Glu565, Thr566, Ala569, Lys573 | 59 Arg29, Pro33, Pro66, Gln67, Arg77, Leu79, Phe85 | Val116-Pro66 (HB, 5%); Asp512-Arg77 (SB, 50%); Lys573-Arg29 (SB, 30%); Glu565-Arg77 (SB, 70%) |
| Lys574 | 142 Phe36, Glu37, Tyr84, Leu112, Arg114, Leu115, Val116, Asp121, Val122, Thr125, Asp129, Lys137, Tyr140, Glu505, Thr508, His510, Ala511, Glu565, Phe568, Ala569, Lys573 | 139 Gly31, Glu32, Pro33, Val35, Lys37, Lys43, Pro45, Pro46, Arg48, Gln67, Ser74, Arg77, Leu79, Pro80, Phe85, Arg104 | Asp129-Arg104 (SB, 80%); Asp121-Lys43 (SB, 20%); Glu37-Arg48 (SB, 60%); Glu565-Lys37 (SB, 90%); Glu505-Arg77 (SB, 70%); Phe36-Gln67 (HB, 30%); Tyr140-Gln67 (HB, 60%); Lys573-Gly31 (HB, 80%); Arg114-Ser74 (HB, 10%) |
| Lys64 | Lys137 | Lys233 | Lys262 | Lys378 | Lys525 | Lys573 | |
|---|---|---|---|---|---|---|---|
| Lys64 | – | – | – | – | – | – | – |
| Lys137 | 229 | – | – | – | – | – | – |
| Lys233 | 185 | 191 | – | – | – | – | – |
| Lys262 | 188 | 213 | 24 * | – | – | – | – |
| Lys378 | 176 | 243 | 164 * | 114 | – | – | – |
| Lys525 | 243 | 41 | 191 | 213 | 228 | – | – |
| Lys573 | 116 | 162 * | 223 | 238 | 227 | 177 | – |
| Glycated Lys of gHSA | Major gHSA Amino Acids Involved in the Interaction with RAGE | Variability in Mammals (HSA, BSA, RSA, ESA, LSA) | Variability in Mammals and Chicken (HSA, BSA, RSA, ESA, LSA, CSA) |
|---|---|---|---|
| Lys64 | Glu45 | * | : |
| Glu48 | : | : | |
| Lys64 | * | * | |
| Asp72 | * | * | |
| Glu86 | : | - | |
| Glu95 | * | * | |
| Lys233 | His3 | * | * |
| Glu6 | * | * | |
| Glu208 | : | : | |
| Lys212 | * | : | |
| Glu230 | : | : | |
| Lys233 | * | * | |
| Thr236 | * | - | |
| Asp237 | * | * | |
| Glu252 | * | * | |
| Asp255 | * | * | |
| Asp256 | * | * | |
| Asp259 | * | - | |
| Lys262 | Asp13 | * | * |
| Lys233 | * | * | |
| Thr236 | * | - | |
| Glu252 | * | * | |
| Asp255 | * | * | |
| Asp256 | * | * | |
| Asp259 | * | - | |
| Lys262 | * | . | |
| Tyr263 | * | - | |
| Glu266 | : | . | |
| Lys378 | Glu297 | - | - |
| Glu311 | * | * | |
| Phe374 | - | - | |
| Asp375 | - | - | |
| Lys378 | - | - | |
| Gln385 | : | : | |
| Glu442 | * | * | |
| Lys525 | Glu119 | : | - |
| Asp173 | * | * | |
| Asp183 | : | - | |
| Glu184 | - | - | |
| Glu518 | : | - | |
| Lys519 | - | - | |
| Glu520 | * | * | |
| Lys525 | * | : | |
| Asp562 | - | - |
| Albumin | Total Number of Lysines | Total Number of Lysines on the Protein Surface Available for Interaction with RAGE |
|---|---|---|
| HSA | 59 | 43 |
| BSA | 59 | 47 |
| RSA | 53 | 39 |
| ESA | 59 | 50 |
| LSA | 57 | 48 |
| CSA | 47 | 36 |
Disclaimer/Publisher’s Note: The statements, opinions and data contained in all publications are solely those of the individual author(s) and contributor(s) and not of MDPI and/or the editor(s). MDPI and/or the editor(s) disclaim responsibility for any injury to people or property resulting from any ideas, methods, instructions or products referred to in the content. |
© 2024 by the authors. Licensee MDPI, Basel, Switzerland. This article is an open access article distributed under the terms and conditions of the Creative Commons Attribution (CC BY) license (https://creativecommons.org/licenses/by/4.0/).
Share and Cite
Belinskaia, D.A.; Jenkins, R.O.; Goncharov, N.V. Molecular Basis for the Involvement of Mammalian Serum Albumin in the AGE/RAGE Axis: A Comprehensive Computational Study. Int. J. Mol. Sci. 2024, 25, 3204. https://doi.org/10.3390/ijms25063204
Belinskaia DA, Jenkins RO, Goncharov NV. Molecular Basis for the Involvement of Mammalian Serum Albumin in the AGE/RAGE Axis: A Comprehensive Computational Study. International Journal of Molecular Sciences. 2024; 25(6):3204. https://doi.org/10.3390/ijms25063204
Chicago/Turabian StyleBelinskaia, Daria A., Richard O. Jenkins, and Nikolay V. Goncharov. 2024. "Molecular Basis for the Involvement of Mammalian Serum Albumin in the AGE/RAGE Axis: A Comprehensive Computational Study" International Journal of Molecular Sciences 25, no. 6: 3204. https://doi.org/10.3390/ijms25063204
APA StyleBelinskaia, D. A., Jenkins, R. O., & Goncharov, N. V. (2024). Molecular Basis for the Involvement of Mammalian Serum Albumin in the AGE/RAGE Axis: A Comprehensive Computational Study. International Journal of Molecular Sciences, 25(6), 3204. https://doi.org/10.3390/ijms25063204