Article

MiR-290 Family Maintains Pluripotency and Self-Renewal by Regulating MAPK Signaling Pathway in Intermediate Pluripotent Stem Cells

State Key Laboratory of Reproductive Regulation and Breeding of Grassland Livestock (RRBGL), Inner Mongolia University, Hohhot 010070, China
*
Author to whom correspondence should be addressed.
These authors contributed equally to this work.
Int. J. Mol. Sci. 2024, 25(5), 2681; https://doi.org/10.3390/ijms25052681
Submission received: 1 November 2023 / Revised: 21 November 2023 / Accepted: 23 November 2023 / Published: 26 February 2024
(This article belongs to the Topic Pluripotent Stem Cells)

Abstract

:
Mouse embryonic stem cells (ESCs) and epiblast stem cells (EpiSCs) are derived from pre- and post-implantation embryos, representing the initial “naïve” and final “primed” states of pluripotency, respectively. In this study, novel reprogrammed pluripotent stem cells (rPSCs) were induced from mouse EpiSCs using a chemically defined medium containing mouse LIF, BMP4, CHIR99021, XAV939, and SB203580. The rPSCs exhibited domed clones and expressed key pluripotency genes, with both X chromosomes active in female cells. Furthermore, rPSCs differentiated into cells of all three germ layers in vivo through teratoma formation. Regarding epigenetic modifications, the DNA methylation of Oct4, Sox2, and Nanog promoter regions and the mRNA levels of Dnmt3a, Dnmt3b, and Dnmt1 were reduced in rPSCs compared with EpiSCs. However, the miR-290 family was significantly upregulated in rPSCs. After removing SB203580, an inhibitor of the p38 MAPK pathway, the cell colonies changed from domed to flat, with a significant decrease in the expression of pluripotency genes and the miR-290 family. Conversely, overexpression of pri-miR-290 reversed these changes. In addition, Map2k6 was identified as a direct target gene of miR-291b-3p, indicating that the miR-290 family maintains pluripotency and self-renewal in rPSCs by regulating the MAPK signaling pathway.

1. Introduction

Pluripotent stem cells (PSCs) possess two remarkable properties: indefinite self-renewal capacity and pluripotency, which enable them to give rise to all tissues in the adult body. Pluripotency is a dynamic process that evolves during different stages of pre- and post-implantation development [1]. Consequently, the derivation and characterization of distinct pluripotent states in research on PSCs have become exciting areas of investigation [2]. Two types of pluripotent cells can be captured from a mouse embryo at different stages: mouse embryonic stem cells (ESCs) from the inner cell mass (ICM) of a blastocyst at E3.5, representing the naïve state of pluripotency, and epiblast stem cells (EpiSCs) from the late epiblast layer of a post-implantation embryo at E5.5–E7.5, representing the primed state of pluripotency [3,4]. Despite both referring to pluripotency, they differ markedly in morphology, gene expression profile, conditions for maintenance, epigenetic state, chimeric competence, and germline contribution [5]. PSCs provide invaluable in vitro cell models for understanding early mammalian development and hold great potential for regenerative medicine.
The maintenance and preservation of naive or primed PSCs can be achieved by modulating growth conditions in vitro. Naïve pluripotency in ESCs culture is supported by LIF and either serum or inhibitors of the Erk (PD0325901) and Gsk3 (CHIR99021) pathways (known as 2i) [6]. Using 2i/LIF captures naïve pluripotency, sometimes called the pluripotent ground state [7]. The primed pluripotency of EpiSCs is maintained using Activin A and fibroblast growth factor 2 (FGF2) [4,8]. Both types of cells are pluripotent, as they can differentiate into derivatives of all three germ layers in vivo by producing teratoma. However, only ESCs can produce chimeras when injected into a blastocyst [9]. Furthermore, a significant epigenetic difference between naïve and primed states of pluripotency is that female ESCs have two active X chromosomes, while female EpiSCs already present one inactive X chromosome [10].
Recently, a third phase called formative pluripotency has been proposed to exist as part of a developmental continuum between the naïve and primed phases [11,12,13]. Formative stem cells (FSCs) correspond to a post-implantation embryo at E5.5–E5.75. Nodal/Activin and FGF signals have been identified as candidate factors that support formative pluripotency [11,12]. Key transcription factors for formative pluripotency include Otx2, Oct6, and Sox3. Interestingly, Otx2 is required for maintaining a stable formative state but is dispensable in both ESCs and EpiSCs [14]. Moreover, germ cell competency serves as a central feature to distinguish FSCs from primed EpiSCs, as FSCs directly respond to germ cell induction, unlike ESCs or EpiSCs [15,16].
The regulation of pluripotency involves an interplay of transcription factors, signaling pathways, micro-RNAs (miRNAs), and chromatin regulators. Oct4, Sox2, and Nanog are identified as core factors in the transcription factor network critical for maintaining the ESCs state [17,18,19]. LIF/Stat3, BMP4, Wnt/β-catenin, and FGF/Erk signaling pathways are involved in mouse pluripotency maintenance. Increasing evidence suggests that epigenetics has emerged as a crucial player in pluripotency maintenance, for instance, the knockout of DNA methyltransferase (Dnmt) in mouse ESCs causes DNA hypo-methylation, which can impact differentiation and lineage determination [20,21]. In addition, miRNAs are key regulators of self-renewal and differentiation in stem cells, holding as much importance as transcription factors in controlling gene expression [22].
Therefore, understanding the mechanisms underlying the different pluripotent states of PSCs, as well as studying how this unique property is retained, is essential not only for elucidating mammalian embryogenesis and cellular commitment but also for establishing therapies for regenerative medicine, disease modeling, and drug discovery. Herein, EpiSCs were successfully converted into a new type of reprogrammed PSCs (rPSCs) using a chemically defined medium consisting of LIF combined with BMP4, CHIR99021, XAV939, and SB203580. LIF and CHIR99021 improve cell culture robustness and support intermediate pluripotent cells for self-renewal [23,24]. Ying and Yu et al. demonstrate that BMP4 inhibits differentiation genes, sustains self-renewal in mouse ESCs in collaboration with STAT3, and is also essential for primed to naïve transition [25,26]. Furthermore, MAPK inhibitors support naïve pluripotency in mouse ESCs [27], while XAV939 suppresses Yap1 activity, potentially modulating multiple targets relevant to trophectoderm/inner cell mass segregation [28]. In this study, we assessed the pluripotency and differentiation potential of rPSCs while further investigating the potential mechanism of the miR-290 family in maintaining rPSCs pluripotency.

2. Results

2.1. Conversion of EpiSCs to rPSCs

Mouse EpiSCs, derived from early post-implantation embryos, exhibit distinct culture properties, gene expression, pluripotency, and epigenetic profiles compared with ESCs [4,8]. In this study, EpiSCs were derived from the epiblast tissue of female mice at E6.5 and cultured in a chemically defined medium containing Activin A and bFGF, without mouse embryonic fibroblasts (MEFs) or serum. Subsequently, EpiSCs were transferred to rPSCs medium consisting of basic N2B27 medium supplemented with mouse LIF, BMP4, CHIR99021, XAV939, and SB203580 (Figure 1A,B). After 5–7 days of culture, the domed colonies resembling ESCs morphology gradually formed (Figure 1B and Figure S1A). Domed colonies were selected with a glass needle for mechanical propagation and successfully developed into self-renewal stem cell lines for more than 30 passages in rPSCs medium. And the derivation efficiency of rPSCs was 33.3% (Figure 1C). The induced stem cells from rPSCs medium were named rPSCs, and they exhibited positive alkaline phosphatase (AP) staining, similar to ESCs, indicating their self-renewal capacity (Figure 1D and Figure S1A). The karyotype analysis showed that rPSCs maintained a normal karyotype (77.65%) (Figure 1E,F). Growth curve analysis revealed that rPSCs exhibited a proliferation rate similar to EpiSCs but faster than ESCs (Figure 1G and Figure S1B).
To characterize rPSCs, we examined the expression levels of primed pluripotency and naïve pluripotency markers. RT-qPCR analysis of rPSCs revealed high expression levels of pluripotency genes, such as Oct4 and Sox2, compared with EpiSCs or ESCs (Figure 1H and Figure S1C). Interestingly, rPSCs exhibited intermediate expression levels of markers related to naïve pluripotency, such as Klf4 and Dppa4, between those of EpiSCs and ESCs, while the primed pluripotency gene Fgf5 was barely expressed in rPSCs compared with EpiSCs (Figure S1D). Immunofluorescence assays showed that rPSCs can express OCT4, SOX2, and NANOG (Figure 1I and Figure S1E). And Western blot analysis demonstrated significantly higher protein expression levels of OCT4, SOX2, and NANOG in rPSCs compared with EpiSCs, resembling the expression levels observed in ESCs (Figure 1J,K and Figure S1F,G). In addition, RT-qPCR analysis revealed significantly decreased expression of endoderm markers (Gata6 and Sox17) and ectoderm marker K8 in rPSCs, while the expression of the mesoderm marker Hand1 was upregulated in rPSCs (Figure 1L).
Taken together, our results demonstrate that a chemically defined medium supplemented with LIF, BMP4, CHIR99021, XAV939, and SB203580 can induce the conversion of EpiSCs to rPSCs. rPSCs represent novel and distinct self-renewal type of PSCs that stably express pluripotency markers and display molecular properties similar to ESCs.

2.2. Developmental and Differentiated Potency of rPSCs

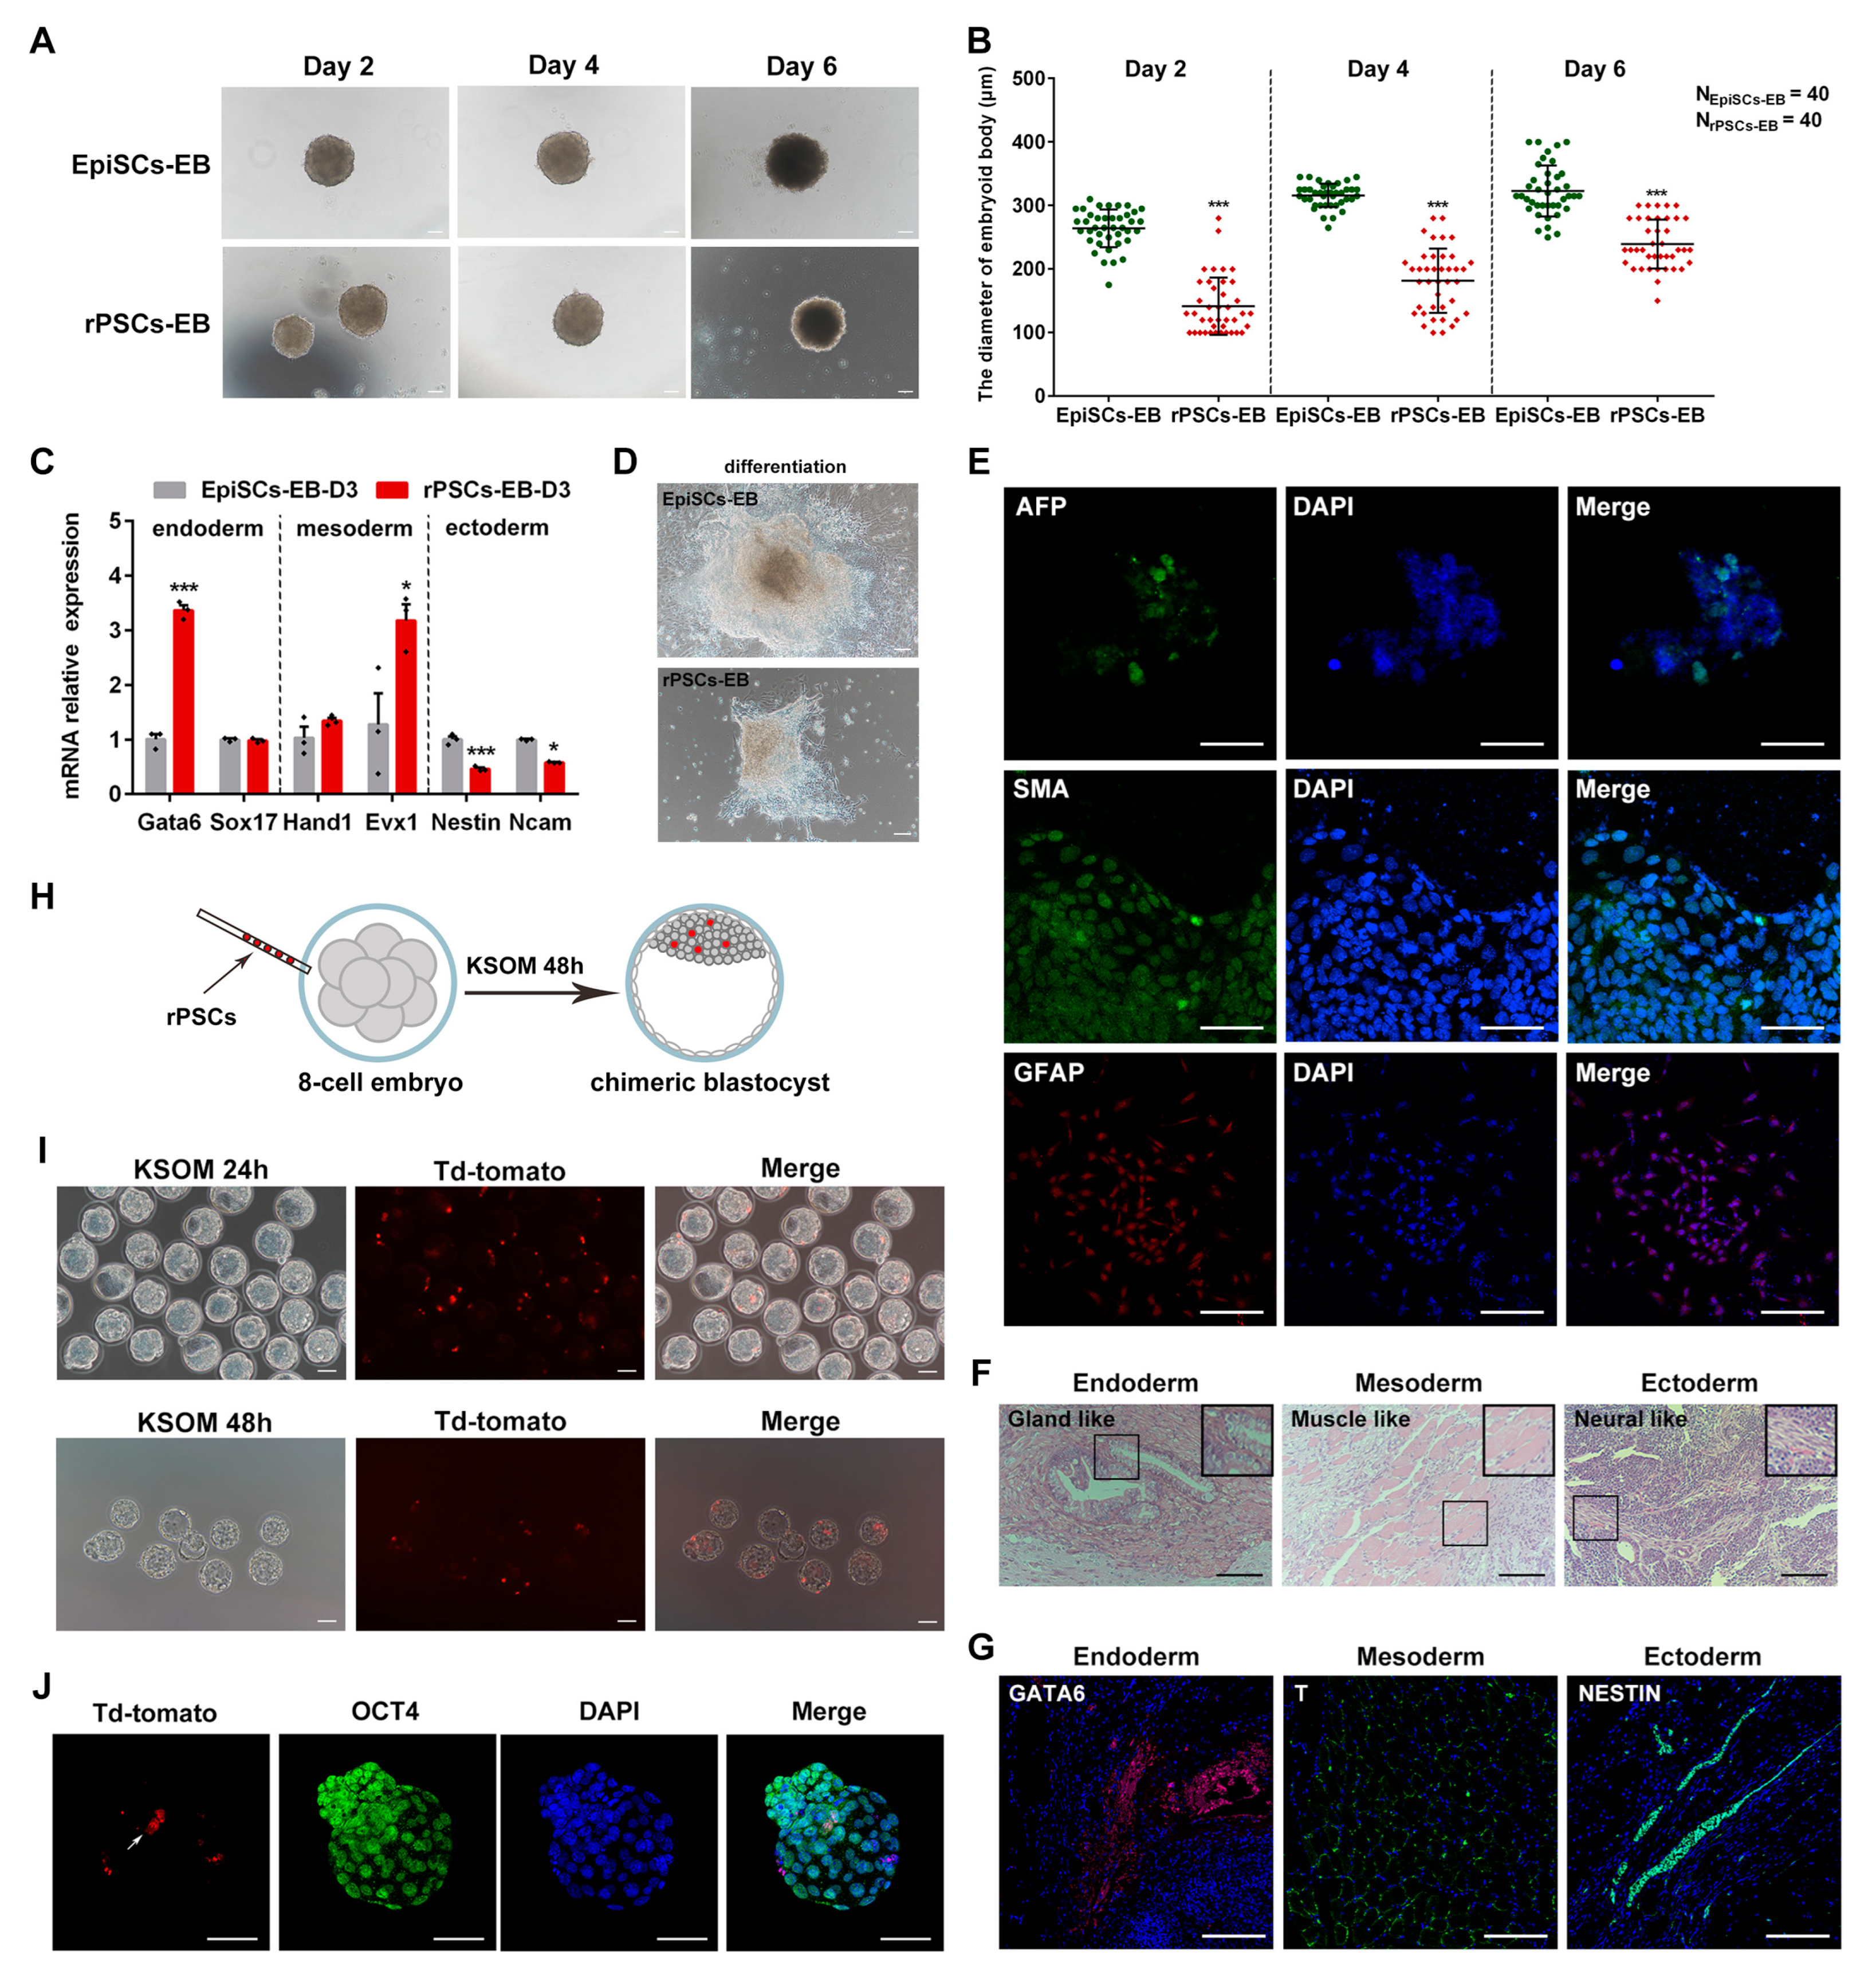
To assess the differentiated potency of rPSCs in vitro, we compared the formation of embryoid body (EB) between rPSCs, EpiSCs, and ESCs. Suspension culture was used to allow for the formation of cell clusters during spontaneous differentiation, mimicking developmental processes in vivo [29]. Our results revealed that the EB derived from rPSCs exhibited a smaller size at day 2 compared with the spherical EB derived from EpiSCs or ESCs (Figure 2A and Figure S2A). To further verify this difference, we employed the pendant-drop method to form EB. The diameter of rPSCs-derived EB (rPSCs-EB) at day 6 was approximately 250 μm, while EpiSCs-derived EB (EpiSCs-EB) and ESCs-derived EB (ESCs-EB) had diameters of around 330 μm and 300 μm, respectively (Figure 2B and Figure S2B). We also examined the expression of three germ layer markers. RT-qPCR results showed that the expression of endoderm marker Gata6 and mesoderm markers Hand1 and Evx1 in rPSCs-EB was higher than EpiSCs-EB but lower than ESCs-EB (Figure 2C and Figure S2C). In contrast, the ectoderm markers Nestin and Ncam were downregulated in rPSCs-EB compared with EpiSCs-EB (Figure 2C). Furthermore, we cultured the EB on a 24-well plate for 7 days, and immunofluorescence staining revealed that EB-differentiated cells can express the endoderm marker AFP, the mesoderm marker SMA, and the ectoderm marker GFAP (Figure 2D,E).
In addition, similar to ESCs and EpiSCs, rPSCs also generated teratoma containing derivatives of the three germ layers (Figure 2F,G and Figure S2D). To further investigate the pluripotency of rPSCs, we performed chimera tests in vivo. rPSCs were transfected with the H2B td-Tomato plasmid, and eight rPSCs were injected into 8-cell-stage mouse embryos. The embryos were then cultured in vitro for 48 h, and immunofluorescence staining showed that rPSCs can contribute to the ICM (Figure 2H–J). In contrast, EpiSCs exhibit inefficiency in contributing to chimeric tissues following blastocyst injection and display less active expression of genes related to naïve pluripotency [8]. These findings suggest that rPSCs have the potential to contribute to embryos. Taken together, our data demonstrate that the rPSCs exhibit greater developmental and differentiated potency compared with EpiSCs.

2.3. Molecular Features of rPSCs

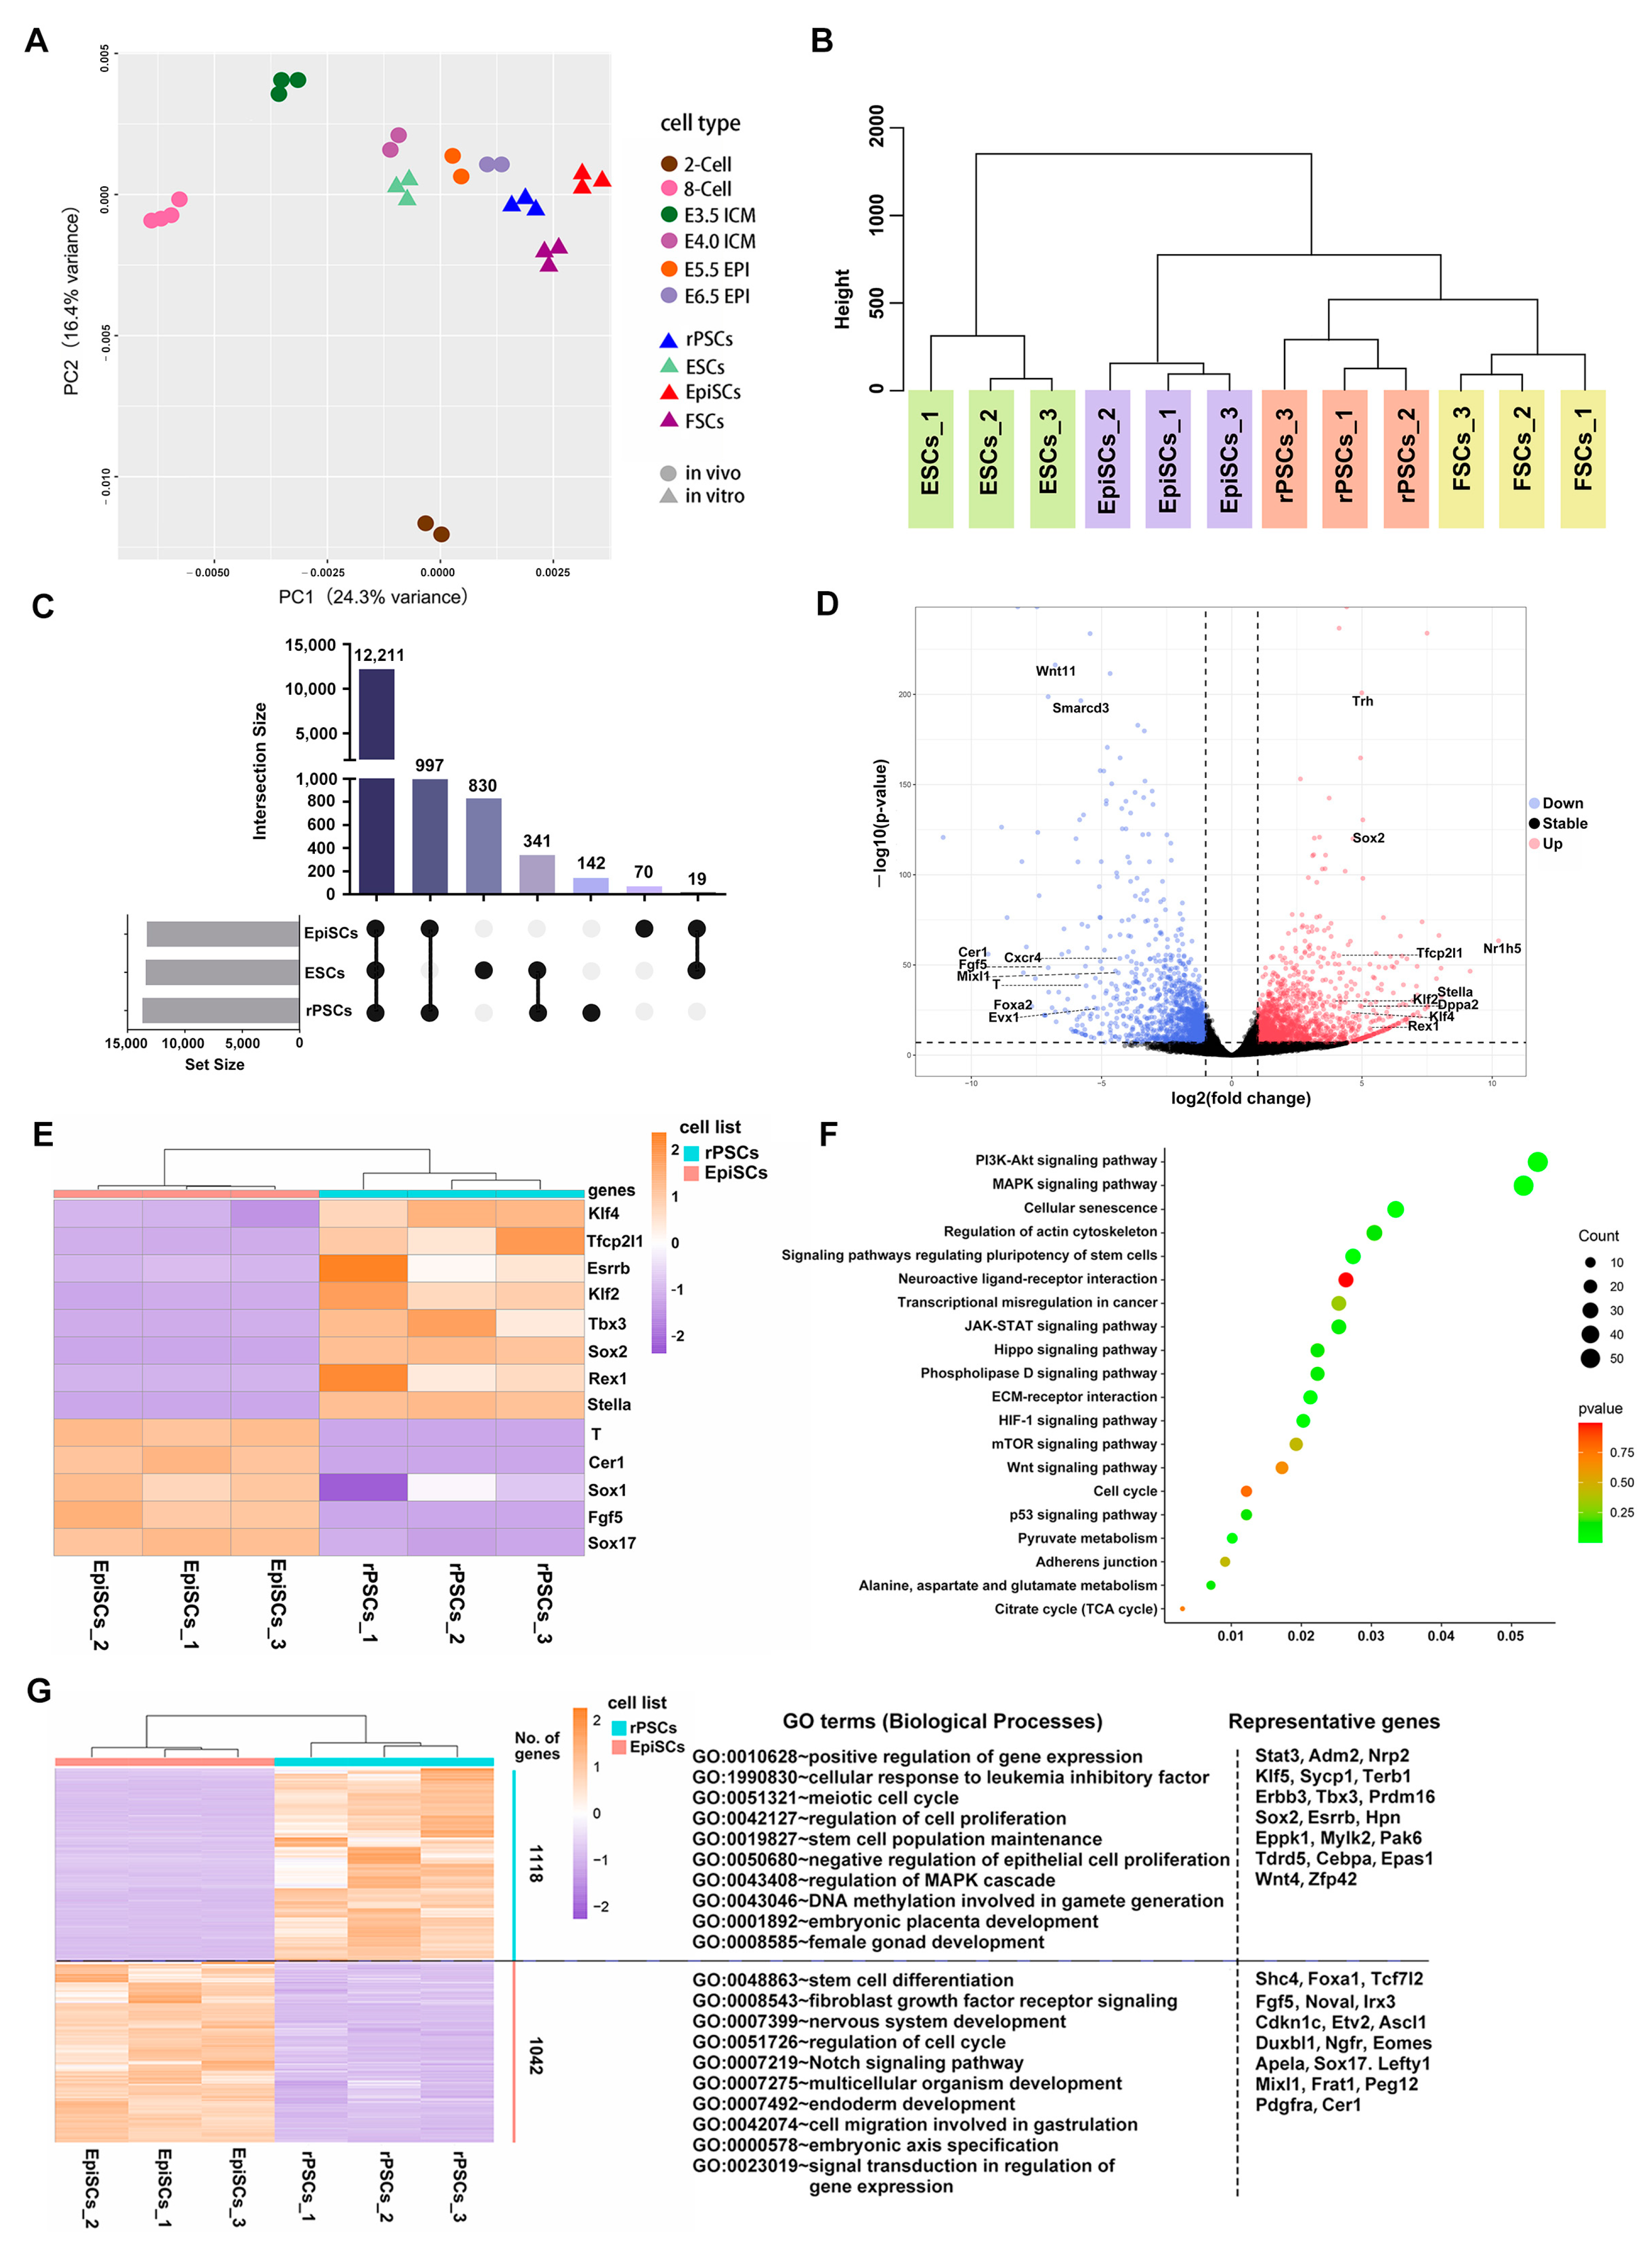
To better understand the molecular features of rPSCs, we performed RNA sequencing (RNA-seq) to analyze the transcriptomes of rPSCs. Principal component analysis (PCA) results revealed that the global gene expression patterns of rPSCs were close to formative stem cells (FSCs) and appeared to be at an intermediate state between naïve ESCs and formative FSCs but distinct from primed EpiSCs (Figure 3A). In addition, compared with pre- and post-implantation embryos in vivo [30,31,32], naïve ESCs clustered with pre-implantation E4.0 ICM, rPSCs, and FSCs clustered with post-implantation E6.5 EPI, while EpiSCs had progressed to more advanced stages (Figure 3A). Hierarchical cluster analysis also revealed that rPSCs and formative FSCs cluster together (Figure 3B), showing that rPSCs appeared to be in an intermediate state between naïve ESCs and formative FSCs but distinct from primed EpiSCs (Figure 3A,B). The UpSet plot identified 142 unique genes in rPSCs (Figure 3C). This distinct clustering pattern of rPSCs was further confirmed by constructing a correlation matrix of gene expression clustered using Pearson correlation coefficients (Figure S3A). A violin plot illustrated the expressed genes (Figure S3B), and differentially expressed genes between rPSCs and EpiSCs were analyzed using the DEseq2 R package (p-value < 0.01 and fold change of ≥2) to examine molecular differences.
We identified 4514 differentially expressed genes between rPSCs and EpiSCs, with 2573 genes significantly upregulated, including naïve pluripotency markers (Klf2, Klf4, Rex1, Sox2, and Dppa2), and 1941 genes significantly downregulated, mainly representing lineage factors (Fgf5, T, Evx1, Foxa2, and Cer1) (Figure 3D). This suggests distinct transcriptional patterns between rPSCs and EpiSCs. The expression of pluripotency transcription factors was higher in rPSCs compared with EpiSCs, while primed pluripotency markers showed significant downregulation in rPSCs (Figure 3E and Figure S3C). Kyoto Encyclopedia of Genes and Genomes (KEGG) pathway enrichment analysis revealed the top 20 enriched pathways, including “signaling pathways regulating pluripotency of stem cells”, “PI3K-Akt signaling pathway”, “MAPK signaling pathway”, and “cell cycle” (Figure 3F). Applying a cutoff of adjusted p-value < 0.001 and fold change of ≥2, we identified 1118 upregulated genes and 1042 downregulated genes in rPSCs compared with EpiSCs (Figure 3G). The upregulated genes in rPSCs were associated with “regulation of cell proliferation”, “stem cell population maintenance”, “DNA methylation involved in gamete generation”, and “embryonic placenta development” with representative genes such as Tbx3, Prdm16, Pak6, Cebpa, and Epas1, while the downregulated genes in rPSCs were primarily enriched in “stem cell differentiation”, “nervous system development”, and “endoderm development”, with representative genes including Foxa1, Tcf7l2, Sox17, Irx3, and Pdgfra (Figure 3G).
Collectively, rPSCs and EpiSCs exhibited distinct gene expression patterns. Most of the upregulated genes in rPSCs were predominantly developmental regulatory genes, cell proliferation regulatory genes, and genes associated with stem cell pluripotency signaling pathways. These data indicate that the molecular features of rPSCs represent an intermediate state between EpiSCs and ESCs.

2.4. Epigenetic Changes in rPSCs

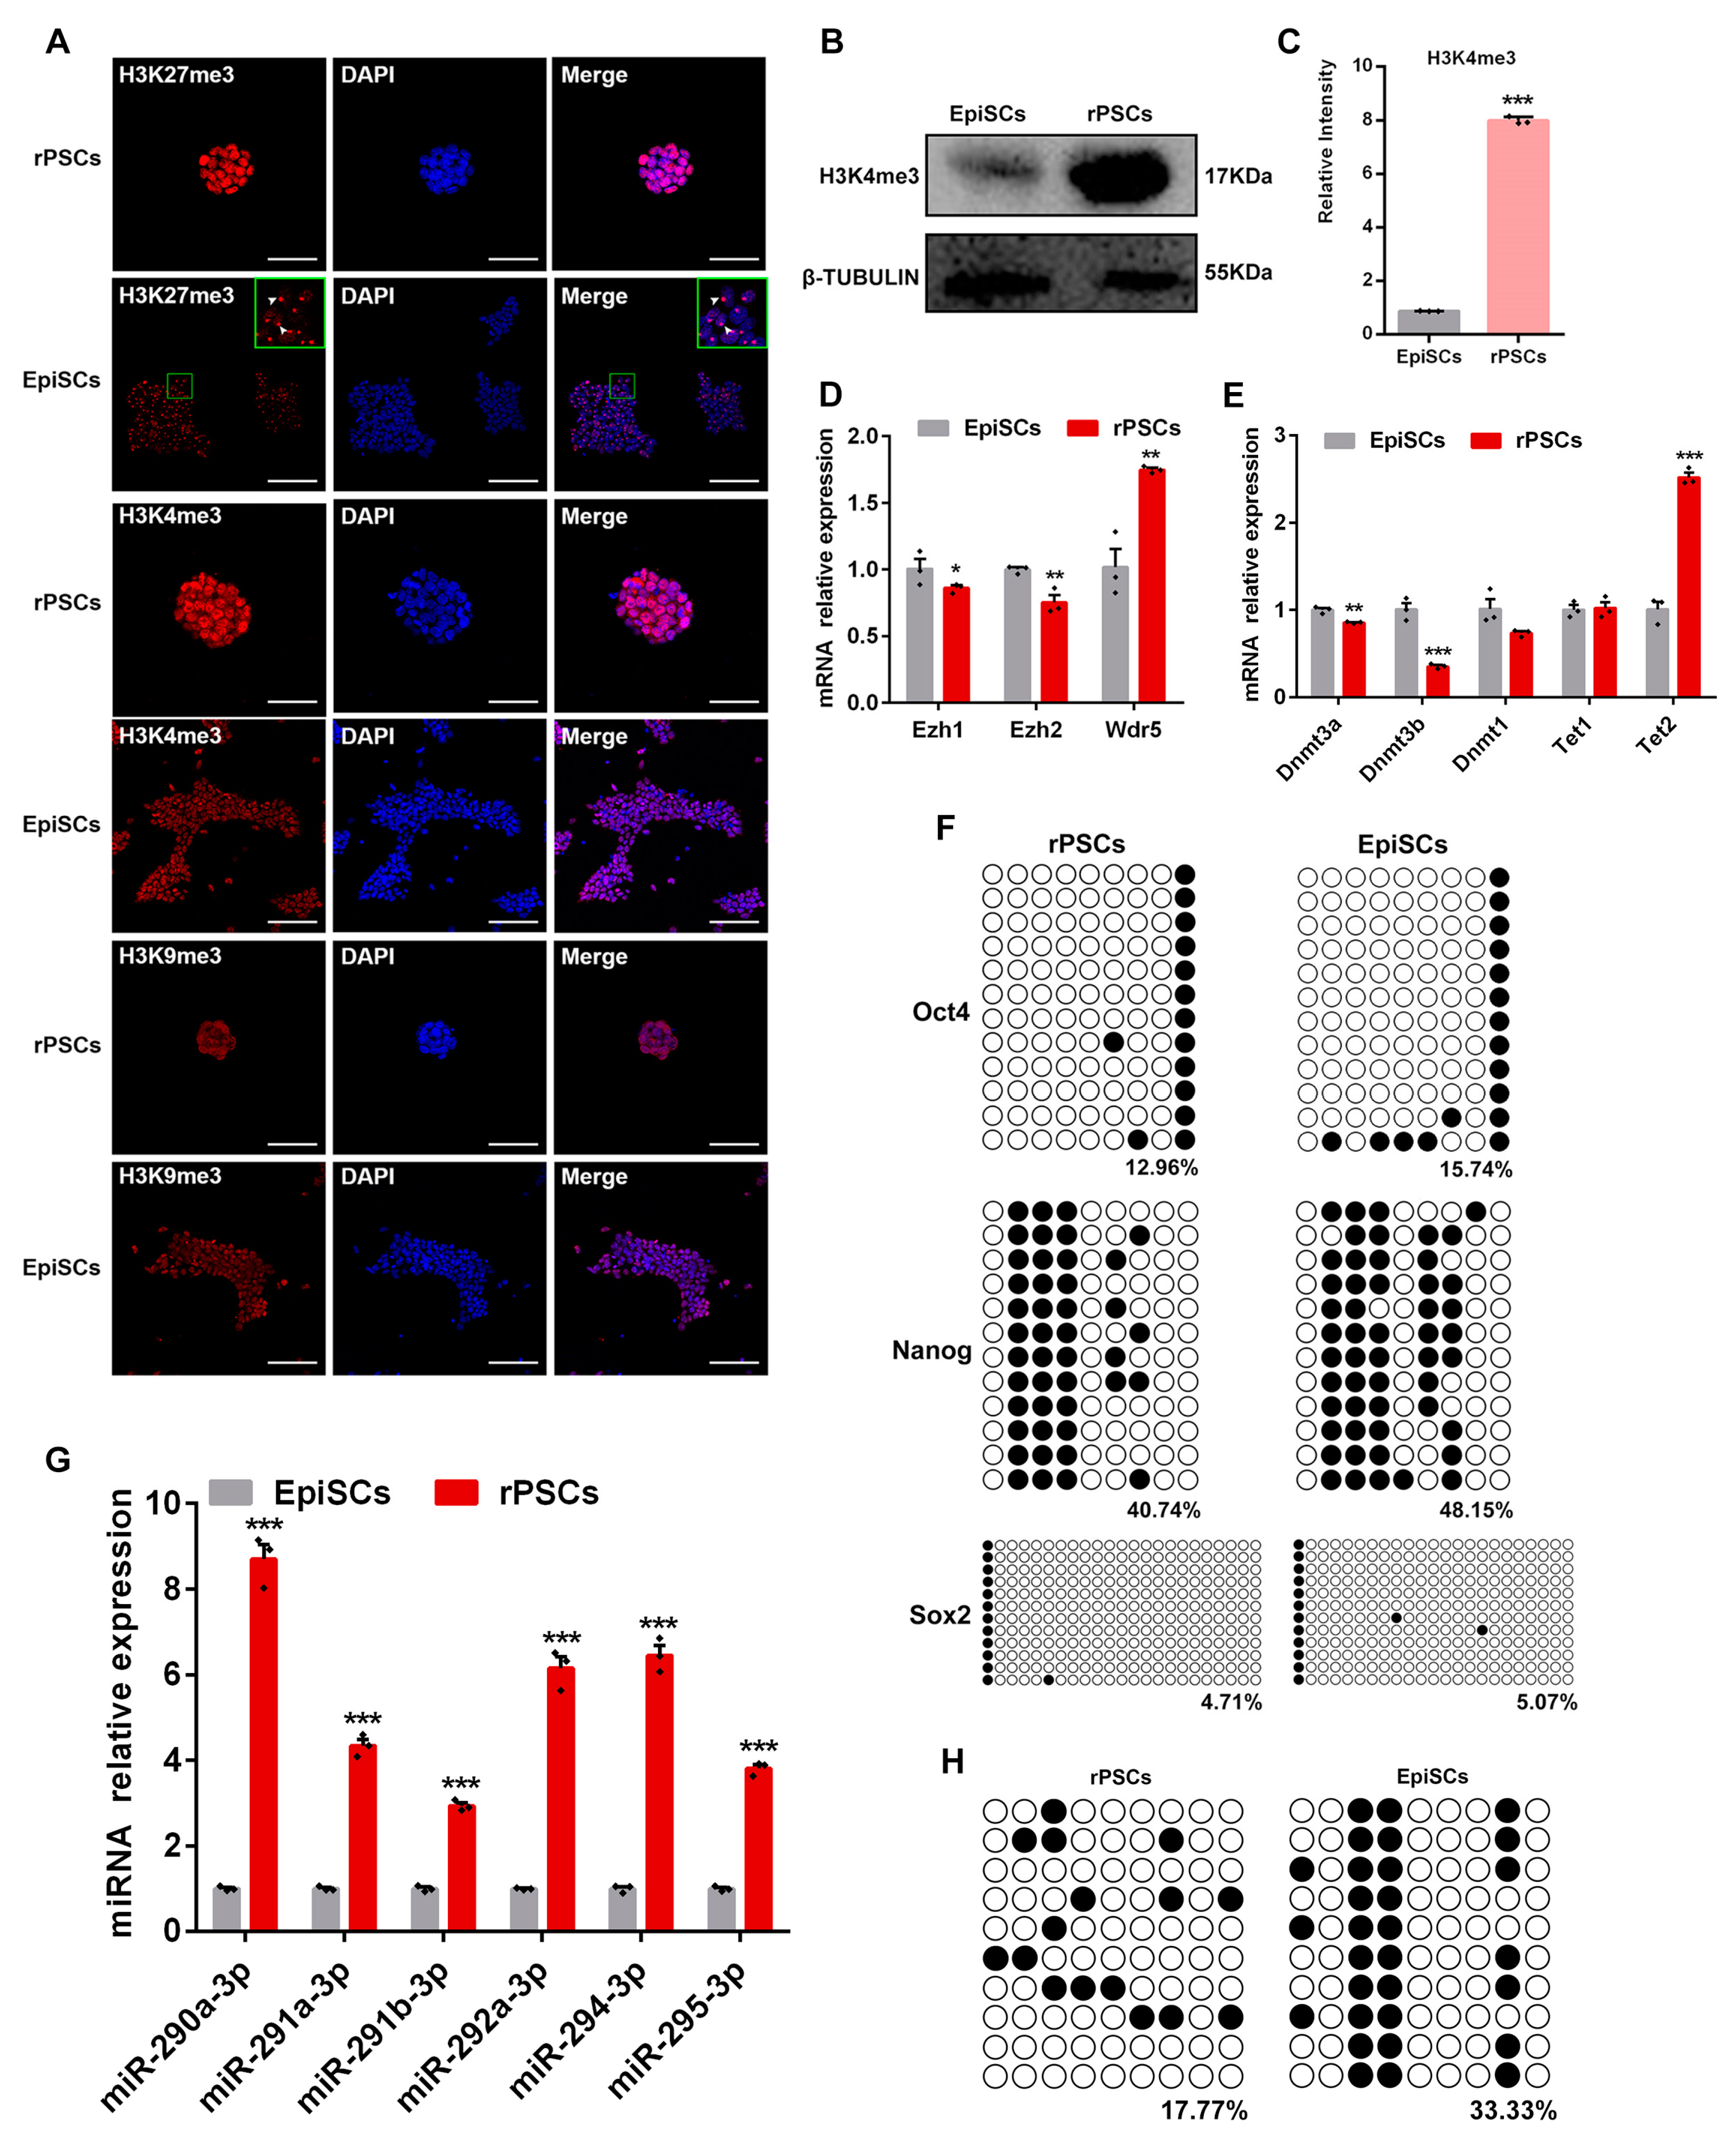
Next, we examined the epigenetic changes occurring during the reprogramming of EpiSCs to rPSCs. Notably, an important epigenetic change is the reactivation of the late-replicating, inactive X chromosome in the epiblast [33], which indicates a major epigenetic change like reprogramming [34]. E6.5 epiblast cells exhibit characteristic accumulation of histone H3 lysine 27 trimethylation (H3K27me3) epigenetic mark, which is diagnostic for the inactive X [35,36]. In addition, it has been reported that both X chromosomes are active in female naïve ESCs [10,37]; concurrent with this, our immunofluorescence showed bright H3K27me3 foci in female EpiSCs but not in female rPSCs, suggesting reactivation of the X-chromosome in rPSCs (Figure 4A). These observations showed continuing epigenetic reprogramming during the conversion of EpiSCs to rPSCs in a novel medium, where none of the cells had the characteristic H3K27me3 foci. The expression of proteins H3K4me3 and H3K9me3 was also detected by immunofluorescence, and we found that there was no significant difference in the H3K9me3 expression (Figure 4A). However, immunofluorescence and Western blot analysis revealed a significantly higher expression of H3K4me3 in rPSCs compared with EpiSCs (Figure 4A–C). Furthermore, we examined the expression of histone H3K27 methyltransferase Ezh1, Ezh2, and histone H3K4 methyltransferase Wdr5. RT-qPCR results showed that the expression of Ezh1 and Ezh2 was decreased, while that of Wdr5 was upregulated in rPSCs compared with EpiSCs (Figure 4D).
DNA methylation plays a critical role in embryonic development, stem cell differentiation, and cell fate conversion [38,39]. To investigate whether the reprogramming process of EpiSCs altered DNA methylation levels, we examined the mRNA expression levels of DNA methyltransferases (DNMTs) and the Tet family in EpiSCs and rPSCs. RT-qPCR analysis revealed a significant decrease in the expression of Dnmt3a, Dnmt3b, and Dnmt1 in rPSCs compared with EpiSCs, whereas Tet2 was found to be upregulated in rPSCs (Figure 4E). Previous studies have reported that Tet1 and Tet2 regulate 5hmC levels in mouse ESCs and are associated with the pluripotent state [40]. We further investigated the epigenetic changes in DNA methylation of the promoter regions of three key pluripotency genes, Oct4, Sox2, and Nanog. Bisulfite sequencing indicated that the Oct4 and Sox2 promoter regions were almost completely demethylated in rPSCs, EpiSCs, and ESCs. In contrast, the Nanog promoter region showed considerable methylation in EpiSCs compared with rPSCs and ESCs (48.15% vs. 40.74% vs. 39.8%) (Figure 4F and Figure S4A).
Several studies have demonstrated that the expression of the ESC-specific miRNAs is necessary for initiating stem cell differentiation and normal embryonic development [41]. ESC-specific miR-290–295 cluster accounts for 60% of the miRNA population in mouse ESCs [42,43] and is rapidly downregulated during differentiation [44,45]. The expression level of the miR-290 family varies among different types of stem cells. The expression level of the miR-290 family was significantly higher in mouse ESCs than that in trophoblast stem cells (TS) and extraembryonic endoderm cells (XEN), while it was barely expressed in MEFs [46]. Therefore, we examined the expression changes of the miR-290 family during the conversion of EpiSCs to rPSCs. RT-qPCR analysis revealed significant upregulation of miR-290 family members (miR-290a-3p, miR-291a-3p, miR-291b-3p, miR-292a-3p, miR-294-3p, and miR-295-3p) in rPSCs compared with EpiSCs (Figure 4G). Similarly, their expression levels were also higher than in ESCs (Figure S4B). The methylation of super enhancer (SE) regions has been shown to change during differentiation. Stelzer et al. reported that the miR-290 SE region is hypo-methylated in ESCs but becomes de novo methylated upon differentiation [47]. Bisulfite sequencing displayed that the methylation level at the miR-290 SE region in rPSCs is intermediate between EpiSCs and ESCs, consistent with previous studies (Figure 4H and Figure S4C).
These results suggest that rPSCs exhibit specific epigenetic features that are more similar to ESCs than to EpiSCs. We hypothesize that the enhanced pluripotency of rPSCs may be related not only to the regulation of transcription factors but also to the signaling pathways involved in the miR-290 family.

2.5. Removal of SB203580 Reduces the Pluripotency of rPSCs

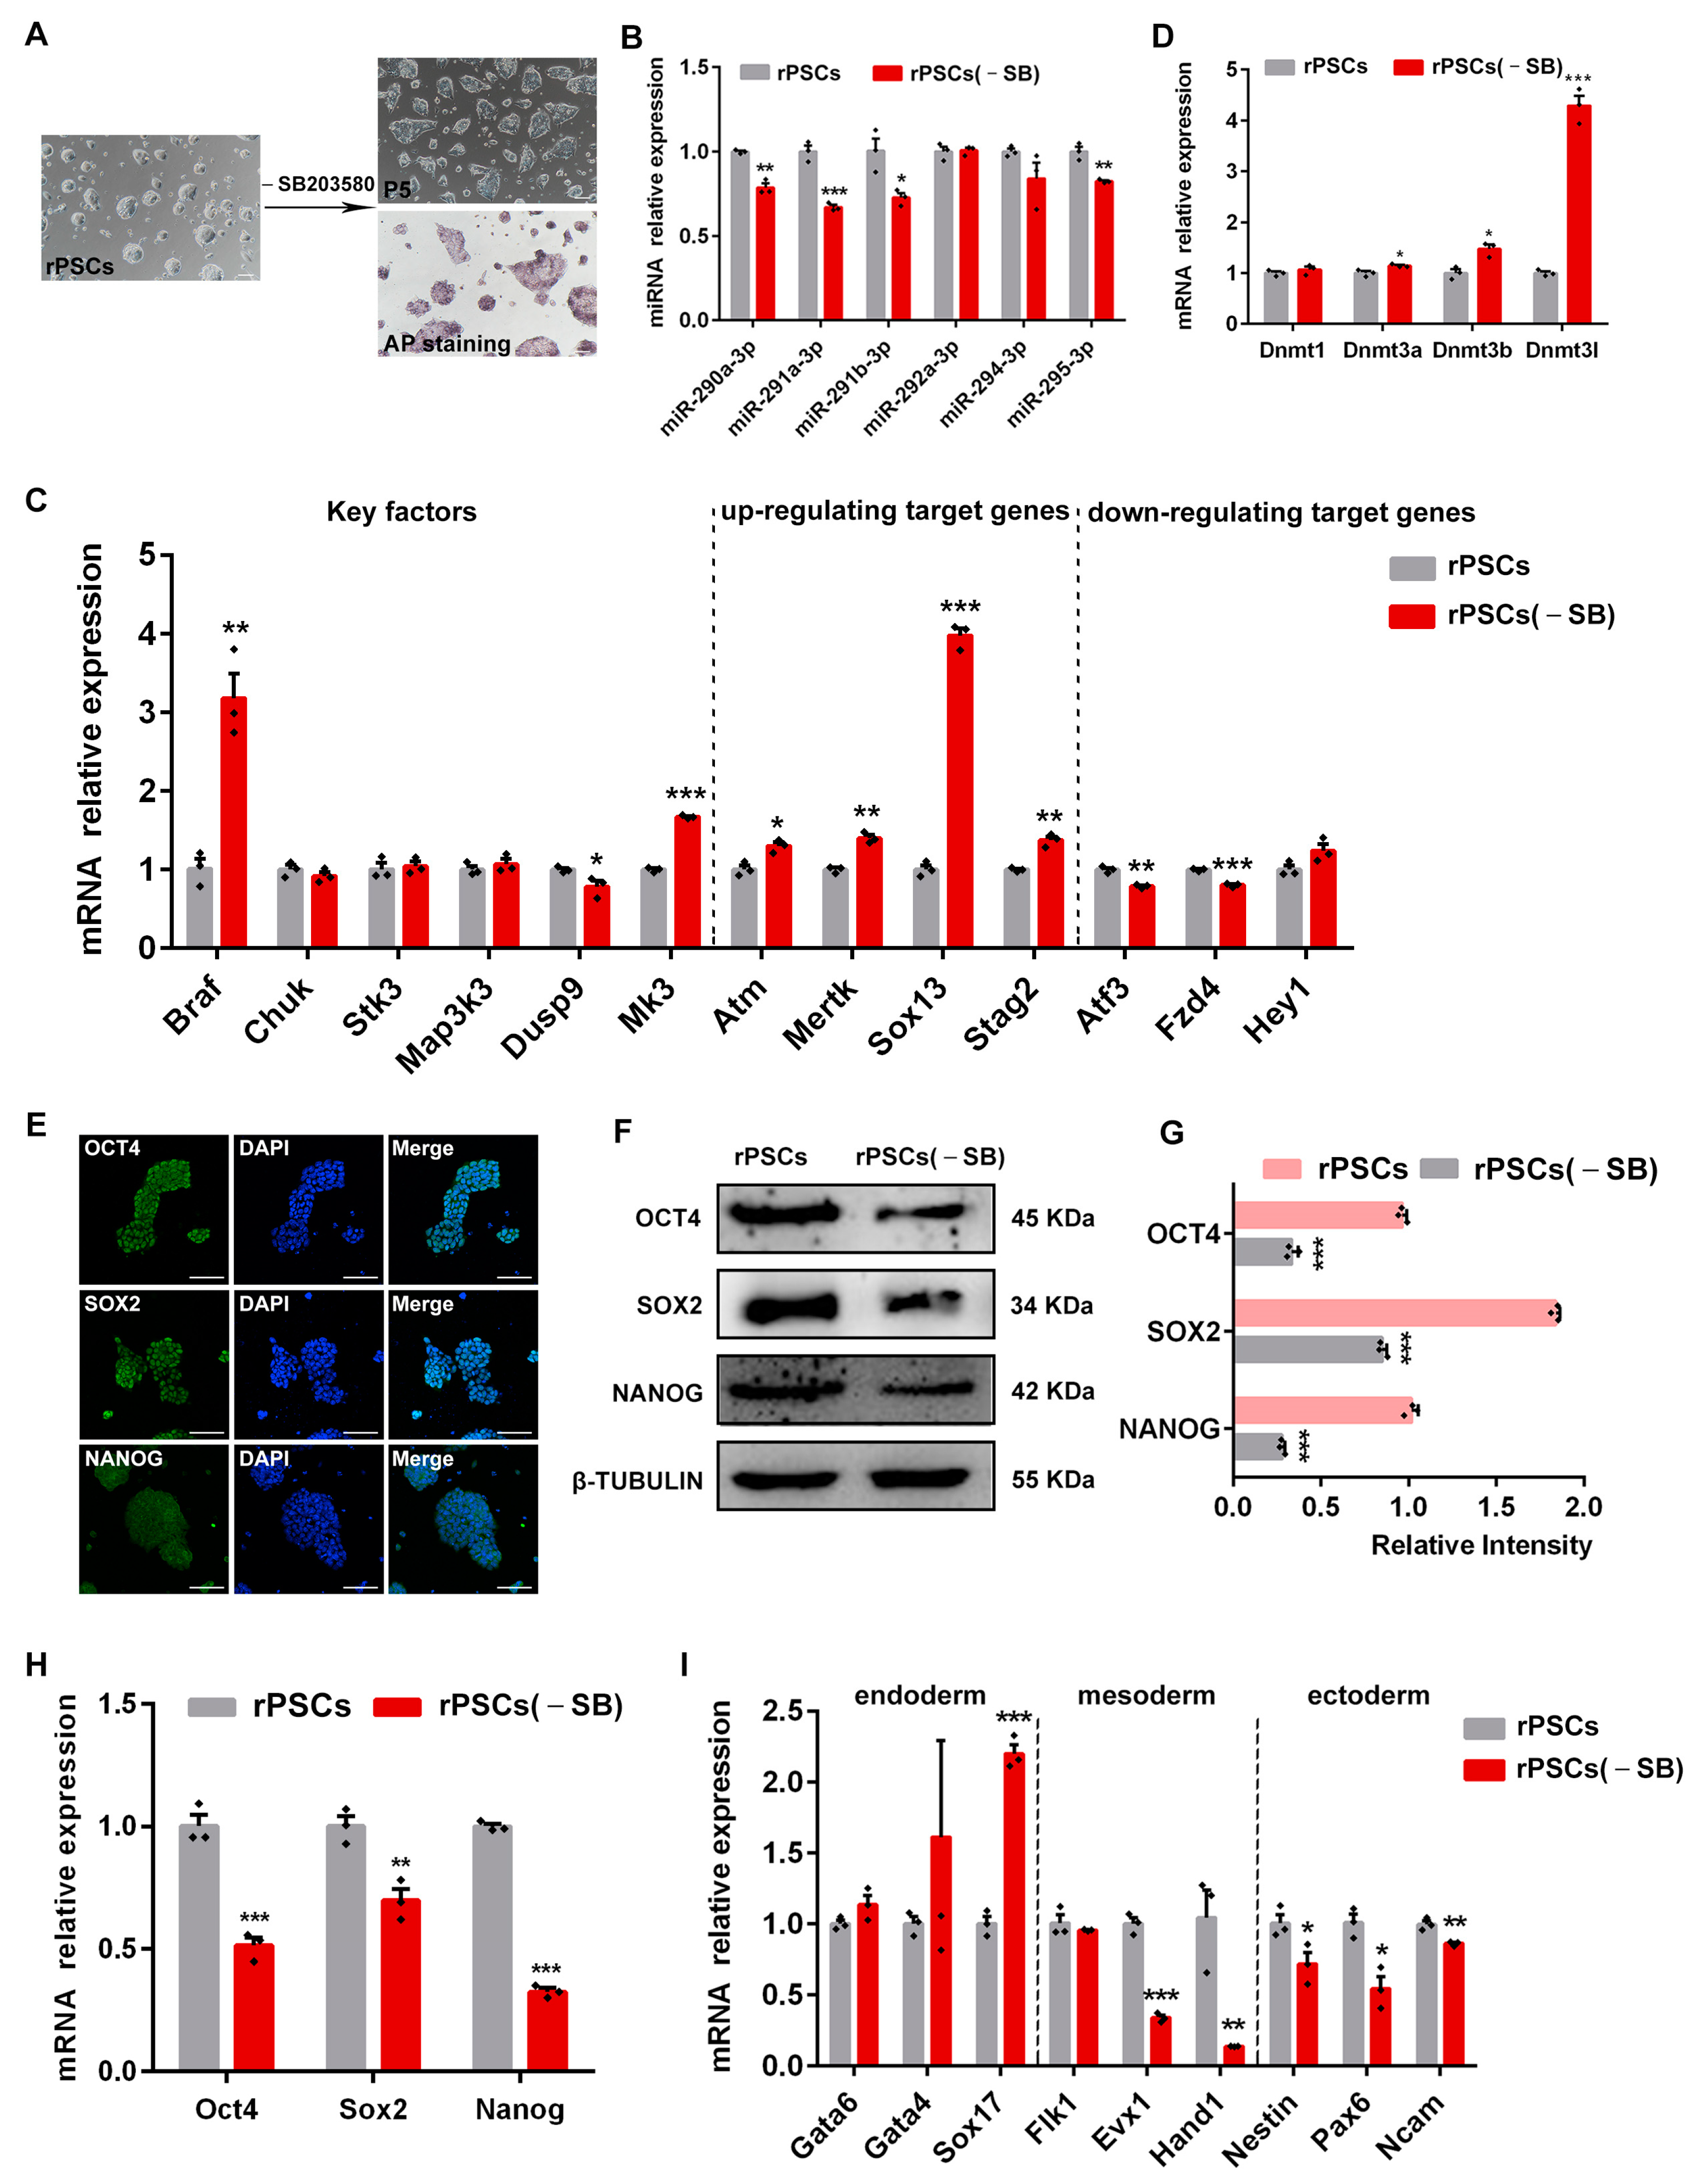
We further investigated the role of the MAPK signaling pathway in maintaining the pluripotency of rPSCs. SB203580, a p38 MAPK inhibitor, has been used in combination with various small-molecule compounds to promote the generation of mouse expended pluripotent stem cells (EPSCs) [48]. When rPSCs were cultured in the medium lacking SB203580, we observed a transition in cell morphology from domed to a smooth, flat shape similar to EpiSCs, accompanied by a reduction in AP positivity, which we refer to as rPSCs(-SB) (Figure 5A). Next, we examined whether the removal of SB203580 affected the expression of miR-290 family members. RT-qPCR analysis revealed significant downregulation of miR-290 family members, including miR-290a-3p, miR-291a-3p, miR-291b-3p, and miR-295-3p (Figure 5B). Notably, RNA-seq analysis of rPSCs showed that the KEGG pathway analysis was mainly concentrated in the MAPK signaling pathway (Figure 3F). Therefore, we investigated the effect of SB203580 removal on the MAPK signaling pathway by examining key factors and up-/down-regulating target genes of the p38 MAPK signaling pathway. RT-qPCR results showed that after removing SB203580, the expression of Braf and Mk3 significantly increased, while Dusp9 expression decreased. Furthermore, up-regulating target genes of the p38 MAPK signaling pathway (Atm, Mertk, Sox13, and Stag2) were upregulated, while down-regulating target genes (Atf3, Fzd4, and Hey1) were downregulated in rPSCs(-SB), indicating the activation of the p38 MAPK signaling pathway (Figure 5C).
Cells under different culture conditions exhibit different methylation patterns [49,50]. Therefore, we explored whether the removal of SB203580 altered DNA methylation levels. The expression of DNA methyltransferases Dnmt3a, Dnmt3b, and Dnmt3l was significantly upregulated after SB203580 removal (Figure 5D). To address whether SB203580 removal modulated the expression of key pluripotency genes, we performed immunofluorescence staining, RT-qPCR, and Western blot analysis. Immunofluorescence assays confirmed the expression of pluripotency markers OCT4, SOX2, and NANOG in rPSCs(-SB) (Figure 5E). Furthermore, Western blot analysis showed a significant decrease in protein expression of OCT4, SOX2, and NANOG in rPSCs(-SB) (Figure 5F,G). These findings were confirmed using RT-qPCR results (Figure 5H). Interestingly, rPSCs(-SB) exhibited higher expression of endoderm markers Gata4 and Sox17, suggesting a tendency toward endodermal differentiation after the removal of SB203580 (Figure 5I). In contrast, the mesoderm markers Evx1 and Hand1 were downregulated. Similarly, the ectoderm markers Pax6, Ncam, and Nestin were also downregulated (Figure 5I).
Taken together, our results suggest that the removal of SB203580 leads to the inhibition of the p38 MAPK signaling pathway, resulting in a reduction in cell pluripotency and the induction of endoderm differentiation. Additionally, the expression of miR-290 family members is also decreased.

2.6. Map2k6 Is a Direct Target of miR-291b-3p

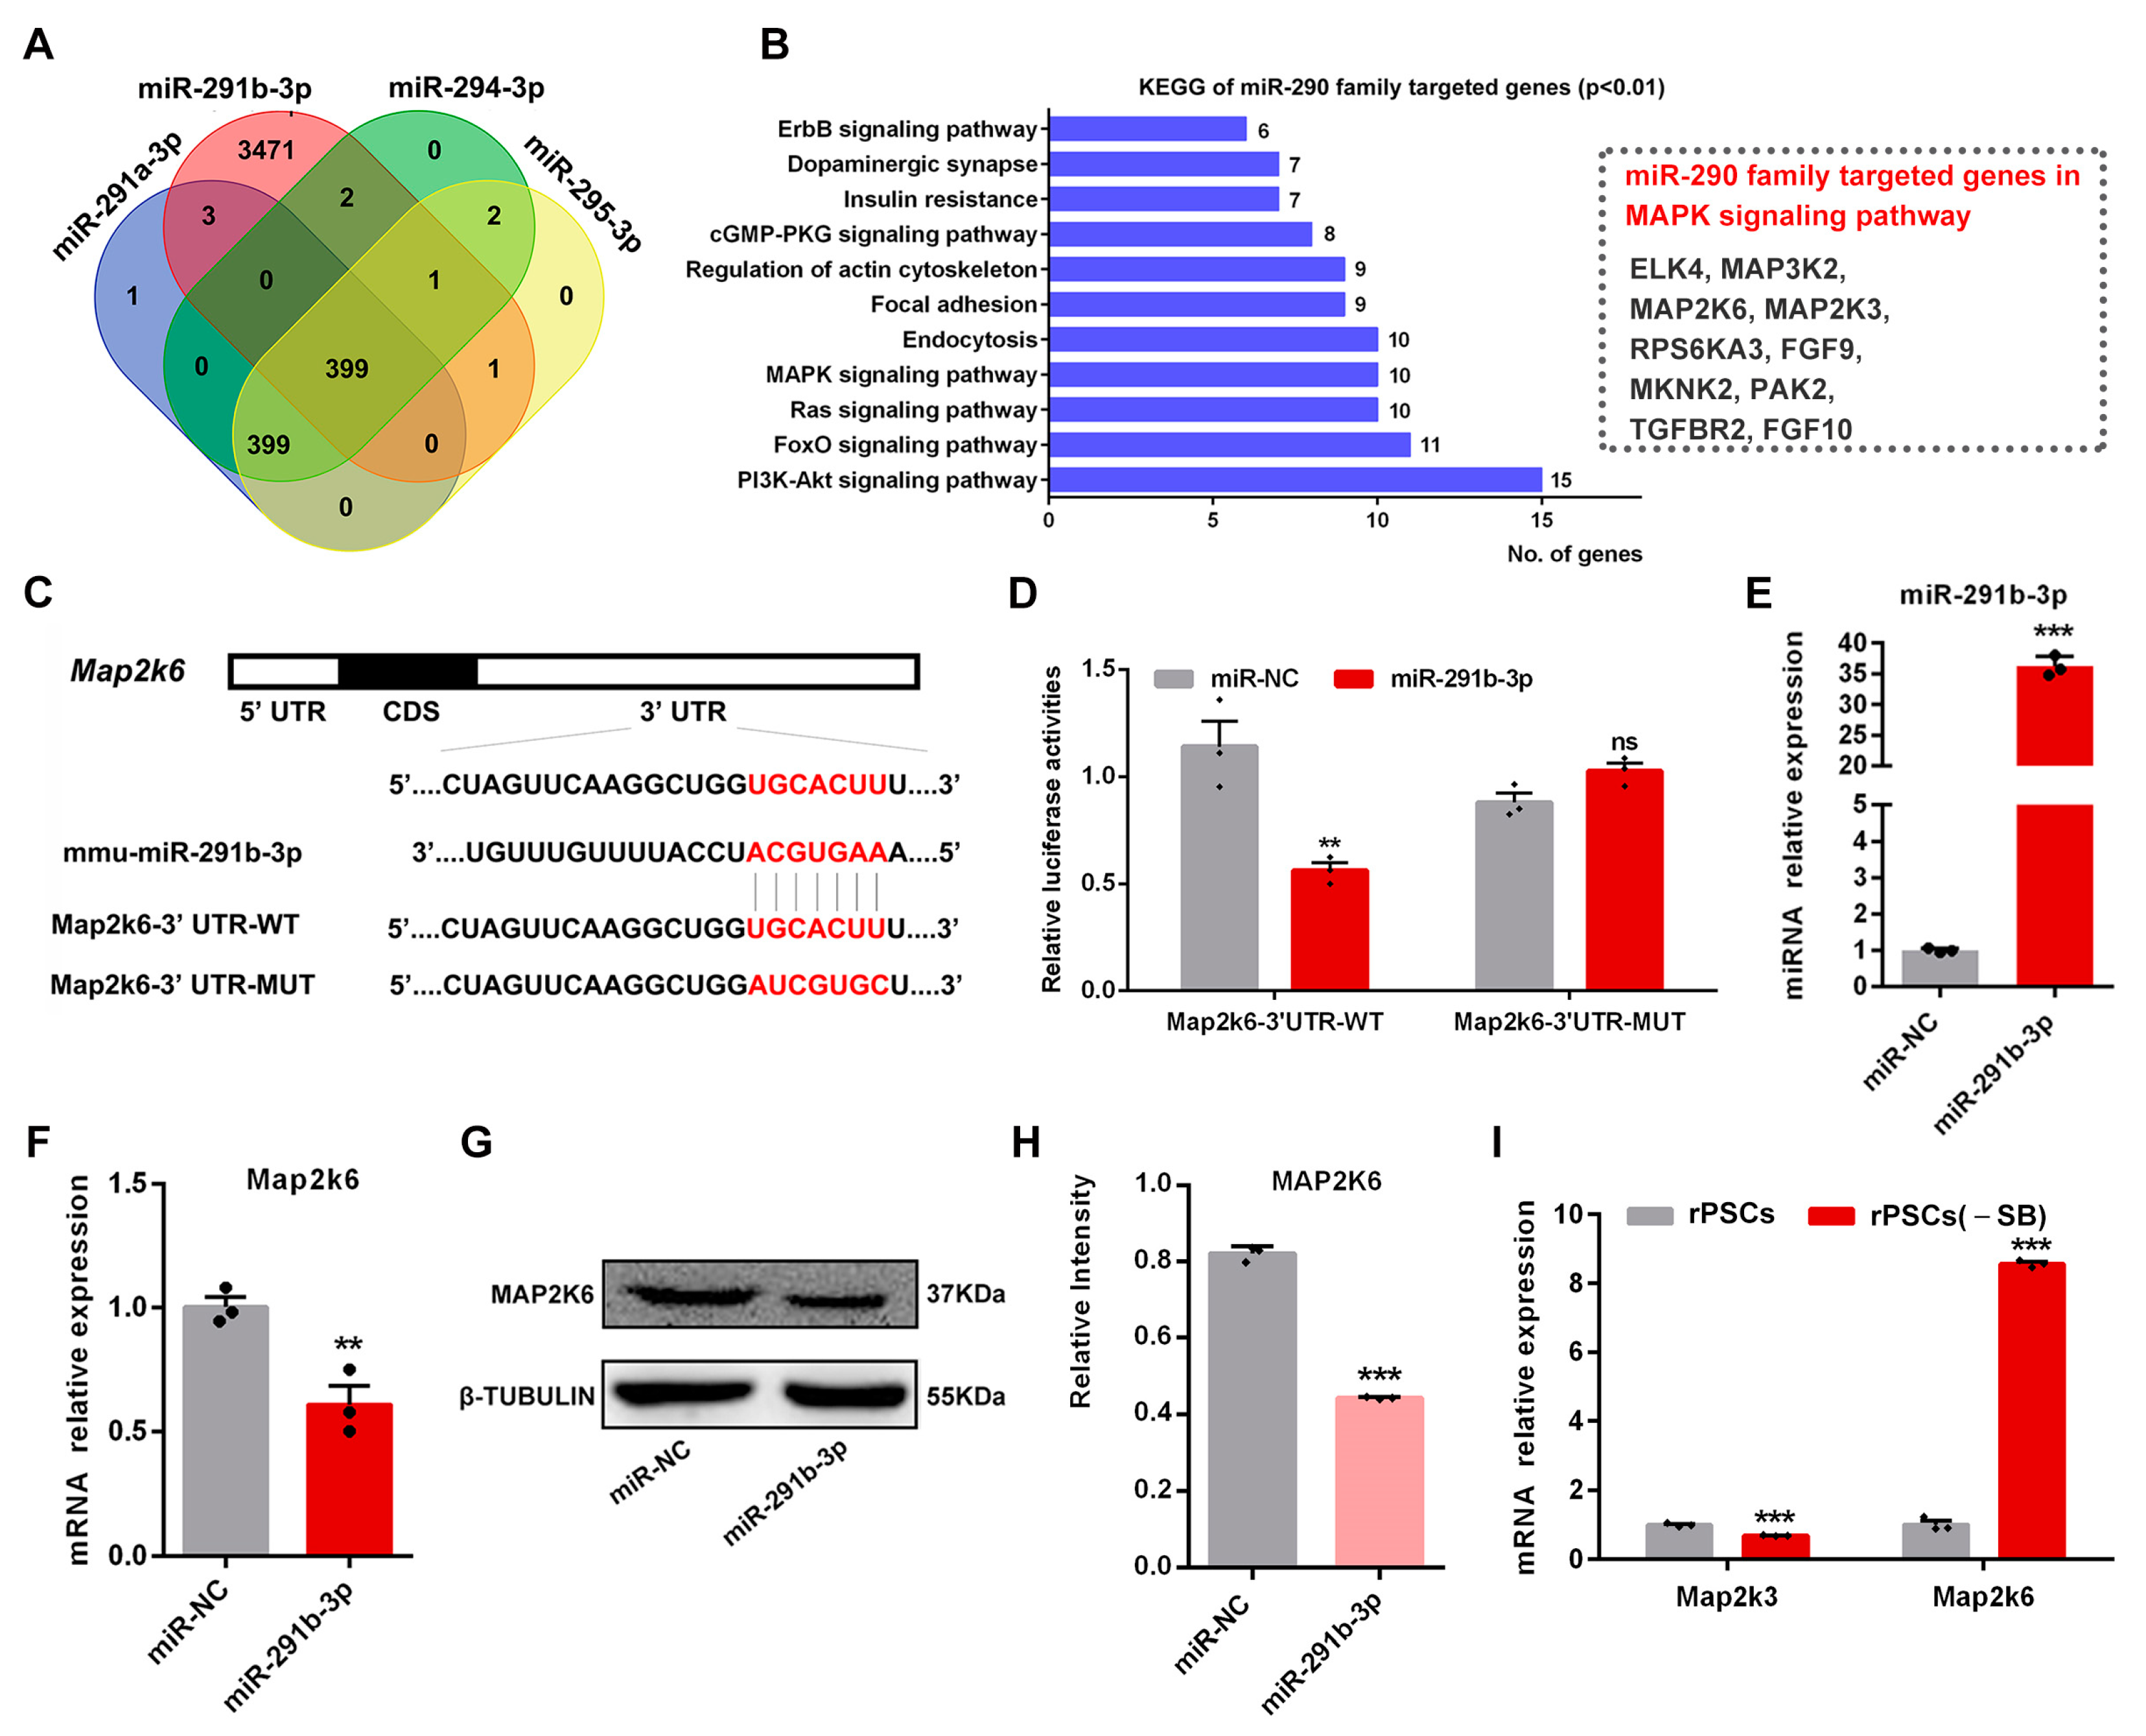
Mature miRNAs typically recognize their mRNA targets through imperfect sequence complementarity and downregulate the target mRNA expression through a combined mechanism of translational inhibition and mRNA degradation [51]. To identify potential mRNA targets of miR-290 family members, including miR-291a-3p (707 genes), miR-291b-3p (3877 genes), miR-294-3p (708 genes), and miR-295-3p (707 genes), which all share the common seed sequence AAGUGC, we searched the miRBase database. A total of 399 overlapping target genes were identified (Figure 6A). KEGG pathway analysis revealed that these genes were primarily enriched in the “PI3K-AKT signaling pathway” and “MAPK signaling pathway” (Figure 6B). In addition, GO analysis was performed to explore the potential roles of these genes. In GO biological processes (GO-BP), the genes were enriched in terms such as “regulation of transcription, DNA-templated” and “transcription, DNA-templated” (Figure S5A). In GO cellular components (GO-CC), the genes were primarily enriched in the “nucleus” and “cytoplasm” (Figure S5B). In GO molecular functions (GO-MF), the genes were enriched in the term “protein binding” (Figure S5C).
Since SB203580 functions as an inhibitor of the p38 MAPK signaling pathway, we sought to explore the relationship between miR-290 and this pathway. KEGG pathway analysis revealed an enrichment of 10 genes in the MAPK signaling pathway; Map2k3, Map2k6, and Mnk2 were associated with the p38 MAPK signaling pathway (Figure 6B). Additionally, we focused on miR-291b-3p to identify potential mRNA targets of the miR-290 family using an online database available at https://www.targetscan.org (accessed on 5 December 2022), and we found that Map2k3 and Map2k6 were potential targets of mature miR-291b-3p. To confirm this hypothesis, we designed the wild-type 3′-UTR sequence for Map2k6 cDNA (Map2k6-3′-UTR-WT) and a mutant 3′-UTR Map2k6 cDNA sequence (Map2k6-3′-UTR-MUT) that would be unable to bind miR-291b-3p, as listed in Supplementary Table S2. These sequences were cloned into the luciferase reporter vector pmirGLO using Xho I/Xba I restriction enzymes (Figure 6C), and the recombinant plasmids were verified by sequencing (Figure S5D). Similar to Map2k6, Map2k3-3′-UTR-WT and Map2k3-3′-UTR-MUT sequences were also designed (Figure S5E) and cloned into pmirGLO vectors, followed by verification with sequencing (Figure S5D), as listed in Supplementary Table S2. The recombinant luciferase reporter vectors were co-transfected with miR-291b-3p mimic into ESCs, and subsequent measurement of luciferase activities revealed a significant decrease when the miR-291b-3p mimic was co-expressed with the Map2k6-3′-UTR-WT pmirGLO vector compared with the Map2k6-3′-UTR-MUT pmirGLO vector (Figure 6D). However, there were no differences in luciferase activities between the Map2k3-3′-UTR-WT and Map2k3-3′-UTR-MUT groups when co-expressed with miR-291b-3p mimic (Figure S5F). RT-qPCR assays were also performed to determine the regulatory relationship between miR-291b-3p and Map2k6. The miR-291b-3p mimic transfected into ESCs expressed higher levels of miR-291b-3p and lower levels of Map2k6 compared with the control miR-NC group (Figure 6E,F); however, there was no distinct difference in Map2k3 expression (Figure S5G). Western blot analysis revealed a significant decrease in the MAP2K6 protein level in ESCs after transfection with miR-291b-3p mimics (Figure 6G,H). We also examined the expressions of Map2k3 and Map2k6 before and after the SB203580 withdrawal. RT-qPCR results showed that Map2k6 expression was significantly increased in rPSCs(-SB) compared with rPSCs, while the expression of Map2k3 was slightly reduced (Figure 6I). These results demonstrated that Map2k6 was the direct downstream target gene of miR-291b-3p.

2.7. MiR-290 Family Can Replace MAPK Pathway Inhibitor SB203580 to Maintain the Pluripotency of rPSCs

MiRNAs can act as part of a pluripotency regulation network. Pluripotency-promoting miRNAs function to dampen differentiation signals during self-renewal by reinforcing the pluripotent state set by the pluripotency transcription factor and epigenetic regulation networks [52]. For instance, miR-302 suppresses epigenetic regulators Aof2, Aof1, Mecp1-p66, and Mecp2 to trigger global demethylation [53]. This demethylation process is a prerequisite for establishing pluripotency.
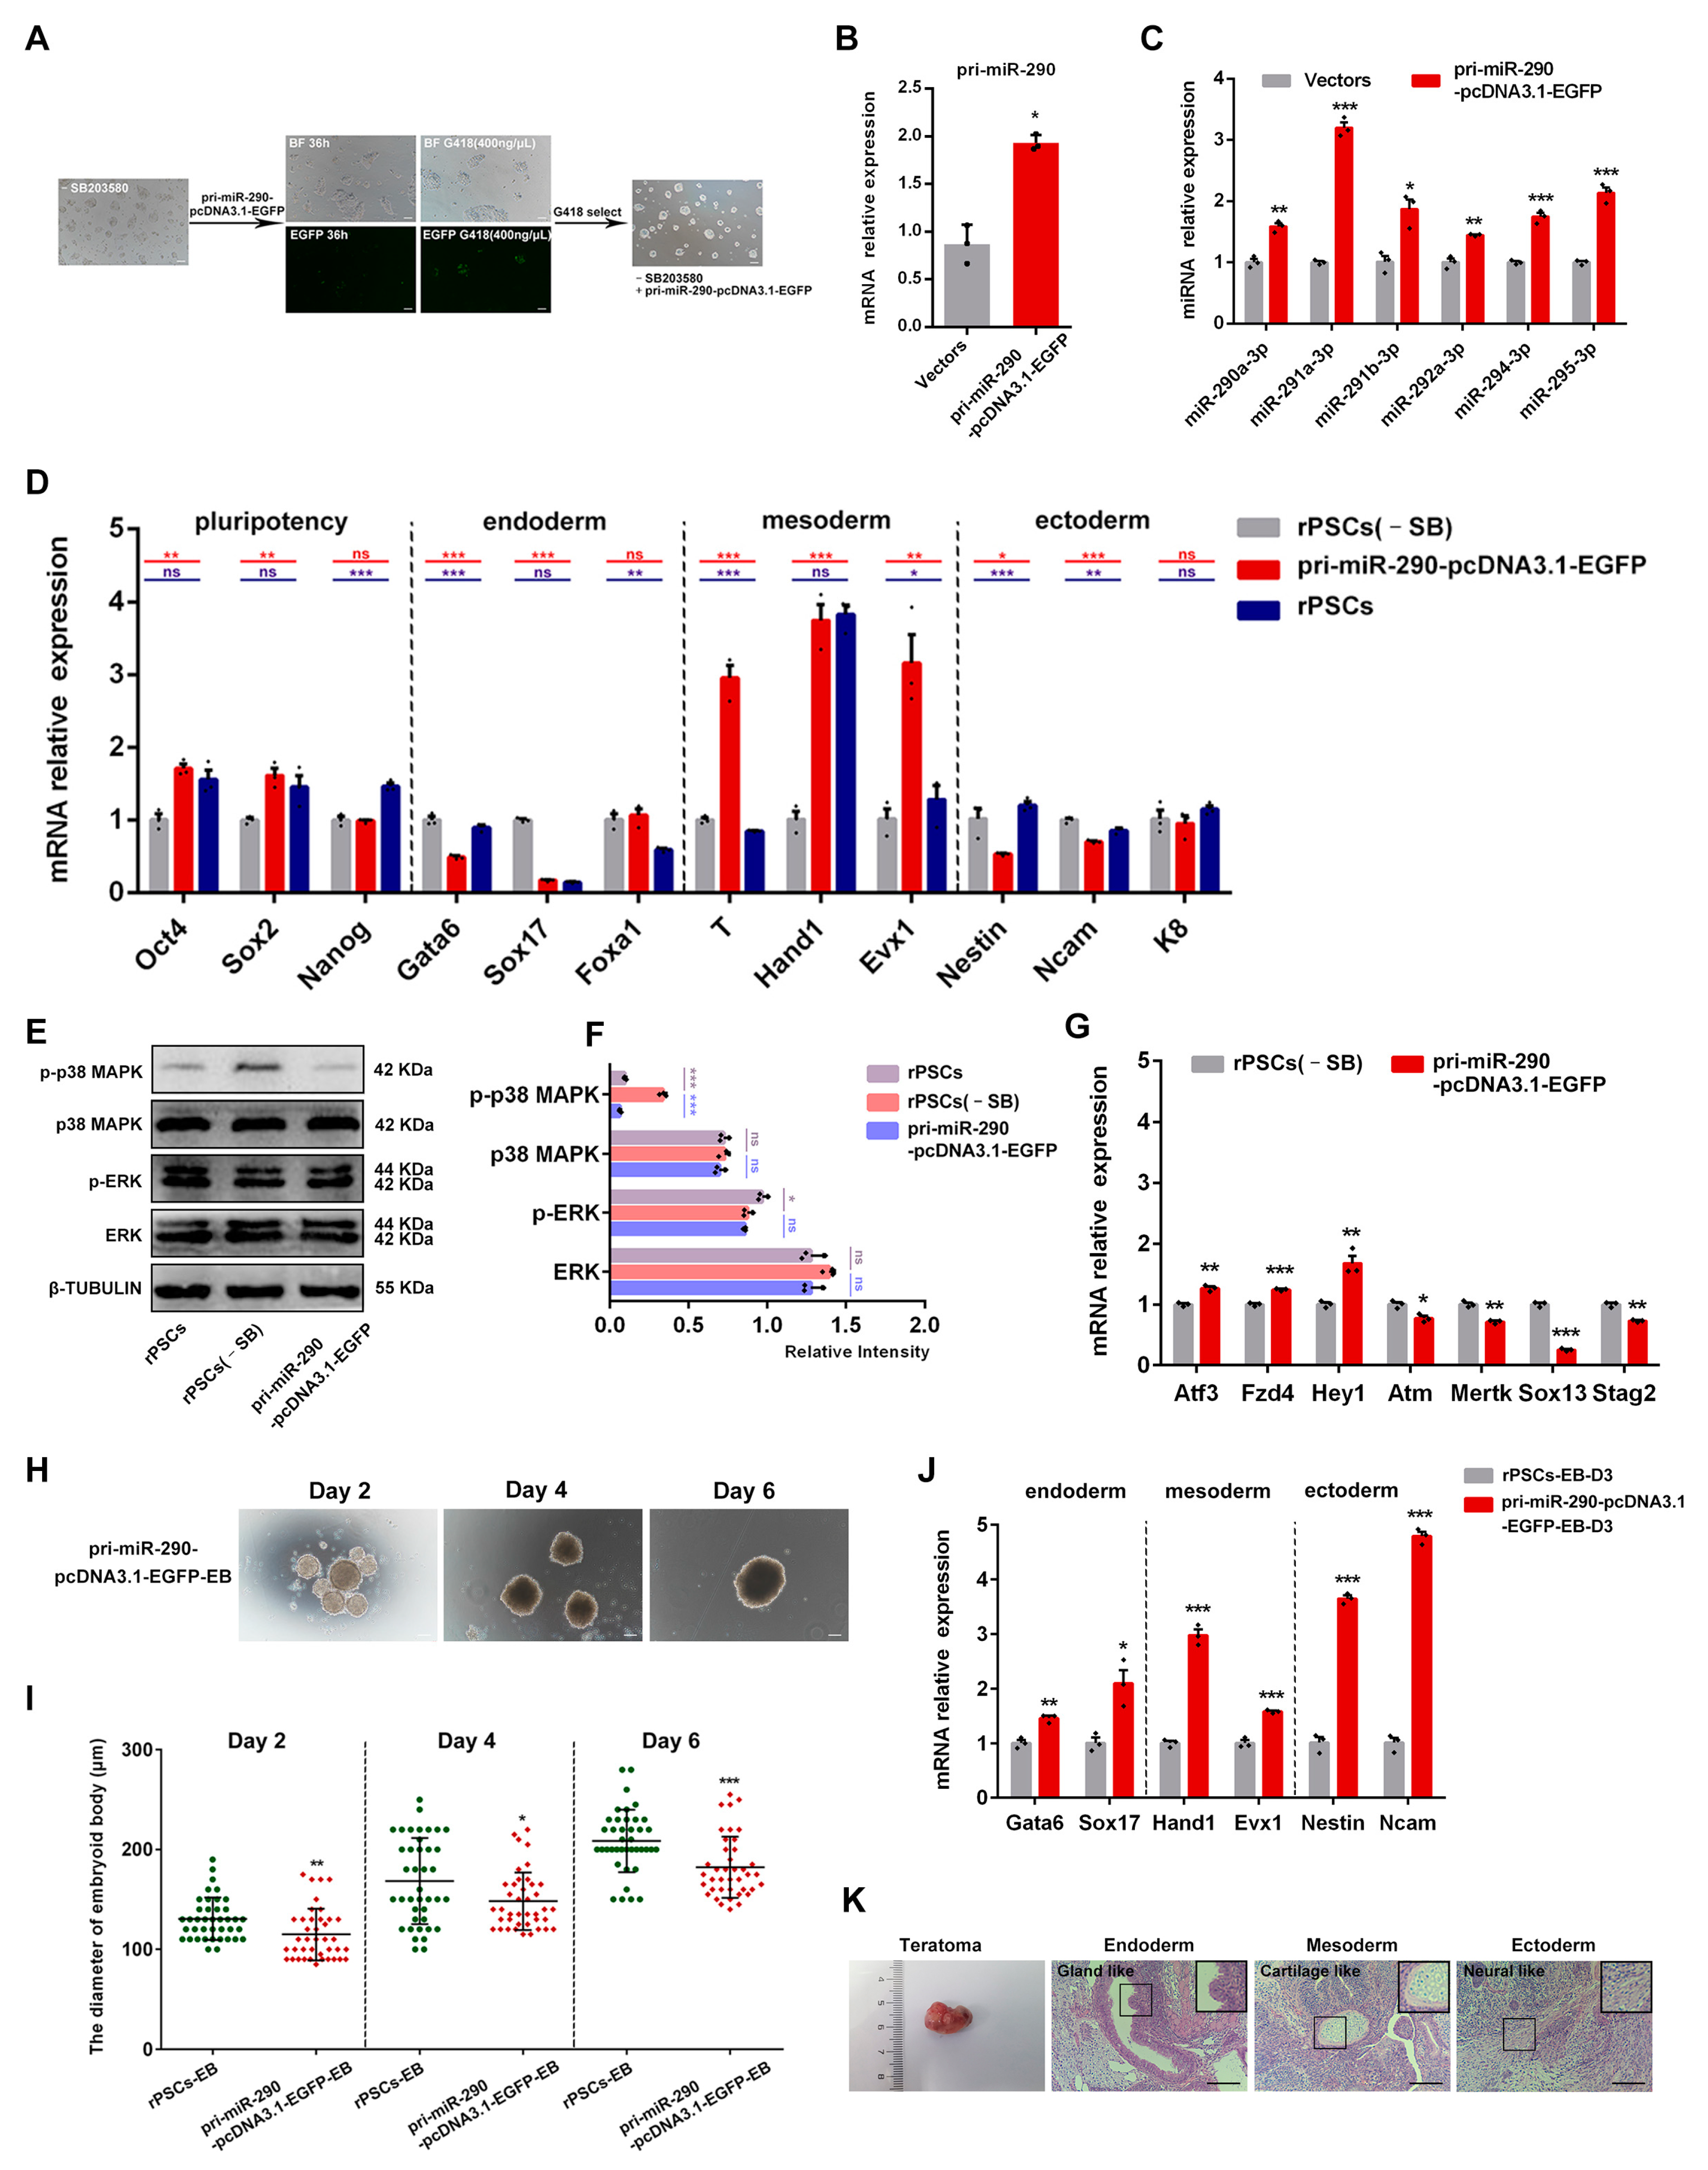
Interestingly, all members of the miR-290 family are spliced from D7Ertd143e (2232 nucleotides, Genbank accession number: NR_028425.1), which is the primary molecule of this family [54]. So, in order to further explore the role of the miR-290 family in maintaining stem cell pluripotency, we cloned the pri-miR-290 cDNA (D7Ertd143e) sequence and successfully constructed the overexpression vector pri-miR-290-pcDNA3.1-EGFP (Figure S6A), which was verified by sequencing analysis (Figure S6B). The rPSCs(-SB) were transfected with pri-miR-290-pcDNA3.1-EGFP by liposome transfection and selected with G418 (Figure 7A). Notably, rPSCs(-SB) displayed domed morphology and could be passaged over 15 after G418 selection (Figure 7A). RT-qPCR assays showed that the mRNA level of pri-miR-290 in the pri-miR-290-pcDNA3.1-EGFP group was nearly 2-fold higher than that in the control vector group (Figure 7B). Furthermore, the expression of mature miR-290 family members, including miR-290a-3p, miR-291a-3p, miR-291b-3p, miR-292a-3p, miR-294-3p, and miR-295-3p, was significantly higher in the pri-miR-290-pcDNA3.1-EGFP group (Figure 7C).
To investigate whether the miR-290 family can replace SB203580 to maintain pluripotency in stem cells, we examined the expression levels of pluripotency markers and three germ layer markers. RT-qPCR analysis showed that the expression of pluripotency markers Oct4 and Sox2 in the pri-miR-290-pcDNA3.1-EGFP group was comparable to that in rPSCs, with higher expression compared with rPSCs(-SB). Furthermore, the mesoderm markers T, Hand, and Evx1 were significantly increased in the pri-miR-290-pcDNA3.1-EGFP group (Figure 7D). In contrast, the expression of endoderm markers Gata6 and Sox17 was much lower in the pri-miR-290-pcDNA3.1-EGFP group. However, the pri-miR-290-pcDNA3.1-EGFP group displayed intermediate levels of ectoderm markers, such as Nestin, Ncam, and K8, between those observed in rPSCs and rPSCs(-SB) (Figure 7D). To further demonstrate the involvement of miR-290 in repressing the p38 MAPK signaling pathway, we assessed the protein expression of both phosphorylated and total forms of p38 MAPK and ERK. Western blot analysis revealed that p38 MAPK signaling was increased in rPSCs(-SB) compared with the rPSCs and pri-miR-290-pcDNA3.1-EGFP group, particularly evident for phosphorylated forms of the p38 MAPK protein (Figure 7E,F). However, there were no significant differences in the expression of ERK and p-ERK in rPSCs, rPSCs(-SB), and the pri-miR-290-pcDNA3.1-EGFP group (Figure 7E,F). Furthermore, we found that the down-regulating target genes of the p38 MAPK signaling pathway, Atf3, Fzd4, and Hey1, were significantly upregulated in the pri-miR-290-pcDNA3.1-EGFP group. Conversely, up-regulating target genes Atm, Mertk, Sox13, and Stag2 were significantly downregulated compared with those expressed in rPSCs(-SB) (Figure 7G), indicating the p38 MAPK signaling pathway was inhibited.
In addition, to assess the differentiated potency of the pri-miR-290-pcDNA3.1-EGFP group in vitro, we compared the formation of EB between rPSCs and the pri-miR-290-pcDNA3.1-EGFP group. The EB derived from the pri-miR-290-pcDNA3.1-EGFP group presented a smaller diameter compared with the one derived from rPSCs (Figure 7H), with the diameter of pri-miR-290-pcDNA3.1-EGFP-EB at day 6 measuring approximately 180 μm, which was smaller than that of rPSCs-EB (Figure 7I). RT-qPCR results showed that expression levels of germ layer markers were all increased in the pri-miR-290-pcDNA3.1-EGFP group-derived EB (pri-miR-290-pcDNA3.1-EGFP-EB) compared with rPSCs-EB (Figure 7J). The formation of teratoma was also performed, demonstrating that the pri-miR-290-pcDNA3.1-EGFP group could differentiate into multiple tissues in vivo (Figure 7K).
Collectively, these results indicate that overexpression of the miR-290 family can reverse the cell phenotype induced by SB203580 deletion. Notably, the miR-290 family inhibits the p38 MAPK signaling pathway in response to SB203580 removal while leaving the ERK signaling pathway unaffected. This further supports the involvement of miR-290 in maintaining pluripotency in rPSCs through the regulation of the p38 MAPK pathway. Moreover, our results are consistent with previous studies [55,56], highlighting how the miR-290 family promotes PSC pluripotency maintenance.

3. Discussion

Pluripotent stem cells can be derived from different stages of early embryonic development and maintain a self-renewal state in vitro by supplementing exogenous cues [57]. EpiSCs and ESCs can be interconverted, with the transition from ESCs to EpiSCs achieved by adapting culture conditions [10,58]. However, EpiSCs reversion to ESCs is extremely inefficient, suggesting that there could be an unknown transcriptional or epigenetic barrier that prevents reversion of developmental commitments. While the differentiation of ESCs to the primed state has been achieved, the reprogramming of EpiSCs to the naïve state has mostly relied on the overexpression of transcription factors [59,60,61,62]. Recently, Yu et al. demonstrated an induced primed to naïve transition system without any exogenous transcription factor expression. They induced EpiSCs with BMP4, DOT1L inhibitor, and EZH2 inhibitor, followed by transfer into 2i/LIF culture, resulting in the conversion of primed cells into naïve colonies [26]. However, the above study requires a two-step process to complete the transition from a primed to a naïve state. In this study, we describe the derivation of a novel cell type called rPSCs from mouse EpiSCs by culturing them in rPSCs medium containing LIF, BMP4, CHIR99021, XAV939, and SB203580. We also explored the underlying mechanisms of pluripotency maintenance in rPSCs.
The rPSCs described in this study exhibit domed colonies and higher expression of pluripotency genes, as well as lower expression of the primed marker Fgf5 compared with EpiSCs. rPSCs have the potential to form teratomas with three germ layers differentiated in vivo and can contribute to the ICM when injected into an 8-cell stage embryo. Transcriptome analysis suggests that rPSCs appear to be in an intermediate state between naïve ESCs and primed EpiSCs with unique molecular features. Collectively, we propose that the culture conditions for rPSCs promote the conversion from a prime to a naïve state, placing rPSCs in an intermediate state close to the formative state but with unique molecular features in a newly chemically defined medium.
Here, the MAPK signaling pathway was essential for maintaining pluripotency and self-renewal in rPSCs. The MAPK pathways include the ERK pathway, the Jun N-terminal kinase (JNK) pathway, and the p38 pathway. Each member of MAPK is activated in response to various extracellular stimuli, and regulating gene expression mainly controls various biological processes such as cell proliferation, cell differentiation, pluripotency, cell cycle arrest, apoptosis, etc. [63]. Several MAPK inhibitors have been investigated for their roles in early embryonic and stem cell development [64,65]. For example, the MAP2K1 inhibitor has been used to derive mouse ESCs from early blastomeres [64]. In addition, the p38 inhibitor has been reported to inhibit trophectoderm cell development in mouse morula [65]. Blocking p38α has also been found to support the naïve pluripotency of mouse ESCs [27]. In previous studies, JNK inhibitor SP600125 and p38 inhibitor SB203580 have been used to generate naïve state iPSCs from rhesus monkey fibroblasts and porcine bone marrow mesenchymal stem cells with high efficiency [66,67]. Similarly, we demonstrate that the p38 inhibitor SB203580 maintains the self-renewal of rPSCs. Withdrawal of SB203580 leads to a significant reduction in the expression of pluripotency genes, a change in cell morphology from domed to flat, and weakly positive AP staining. The addition of SB203580 during the formation of early primitive ectoderm-like cells has been shown to induce colonies exhibiting the characteristics of mouse ESC colonies with a rounded appearance and refractive edges [68].
Furthermore, the expression of endoderm-related genes, such as Gata4, Gata6, and Sox17, was increased after SB203580 was withdrawn. Thus, we hypothesized that activation of the p38 MAPK signaling pathway promotes differentiation towards the endoderm. Yap et al. found that p38 MAPK activity plays an important role in gastrulation and endoderm population formation; the expression of endoderm markers Sox17, Ttr, Gata4, Trh, and Eya2 was significantly decreased in conditions with the addition of SB203580 [69]. Therefore, activation or repression of the p38 MAPK pathway at different time points of cell differentiation is critical for lineage differentiation [70]. Trouillas et al. showed that inhibition of p38 MAPK enhances neurogenesis [71], and our results showed that the withdrawal of SB203580 reduces the expression of ectoderm-related genes Nestin, Pax6, and Ncam. Altogether, the p38 MAPK signaling pathway plays multiple roles in PSCs and development, and the absence of SB203580 in rPSCs facilitates exit from the pluripotent state and promotes endoderm differentiation. Nevertheless, the specific mechanism of the p38 MAPK signaling pathway in regulating pluripotency and self-renewal in rPSCs requires further investigation.
Recent studies have highlighted the importance of epigenetics in pluripotency regulation. Habibi et al. found that naïve ESCs exhibit epigenetic characteristics similar to ICM, including global DNA hypo-methylation [50]. Conversely, EpiSCs exhibit a transcriptional profile and genome-wide DNA hypermethylation similar to the post-implantation epiblast [72]. The DNA methylation level in the promoter region of pluripotency genes in rPSCs was between EpiSCs and ESCs, and the mRNA levels of DNA methyltransferases (DNMT), such as Dnmt3a, Dnmt3b, and Dnmt1, were also significantly decreased in rPSCs. In addition, the expression of the miR-290 family was increased in rPSCs compared with EpiSCs. The MiR-290 family constitutes over 60% of the entire miRNA population in mouse ESCs [73]. Several studies have addressed the miR-290-295 cluster as a direct target of the Oct4, Sox2, and Nanog regulatory networks participating in stem cell regulation [73]. Our previous study demonstrated that the miR-290 family maintains developmental potential by targeting P21 in mouse pre-implantation embryos and that knockdown of the miR-290 family in ESCs results in a significantly increased the expression of differentiation-related genes [74]. The expression of the miR-290 family is correlated with developmental potency, with a decrease in miR-290-295 expression as ESCs differentiate [45]. Jouneau et al. proposed that during the conversion of mouse ESCs from naïve to primed conditions, the expression of miR-290-295 decreased [75]. This is also supported by our results: the expression of miR-290 family members was upregulated during the conversion of primed EpiSCs to rPSCs. A super enhancer (SE) is a cluster of enhancers that has a stronger ability to promote transcription compared to the typical enhancer, and it plays an important role in the development of ESCs and multiple cancers [76]. Stelzer et al. reported that the miR-290 SE region is hypo-methylated in ESCs but becomes de novo methylated upon differentiation [47]. However, we observed higher expression levels of the miR-290 family members and methylation of the miR-290 SE region in rPSCs compared with ESCs; its function and regulation on pluripotency remain to be clarified.
Notably, the expression of the miR-290-295 cluster decreases when SB203580 is withdrawn, which is consistent with previous reports showing a slight decrease in miR-290 family miRNAs during the transition from naïve to primed state [45,77]. In recent years, the miR-290-295 cluster has been implicated in the regulation of pluripotency maintenance, self-renewal, and reprogramming of somatic cells to an ESC-like state [78]. Forced expression of miR-291-3p, miR-294, and miR-295, or pan-inhibition of let7 miRNAs, improves the reprogramming efficiency of MEFs into induced pluripotent stem cells (iPSCs) by Oct4, Klf4, and Sox2 [78,79]. Despite the well-established role of miRNAs in ESCs, their link to signaling pathways remains largely elusive. In this study, miR-290 family target genes were enriched in the MAPK signaling pathway, and Map2k6 was identified as a common target of the miR-290 family. Therefore, we propose that the miR-290 family regulates the MAPK signaling pathway by reducing the expression of its downstream target gene Map2k6 to maintain pluripotency when SB203580 is withdrawn. Remarkably, overexpression of pri-miR-290 in rPSCs(-SB) changes cell morphology from flat to domed, resulting in an increase in pluripotency gene expression, a decrease in endoderm-related gene expression, and a significant upregulation of mesoderm-related genes. In human embryonic stem cells (hESCs), overexpression of miR-373 (homologous to miR-290 in mice) leads to their differentiation towards the mesendodermal lineage [80]. These results suggest that the miR-290 family can replace the p38 MAPK signaling pathway inhibitor SB203580 to maintain the pluripotency of rPSCs.
In summary, a new type of pluripotent stem cell, rPSCs, has been derived from EpiSCs in the rPSCs culture condition. The rPSCs have unique molecular features and are in intermediate states. Moreover, the miR-290 family can replace SB203580, involved in the pluripotency maintenance and self-renewal of rPSCs, by inhibiting the p38 MAPK signaling pathway. Thus, capturing unique pluripotent states in culture as expandable cell lines provides a valuable tool to understand the molecular mechanisms underpinning pluripotency transitions, germline or somatic fate determination, and cellular reprogramming, as well as the possibility of reproducing germline developmental processes in vitro [81,82]. Furthermore, understanding the interaction between the miR-290 family and the MAPK pathway opens new avenues to explore the underlying mechanisms.

4. Materials and Methods

4.1. Animals

CD-1®(ICR) IGS and BALB/c-nu mice were purchased from SPF (Beijing) Biotechnology (China) at the age of 6–8 weeks. All mice were housed under controlled lighting conditions (light: 08:00–20:00) and had free access to food and water.

4.2. Derivation of EpiSCs

Mouse gastrulas were collected from E6.5 pregnant female ICR mice. The epiblasts (E6.5) were isolated from gastrulas using a glass needle and cultured in AF medium. After 5–10 days, the outgrowths were minced into several smaller pieces using a glass needle and transferred to fresh AF medium. The colonies, named EpiSCs, were able to propagate stably with Accutase (Gibco, Gaithersburg, MD,USA) every 2 days at a ratio of 1:3–1:6, with fresh AF medium provided daily. Mouse EpiSCs were cultured in serum-free AF medium under 5% CO2 at 37 °C. The AF medium consisted of Activin A (20 ng/mL, R&D Systems, Minneapolis, MN, USA) and bFGF (12 ng/mL, R&D Systems) added to a basic N2B27 medium. A total of 500 mL of N2B27 medium was prepared using 240 mL DMEM/F12 (Gibco, USA), 240 mL Neurobasal (Gibco, USA), 2.5 mL N2 supplement (Gibco, USA), 5 mL B27 supplement (Gibco, USA), 1% GlutaMAX (Gibco, USA), 1% nonessential amino acids (Gibco, USA), 0.1 mM β-mercaptoethanol (Gibco, USA), 1% penicillin-streptomycin (Gibco, USA), and 5 mg/mL BSA (Gibco, USA). All culture dishes were coated with Hu Plasma Fibronectin (FN, 1 mg/mL in Dulbecco’s phosphate-buffered saline (DPBS), Millipore Billerica, MA, USA) for at least 30 min before use.

4.3. Conversion of EpiSCs to rPSCs

To convert EpiSCs to rPSCs, EpiSCs were dissociated into single cells using Accutase (Gibco, USA) and plated in rPSCs medium. The rPSCs medium was prepared by adding small molecules and cytokines to the N2B27 medium in the following final concentrations: 1000 U/mL LIF (Millipore, Billerica, MA, USA), 50 ng/mL BMP4 (R&D Systems, USA), 3 µM CHIR99021 (R&D Systems, USA), 10 μM SB203580 (Tocris, Minneapolis, MN, USA), and 5 μM XAV939 (Sigma, Darmstadt, Germany). After 5–7 days, domed clonal clusters emerged, which were minced into several smaller pieces using a glass needle and transferred to fresh rPSCs medium. The colonies, named rPSCs, could be stably propagated by Accutase (Gibco, USA) daily at a ratio of 1:3–1:6. All culture dishes were coated with FN for at least 30 min before use.

4.4. Culture of Mouse ESCs

Mouse ESCs were maintained under 5% CO2 at 37 °C on FN-coated dishes in 2i/LIF medium that contained serum-free N2B27 medium supplemented with 1000 U/mL LIF (Millipore, USA), 3 µM CHIR99021 (R&D Systems, USA), and 1 μM PD0325901 (R&D Systems, USA). Cells were passaged every 2 days using Accutase (Gibco, USA).

4.5. AP Staining

Prior to staining, cells were placed in a four-well plate, washed with DPBS, and then fixed in 4% paraformaldehyde at room temperature for 30 min. The cells were washed with DPBS again, followed by the addition of an AP staining solution. The AP staining solution was prepared as follows: 50 µL sodium nitrite solution was gently mixed with 50 µL FRV-alkaline solution and incubated at 37 °C for 3 min; then, 2.25 mL H2O and 50 µL naphthol-As-BI alkaline solution were added to the mixture. The fixed cells were incubated overnight in the dark with the staining solution.

4.6. Karyotype Analysis

The cell cultures were prepared to achieve a confluence of 70–80% on the day of sampling. After 2 h of incubation in fresh medium, a Colcemid solution was added to the medium at a final concentration of 0.02 mg/mL and incubated for 2 h. Then, the cells were washed with DPBS, and Accutase was used to dissociate the cells. The suspensions were centrifuged at 1500 rpm for 5 min to collect the tested cells. The cell pellets were gently resuspended in an 8 mL hypotonic solution of 0.075 mol/L KCl (Sigma, USA) and incubated at 37 °C in a water bath for 40 min. Subsequently, 1 mL of ice-cold fixative liquid (methanol: glacial acetic acid = 3:1) was added to the resuspended cells and mixed gently, and the solution was then centrifuged at 1000 rpm for 10 min. After discarding the supernatant, the cells were gently mixed in an 8 mL fixative solution and incubated in a 37 °C water bath for 30 min to fix the cells. This process was repeated twice. Finally, the pellet was re-suspended in a final volume of 1 mL of fixative and dropped onto ice-cold glass slides, which were then dried for 1 h at 70 °C in a drying oven. The glass slides were stained in Giemsa (Sigma, USA) for 10 min, washed with distilled water, and air-dried. For each analysis, at least 60–80 metaphases were examined to determine the number of chromosomes and the presence of structural chromosomal abnormalities.

4.7. Immunofluorescence

The cells used for immunofluorescence assays were washed with DPBS, fixed in 4% paraformaldehyde for 30 min at room temperature, and permeabilized with 0.1% Triton X-100 (Sigma, USA) and 1% BSA in DPBS for 30 min. The cells were then incubated with primary antibodies overnight at 4 °C. After the cells were washed three times in 1% BSA and 0.1% Triton X-100 in DPBS for 5 min per wash, they were incubated with secondary antibodies for 1 h at room temperature in the dark. The cells were washed three times in 1% BSA and 0.1% Triton X-100 in DPBS for 5 min per wash. Nuclei were stained with 10 μg/mL DAPI, and then cells were mounted on glass slides with Vectashield. The antibodies used are listed in Supplementary Table S1.

4.8. Total RNA, miRNA Extraction, and RT-qPCR

Total RNA and miRNA were extracted using an RNeasy Mini Kit (No. 74104, Qiagen, Hilden, Germany) and an miRNeasy Micro Kit (No. 217084, Qiagen, Germany), respectively. Reverse transcription was performed using a PrimeScript RT reagent kit with gDNA Eraser (RR047A, Takara, Otsu, Shiga, Japan) and a Mir-X miRNA First-Strand Synthesis kit (638313, Clontech, Mountain View, CA, USA). Real-time quantitative polymerase chain reaction (RT-qPCR) was performed using GoTaq® qPCR Master Mix (A6002, Promega, Madison, WI, USA), and signals were detected with an ABI7500 Real-Time PCR System (Life Technologies, Singapore). All experiments were performed according to the respective manufacturer’s protocols. Relative gene expression was determined using the 2−ΔΔCt method. The primers used in these analyses are listed in supplementary Table S2. They were designed using Primer Premier 5.0 and synthesized by the Beijing Genomics Institution (BGI, Beijing, China).

4.9. Western Blot

Whole-cell protein extracts were isolated from cells using RIPA lysis buffer (P0013B, Beyotime Technology, Shanghai, China) supplemented with protease inhibitor cocktail (78443, Thermo Fisher Scientific, Waltham, MA,) and phosphatase inhibitor cocktail. The cell lysates were placed on ice for 10 min and centrifuged at 12,000 rpm at 4 °C for 10 min, and the supernatant was transferred to new tubes. Protein concentration was determined using a Pierce BCA Protein Assay Kit (23225, Thermo, Waltham, MA, USA,). Subsequently, 20 μg of protein was separated via SDS polyacrylamide gel electrophoresis (SDS-PAGE). Blots were incubated in 5% BSA/TBST at room temperature for 2 h, and then they were incubated with the stated antibodies in 2% skimmed milk powder/TBST at 4 °C overnight. The membranes were washed three times in TBST solution and incubated with secondary antibodies (diluted in 2% milk powder in TBST solution) for 1 h at room temperature with shaking. Bound antibodies were detected with Clarity Western ECL Substrate (170-5060, Bio-Rad, Hercules, CA, USA). The intensity of the protein bands was calculated using ImageJ software (v1.50i). The antibodies used are listed in Supplementary Table S1.

4.10. Generation of Teratoma

Cells were disaggregated using Accutase into small cell clusters and resuspended in 100 μL DPBS. A total of 5 × 10⁶ cells were injected under the epithelium of BALB/c-nu mice. The tumors were allowed to develop for 4 weeks, then fixed in 4% paraformaldehyde and processed for paraffin sectioning. Sections were observed following hematoxylin and eosin staining.

4.11. Formation of an Embryonic Body

Cells on the FN-coated plate were incubated with Accutase for 3 min at 37 °C until the colonies were completely disaggregated. The colonies were then resuspended in EB medium, containing DMEM/F12 + 20% Knockout serum replacement (KSR, Gibco, Gaithersburg, MD, USA) + 1% GlutaMax + 1% NEAA + 1% β-mercaptoethanol. The cells were resuspended in embryoid body medium at 1 × 10⁵/mL and cultured in suspension at 30 μL per drop for 6 days.

4.12. Generation of Chimera

To generate chimeric embryos, donor cells were microinjected into the 8-cell ICR mice using a piezo-assisted micromanipulator attached to an inverted microscope. They developed into blastocysts after being grown in potassium simplex optimization medium (KSOM, Millipore, Billerica, MA, USA). Recover the injected embryos in KSOM culture for 24 h to form blastocysts.

4.13. DNA Methylation Analysis

Total DNA was extracted using the Wizard® SV Genomic DNA Purification System (A2360, Promega, Madison, WI, USA). To determine the DNA methylation profiles of the Oct4, Sox2, Nanog promoter regions, and the pri-miR-290 super enhancer region, sample pools consisting of genomic DNA from cells were subjected to the bisulfite reaction using the EZ DNA Methylation-GoldTM Kit (D5005, ZYMO RESEARCH, Irvine, CA, USA), according to the manufacturer’s instructions. Each bisulfite-treated genome was amplified using GoTaq® Hot Start Master Mix (M5122, Promega, Madison, WI, USA) and the specific primers listed in Supplementary Table S2. Bisulfite-treated genomic mixtures were subjected to PCR, and 20 of the resulting subclones were sequenced with bisulfite for each sample.

4.14. Transcriptome Analysis

All collected cells were treated with the RNeasy Mini Kit (No. 74104, Qiagen, Hilden, Germany) to obtain mRNA. RNA integrity was assessed using the RNA Nano 6000 Assay Kit of the Agilent Bioanalyzer 2100 system (Agilent Technologies, Palo Alto, CA, USA). Sequencing libraries were generated using the Hieff NGS Ultima Dual-mode mRNA Library Prep Kit for Illumina (Yeasen Biotechnology (Shanghai), China), and index codes were added to attribute sequences in each sample. The cDNA libraries were sequenced using the Illumina NovaSeq platform. Genes with an adjusted p-value < 0.01 and a fold change of ≥2 found by DESeq2 were assigned as differentially expressed. Principal component analysis (PCA), GO enrichment analysis, Pearson’s correlation analysis, and pathway enrichment analysis of differential genes were performed using an online data analysis platform (https://www.biocloud.net/ accessed on 10 May 2022). The volcano plot was performed using the ggplot2 R package (v3.3.3), and heatmaps of selected genes were plotted using the pheatmap R package (v1.0.12).

4.15. Construction of Expression Plasmid Vectors

The pri-miR-290 sequence was PCR-amplified from mouse ESCs cDNA using LA Taq (RR02MA, Takara, Otsu, Shiga, Japan). The pri-miR-290 cDNA was cloned into Nhe I/Kpn I (R6501 and R6341, Promega, Madison, WI, USA) restriction enzyme sites in a pcDNA3.1-EGFP plasmid (No. 129020, Addgene, Cambridge, MA, USA). Please refer to our previous published papers for details [74]. The primers are listed in Supplementary Table S2.

4.16. Dual-Iuciferase Reporter Assay

ESCs were co-transfected with pmirGLO plasmids containing wild or mutant 3′-untranslated region (3′-UTR) fragments from Map2k6 (or Map2k3) and miRNA mimics using Lipofectamine 2000 (Invitrogen, Carlsbad, CA, USA), following the manufacturer’s protocol. After 24 h of transfection, firefly and renilla luciferase activities were measured consecutively using a GloMax® 20/20 Luminometer (Promega, Madison, WI, USA). The ratio of firefly to renilla luciferase luminescence was calculated. The sequences are listed in Supplementary Table S2.

4.17. miR-290 Family Target Genes Analysis

The GO and KEGG analyses of the miR-290 family target genes were performed using DAVID software available at https://david.ncifcrf.gov/summary.jsp (accessed on 28 December 2020), following the website operation process.

4.18. Statistical Analysis

All measures were taken from distinct samples. Unless there was a specific statement about the number of replicates, three replicates were analyzed for each experiment. All data were reported as the mean ± s.e.m. The Student’s t-test was used for comparisons between two groups, with * p < 0.05, ** p < 0.01, *** p < 0.001, and ns at p > 0.05.

Supplementary Materials

The following supporting information can be downloaded at: https://www.mdpi.com/article/10.3390/ijms25052681/s1.

Author Contributions

Conceptualization, H.Y. and Y.L.; methodology, Y.L. and X.L.; bioinformatic analyses, X.L.; validation, Y.L., X.M. and Q.D.; writing—original draft preparation, Y.L. and X.L.; writing—review and editing, Y.L., X.L., H.Y. and J.W.; funding acquisition, H.Y. All authors have read and agreed to the published version of the manuscript.

Funding

This study was supported by grants from the National Natural Science Foundation of China (31760333) and the Key Technology Research Plan Project of the Inner Mongolia Autonomous Region (2021GG0153) to Haiquan Yu.

Institutional Review Board Statement

All studies adhered to procedures consistent with the National Research Council Guide for the Care and Use of Laboratory Animals and were approved by the Institutional Animal Care and Use Committee at Inner Mongolia University (SYXK (Inner Mongolia) 2020-0006).

Informed Consent Statement

Not applicable.

Data Availability Statement

Our rPSCs RNA-seq data are available through the NCBI Sequence Read Archive under the ID PRJNA989402. The RNA-seq data for ESCs and EpiSCs were obtained from NCBI (accession number: GSE99494, accessed on 6 May 2023). FSCs were obtained from NCBI (accession number: GSE131556, accessed on 6 May 2023). Moreover, 2-Cell, 4-Cell, and E3.5 ICM were obtained from NCBI (accession numbers: GSE126056 and GSE66582, accessed on 6 May 2023). E4.0 ICM, E5.5 EPI, and E6.5 EPI were obtained from NCBI (accession number: GSE76505, accessed on 6 May 2023).

Acknowledgments

The authors are grateful to Xin Zhao, Qian Zhang, and Lewei Chu for their generous participation and cooperation.

Conflicts of Interest

The authors declare no conflict of interest.

References

  1. Hackett, J.A.; Surani, M.A. Regulatory principles of pluripotency: From the ground state up. Cell Stem Cell 2014, 15, 416–430. [Google Scholar] [CrossRef]
  2. Weinberger, L.; Ayyash, M.; Novershtern, N.; Hanna, J.H. Dynamic stem cell states: Naive to primed pluripotency in rodents and humans. Nat. Rev. Mol. Cell Biol. 2016, 17, 155–169. [Google Scholar] [CrossRef] [PubMed]
  3. EVANS, M.J. Establishment in culture of pluripotential cells from mouse embryos. Nature 1981, 292, 154–156. [Google Scholar] [CrossRef] [PubMed]
  4. Brons, I.G.; Smithers, L.E.; Trotter, M.W.; Rugg-Gunn, P.; Sun, B.; Chuva de Sousa Lopes, S.M.; Howlett, S.K.; Clarkson, A.; Ahrlund-Richter, L.; Pedersen, R.A.; et al. Derivation of pluripotent epiblast stem cells from mammalian embryos. Nature 2007, 448, 191–195. [Google Scholar] [CrossRef] [PubMed]
  5. Nichols, J.; Smith, A. Naive and Primed Pluripotent States. Cell Stem Cell 2009, 4, 487–492. [Google Scholar] [CrossRef] [PubMed]
  6. Niwa, H.; Burdon, T.; Chambers, I.; Smith, A. Self-renewal of pluripotent embryonic stem cells is mediated via activation of STAT3. Genes. Dev. 1998, 12, 2048–2060. [Google Scholar] [CrossRef] [PubMed]
  7. Marks, H.; Kalkan, T.; Menafra, R.; Denissov, S.; Jones, K.; Hofemeister, H.; Nichols, J.; Kranz, A.; Stewart, A.F.; Smith, A.; et al. The transcriptional and epigenomic foundations of ground state pluripotency. Cell 2012, 149, 590–604. [Google Scholar] [CrossRef]
  8. Tesar, P.J.; Chenoweth, J.G.; Brook, F.A.; Davies, T.J.; Evans, E.P.; Mack, D.L.; Gardner, R.L.; McKay, R.D. New cell lines from mouse epiblast share defining features with human embryonic stem cells. Nature 2007, 448, 196–199. [Google Scholar] [CrossRef]
  9. Rossant, J. Stem cells and early lineage development. Cell 2008, 132, 527–531. [Google Scholar] [CrossRef]
  10. Schulz, E.G.; Meisig, J.; Nakamura, T.; Okamoto, I.; Sieber, A.; Picard, C.; Borensztein, M.; Saitou, M.; Blüthgen, N.; Heard, E. The two active X chromosomes in female ESCs block exit from the pluripotent state by modulating the ESC signaling network. Cell Stem Cell 2014, 14, 203–216. [Google Scholar] [CrossRef]
  11. Smith, A. Formative pluripotency: The executive phase in a developmental continuum. Development 2017, 144, 365–373. [Google Scholar] [CrossRef]
  12. Endoh, M.; Niwa, H. Stepwise pluripotency transitions in mouse stem cells. EMBO Rep. 2022, 23, e55010. [Google Scholar] [CrossRef]
  13. Kinoshita, M.; Smith, A. Pluripotency Deconstructed. Dev. Growth Differ. 2018, 60, 44–52. [Google Scholar] [CrossRef]
  14. Acampora, D.; Di Giovannantonio, L.G.; Simeone, A. Otx2 is an intrinsic determinant of the embryonic stem cell state and is required for transition to a stable epiblast stem cell condition. Development 2013, 140, 43–55. [Google Scholar] [CrossRef]
  15. Kinoshita, M.; Barber, M.; Mansfield, W.; Cui, Y.; Spindlow, D.; Stirparo, G.G.; Dietmann, S.; Nichols, J.; Smith, A. Capture of Mouse and Human Stem Cells with Features of Formative Pluripotency. Cell Stem Cell 2021, 28, 453–471.e458. [Google Scholar] [CrossRef] [PubMed]
  16. Yu, L.; Wei, Y.; Sun, H.X.; Mahdi, A.K.; Pinzon Arteaga, C.A.; Sakurai, M.; Schmitz, D.A.; Zheng, C.; Ballard, E.D.; Li, J.; et al. Derivation of Intermediate Pluripotent Stem Cells Amenable to Primordial Germ Cell Specification. Cell Stem Cell 2021, 28, 550–567.e512. [Google Scholar] [CrossRef] [PubMed]
  17. Young, R.A. Control of the embryonic stem cell state. Cell 2011, 144, 940–954. [Google Scholar] [CrossRef] [PubMed]
  18. Macarthur, B.D.; Ma'ayan, A.; Lemischka, I.R. Systems biology of stem cell fate and cellular reprogramming. Nat. Rev. Mol. Cell Biol. 2009, 10, 672–681. [Google Scholar] [CrossRef]
  19. Chen, X.; Vega, V.B.; Ng, H.H. Transcriptional regulatory networks in embryonic stem cells. Cold Spring Harb. Symp. Quant. Biol. 2008, 73, 203–209. [Google Scholar] [CrossRef]
  20. Ng, R.K.; Dean, W.; Dawson, C.; Lucifero, D.; Madeja, Z.; Reik, W.; Hemberger, M. Epigenetic restriction of embryonic cell lineage fate by methylation of Elf5. Nat. Cell Biol. 2008, 10, 1280–1290. [Google Scholar] [CrossRef]
  21. Tsumura, A.; Hayakawa, T.; Kumaki, Y.; Takebayashi, S.; Sakaue, M.; Matsuoka, C.; Shimotohno, K.; Ishikawa, F.; Li, E.; Ueda, H.R.; et al. Maintenance of self-renewal ability of mouse embryonic stem cells in the absence of DNA methyltransferases Dnmt1, Dnmt3a and Dnmt3b. Genes. Cells 2006, 11, 805–814. [Google Scholar] [CrossRef]
  22. Zhang, Z.; Zhuang, L.; Lin, C.P. Roles of MicroRNAs in Establishing and Modulating Stem Cell Potential. Int. J. Mol. Sci. 2019, 20, 3643. [Google Scholar] [CrossRef] [PubMed]
  23. Ying, Q.L.; Wray, J.; Nichols, J.; Batlle-Morera, L.; Doble, B.; Woodgett, J.; Cohen, P.; Smith, A. The ground state of embryonic stem cell self-renewal. Nature 2008, 453, 519–523. [Google Scholar] [CrossRef]
  24. Neagu, A.; van Genderen, E.; Escudero, I.; Verwegen, L.; Kurek, D.; Lehmann, J.; Stel, J.; Dirks, R.A.M.; van Mierlo, G.; Maas, A.; et al. In vitro capture and characterization of embryonic rosette-stage pluripotency between naive and primed states. Nat. Cell Biol. 2020, 22, 534–545. [Google Scholar] [CrossRef] [PubMed]
  25. Ying, Q.L.; Nichols, J.; Chambers, I.; Smith, A. BMP induction of Id proteins suppresses differentiation and sustains embryonic stem cell self-renewal in collaboration with STAT3. Cell 2003, 115, 281–292. [Google Scholar] [CrossRef]
  26. Yu, S.; Zhou, C.; Cao, S.; He, J.; Cai, B.; Wu, K.; Qin, Y.; Huang, X.; Xiao, L.; Ye, J.; et al. BMP4 resets mouse epiblast stem cells to naive pluripotency through ZBTB7A/B-mediated chromatin remodelling. Nat. Cell Biol. 2020, 22, 651–662. [Google Scholar] [CrossRef] [PubMed]
  27. Li, Z.; Rana, T.M. A kinase inhibitor screen identifies small-molecule enhancers of reprogramming and iPS cell generation. Nat. Commun. 2012, 3, 1085. [Google Scholar] [CrossRef]
  28. Wang, W.; Li, N.; Li, X.; Tran, M.K.; Han, X.; Chen, J. Tankyrase Inhibitors Target YAP by Stabilizing Angiomotin Family Proteins. Cell Rep. 2015, 13, 524–532. [Google Scholar] [CrossRef]
  29. Boheler, K.R.; Czyz, J.; Tweedie, D.; Yang, H.T.; Anisimov, S.V.; Wobus, A.M. Differentiation of pluripotent embryonic stem cells into cardiomyocytes. Circ. Res. 2002, 91, 189–201. [Google Scholar] [CrossRef]
  30. Higuchi, C.; Yamamoto, M.; Shin, S.W.; Miyamoto, K.; Matsumoto, K. Perturbation of maternal PIASy abundance disrupts zygotic genome activation and embryonic development via SUMOylation pathway. Biol. Open 2019, 8, bio048652. [Google Scholar] [CrossRef]
  31. Wu, J.; Huang, B.; Chen, H.; Yin, Q.; Liu, Y.; Xiang, Y.; Zhang, B.; Liu, B.; Wang, Q.; Xia, W.; et al. The landscape of accessible chromatin in mammalian preimplantation embryos. Nature 2016, 534, 652–657. [Google Scholar] [CrossRef]
  32. Zhang, Y.; Xiang, Y.; Yin, Q.; Du, Z.; Peng, X.; Wang, Q.; Fidalgo, M.; Xia, W.; Li, Y.; Zhao, Z.A.; et al. Dynamic epigenomic landscapes during early lineage specification in mouse embryos. Nat. Genet. 2018, 50, 96–105. [Google Scholar] [CrossRef] [PubMed]
  33. Takagi, N.; Sugawara, O.; Sasaki, M. Regional and temporal changes in the pattern of X-chromosome replication during the early post-implantation development of the female mouse. Chromosoma 1982, 85, 275–286. [Google Scholar] [CrossRef] [PubMed]
  34. Chuva de Sousa Lopes, S.M.; Hayashi, K.; Shovlin, T.C.; Mifsud, W.; Surani, M.A.; McLaren, A. X chromosome activity in mouse XX primordial germ cells. PLoS Genet. 2008, 4, e30. [Google Scholar] [CrossRef] [PubMed]
  35. Plath, K.; Fang, J.; Mlynarczyk-Evans, S.K.; Cao, R.; Worringer, K.A.; Wang, H.; de la Cruz, C.C.; Otte, A.P.; Panning, B.; Zhang, Y. Role of histone H3 lysine 27 methylation in X inactivation. Science 2003, 300, 131–135. [Google Scholar] [CrossRef]
  36. Thorvaldsen, J.L.; Verona, R.I.; Bartolomei, M.S. X-tra! X-tra! News from the mouse X chromosome. Dev. Biol. 2006, 298, 344–353. [Google Scholar] [CrossRef] [PubMed]
  37. Pasque, V.; Karnik, R.; Chronis, C.; Petrella, P.; Langerman, J.; Bonora, G.; Song, J.; Vanheer, L.; Sadhu Dimashkie, A.; Meissner, A.; et al. X Chromosome Dosage Influences DNA Methylation Dynamics during Reprogramming to Mouse iPSCs. Stem Cell Reports 2018, 10, 1537–1550. [Google Scholar] [CrossRef]
  38. Cirio, M.C.; Ratnam, S.; Ding, F.; Reinhart, B.; Navara, C.; Chaillet, J.R. Preimplantation expression of the somatic form of Dnmt1 suggests a role in the inheritance of genomic imprints. BMC Dev. Biol. 2008, 8, 9. [Google Scholar] [CrossRef]
  39. Bourc'his, D.; Xu, G.L.; Lin, C.S.; Bollman, B.; Bestor, T.H. Dnmt3L and the establishment of maternal genomic imprints. Science 2001, 294, 2536–2539. [Google Scholar] [CrossRef]
  40. Koh, K.P.; Yabuuchi, A.; Rao, S.; Huang, Y.; Cunniff, K.; Nardone, J.; Laiho, A.; Tahiliani, M.; Sommer, C.A.; Mostoslavsky, G.; et al. Tet1 and Tet2 regulate 5-hydroxymethylcytosine production and cell lineage specification in mouse embryonic stem cells. Cell Stem Cell 2011, 8, 200–213. [Google Scholar] [CrossRef]
  41. Wang, Y.; Medvid, R.; Melton, C.; Jaenisch, R.; Blelloch, R. DGCR8 is essential for microRNA biogenesis and silencing of embryonic stem cell self-renewal. Nat. Genet. 2007, 39, 380–385. [Google Scholar] [CrossRef] [PubMed]
  42. Leung, A.K.; Young, A.G.; Bhutkar, A.; Zheng, G.X.; Bosson, A.D.; Nielsen, C.B.; Sharp, P.A. Genome-wide identification of Ago2 binding sites from mouse embryonic stem cells with and without mature microRNAs. Nat. Struct. Mol. Biol. 2011, 18, 237–244. [Google Scholar] [CrossRef] [PubMed]
  43. Zheng, G.X.; Ravi, A.; Calabrese, J.M.; Medeiros, L.A.; Kirak, O.; Dennis, L.M.; Jaenisch, R.; Burge, C.B.; Sharp, P.A. A latent pro-survival function for the mir-290-295 cluster in mouse embryonic stem cells. PLoS Genet. 2011, 7, e1002054. [Google Scholar] [CrossRef]
  44. Ciaudo, C.; Servant, N.; Cognat, V.; Sarazin, A.; Kieffer, E.; Viville, S.; Colot, V.; Barillot, E.; Heard, E.; Voinnet, O. Highly dynamic and sex-specific expression of microRNAs during early ES cell differentiation. PLoS Genet. 2009, 5, e1000620. [Google Scholar] [CrossRef] [PubMed]
  45. Houbaviy, H.B.; Murray, M.F.; Sharp, P.A. Embryonic stem cell-specific MicroRNAs. Dev. Cell 2003, 5, 351–358. [Google Scholar] [CrossRef] [PubMed]
  46. Spruce, T.; Pernaute, B.; Di-Gregorio, A.; Cobb, B.S.; Merkenschlager, M.; Manzanares, M.; Rodriguez, T.A. An early developmental role for miRNAs in the maintenance of extraembryonic stem cells in the mouse embryo. Dev. Cell 2010, 19, 207–219. [Google Scholar] [CrossRef]
  47. Stelzer, Y.; Shivalila, C.S.; Soldner, F.; Markoulaki, S.; Jaenisch, R. Tracing dynamic changes of DNA methylation at single-cell resolution. Cell 2015, 163, 218–229. [Google Scholar] [CrossRef]
  48. Yang, J.; Ryan, D.J.; Wang, W.; Tsang, C.H.; Lan, G.; Masaki, H.; Gao, X.; Antunes, L.; Yu, Y.; Zhu, Z. Establishment of mouse expanded potential stem cells. Nature 2017, 550, 393. [Google Scholar] [CrossRef]
  49. Leitch, H.G.; McEwen, K.R.; Turp, A.; Encheva, V.; Carroll, T.; Grabole, N.; Mansfield, W.; Nashun, B.; Knezovich, J.G.; Smith, A.; et al. Naive pluripotency is associated with global DNA hypomethylation. Nat. Struct. Mol. Biol. 2013, 20, 311–316. [Google Scholar] [CrossRef]
  50. Habibi, E.; Brinkman, A.B.; Arand, J.; Kroeze, L.I.; Kerstens, H.H.; Matarese, F.; Lepikhov, K.; Gut, M.; Brun-Heath, I.; Hubner, N.C.; et al. Whole-genome bisulfite sequencing of two distinct interconvertible DNA methylomes of mouse embryonic stem cells. Cell Stem Cell 2013, 13, 360–369. [Google Scholar] [CrossRef]
  51. Bartel, D.P. MicroRNAs: Target recognition and regulatory functions. Cell 2009, 136, 215–233. [Google Scholar] [CrossRef] [PubMed]
  52. Yuan, K.; Ai, W.B.; Wan, L.Y.; Tan, X.; Wu, J.F. The miR-290-295 cluster as multi-faceted players in mouse embryonic stem cells. Cell Biosci. 2017, 7, 38. [Google Scholar] [CrossRef] [PubMed]
  53. Lin, S.L.; Chang, D.C.; Lin, C.H.; Ying, S.Y.; Leu, D.; Wu, D.T. Regulation of somatic cell reprogramming through inducible mir-302 expression. Nucleic Acids Res. 2011, 39, 1054–1065. [Google Scholar] [CrossRef] [PubMed]
  54. Houbaviy, H.B.; Dennis, L.; Jaenisch, R.; Sharp, P.A. Characterization of a highly variable eutherian microRNA gene. RNA 2005, 11, 1245–1257. [Google Scholar] [CrossRef] [PubMed]
  55. Jia, W.; Chen, W.; Kang, J. The functions of microRNAs and long non-coding RNAs in embryonic and induced pluripotent stem cells. Genom. Proteom. Bioinform. 2013, 11, 275–283. [Google Scholar] [CrossRef] [PubMed]
  56. Li, M.A.; He, L. microRNAs as novel regulators of stem cell pluripotency and somatic cell reprogramming. Bioessays 2012, 34, 670–680. [Google Scholar] [CrossRef] [PubMed]
  57. Nichols, J.; Smith, A. Pluripotency in the embryo and in culture. Cold Spring Harb. Perspect. Biol. 2012, 4, a008128. [Google Scholar] [CrossRef]
  58. Buecker, C.; Srinivasan, R.; Wu, Z.; Calo, E.; Acampora, D.; Faial, T.; Simeone, A.; Tan, M.; Swigut, T.; Wysocka, J. Reorganization of enhancer patterns in transition from naive to primed pluripotency. Cell Stem Cell 2014, 14, 838–853. [Google Scholar] [CrossRef]
  59. Stuart, H.T.; Stirparo, G.G.; Lohoff, T.; Bates, L.E.; Kinoshita, M.; Lim, C.Y.; Sousa, E.J.; Maskalenka, K.; Radzisheuskaya, A.; Malcolm, A.A.; et al. Distinct Molecular Trajectories Converge to Induce Naive Pluripotency. Cell Stem Cell 2019, 25, 388–406.e388. [Google Scholar] [CrossRef]
  60. Adachi, K.; Kopp, W.; Wu, G.; Heising, S.; Greber, B.; Stehling, M.; Araúzo-Bravo, M.J.; Boerno, S.T.; Timmermann, B.; Vingron, M.; et al. Esrrb Unlocks Silenced Enhancers for Reprogramming to Naive Pluripotency. Cell Stem Cell 2018, 23, 266–275.e266. [Google Scholar] [CrossRef]
  61. Okashita, N.; Suwa, Y.; Nishimura, O.; Sakashita, N.; Kadota, M.; Nagamatsu, G.; Kawaguchi, M.; Kashida, H.; Nakajima, A.; Tachibana, M.; et al. PRDM14 Drives OCT3/4 Recruitment via Active Demethylation in the Transition from Primed to Naive Pluripotency. Stem Cell Reports 2016, 7, 1072–1086. [Google Scholar] [CrossRef] [PubMed]
  62. Dunn, S.J.; Li, M.A.; Carbognin, E.; Smith, A.; Martello, G. A common molecular logic determines embryonic stem cell self-renewal and reprogramming. EMBO J. 2019, 38, e100003. [Google Scholar] [CrossRef] [PubMed]
  63. Liu, Y.; Yamashita, J.K. AMPK activators contribute to maintain naïve pluripotency in mouse embryonic stem cells. Biochem. Biophys. Res. Commun. 2019, 509, 24–31. [Google Scholar] [CrossRef]
  64. Chung, Y.; Klimanskaya, I.; Becker, S.; Marh, J.; Lu, S.J.; Johnson, J.; Meisner, L.; Lanza, R. Embryonic and extraembryonic stem cell lines derived from single mouse blastomeres. Nature 2006, 439, 216–219. [Google Scholar] [CrossRef] [PubMed]
  65. Maekawa, M.; Yamamoto, T.; Tanoue, T.; Yuasa, Y.; Chisaka, O.; Nishida, E. Requirement of the MAP kinase signaling pathways for mouse preimplantation development. Development 2005, 132, 1773–1783. [Google Scholar] [CrossRef] [PubMed]
  66. Fang, R.; Liu, K.; Zhao, Y.; Li, H.; Zhu, D.; Du, Y.; Xiang, C.; Li, X.; Liu, H.; Miao, Z.; et al. Generation of naive induced pluripotent stem cells from rhesus monkey fibroblasts. Cell Stem Cell 2014, 15, 488–497. [Google Scholar] [CrossRef]
  67. Chen, F.; Shi, D.; Zou, L.; Yang, X.; Qiao, S.; Zhang, R.; Yang, S.; Deng, Y. Two Small Molecule Inhibitors Promote Reprogramming of Guangxi Bama Mini-Pig Mesenchymal Stem Cells Into Naive-Like State Induced Pluripotent Stem Cells. Cell Reprogram 2021, 23, 158–167. [Google Scholar] [CrossRef]
  68. Tan, B.S.; Kwek, J.; Wong, C.K.; Saner, N.J.; Yap, C.; Felquer, F.; Morris, M.B.; Gardner, D.K.; Rathjen, P.D.; Rathjen, J. Src Family Kinases and p38 Mitogen-Activated Protein Kinases Regulate Pluripotent Cell Differentiation in Culture. PLoS ONE 2016, 11, e0163244. [Google Scholar] [CrossRef] [PubMed]
  69. Yap, C.; Goh, H.N.; Familari, M.; Rathjen, P.D.; Rathjen, J. The formation of proximal and distal definitive endoderm populations in culture requires p38 MAPK activity. J. Cell Sci. 2014, 127, 2204–2216. [Google Scholar]
  70. Binétruy, B.; Heasley, L.; Bost, F.; Caron, L.; Aouadi, M. Concise review: Regulation of embryonic stem cell lineage commitment by mitogen-activated protein kinases. Stem Cells 2007, 25, 1090–1095. [Google Scholar] [CrossRef]
  71. Trouillas, M.; Saucourt, C.; Duval, D.; Gauthereau, X.; Thibault, C.; Dembele, D.; Feraud, O.; Menager, J.; Rallu, M.; Pradier, L.; et al. Bcl2, a transcriptional target of p38alpha, is critical for neuronal commitment of mouse embryonic stem cells. Cell Death Differ. 2008, 15, 1450–1459. [Google Scholar] [CrossRef]
  72. Shirane, K.; Kurimoto, K.; Yabuta, Y.; Yamaji, M.; Satoh, J.; Ito, S.; Watanabe, A.; Hayashi, K.; Saitou, M.; Sasaki, H. Global Landscape and Regulatory Principles of DNA Methylation Reprogramming for Germ Cell Specification by Mouse Pluripotent Stem Cells. Dev. Cell 2016, 39, 87–103. [Google Scholar] [CrossRef] [PubMed]
  73. Marson, A.; Levine, S.S.; Cole, M.F.; Frampton, G.M.; Brambrink, T.; Johnstone, S.; Guenther, M.G.; Johnston, W.K.; Wernig, M.; Newman, J.; et al. Connecting microRNA genes to the core transcriptional regulatory circuitry of embryonic stem cells. Cell 2008, 134, 521–533. [Google Scholar] [CrossRef] [PubMed]
  74. Li, X.; Liu, Y.; Mu, Q.; Tian, J.; Yu, H. MiR-290 family maintains developmental potential by targeting p21 in mouse preimplantation embryos‡. Biol. Reprod. 2022, 106, 425–440. [Google Scholar] [CrossRef]
  75. Jouneau, A.; Ciaudo, C.; Sismeiro, O.; Brochard, V.; Jouneau, L.; Vandormael-Pournin, S.; Coppee, J.Y.; Zhou, Q.; Heard, E.; Antoniewski, C.; et al. Naive and primed murine pluripotent stem cells have distinct miRNA expression profiles. RNA 2012, 18, 253–264. [Google Scholar] [CrossRef] [PubMed]
  76. Whyte, W.A.; Orlando, D.A.; Hnisz, D.; Abraham, B.J.; Lin, C.Y.; Kagey, M.H.; Rahl, P.B.; Lee, T.I.; Young, R.A. Master transcription factors and mediator establish super-enhancers at key cell identity genes. Cell 2013, 153, 307–319. [Google Scholar] [CrossRef]
  77. Gu, K.L.; Zhang, Q.; Yan, Y.; Li, T.T.; Duan, F.F.; Hao, J.; Wang, X.W.; Shi, M.; Wu, D.R.; Guo, W.T.; et al. Pluripotency-associated miR-290/302 family of microRNAs promote the dismantling of naive pluripotency. Cell Res. 2016, 26, 350–366. [Google Scholar] [CrossRef]
  78. Judson, R.L.; Babiarz, J.E.; Venere, M.; Blelloch, R. Embryonic stem cell-specific microRNAs promote induced pluripotency. Nat. Biotechnol. 2009, 27, 459–461. [Google Scholar] [CrossRef]
  79. Melton, C.; Judson, R.L.; Blelloch, R. Opposing microRNA families regulate self-renewal in mouse embryonic stem cells. Nature 2010, 463, 621–626. [Google Scholar] [CrossRef]
  80. Rosa, A.; Papaioannou, M.D.; Krzyspiak, J.E.; Brivanlou, A.H. miR-373 is regulated by TGFβ signaling and promotes mesendoderm differentiation in human Embryonic Stem Cells. Dev. Biol. 2014, 391, 81–88. [Google Scholar] [CrossRef]
  81. Ishikura, Y.; Ohta, H.; Sato, T.; Murase, Y.; Yabuta, Y.; Kojima, Y.; Yamashiro, C.; Nakamura, T.; Yamamoto, T.; Ogawa, T.; et al. In vitro reconstitution of the whole male germ-cell development from mouse pluripotent stem cells. Cell Stem Cell 2021, 28, 2167–2179.e2169. [Google Scholar] [CrossRef] [PubMed]
  82. Tarazi, S.; Aguilera-Castrejon, A.; Joubran, C.; Ghanem, N.; Ashouokhi, S.; Roncato, F.; Wildschutz, E.; Haddad, M.; Oldak, B.; Gomez-Cesar, E.; et al. Post-gastrulation synthetic embryos generated ex utero from mouse naive ESCs. Cell 2022, 185, 3290–3306.e3225. [Google Scholar] [CrossRef] [PubMed]
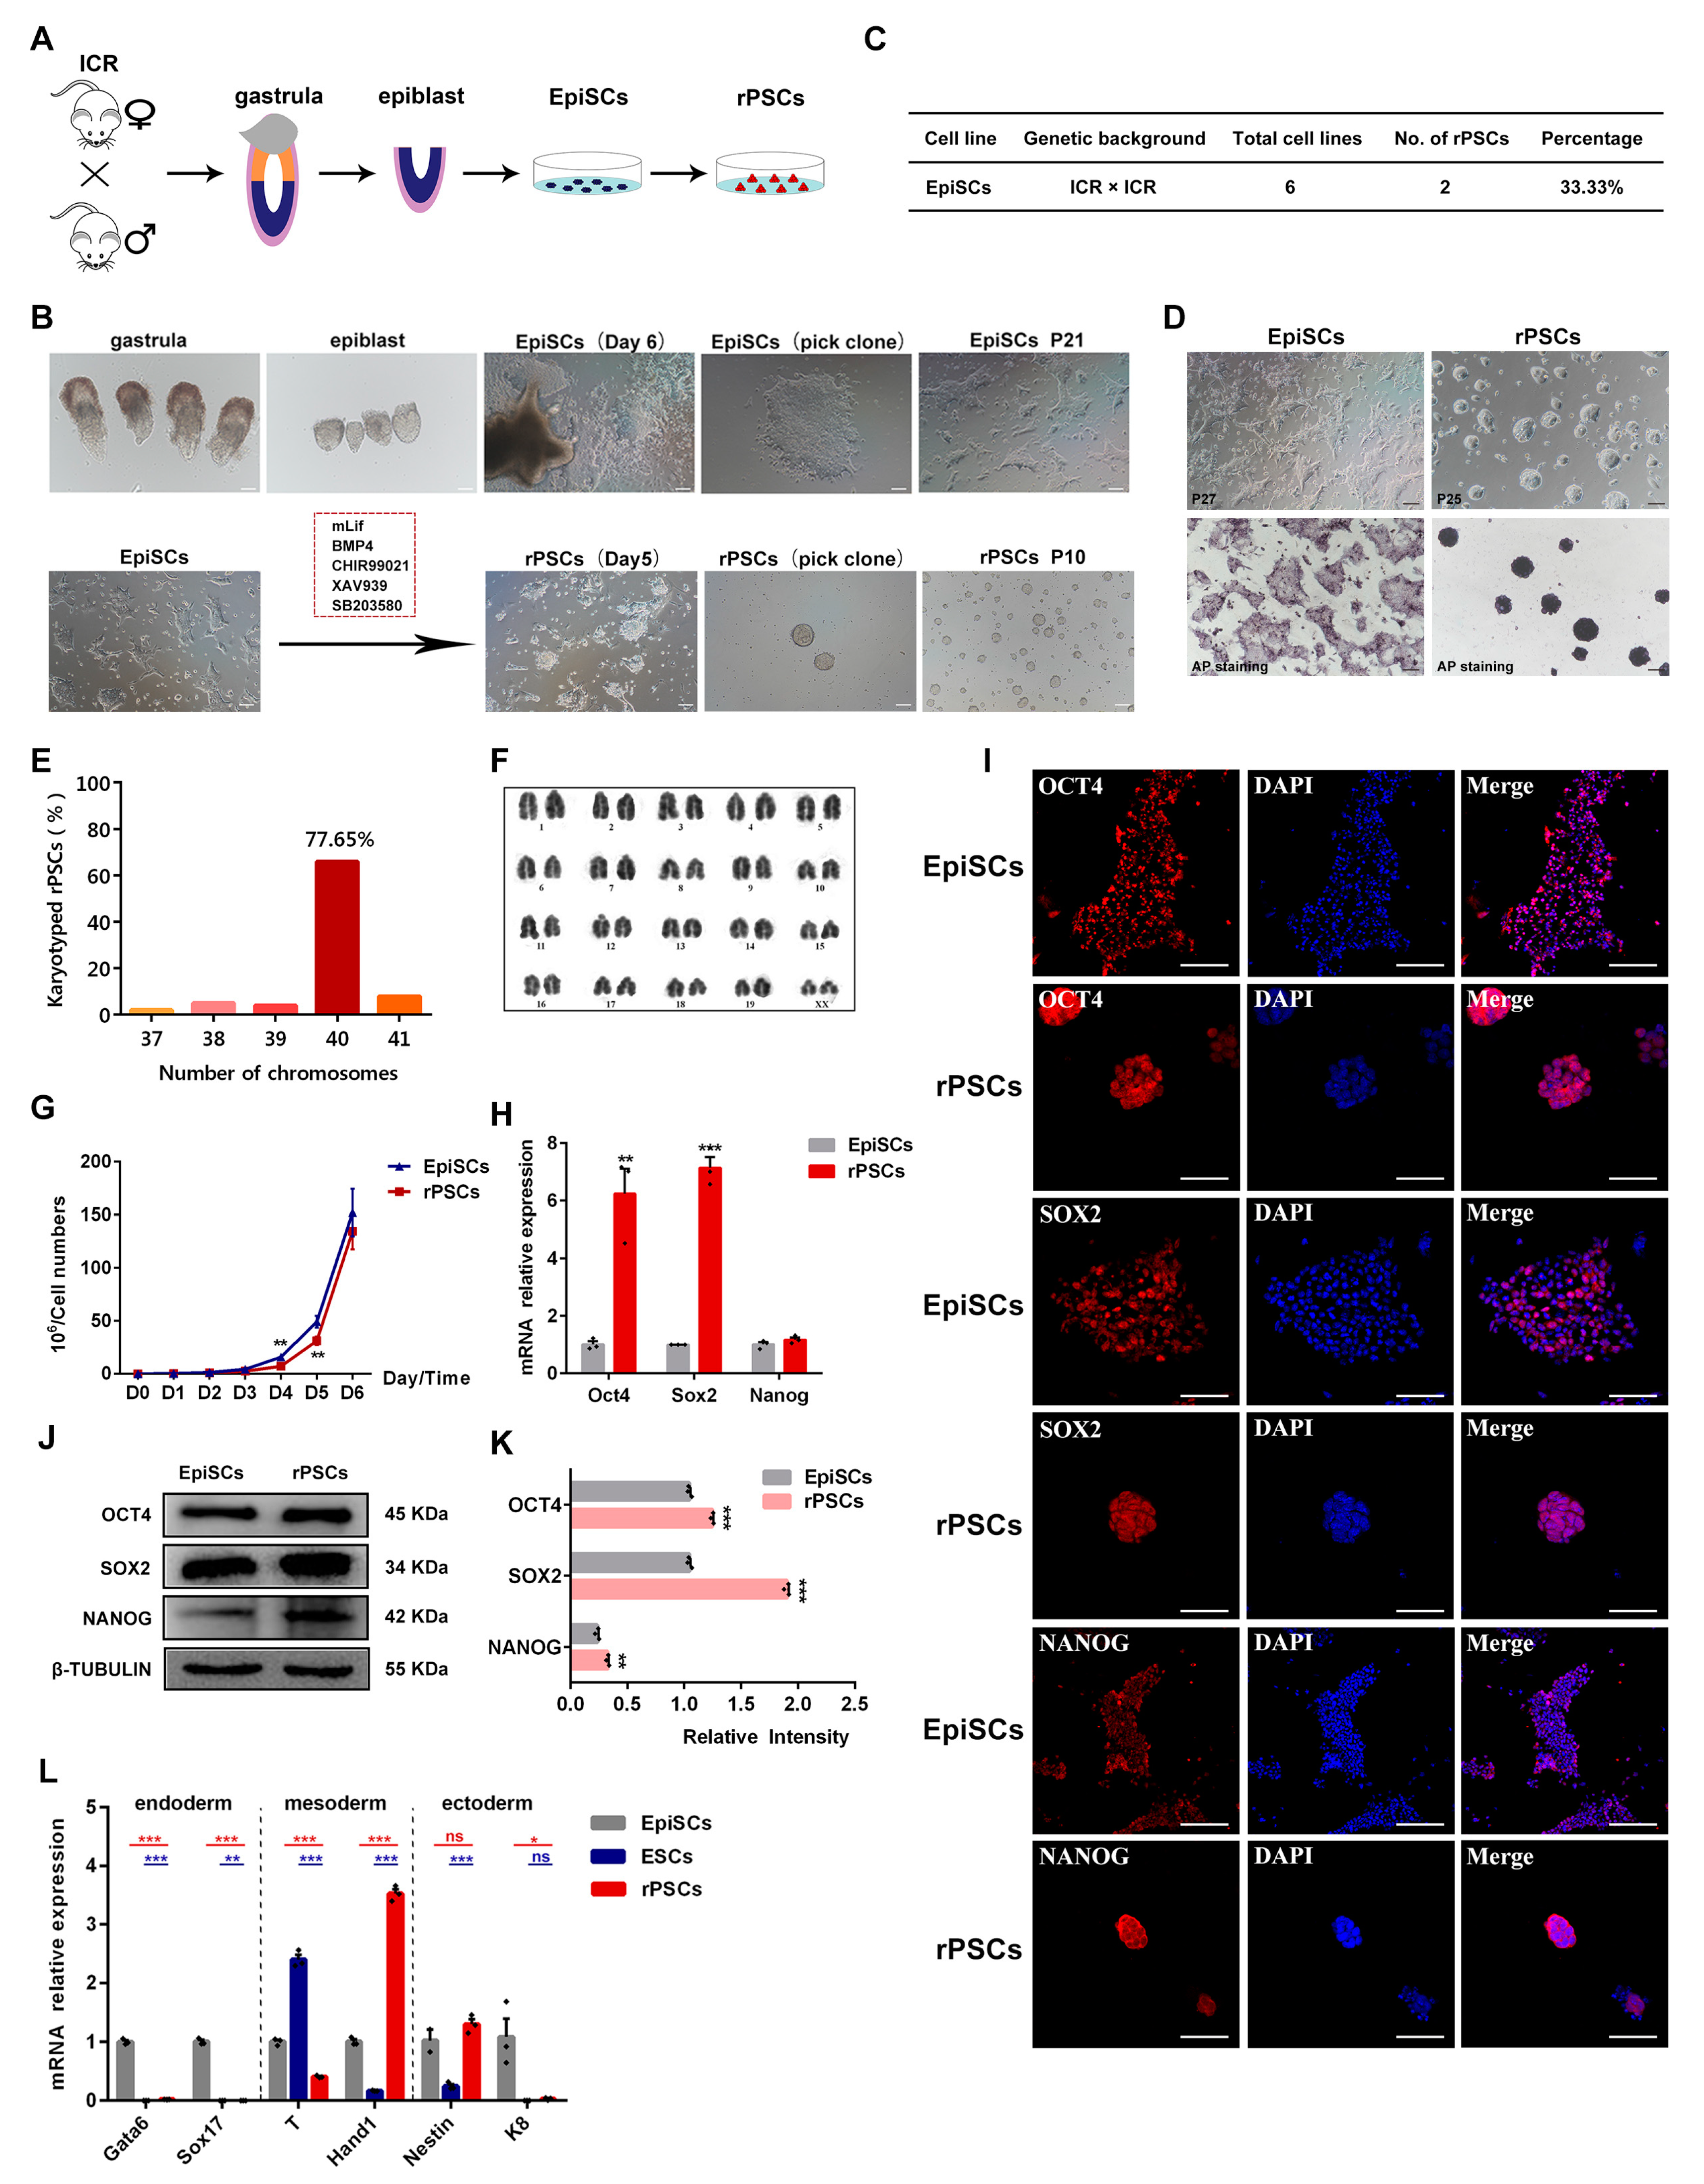
Figure 1. Derivation and characterization of rPSCs. (A) Schematic of the derivation of rPSCs. (B) A bright field image shows the derivation process of rPSCs. Scale bars: 100 µm. (C) Efficiency of rESCs conversed with EpiSCs in rPSCs medium. (D) Alkaline phosphatase (AP) staining on rPSCs and EpiSCs. Scale bars: 100 µm. (E) Distribution of chromosome numbers in rPSCs. (F) Karyotype of rPSCs. XX is two X chromosomes, representing the female cell line. (G) Cell growth curves of rPSCs and EpiSCs. (H) RT-qPCR analysis of pluripotency gene expression in rPSCs, and EpiSCs were used as a control. (I) Immunofluorescence staining of OCT4, SOX2, and NANOG in rPSCs and EpiSCs. Scale bars: 50 µm. (J) Western blot analysis for OCT4, SOX2, and NANOG in rPSCs and EpiSCs. (K) Quantification of OCT4, SOX2, and NANOG protein intensity analysis in rPSCs and EpiSCs. (L) RT-qPCR analysis of endoderm-, mesoderm-, and ectoderm-associated gene expression in rPSCs, EpiSCs, and ESCs. The above experiments included three replications. Error bars are SEM. Significance was tested with two-tailed Student’s t-tests, with * p < 0.05, ** p < 0.01, *** p < 0.001, and ns at p > 0.05.
Ijms 25 02681 g001
Figure 2. Differentiated and developmental potencies of rPSCs. (A) Morphology of embryoid body (EB) induction by rPSCs and EpiSCs on Day 2, Day 4, and Day 6. Scale bars: 100 µm. (B) Statistics of the number and diameter of EB formed by rPSCs and EpiSCs. N represents the number of EB spheres. (C) RT-qPCR analysis of endoderm-, mesoderm-, and ectoderm-associated gene expression in the EB of rPSCs and EpiSCs. (D) Adherence differentiation of EB formed by rPSCs and EpiSCs for 7 days. Scale bars: 100 µm. (E) Immunofluorescence staining of three germ layer markers in the EB of rPSCs and EpiSCs. AFP was used to visualize the endoderm, SMA was used to visualize the mesoderm, and GFAP was used to visualize the ectoderm. Scale bars: 50 µm. (F) Mature teratoma from rPSCs. Left: endoderm, gland-like cells. Middle: mesoderm, muscle-like cells. Right: ectoderm, neural-like cells. The sections were stained with H&E. Scale bars: 100 µm. (G) Immunofluorescence staining of three germ layer markers in the teratoma test. GATA6 was used to visualize the endoderm, T was used to visualize the mesoderm, and NESTIN was used to visualize the ectoderm. Scale bars: 50 µm. (H) Schematic of the eight-cell embryo injection protocol. (I) E3.5 chimeras generated by injecting rPSCs into eight-cell embryos and cultured in KSOM for 24 h and 48 h. Scale bars: 100 µm. (J) Immunofluorescence staining of blastocysts at 24 h after injection of rPSCs. OCT4 was used as the ICM marker. Scale bars: 50 µm. The above experiments included three replications. Error bars are SEM. Significance was tested with two-tailed Student’s t-tests, with * p < 0.05 and *** p < 0.001.
Ijms 25 02681 g002
Figure 3. Analyses of molecular features of rPSCs. (A) Principal component analysis (PCA) of transcriptome data from pre-implantation embryos (2-Cell, 8-Cell, E3.5 ICM, and E4.0 ICM), post-implantation (E5.5 EPI and E6.5 EPI), ESCs, EpiSCs, FSCs, and rPSCs. (B) Hierarchical clustering of the transcriptome from three biological replicates (n = 3) of four pluripotent stem cell lines. (C) The UpSet plot shows specific genes in three pluripotent stem cell lines. (D) The volcano plot of differentially expressed genes for rPSCs versus EpiSCs. (E) Heatmap showing scaled expression of pluripotency transcription factors and lineage factors. (F) Kyoto Encyclopedia of Genes and Genomes (KEGG) pathway analysis of DEGs for rPSCs versus EpiSCs described in (D). (G) Heatmap showing differentially expressed genes (fold change of ≥2, adjusted p value < 0.001) in rPSCs (n = 3) compared with EpiSCs (n = 3). Significantly enriched gene ontology (GO) terms and representative genes in each cluster are listed on the right.
Ijms 25 02681 g003
Figure 4. Epigenetic changes during the conversion of EpiSCs to rPSCs. (A) Immunofluorescence staining of H3K27me3, H3K4me3, and H3K9me3 in rPSCs and EpiSCs. White arrows point to the bright H3K27me3 foci in female EpiSCs. Scale bars: 50 µm. (B) Western blot analysis for H3K4me3 protein in rPSCs and EpiSCs. (C) Quantification of H3K4me3 protein intensity analysis in rPSCs and EpiSCs. (D) RT-qPCR analysis of Ezh1, Ezh2, and Wdr5 expression in rPSCs and EpiSCs. (E) RT-qPCR analysis of DNA methylation-related gene expression (Dnmt3a, Dnmt3b, Dnmt1, Tet1, and Tet2) in rPSCs, and EpiSCs were used as a control. (F) Changes in DNA methylation of Oct4, Sox2, and Nanog promoter regions during the conversion of EpiSCs to rPSCs. (G) RT-qPCR analysis of mature miRNAs miR-290-3p, miR-291a-3p, miR-291b-3p, miR-292a-3p, miR-294-3p, and miR-295-3p in rPSCs, and EpiSCs were used as a control. (H) Changes in DNA methylation of the miR-290 super enhancer (SE) region in rPSCs and EpiSCs. The above experiments included three replications. Error bars are SEM. Significance was tested with two-tailed Student’s t-tests, with * p < 0.05, ** p < 0.01, and *** p < 0.001.
Ijms 25 02681 g004
Figure 5. Removal of SB203580 reduced the pluripotency of rPSCs. (A) Morphological changes and AP staining after rPSCs removal of SB203580. Scale bars: 100 µm. (B) RT-qPCR analysis of mature miRNAs miR-290-3p, miR-291a-3p, miR-291b-3p, miR-292a-3p, miR-294-3p, and miR-295-3p expression in rPSCs and rPSCs(-SB). (C) RT-qPCR analysis of key factors and up-/down-regulating target gene expression of the p38 MAPK signaling pathway in rPSCs and rPSCs(-SB). (D) RT-qPCR analysis of DNA methylation-related gene expression in rPSCs and rPSCs(-SB). (E) Immunofluorescence staining of OCT4, SOX2, and NANOG in rPSCs(-SB). Scale bars: 50 µm. (F) Western blot analysis for OCT4, SOX2, and NANOG in rPSCs and rPSCs(-SB). (G) Quantification of OCT4, SOX2, and NANOG protein intensity analysis in rPSCs and rPSCs(-SB). (H) RT-qPCR analysis of pluripotency-associated gene expression in rPSCs and rPSCs(-SB). (I) RT-qPCR analysis of endoderm, mesoderm, and ectoderm-associated gene expression in rPSCs and rPSCs(-SB). The above experiments included three replications. Error bars are SEM. Significance was tested with two-tailed Student’s t-tests, with * p < 0.05, ** p < 0.01, and *** p < 0.001.
Ijms 25 02681 g005
Figure 6. Map2k6 is a direct target of miR-291b-3p. (A) Venn diagram of common targets of miR-291a-3p, miR-291b-3p, miR-294-3p, and miR-295-3p. (B) KEGG analysis showed that common targets were mainly enriched in the PI3K-AKT signaling pathway and the MAPK signaling pathway. (C) Target binding site of miR-291b-3p in the Map2k6 mRNA 3′-UTR. CDS, coding sequence; WT, wild-type seed sequence; MUT, mutant seed sequence. (D) Relative luciferase activity in ESCs co-transfected with miR-291b-3p mimic and Map2k6-3′UTR-WT or Map2k6-3′UTR-MUT luciferase reporter vector. Each experiment included 1 × 10⁶ cells. (E,F) RT-qPCR analysis of the expression levels of Map2k6 mRNA and miR-291b-3p in ESCs after miR-291b-3p mimic transfection. (G) Western blot analysis for MAP2K6 protein level in ESCs after miR-291b-3p mimic transfection. (H) Quantification of MAP2K6 protein intensity analysis in ESCs after miR-291b-3p mimic transfection. (I) RT-qPCR analysis of Map2k3 and Map2k6 expression in rPSCs and rPSCs(-SB). The above experiments included three replications. Error bars are SEM. Significance was tested with two-tailed Student’s t-tests, with ** p < 0.01, *** p < 0.001, and ns at p > 0.05.
Ijms 25 02681 g006
Figure 7. Overexpression of pri-miR-290 can improve the pluripotency of rPSCs(-SB). (A) Morphological changes in rPSCs(-SB) after overexpression of pri-miR-290. Scale bars: 100 µm. (B) RT-qPCR was used to detect the overexpression efficiency of pri-miR-290. (C) RT-qPCR analysis of mature miRNAs miR-290-3p, miR-291a-3p, miR-291b-3p, miR-292a-3p, miR-294-3p, and miR-295-3p after overexpression of pri-miR-290. (D) RT-qPCR analysis of pluripotency-associated genes and three germ layer-associated gene expression in three cell lines. (E) Western blot analysis for phosphorylated and total forms of p38 MAPK and ERK in rPSCs, rPSCs(-SB), and the pri-miR-290-pcDNA3.1-EGFP group. (F) Quantification of p38 MAPK, p-p38 MAPK, ERK, and p-ERK protein intensity analysis in rPSCs, rPSCs(-SB), and the pri-miR-290-pcDNA3.1-EGFP group. (G) RT-qPCR analysis of up-/down-regulating target gene expression of the p38 MAPK signaling pathway in rPSCs(-SB) and the pri-miR-290-pcDNA3.1-EGFP group. (H) Morphology of EB induction by the pri-miR-290-pcDNA3.1-EGFP group in Day 2, Day 4, and Day 6. Scale bars: 100 µm. (I) Statistics of the diameter of EB formed by rPSCs and the pri-miR-290-pcDNA3.1-EGFP group. (J) RT-qPCR analysis of endoderm-, mesoderm-, and ectoderm-associated gene expression in rPSCs-EB-D3 and pri-miR-290-pcDNA3.1-EGFP-EB-D3. (K) Mature teratoma from rPSCs. Left: endoderm, gland-like cells. Middle: mesoderm, cartilage-like cells. Right: ectoderm, neural-like cells. The sections were stained with H&E. Scale bars: 100 µm. The above experiments included three replications. Error bars are SEM. Significance was tested with two-tailed Student’s t-tests, with * p < 0.05, ** p < 0.01, *** p < 0.001, and ns at p > 0.05.
Ijms 25 02681 g007
Disclaimer/Publisher’s Note: The statements, opinions and data contained in all publications are solely those of the individual author(s) and contributor(s) and not of MDPI and/or the editor(s). MDPI and/or the editor(s) disclaim responsibility for any injury to people or property resulting from any ideas, methods, instructions or products referred to in the content.