
Selection and Validation of Reference Genes for Gene Expression in Bactericera gobica Loginova under Different Insecticide Stresses

Abstract
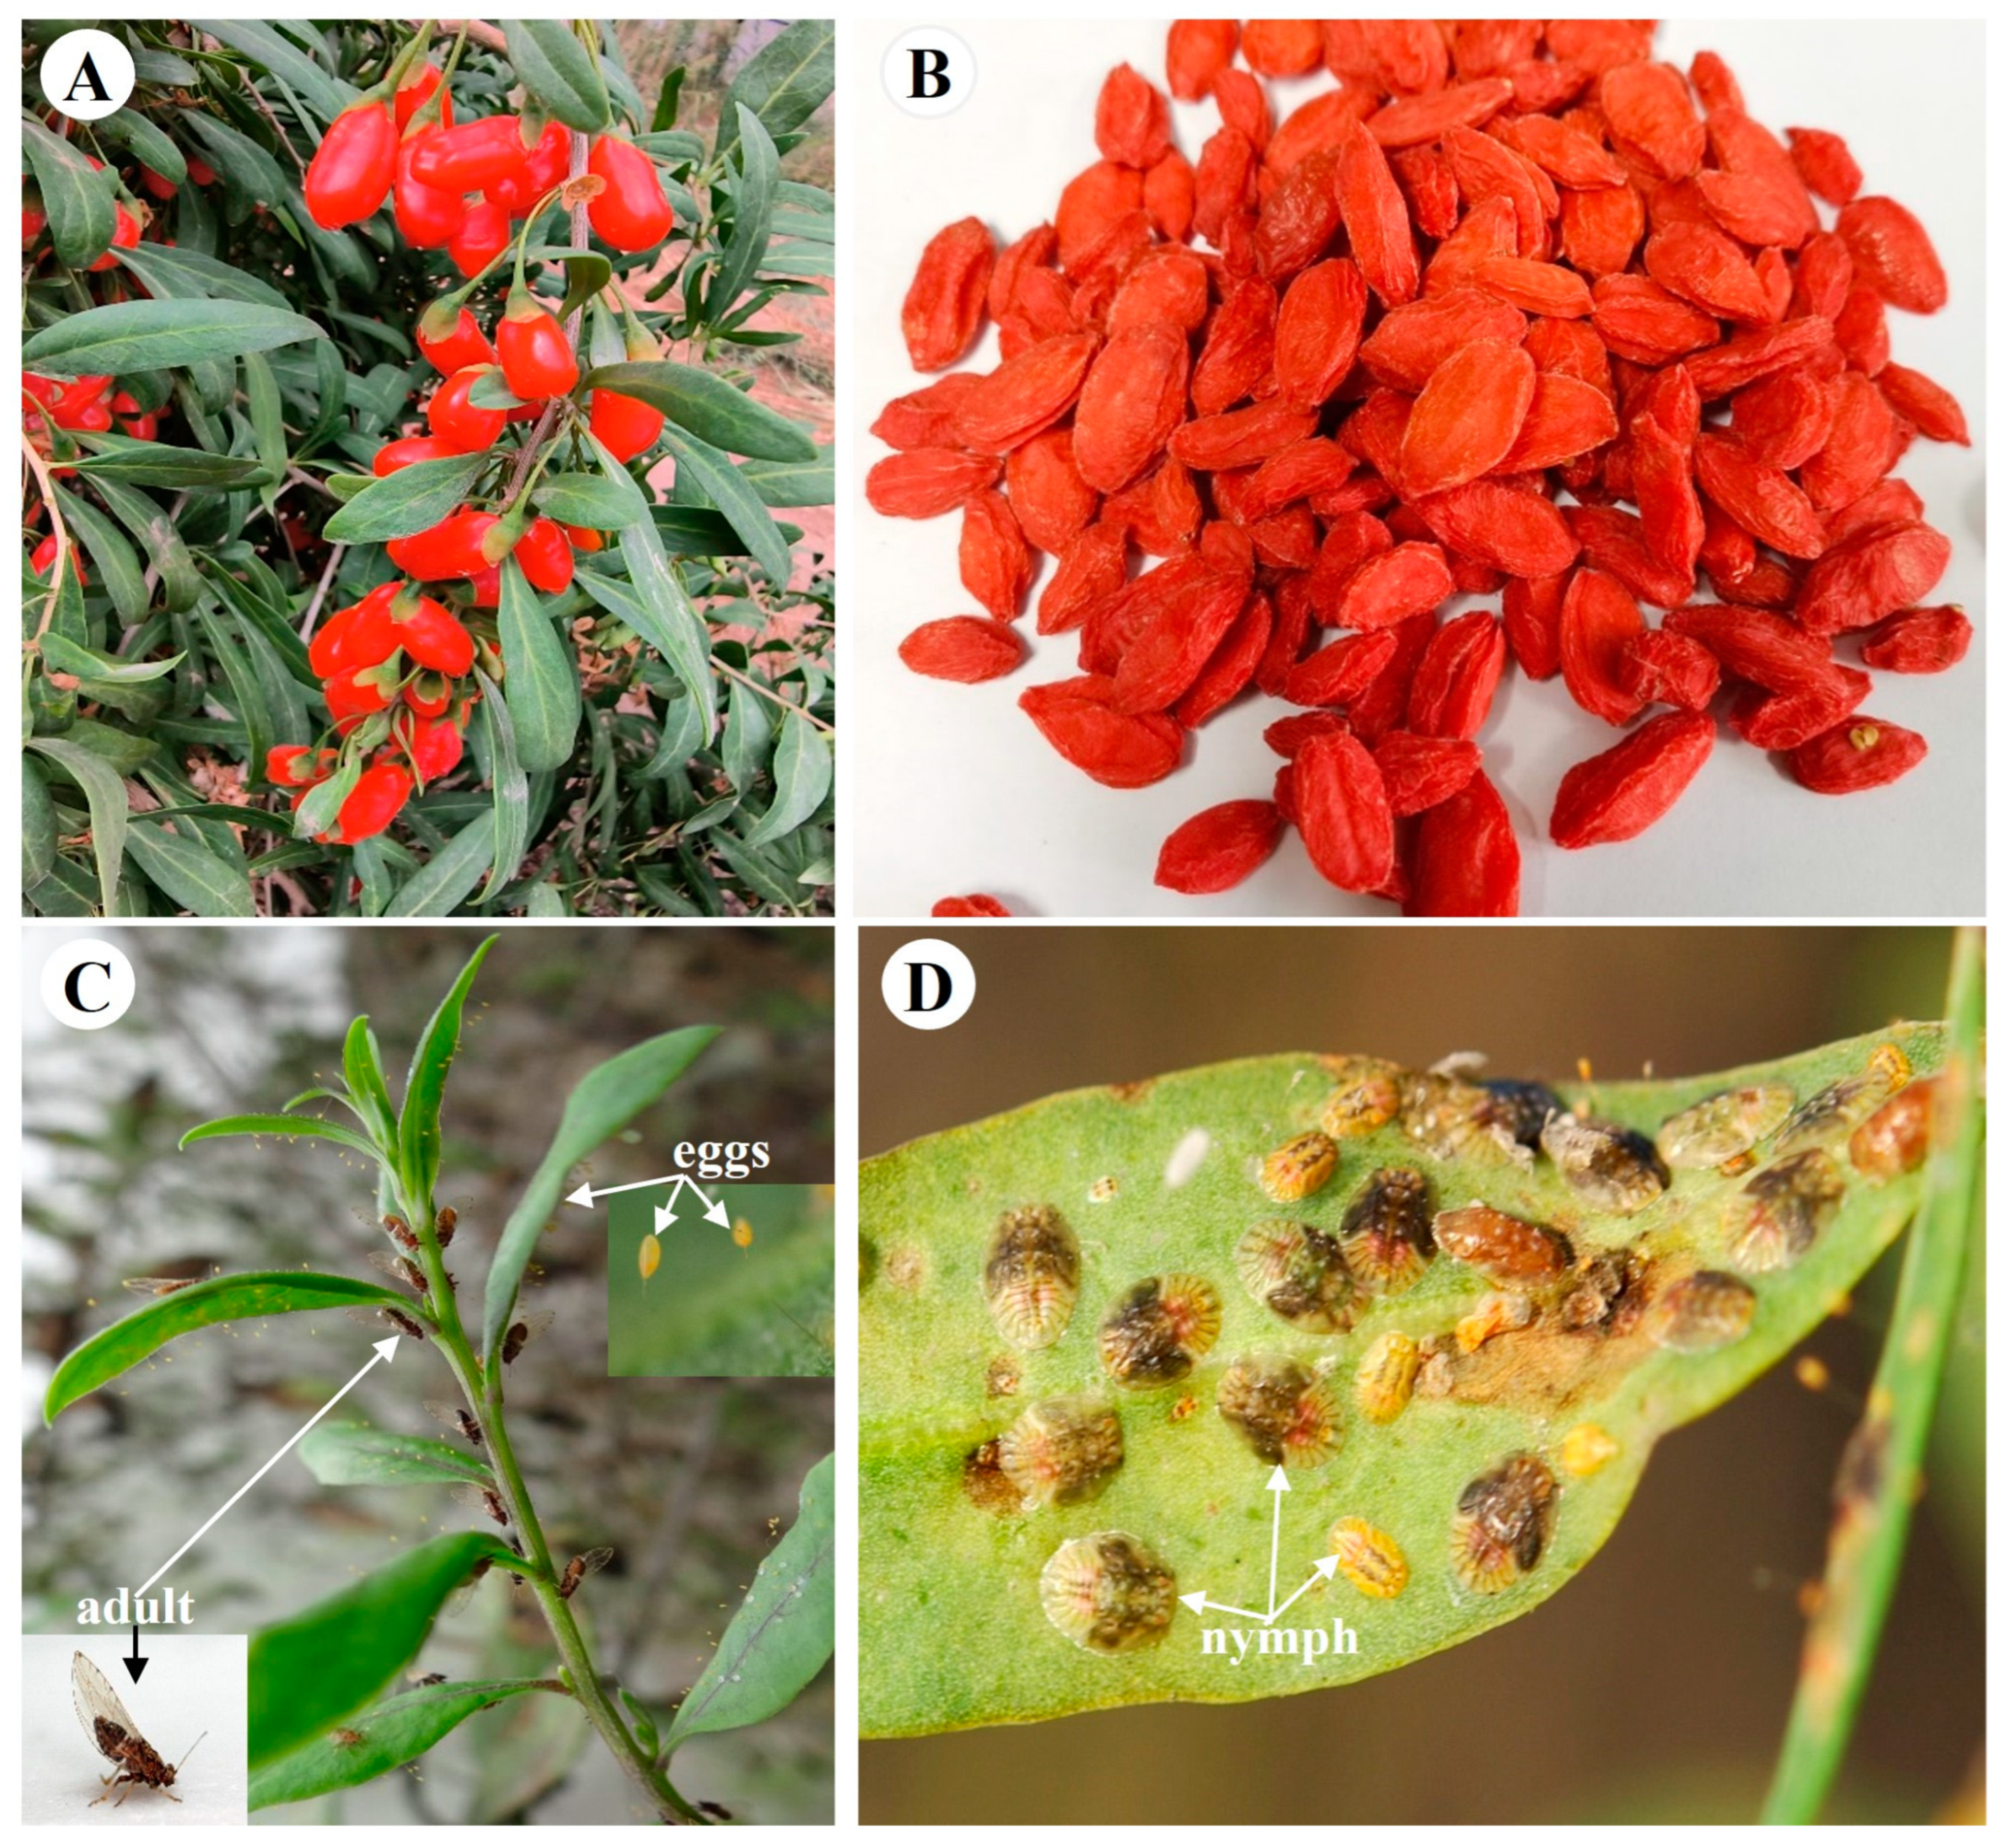
1. Introduction
2. Results
2.1. Verification of Primer Specificity and RT-qPCR Amplification Efficiencies
2.2. Expression Profiles of Candidate Reference Genes in B. gobica
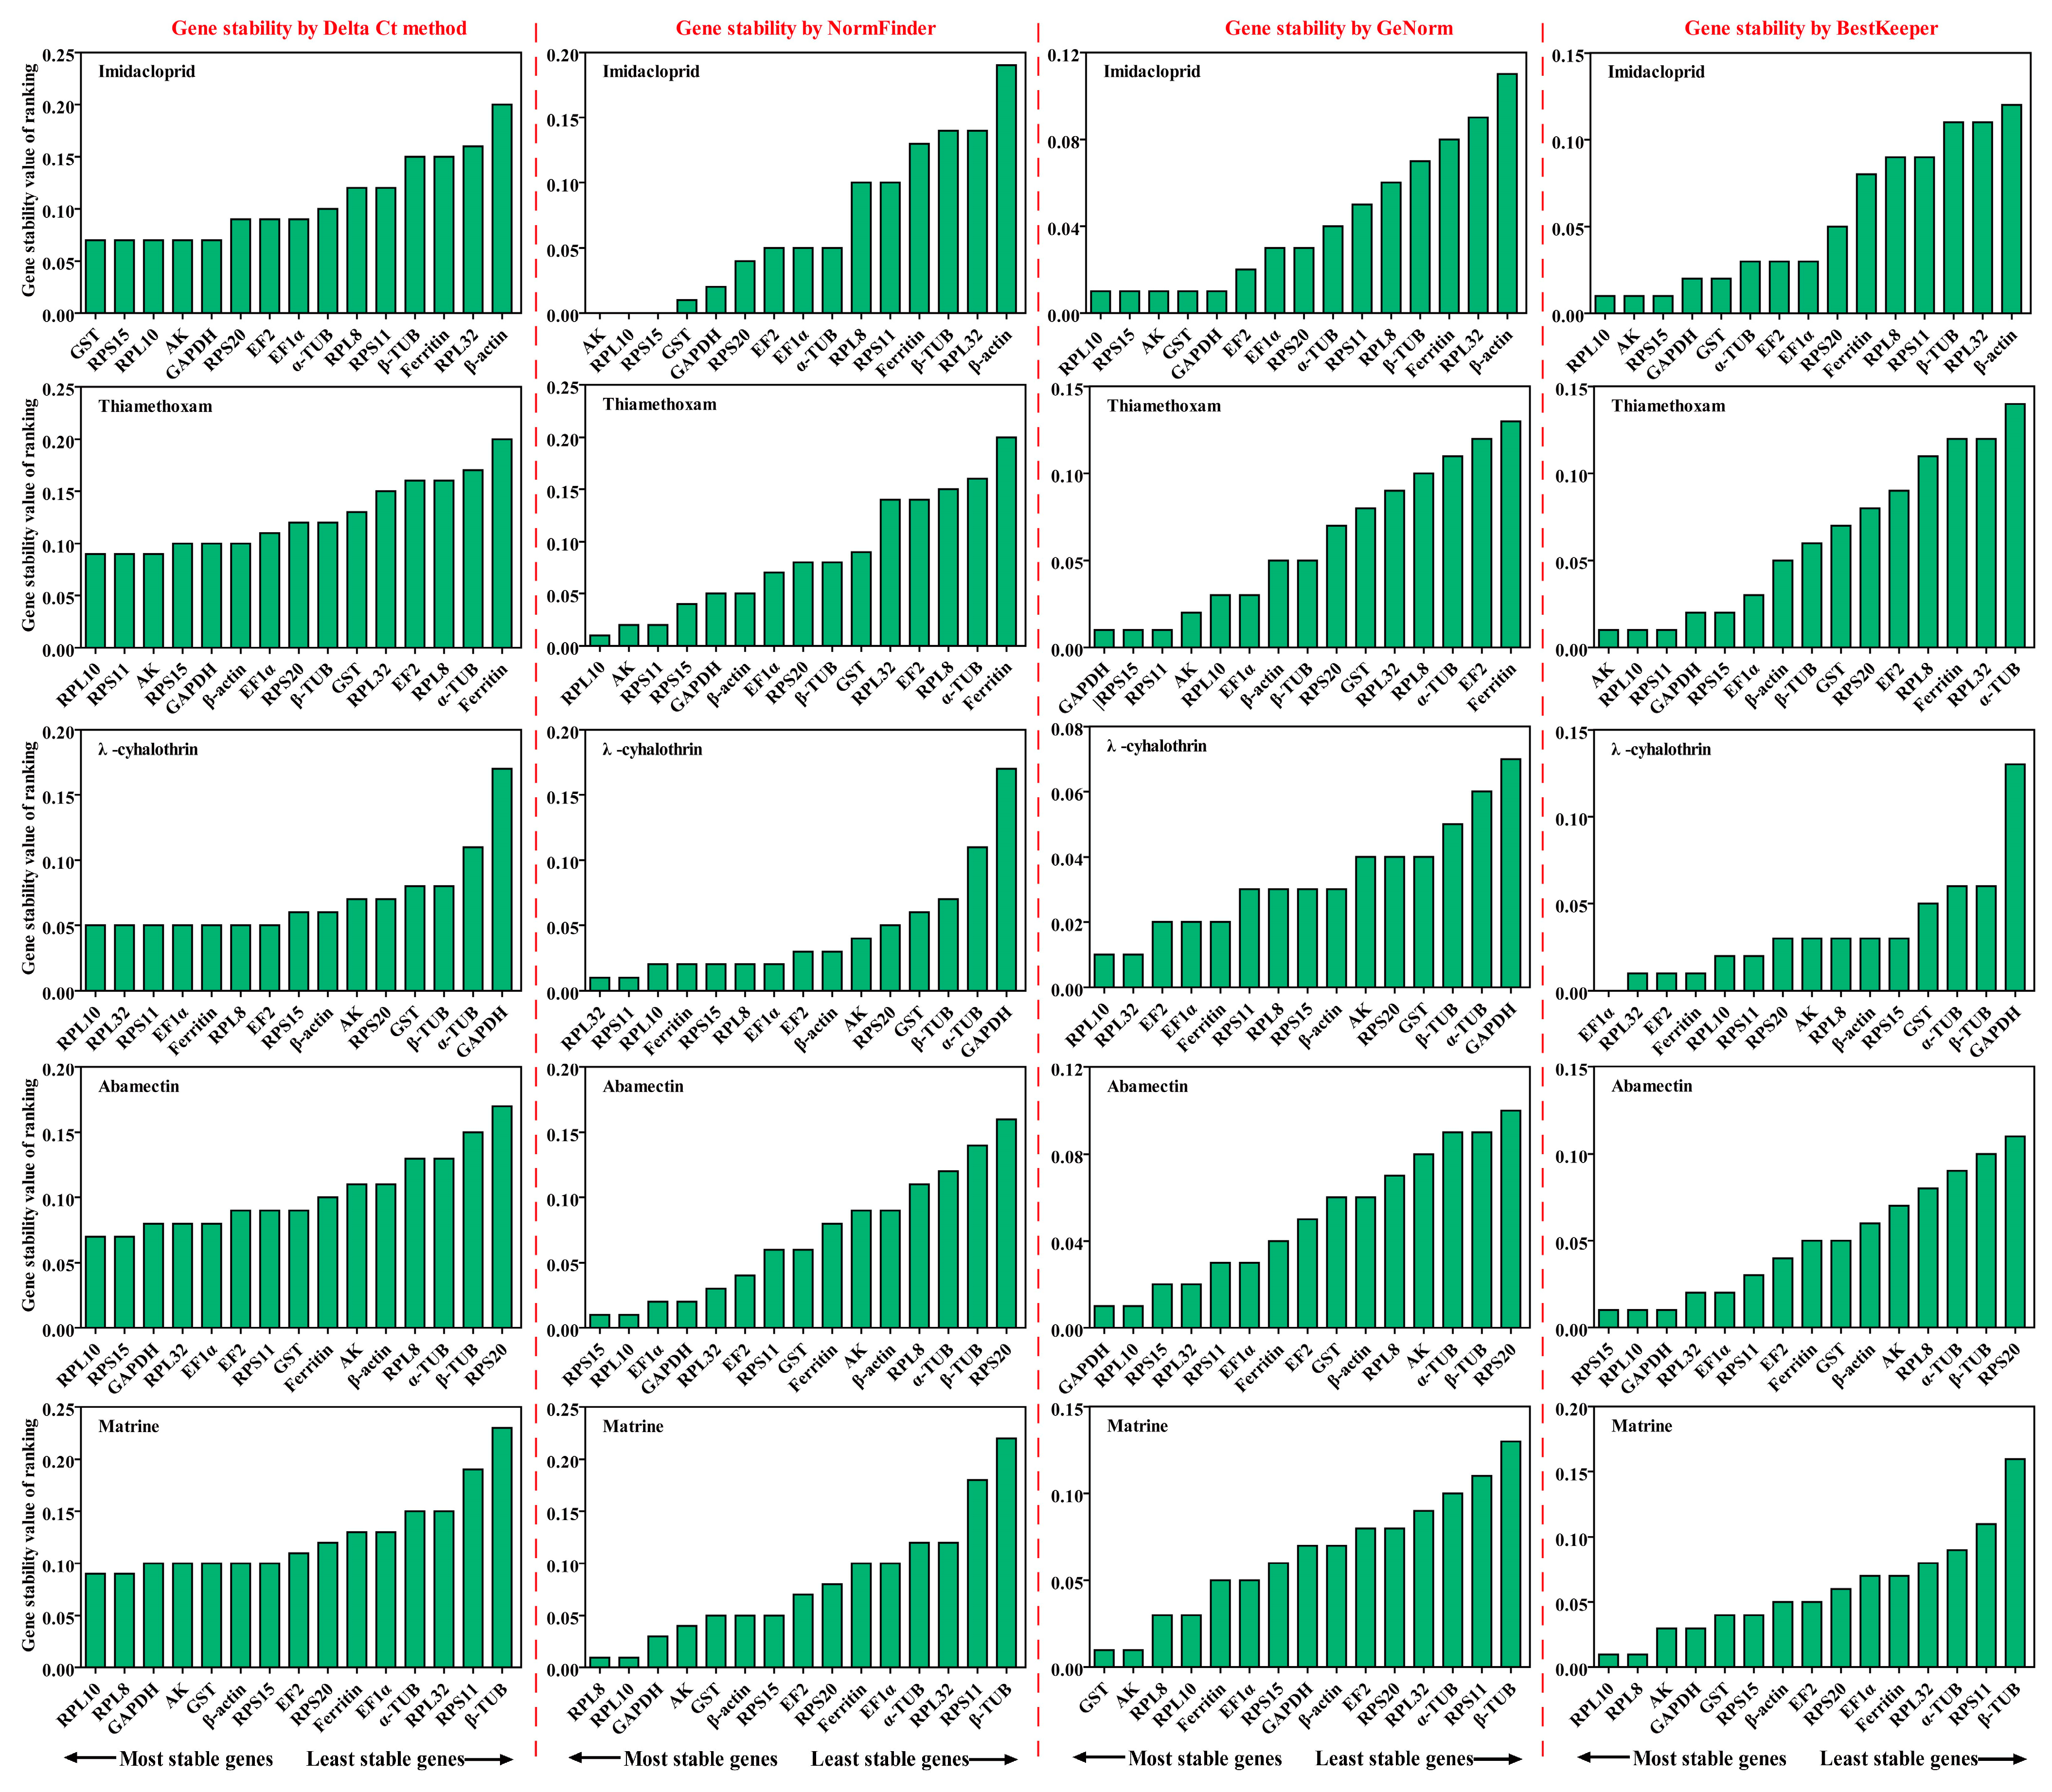
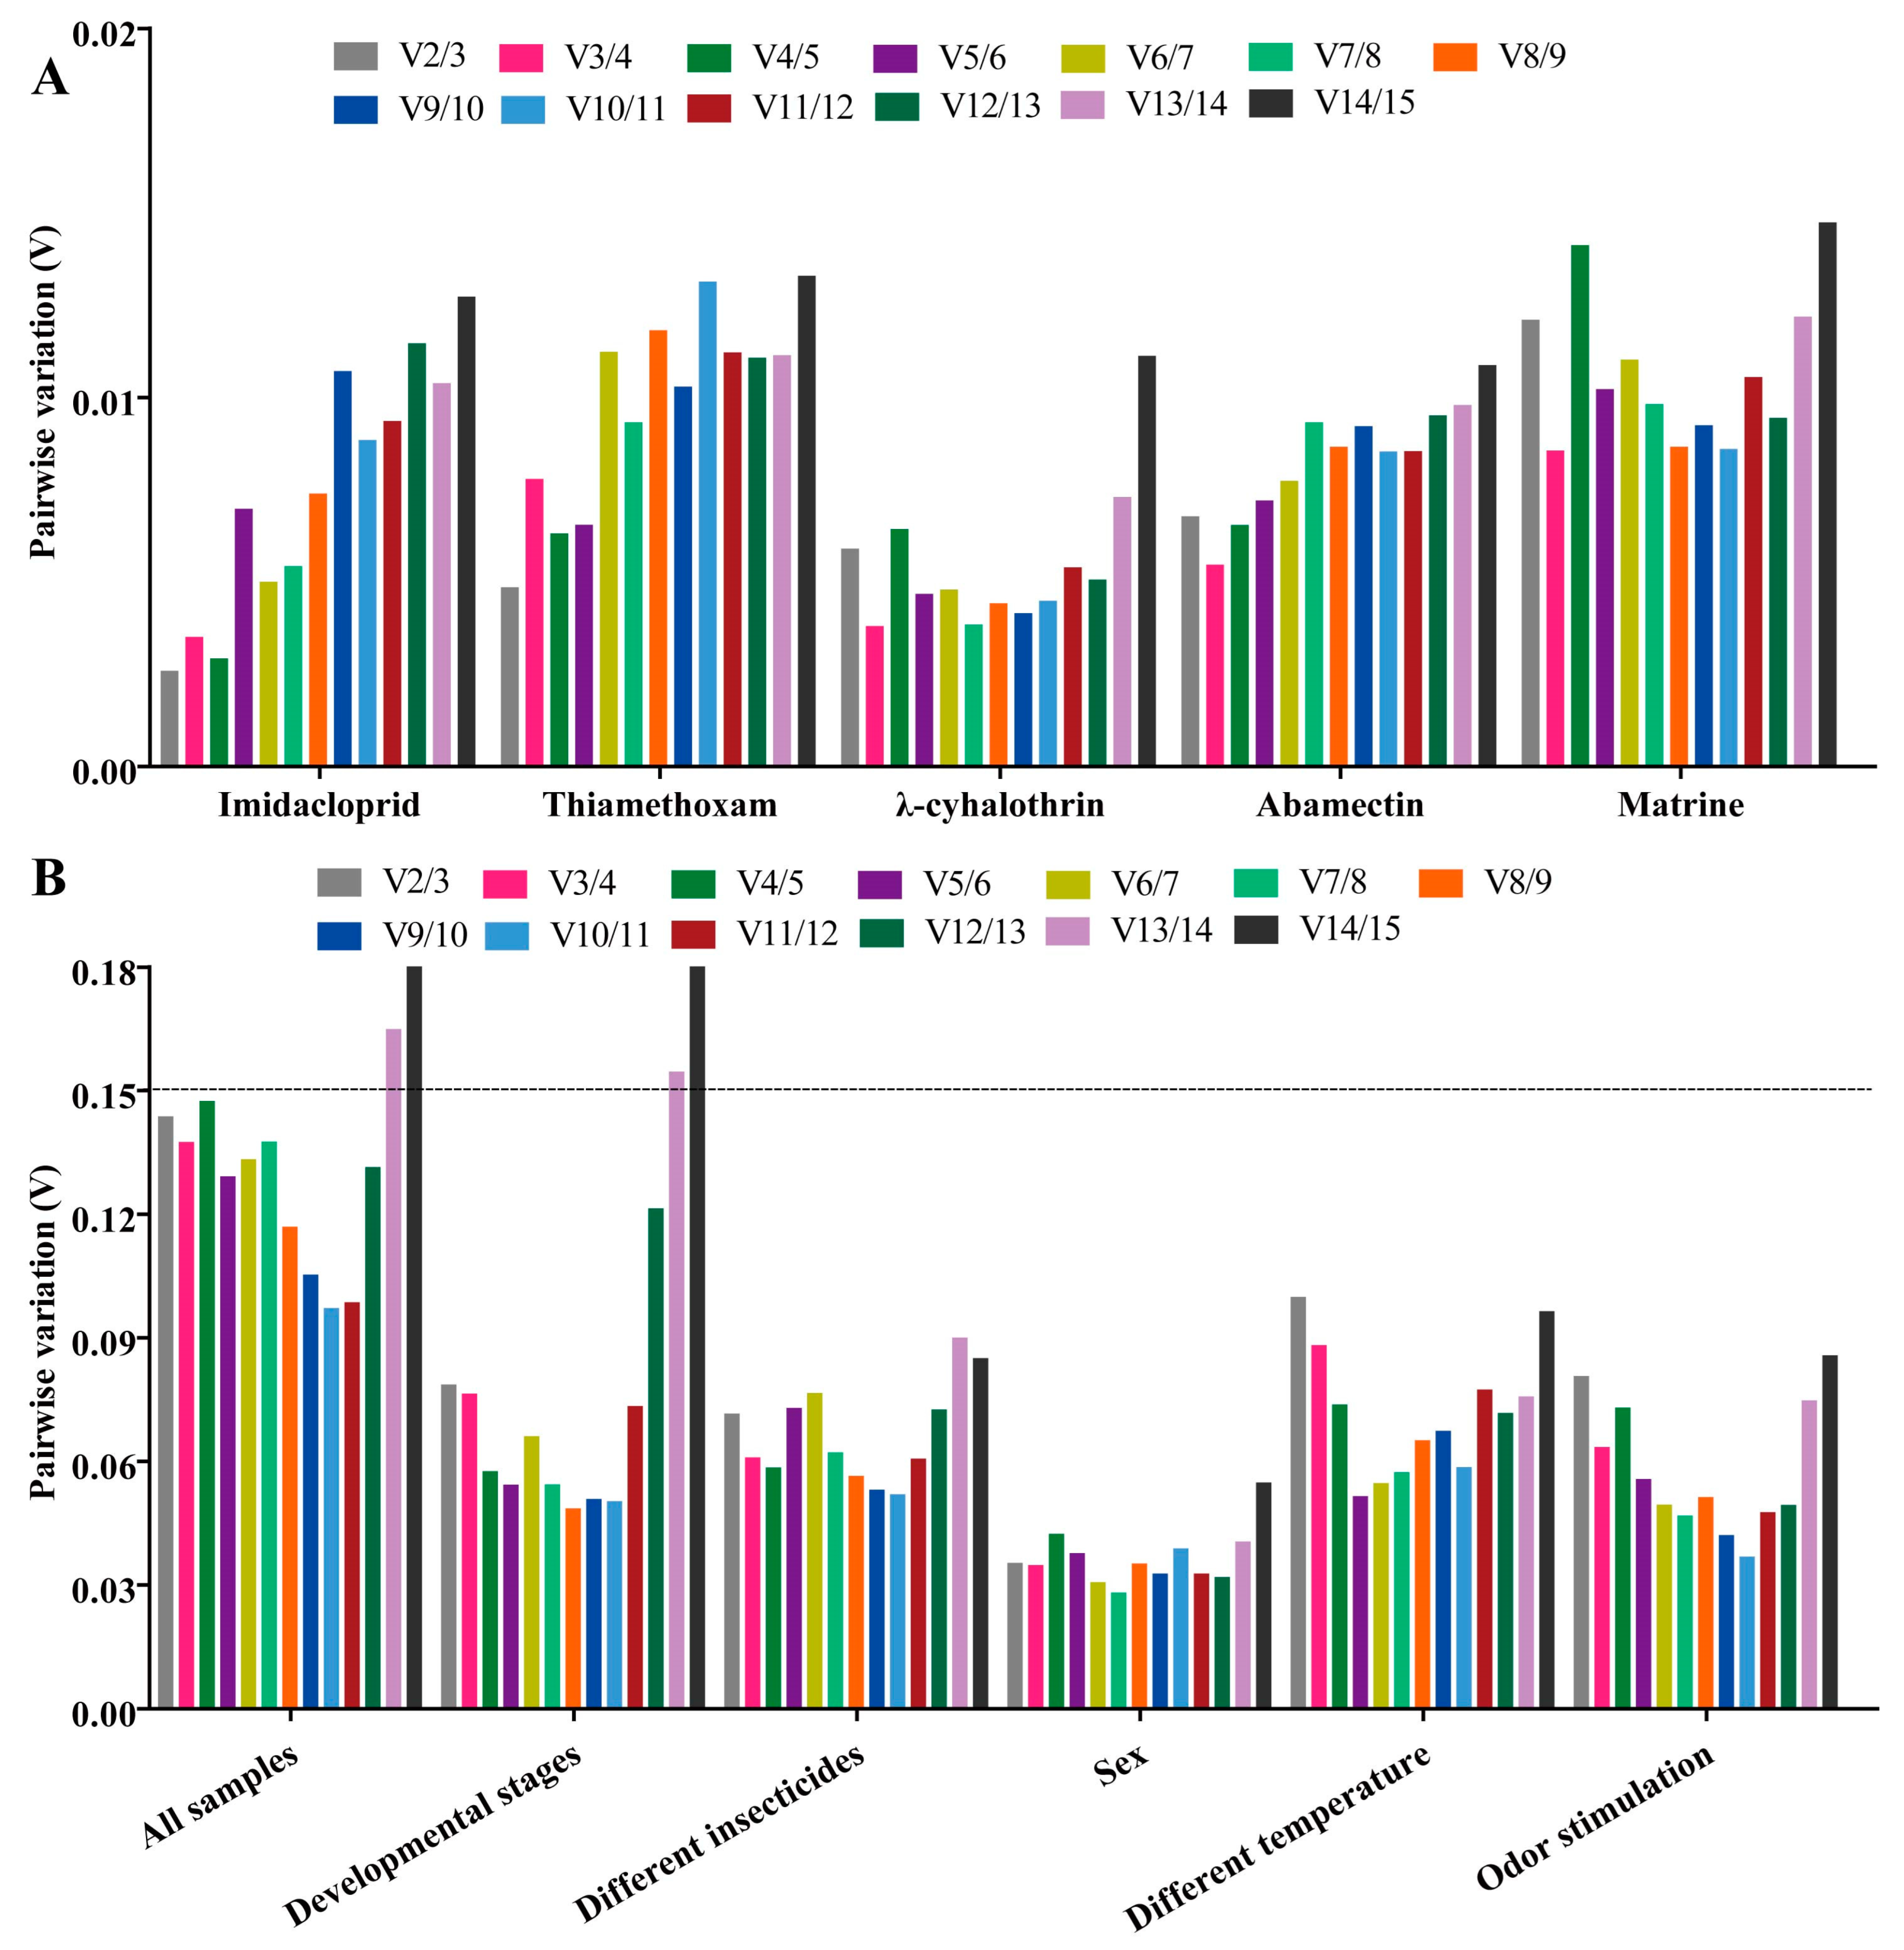
2.3. Stability of Candidate RGs under Different Insecticide Stresses
2.3.1. Imidacloprid Treatment
2.3.2. Thiamethoxam Treatment
2.3.3. λ-Cyhalothrin Treatment
2.3.4. Abamectin Treatment
2.3.5. Matrine Treatment
2.3.6. All Insecticides
2.4. Stability of Candidate RGs under Temperature and Odor Stimulation
2.4.1. Temperature Treatments
2.4.2. Odor Stimulation
2.5. Stability of Candidate RGs at Developmental Stages and Both Sexes
2.5.1. Developmental Stages
2.5.2. Both Sexes
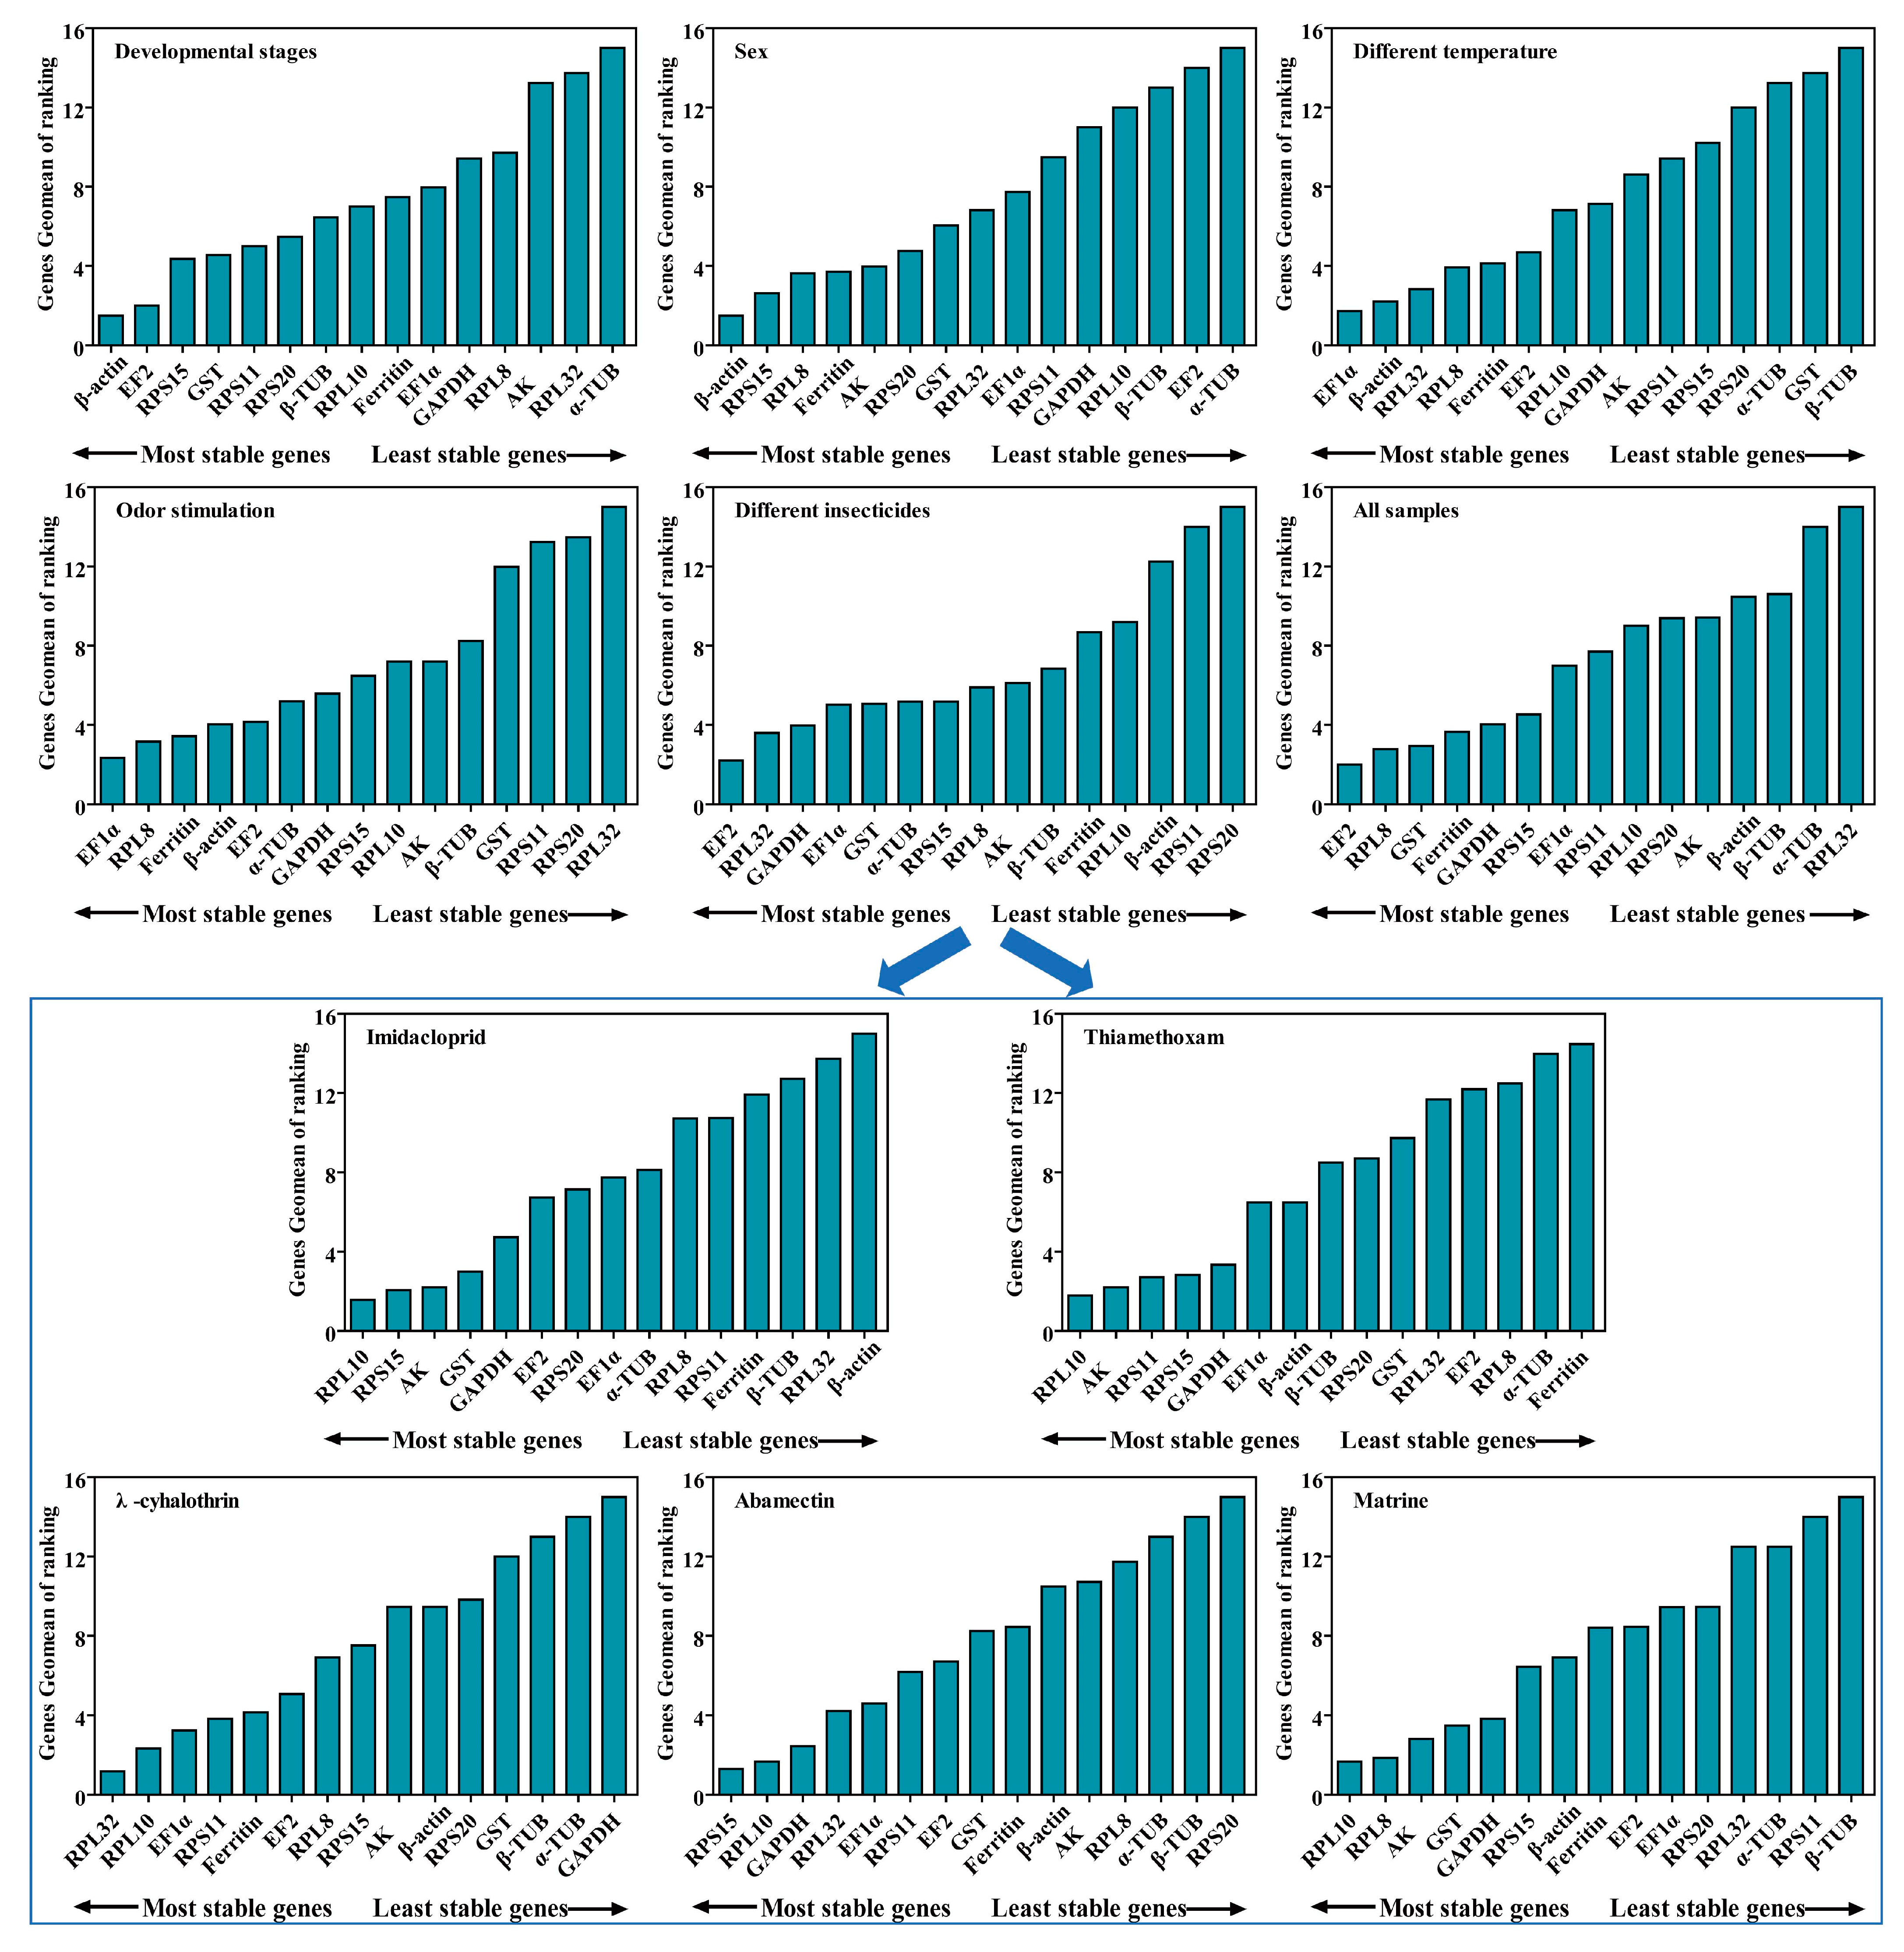
2.6. Comprehensive Ranking Analysis of Candidate RGs for All Experimental Conditions
2.7. Validation of the Selected Candidate RGs by Target Gene CYP6a1
3. Discussion
4. Materials and Methods
4.1. Insect Rearing
4.2. Collection of Samples, RNA Extraction and cDNA Synthesis under Different Experimental Conditions
4.3. Selection, Primer Design and RT-qPCR Analysis of Reference Genes (RGs) in B. gobica
4.4. Determining the Expression Stability of Candidate RGs
4.5. Validation of the Selected RGs by Target Gene CYP6a1
4.6. Statistical Analysis
Supplementary Materials
Author Contributions
Funding
Institutional Review Board Statement
Informed Consent Statement
Data Availability Statement
Conflicts of Interest
References
- Gong, Y.H.; Cheng, S.Y.; Xiu, X.J.; Li, F.; Liu, N.N.; Hou, M.L. Molecular Evolutionary Mechanisms of CYP6ER1vA-Type Variant Associated with Resistance to Neonicotinoid Insecticides in Field Populations of Nilaparvata lugens. J. Agric. Food Chem. 2023, 71, 19935–19948. [Google Scholar] [CrossRef]
- Gao, C.; Yao, R.; Zhang, Z.; Wu, M.; Zhang, S.; Su, J. Susceptibility baseline and hlorantraniliprole resistance monitoring in Chilo suppressalis (Lepidoptera: Pyralidae). J. Econ. Entomol. 2023, 106, 2190–2194. [Google Scholar] [CrossRef]
- Zhang, H.B.; Shao, H.N.; Huang, Z.; Li, Q.R. Drug resistance monitoring of Aphis gossypii Glover to imidacloprid and determination of cross resistance spectrum. J. Qinghai Univ. 2023, 41, 44–51. [Google Scholar]
- Dai, D.J.; Shen, Y.; Shen, Y.; Wu, J.Y.; Liu, Y.H.; Zhang, C.Q. Research progress on chemical control for main disease and insect pests of characteristic Chinese herbal medicines in Zhejiang Province. Chin. J. Pestic. Sci. 2019, 21, 759–771. [Google Scholar]
- Li, X.; Holt, R.R.; Keen, C.L.; Morse, L.S.; You, G.; Hackman, R.M. Goji berry intake increases macular pigment optical density in healthy adults: A Randomized Pilot Trial. Nutrients 2021, 13, 4409. [Google Scholar] [CrossRef] [PubMed]
- Wang, Z.W.; Sun, Q.R.; Fang, J.X.; Wang, C.T.; Wang, D.D.; Li, M. The anti-aging activity of Lycium barbarum polysaccharide extracted by yeast fermentation: In vivo and in vitro studies. Int. J. Biol. Macromol. 2022, 209, 2032–2041. [Google Scholar] [CrossRef]
- Zhang, Y.; Qin, J.; Wang, Y.; Zhou, T.; Feng, N.; Ma, C.; Zhu, M. Levels and health risk assessment of pesticides and metals in Lycium barbarum L. from different sources in Ningxia, China. Sci. Rep. 2022, 12, 561. [Google Scholar] [CrossRef]
- Li, J.L.; Liu, S.; Guo, K.; Qiao, H.L.; Xu, R.; Xu, C.Q.; Chen, J. A new method of gall mite management: Application of artificial defoliation to control Aceria pallida. PeerJ. 2019, 7, e6503. [Google Scholar] [CrossRef]
- Li, J.L.; Sai Liu, S.; Guo, K.; Fan Zhang, F.; Qiao, H.L.; Chen, J.M.; Yang, M.K.; Zhu, X.; Xu, R.; Xu, C.Q.; et al. Plant-mediated competition facilitates a phoretic association between a gall mite and a psyllid vector. Exp. Appl. Acarol. 2018, 76, 325–337. [Google Scholar] [CrossRef]
- Liu, B.Y. Sensitivity Determination and Control of Paratrioza sinica to Common Insecticides in Ningxia. Master’s Thesis, Ningxia University, Yinchuan, China, 2022. [Google Scholar]
- Wei, H.S.; Qiao, H.L.; Liu, S.; Xu, C.Q. Transcriptome-Based Selection and Validation of Reference Genes for Gene Expression in Goji Fruit Fly (Neoceratitis asiatica Becker) under Developmental Stages and Five Abiotic Stresses. Int. J. Mol. Sci. 2023, 24, 451. [Google Scholar] [CrossRef] [PubMed]
- Bai, X.; Chen, T.; Wu, Y.; Tang, M.; Xu, Z.F. Selection and validation of reference genes for qRT-PCR analysis in the oil-rich tuber crop tiger nut (Cyperus esculentus) based on transcriptome data. Int. J. Mol. Sci. 2021, 22, 2569. [Google Scholar] [CrossRef]
- Dong, X.M.; Zhang, W.; Zhang, S.B. Selection and validation of reference genes for quantitative real-Time PCR analysis of development and tissue-dependent flower color formation in Cymbidium lowianum. Int. J. Mol. Sci. 2022, 23, 738. [Google Scholar] [CrossRef]
- Tao, J.X.; Hao, Y.J.; Li, X.D.; Yin, H.C.; Nie, X.E.; Zhang, J.; Xu, B.Y.; Chen, Q.; Li, B. Systematic Identification of housekeeping genes possibly used as references in Caenorhabditis elegans by large-scale data integration. Cells 2020, 9, 786. [Google Scholar] [CrossRef] [PubMed]
- Lu, J.; Yang, C.; Zhang, Y.; Pan, H. Selection of reference genes for the normalization of RT-qPCR data in gene expression studies in insects: A systematic Review. Front. Physiol. 2018, 9, 1560. [Google Scholar] [CrossRef] [PubMed]
- Fu, H.; Huang, T.; Yin, C.; Xu, Z.; Li, C.; Liu, C.; Wu, T.; Song, F.; Feng, F.; Yang, F. Selection and validation of reference genes for RT-qPCR normalization in Bradysia odoriphaga (Diptera: Sciaridae) under insecticides stress. Front. Physiol. 2022, 12, 818210. [Google Scholar] [CrossRef]
- Shen, G.M.; Jiang, H.B.; Wang, X.N.; Wang, J.J. Evaluation of endogenous references for gene expression profiling in different tissues of the oriental fruit fly Bactrocera dorsalis (Diptera: Tephritidae). BMC Mol. Biol. 2010, 11, 76. [Google Scholar] [CrossRef] [PubMed]
- Wang, F.Y.; Yang, L.; Li, L.F.; Liao, S.J.; Liao, R.Z.; Jiang, J.J. Selection of reference genes in the Bactrocera cucurbitae (Coquillett) under temperature stress by RT-qPCR. J. Environ. Entomol. 2018, 40, 1097–1105. [Google Scholar]
- Zhang, X.X.; Liu, Y.; Guo, M.B.; Sun, D.D.; Zhang, M.J.; Chu, X.; Berg, B.G.; Wang, G.R. A female-specific odorant receptor mediates oviposition deterrence in the moth Helicoverpa armigera. Curr. Biol. 2023. [Google Scholar] [CrossRef] [PubMed]
- Li, R.T.; Huang, L.Q.; Dong, J.F.; Wang, C.Z. A moth odorant receptor highly expressed in the ovipositor is involved in detecting host-plant volatiles. eLife 2020, 9, e53706. [Google Scholar] [CrossRef]
- Ibanez, F.; Tamborindeguy, C. Selection of reference genes for expression analysis in the potato psyllid, Bactericera cockerelli. Insect Mol. Biol. 2016, 25, 227–238. [Google Scholar] [CrossRef]
- Meire, M.B.; Jéssika, A.M.; Gustavo, R.A.; Pedro, T.Y.; de Assis Alves Moura, F.O.F. Selection of Reference Genes for Expression Studies in Diaphorina citri (Hemiptera: Liviidae). J. Econ. Entomol. 2017, 110, 2623–2629. [Google Scholar]
- Bin, S.Y.; Pu, X.X.; Shu, B.S.; Kang, C.; Luo, S.M.; Tang, Y.; Wu, Z.Z.; Lin, J.T. Selection of Reference Genes for Optimal Normalization of Quantitative Real-Time Polymerase Chain Reaction Results for Diaphorina citri Adults. J. Econ. Entomol. 2019, 112, 355–363. [Google Scholar] [CrossRef]
- Silver, N.; Best, S.; Jiang, J.; Thein, S.L. Selection of housekeeping genes for gene expression studies in human reticulocytes using real-time PCR. BMC Mol. Biol. 2006, 7, 33. [Google Scholar] [CrossRef] [PubMed]
- Vandesompele, J.; De Preter, K.; Pattyn, F.; Poppe, B.; Van Roy, N.; De Paepe, A.; Speleman, F. Accurate normalization of real-time quantitative RT-PCR data by geometric averaging of multiple internal control genes. Genome Biol. 2002, 3, research0034.1. [Google Scholar] [CrossRef] [PubMed]
- Andersen, C.L.; Jensen, J.L.; Orntoft, T.F. Normalization of real-time quantitative reverse transcription-PCR data: A model-based variance estimation approach to identify genes suited for normalization, applied to bladder and colon cancer data sets. Cancer Res. 2004, 64, 5245–5250. [Google Scholar] [CrossRef] [PubMed]
- Pfaffl, M.W.; Tichopad, A.; Prgomet, C.; Neuvians, T.P. Determination of stable housekeeping genes, differentially regulated target genes and sample integrity: BestKeeper--Excel-based tool using pair-wise correlations. Biotechnol. Lett. 2004, 26, 509–515. [Google Scholar] [CrossRef]
- Xie, F.; Xiao, O.; Chen, D.; Xu, L.; Zhang, B. miRDeepFinder: A miRNA analysis tool for deep sequencing of plant small RNAs. Plant Mol. Biol. 2012, 80, 75–84. [Google Scholar] [CrossRef]
- Wang, J.; Zhao, J.; Liu, Y.H. Evaluation of endogenous reference genes in Bactrocera minax (Diptera:Tephritidae). Acta Entomol. Sin. 2014, 57, 1375–1380. [Google Scholar]
- Zhang, Y.; Gong, Z.; Li, L.; Niu, L.; Fu, Y. Evaluation of endogenous reference genes in Bactrocera cucurbitae by RT-qPCR under different conditions. PLoS ONE 2018, 13, e0202829. [Google Scholar] [CrossRef]
- Shi, C.H.; Yang, F.S.; Zhu, X.; Du, E.X.; Yang, Y.T.; Wang, S.L.; Wu, Q.J.; Zhang, Y.J. Evaluation of Housekeeping Genes for Quantitative Real-Time PCR Analysis of Bradysia odoriphaga (Diptera: Sciaridae). Int. J. Mol. Sci. 2016, 17, 1034. [Google Scholar] [CrossRef]
- Lozano, R.E.; De’bora, P.P.; Andow, D.A.; Koch, R.L. Validation of Reference Genes Across Populations of Aphis glycines (Hemiptera: Aphididae) for RT-qPCR Analysis of Gene Expression Related to Pyrethroid Detoxification. J. Entomol. Sci. 2022, 57, 213–239. [Google Scholar] [CrossRef]
- Markussen, M.D.K.; Kristensen, M. Spinosad resistance in female Musca domestica L. from a field-derived population. Pest Manag. Sci. 2012, 68, 75–82. [Google Scholar] [CrossRef]
- Nakamura, A.M.; Chahad-Ehlers, S.; Lima, A.L.A.; Taniguti, C.H.; Sobrinho, I.; Torres, F.R.; de Brito, R.A. Reference genes for accessing differential expression among developmental stages and analysis of differential expression of OBP genes in Anastrepha obliqua. Sci. Rep. 2016, 6, 17480. [Google Scholar] [CrossRef]
- Wei, H.S.; Tan, S.Q.; Yan, S.; Li, Z.; Li, J.C.; Moural, T.W.; Zhu, F.; Liu, X.X. Odorant degrading carboxylesterases modulate foraging and mating behaviors of Grapholita molesta. Chemosphere 2021, 270, 128647. [Google Scholar] [CrossRef]
- Livak, K.J.; Schmittgen, T.D. Analysis of relative gene expression data using real-time quantitative PCR and the 2–ΔΔCt method. Methods 2001, 25, 402–408. [Google Scholar] [CrossRef]


| Gene Symbol | Gene Name | Primer Sequence (from 5′ to 3′) | Amplicon Size (bp) | E (%) | R2 | Slope |
|---|---|---|---|---|---|---|
| Reference genes: | ||||||
| β-actin | Beta actin | F: GGTGTCATGGTGGGTATGGG R: CAGGATGGGGTGCTCTTCTG | 150 | 98.3 | 0.995 | −3.365 |
| EF1α | Elongation factor 1 alpha | F: CGGAAAAACCACCGAGGAGA R: TTGATGACTCCCACAGCCAC | 144 | 98.5 | 0.999 | −3.357 |
| EF2 | Elongation factor 2 | F: GTACAGGCCCCAACCTTCTC R: GGACAGGACACCCTCTTTGG | 149 | 92.7 | 0.997 | −3.510 |
| Ferritin | Ferritin | F: GCAGAACTCTTGCTCGTCCT R: AGGGTGTACTGGTAGCTGGT | 105 | 96.2 | 0.989 | −3.416 |
| GAPDH | Glyceraldehyde-3-phosphate dehydrogenase | F: ATGGAAAGTTCAAGGGAGACG R: AACATACTCAGCTCCAGACTTG | 148 | 97.3 | 0.998 | −3.388 |
| α-TUB | Alpha tubulin | F: AAGTCTCCACCTCCGTCGTA R: TCAGGTTGGTGTAGGTGGGA | 172 | 90.5 | 0.997 | −3.572 |
| β-TUB | Beta-tubulin | F: CTTGTATCCCTCACCATGTCC R: TCTCAGGTCAGCATTCAGTTG | 99 | 93.5 | 0.997 | −3.488 |
| AK | Arginine kinase | F: GGCCACAGAAAGCAAATCCC R: GGATTCAGCATCAGGAGCGT | 131 | 91.3 | 0.992 | −3.551 |
| GST | Glutathione S-transferase | F: CCCAAGCAGAGGGGAATTGT R: AGGCGAGGAAAGTGTTGAGG | 122 | 98.7 | 0.996 | −3.355 |
| RPL8 | Ribosomal protein L8 | F: GAGCTGTTCATTGCCCCAGA R: ATTCCTCCCACAGGCATCAC | 198 | 92.2 | 0.992 | −3.523 |
| RPL10 | Ribosomal protein L10 | F: GTATGCGTGGTGCCTATGGT R: TCCGGGGAACTTGAACTTGG | 129 | 98.3 | 0.993 | −3.364 |
| RPL32 | Ribosomal protein L32 | F: AGGAAAGTCTTCATCCGTCATC R: TTCTTGGCACTACCGTAACC | 116 | 91.5 | 0.998 | −3.544 |
| RPS11 | Ribosomal protein S11 | F: CTTTCCAAAAGCAGCCGACA R: TGACGTTACCAGTGAAGGGG | 142 | 93.2 | 0.999 | −3.497 |
| RPS15 | Ribosomal protein S15 | F: GGACGAATAACCTGCTACCATC R: CCTCCCAAGTGTTTTCTCCTG | 92 | 92.9 | 0.999 | −3.505 |
| RPS20 | Ribosomal protein S20 | F: CCACCACCCACAAAGGATCT R: TGATGGGACCCTTTGGCTTC | 92 | 104.4 | 0.997 | −3.220 |
| Target gene: | ||||||
| CYP6a1 | cytochrome P450 CYP6a1 | F: AGGAATGATCTCTTGCAGACG R: GTGGTCAATGCGGATGTTTC | 149 | 97.5 | 0.996 | −3.384 |
| Experimental Conditions | Single Most Stable Reference Genes | Optimal Combination Reference Genes |
|---|---|---|
| Imidacloprid | RPL10 | RPL10 + RPS15 |
| Thiamethoxam | RPL10 | RPL10 + AK |
| λ-cyhalothrin | RPL32 | RPL32 + RPL10 |
| Abamectin | RPS15 | RPS15 + RPL10 |
| Matrine | RPL10 | RPL10 + RPL8 |
| Different insecticides | EF2 | EF2 + RPL32 |
| Different temperature | EF1α | EF1α +β-actin |
| Odor stimulation | EF1α | EF1α + RPL8 |
| Developmental stages | β-actin | β-actin + EF2 |
| Both sexes | β-actin | β-actin + RPS15 |
| All samples | EF2 | EF2 +RPL8 |
| Rank | Delta Ct Method | NormFinder | GeNorm | BestKeeper | |||||
|---|---|---|---|---|---|---|---|---|---|
| Gene | M | Gene | M | Gene | M | Gene | SD | CV | |
| Different insecticides | |||||||||
| 1 | EF2 | 0.62 | GST | 0.28 | EF2 | 0.16 | β-TUB | 0.59 | 2.45 |
| 2 | RPL32 | 0.65 | RPL32 | 0.29 | GAPDH | 0.16 | RPL8 | 0.82 | 4.05 |
| 3 | RPS15 | 0.67 | RPS15 | 0.29 | α-TUB | 0.20 | α-TUB | 0.84 | 3.11 |
| 4 | EF1α | 0.67 | EF2 | 0.32 | EF1α | 0.24 | GAPDH | 0.87 | 3.99 |
| 5 | AK | 0.67 | AK | 0.33 | RPL8 | 0.27 | EF1α | 0.95 | 4.65 |
| 6 | GST | 0.68 | RPL10 | 0.38 | RPL32 | 0.34 | EF2 | 0.98 | 4.42 |
| 7 | GAPDH | 0.69 | Ferritin | 0.41 | AK | 0.40 | RPL32 | 1.12 | 5.78 |
| 8 | α-TUB | 0.70 | EF1α | 0.42 | RPS15 | 0.44 | AK | 1.22 | 5.77 |
| 9 | RPL10 | 0.72 | GAPDH | 0.47 | Ferritin | 0.47 | Ferritin | 1.26 | 5.55 |
| 10 | Ferritin | 0.72 | α-TUB | 0.50 | GST | 0.50 | RPS15 | 1.32 | 6.64 |
| 11 | RPL8 | 0.75 | RPL8 | 0.57 | RPL10 | 0.53 | GST | 1.45 | 6.70 |
| 12 | β-actin | 0.83 | β-actin | 0.59 | β-actin | 0.57 | RPL10 | 1.55 | 8.50 |
| 13 | β-TUB | 1.15 | β-TUB | 1.09 | β-TUB | 0.63 | β-actin | 1.77 | 8.57 |
| 14 | RPS11 | 1.24 | RPS11 | 1.16 | RPS11 | 0.73 | RPS11 | 2.18 | 10.45 |
| 15 | RPS20 | 1.32 | RPS20 | 1.26 | RPS20 | 0.81 | RPS20 | 2.39 | 10.82 |
| Different temperatures | |||||||||
| 1 | EF1α | 0.60 | EF1α | 0.11 | RPL8 | 0.22 | β-actin | 0.01 | 0.08 |
| 2 | β-actin | 0.64 | Ferritin | 0.14 | RPL32 | 0.22 | EF2 | 0.22 | 1.11 |
| 3 | Ferritin | 0.64 | β-actin | 0.21 | EF1α | 0.29 | EF1α | 0.25 | 1.42 |
| 4 | RPL32 | 0.66 | RPL32 | 0.30 | β-actin | 0.34 | RPL32 | 0.28 | 1.33 |
| 5 | RPL8 | 0.68 | RPL10 | 0.34 | EF2 | 0.37 | AK | 0.32 | 1.52 |
| 6 | RPL10 | 0.71 | RPL8 | 0.34 | GAPDH | 0.37 | GAPDH | 0.35 | 1.80 |
| 7 | EF2 | 0.71 | EF2 | 0.47 | Ferritin | 0.39 | Ferritin | 0.36 | 1.69 |
| 8 | GAPDH | 0.73 | RPS11 | 0.50 | RPL10 | 0.42 | RPL8 | 0.37 | 1.83 |
| 9 | RPS11 | 0.80 | GAPDH | 0.51 | RPS15 | 0.46 | RPL10 | 0.42 | 2.23 |
| 10 | RPS15 | 0.87 | AK | 0.66 | AK | 0.52 | RPS11 | 0.44 | 2.08 |
| 11 | AK | 0.88 | RPS15 | 0.72 | RPS11 | 0.55 | RPS15 | 0.47 | 2.50 |
| 12 | RPS20 | 0.96 | RPS20 | 0.79 | RPS20 | 0.63 | RPS20 | 0.80 | 3.72 |
| 13 | α-TUB | 1.02 | α-TUB | 0.88 | α-TUB | 0.68 | GST | 0.81 | 3.96 |
| 14 | GST | 1.19 | GST | 1.13 | GST | 0.74 | α-TUB | 0.89 | 3.50 |
| 15 | β-TUB | 1.48 | β-TUB | 1.43 | β-TUB | 0.84 | β-TUB | 1.30 | 5.94 |
| Odor stimulation | |||||||||
| 1 | EF1α | 0.49 | EF1α | 0.14 | RPL8 | 0.15 | RPL8 | 0.10 | 0.50 |
| 2 | Ferritin | 0.52 | Ferritin | 0.18 | β-actin | 0.15 | β-actin | 0.12 | 0.69 |
| 3 | α-TUB | 0.53 | α-TUB | 0.22 | GAPDH | 0.22 | EF2 | 0.14 | 0.68 |
| 4 | RPS15 | 0.53 | RPS15 | 0.24 | EF2 | 0.25 | GAPDH | 0.16 | 0.87 |
| 5 | EF2 | 0.54 | EF2 | 0.25 | EF1α | 0.31 | Ferritin | 0.26 | 1.31 |
| 6 | β-TUB | 0.56 | AK | 0.27 | RPL10 | 0.33 | EF1α | 0.27 | 1.58 |
| 7 | AK | 0.56 | β-TUB | 0.28 | Ferritin | 0.35 | RPL10 | 0.31 | 1.54 |
| 8 | RPL10 | 0.58 | RPL10 | 0.32 | AK | 0.37 | AK | 0.32 | 1.71 |
| 9 | GAPDH | 0.59 | GAPDH | 0.40 | α-TUB | 0.40 | α-TUB | 0.50 | 2.39 |
| 10 | RPL8 | 0.62 | RPL8 | 0.47 | RPS15 | 0.41 | β-TUB | 0.50 | 2.27 |
| 11 | β-actin | 0.64 | GST | 0.47 | β-TUB | 0.43 | RPS15 | 0.52 | 2.57 |
| 12 | GST | 0.66 | β-actin | 0.48 | GST | 0.46 | RPS20 | 0.64 | 3.20 |
| 13 | RPS11 | 0.74 | RPS11 | 0.60 | RPS11 | 0.49 | GST | 0.70 | 3.38 |
| 14 | RPS20 | 1.14 | RPS20 | 1.12 | RPS20 | 0.57 | RPS11 | 0.82 | 4.07 |
| 15 | RPL32 | 1.30 | RPL32 | 1.27 | RPL32 | 0.67 | RPL32 | 1.38 | 4.90 |
| Developmental stages | |||||||||
| 1 | β-actin | 0.81 | β-actin | 0.05 | β-actin | 0.09 | β-TUB | 0.41 | 1.94 |
| 2 | EF2 | 0.82 | EF2 | 0.05 | EF2 | 0.09 | RPL10 | 0.47 | 2.35 |
| 3 | RPS15 | 0.83 | GST | 0.08 | RPS15 | 0.19 | RPS11 | 0.60 | 2.96 |
| 4 | GST | 0.87 | RPS15 | 0.10 | GST | 0.26 | EF2 | 0.69 | 3.40 |
| 5 | RPS11 | 0.87 | RPS20 | 0.15 | RPS20 | 0.28 | β-actin | 0.76 | 4.42 |
| 6 | RPS20 | 0.89 | GAPDH | 0.24 | RPS11 | 0.31 | RPS20 | 0.80 | 3.81 |
| 7 | Ferritin | 0.94 | RPS11 | 0.33 | Ferritin | 0.36 | EF1α | 0.81 | 4.63 |
| 8 | EF1α | 0.96 | Ferritin | 0.38 | EF1α | 0.39 | Ferritin | 0.83 | 4.02 |
| 9 | RPL8 | 0.98 | EF1α | 0.49 | RPL8 | 0.41 | GST | 0.87 | 4.24 |
| 10 | GAPDH | 0.99 | RPL8 | 0.49 | RPL10 | 0.44 | RPS15 | 0.91 | 4.50 |
| 11 | RPL10 | 0.99 | RPL10 | 0.57 | GAPDH | 0.47 | RPL8 | 0.92 | 4.69 |
| 12 | β-TUB | 1.26 | β-TUB | 0.97 | β-TUB | 0.55 | GAPDH | 1.13 | 5.70 |
| 13 | AK | 1.74 | AK | 1.40 | AK | 0.71 | RPL32 | 1.23 | 3.92 |
| 14 | RPL32 | 2.40 | RPL32 | 2.33 | RPL32 | 0.92 | AK | 2.04 | 9.54 |
| 15 | α-TUB | 3.39 | α-TUB | 3.36 | α-TUB | 1.25 | α-TUB | 3.40 | 13.55 |
| Both sexes | |||||||||
| 1 | β-actin | 0.31 | β-actin | 0.04 | AK | 0.06 | β-actin | 0.02 | 0.09 |
| 2 | RPS15 | 0.31 | RPS15 | 0.04 | RPL8 | 0.06 | Ferritin | 0.08 | 0.43 |
| 3 | Ferritin | 0.33 | Ferritin | 0.08 | GST | 0.09 | RPS15 | 0.08 | 0.41 |
| 4 | RPS20 | 0.35 | RPS20 | 0.14 | EF1α | 0.12 | RPS20 | 0.15 | 0.73 |
| 5 | RPL8 | 0.37 | RPL32 | 0.20 | β-actin | 0.16 | AK | 0.16 | 0.83 |
| 6 | RPL32 | 0.37 | AK | 0.21 | RPS15 | 0.19 | RPL8 | 0.16 | 0.86 |
| 7 | AK | 0.37 | RPL8 | 0.22 | Ferritin | 0.20 | GST | 0.17 | 0.87 |
| 8 | GST | 0.38 | GST | 0.23 | RPS20 | 0.21 | EF1α | 0.20 | 1.15 |
| 9 | RPS11 | 0.41 | RPS11 | 0.27 | RPL32 | 0.24 | RPL32 | 0.20 | 0.87 |
| 10 | EF1α | 0.43 | EF1α | 0.31 | RPS11 | 0.26 | RPS11 | 0.20 | 1.05 |
| 11 | GAPDH | 0.47 | GAPDH | 0.39 | GAPDH | 0.30 | GAPDH | 0.35 | 1.93 |
| 12 | RPL10 | 0.47 | RPL10 | 0.39 | RPL10 | 0.32 | β-TUB | 0.36 | 1.68 |
| 13 | β-TUB | 0.51 | β-TUB | 0.43 | β-TUB | 0.34 | RPL10 | 0.36 | 1.80 |
| 14 | EF2 | 0.65 | EF2 | 0.58 | EF2 | 0.38 | EF2 | 0.46 | 2.39 |
| 15 | α-TUB | 0.84 | α-TUB | 0.81 | α-TUB | 0.44 | α-TUB | 0.65 | 3.07 |
| All samples | |||||||||
| 1 | EF2 | 1.41 | GST | 0.44 | EF2 | 0.53 | RPL8 | 0.85 | 4.31 |
| 2 | Ferritin | 1.42 | RPL8 | 0.54 | GAPDH | 0.53 | RPS15 | 0.90 | 4.60 |
| 3 | GST | 1.47 | RPS15 | 0.55 | Ferritin | 0.57 | RPL10 | 1.03 | 5.38 |
| 4 | GAPDH | 1.48 | EF2 | 0.57 | EF1α | 0.61 | EF2 | 1.04 | 5.01 |
| 5 | RPL8 | 1.50 | Ferritin | 0.60 | GST | 0.73 | GST | 1.07 | 5.13 |
| 6 | EF1α | 1.57 | GAPDH | 0.74 | RPL8 | 0.78 | Ferritin | 1.12 | 5.26 |
| 7 | RPS15 | 1.61 | RPS11 | 0.79 | β-actin | 0.85 | RPS11 | 1.19 | 5.80 |
| 8 | RPS11 | 1.63 | AK | 0.79 | RPS20 | 0.95 | β-TUB | 1.24 | 5.52 |
| 9 | RPS20 | 1.68 | RPS20 | 0.94 | RPS11 | 1.01 | AK | 1.25 | 6.11 |
| 10 | AK | 1.68 | EF1α | 1.01 | RPS15 | 1.05 | EF1α | 1.32 | 7.16 |
| 11 | β-actin | 1.77 | β-TUB | 1.26 | AK | 1.09 | GAPDH | 1.32 | 6.58 |
| 12 | β-TUB | 1.84 | β-actin | 1.31 | β-TUB | 1.14 | RPS20 | 1.35 | 6.33 |
| 13 | RPL10 | 2.13 | RPL10 | 1.44 | RPL10 | 1.25 | β-actin | 1.55 | 8.45 |
| 14 | α-TUB | 2.73 | α-TUB | 2.44 | α-TUB | 1.42 | α-TUB | 2.59 | 10.50 |
| 15 | RPL32 | 5.47 | RPL32 | 5.39 | RPL32 | 1.96 | RPL32 | 4.27 | 18.04 |
| Clean Data Name | Accession Numbers in NCBI |
|---|---|
| Nymphs without imidacloprid treatment 1 | SRR27779040 |
| Nymphs without imidacloprid treatment 2 | SRR27779039 |
| Nymphs without imidacloprid treatment 3 | SRR27779038 |
| Nymphs with imidacloprid treatment 1 | SRR27779037 |
| Nymphs with imidacloprid treatment 2 | SRR27779046 |
| Nymphs with imidacloprid treatment 3 | SRR27779045 |
| Adults without imidacloprid treatment 1 | SRR27779048 |
| Adults without imidacloprid treatment 2 | SRR27779047 |
| Adults without imidacloprid treatment 3 | SRR27779044 |
Disclaimer/Publisher’s Note: The statements, opinions and data contained in all publications are solely those of the individual author(s) and contributor(s) and not of MDPI and/or the editor(s). MDPI and/or the editor(s) disclaim responsibility for any injury to people or property resulting from any ideas, methods, instructions or products referred to in the content. |
© 2024 by the authors. Licensee MDPI, Basel, Switzerland. This article is an open access article distributed under the terms and conditions of the Creative Commons Attribution (CC BY) license (https://creativecommons.org/licenses/by/4.0/).
Share and Cite
Wei, H.; Zhang, J.; Yang, M.; Li, Y.; Guo, K.; Qiao, H.; Xu, R.; Liu, S.; Xu, C. Selection and Validation of Reference Genes for Gene Expression in Bactericera gobica Loginova under Different Insecticide Stresses. Int. J. Mol. Sci. 2024, 25, 2434. https://doi.org/10.3390/ijms25042434
Wei H, Zhang J, Yang M, Li Y, Guo K, Qiao H, Xu R, Liu S, Xu C. Selection and Validation of Reference Genes for Gene Expression in Bactericera gobica Loginova under Different Insecticide Stresses. International Journal of Molecular Sciences. 2024; 25(4):2434. https://doi.org/10.3390/ijms25042434
Chicago/Turabian StyleWei, Hongshuang, Jingyi Zhang, Mengke Yang, Yao Li, Kun Guo, Haili Qiao, Rong Xu, Sai Liu, and Changqing Xu. 2024. "Selection and Validation of Reference Genes for Gene Expression in Bactericera gobica Loginova under Different Insecticide Stresses" International Journal of Molecular Sciences 25, no. 4: 2434. https://doi.org/10.3390/ijms25042434
APA StyleWei, H., Zhang, J., Yang, M., Li, Y., Guo, K., Qiao, H., Xu, R., Liu, S., & Xu, C. (2024). Selection and Validation of Reference Genes for Gene Expression in Bactericera gobica Loginova under Different Insecticide Stresses. International Journal of Molecular Sciences, 25(4), 2434. https://doi.org/10.3390/ijms25042434