Article

Investigation of the General Molecular Mechanisms of Gallic Acid via Analyses of Its Transcriptome Profile

1
Laboratory of Theriogenology and Biotechnology, Department of Veterinary Clinical Science, College of Veterinary Medicine and the Research Institute of Veterinary Science, Seoul National University, Seoul 08826, Republic of Korea
2
Plant Cell Research Institute of BIO-FD&C Co., Ltd., Incheon 21990, Republic of Korea
3
Department of Biotechnology, Duksung Women’s University, 33 Samyang-Ro 144-Gil, Dobong-gu, Seoul 01369, Republic of Korea
*
Authors to whom correspondence should be addressed.
Int. J. Mol. Sci. 2024, 25(4), 2303; https://doi.org/10.3390/ijms25042303
Submission received: 5 December 2023 / Revised: 7 February 2024 / Accepted: 13 February 2024 / Published: 15 February 2024

Abstract

:
Gallic acid (GA), a phenolic compound naturally found in many plants, exhibits potential preventive and therapeutic roles. However, the underlying molecular mechanisms of its diverse biological activities remain unclear. Here, we investigated possible mechanisms of GA function through a transcriptome-based analysis using LINCS L1000, a publicly available data resource. We compared the changes in the gene expression profiles induced by GA with those induced by FDA-approved drugs in three cancer cell lines (A549, PC3, and MCF7). The top 10 drugs exhibiting high similarity with GA in their expression patterns were identified by calculating the connectivity score in the three cell lines. We specified the known target proteins of these drugs, which could be potential targets of GA, and identified 19 potential targets. Next, we retrieved evidence in the literature that GA likely binds directly to DNA polymerase β and ribonucleoside-diphosphate reductase. Although our results align with previous studies suggesting a direct and/or indirect connection between GA and the target proteins, further experimental investigations are required to fully understand the exact molecular mechanisms of GA. Our study provides insights into the therapeutic mechanisms of GA, introducing a new approach to characterizing therapeutic natural compounds using transcriptome-based analyses.

1. Introduction

Gallic acid (GA) is a polyphenol compound naturally present in various plant species, such as gallnut, sumac, tea leaves, and oak bark [1]. This phytochemical demonstrates different biological features, including antioxidant, anti-inflammatory [2], antidepressant [3], and antidiabetic properties [4]. Furthermore, GA may play therapeutic roles in various diseases caused by oxidative stress, such as cancer [5], cardiovascular diseases [6], and neurodegenerative disorders [7]. Additionally, GA modulates cell signaling pathways in different cancers, including leukemia and liver, lung, colon, prostate, and breast cancers. In particular, GA regulates cell proliferation and survival, induces apoptosis, inhibits angiogenesis, and triggers oxidative stress [8,9,10,11,12]. However, the underlying molecular mechanism of GA remains unclear, since GA may exert its effects via multiple mechanisms.
Previous studies have used omics data to explain the action mechanisms of chemical compounds. For instance, transcriptome analyses have been widely used to facilitate the identification of differentially expressed genes (DEGs) based on their expression and regulatory mechanisms [13,14]. Recently, publicly available transcriptional profiling databases such as Connectivity Map (CMap) have emerged, dramatically improving the interpretation of transcriptional analysis [15]. CMap provides information on the gene expression profiles (GEPs) obtained from human cancer cells subjected to drug treatment, facilitating the identification of drug–disease associations using pattern-matching algorithms. Since 2006, CMap has compiled a library containing the GEPs of 564 genes for 143 different small-molecule perturbagens. The Library of Integrated Network-based Cellular Signatures (LINCS) L1000 database, an improved version of CMap, features considerably more information because it covers 1127 distinct cell lines subjected to drug treatment, encompassing approximately 42,000 small molecules (https://lincsportal.ccs.miami.edu/dcic-portal/, accessed on 12 January 2023) [16]. This database serves as a valuable resource for comparing GEP changes triggered by drug treatment in different disease models [17], predicting drug-target interactions [18,19], network integration [20], and transcriptomic analysis to clarify the mechanism of actions of bioactive molecules [21,22].
In this study, we analyzed the potential mechanism of action of GA in cells through transcriptome analysis (Figure 1). For this, GA-induced differential GEPs were first obtained from each cell line (A549, PC3, and MCF7). To investigate the potential biological functions of the DEGs, Gene Ontology (GO) [23] and the Kyoto Encyclopedia of Genes and Genomes (KEGG) pathway [24] enrichment analyses were performed. To further specify the direct targets and mechanisms, GA-induced GEP changes were compared with those induced by FDA-approved drugs in the LINCS L1000 database, and the drugs that exhibited high similarities in expression patterns in the three cell lines were identified. Connectivity scores were used to quantify the similarity in GEP changes, and the list was compiled in descending order based on the connectivity scores. The top 10 FDA-approved drugs on the list were identified. Then, their respective targets for inhibition and antagonism were elucidated, yielding a total of 19 potential targets. Based on the high similarity in GEPs, we hypothesized that GA could inhibit the same target proteins as these drugs. Using this comparative transcriptome analysis, we aimed to identify the multiple mechanisms used by GA and how changes in transcriptional activity induced by GA may reflect or contribute to diseases. As a small molecule, GA exhibits diverse mechanisms in different tissues; hence, more comprehensive research at the genome level is warranted.

2. Results

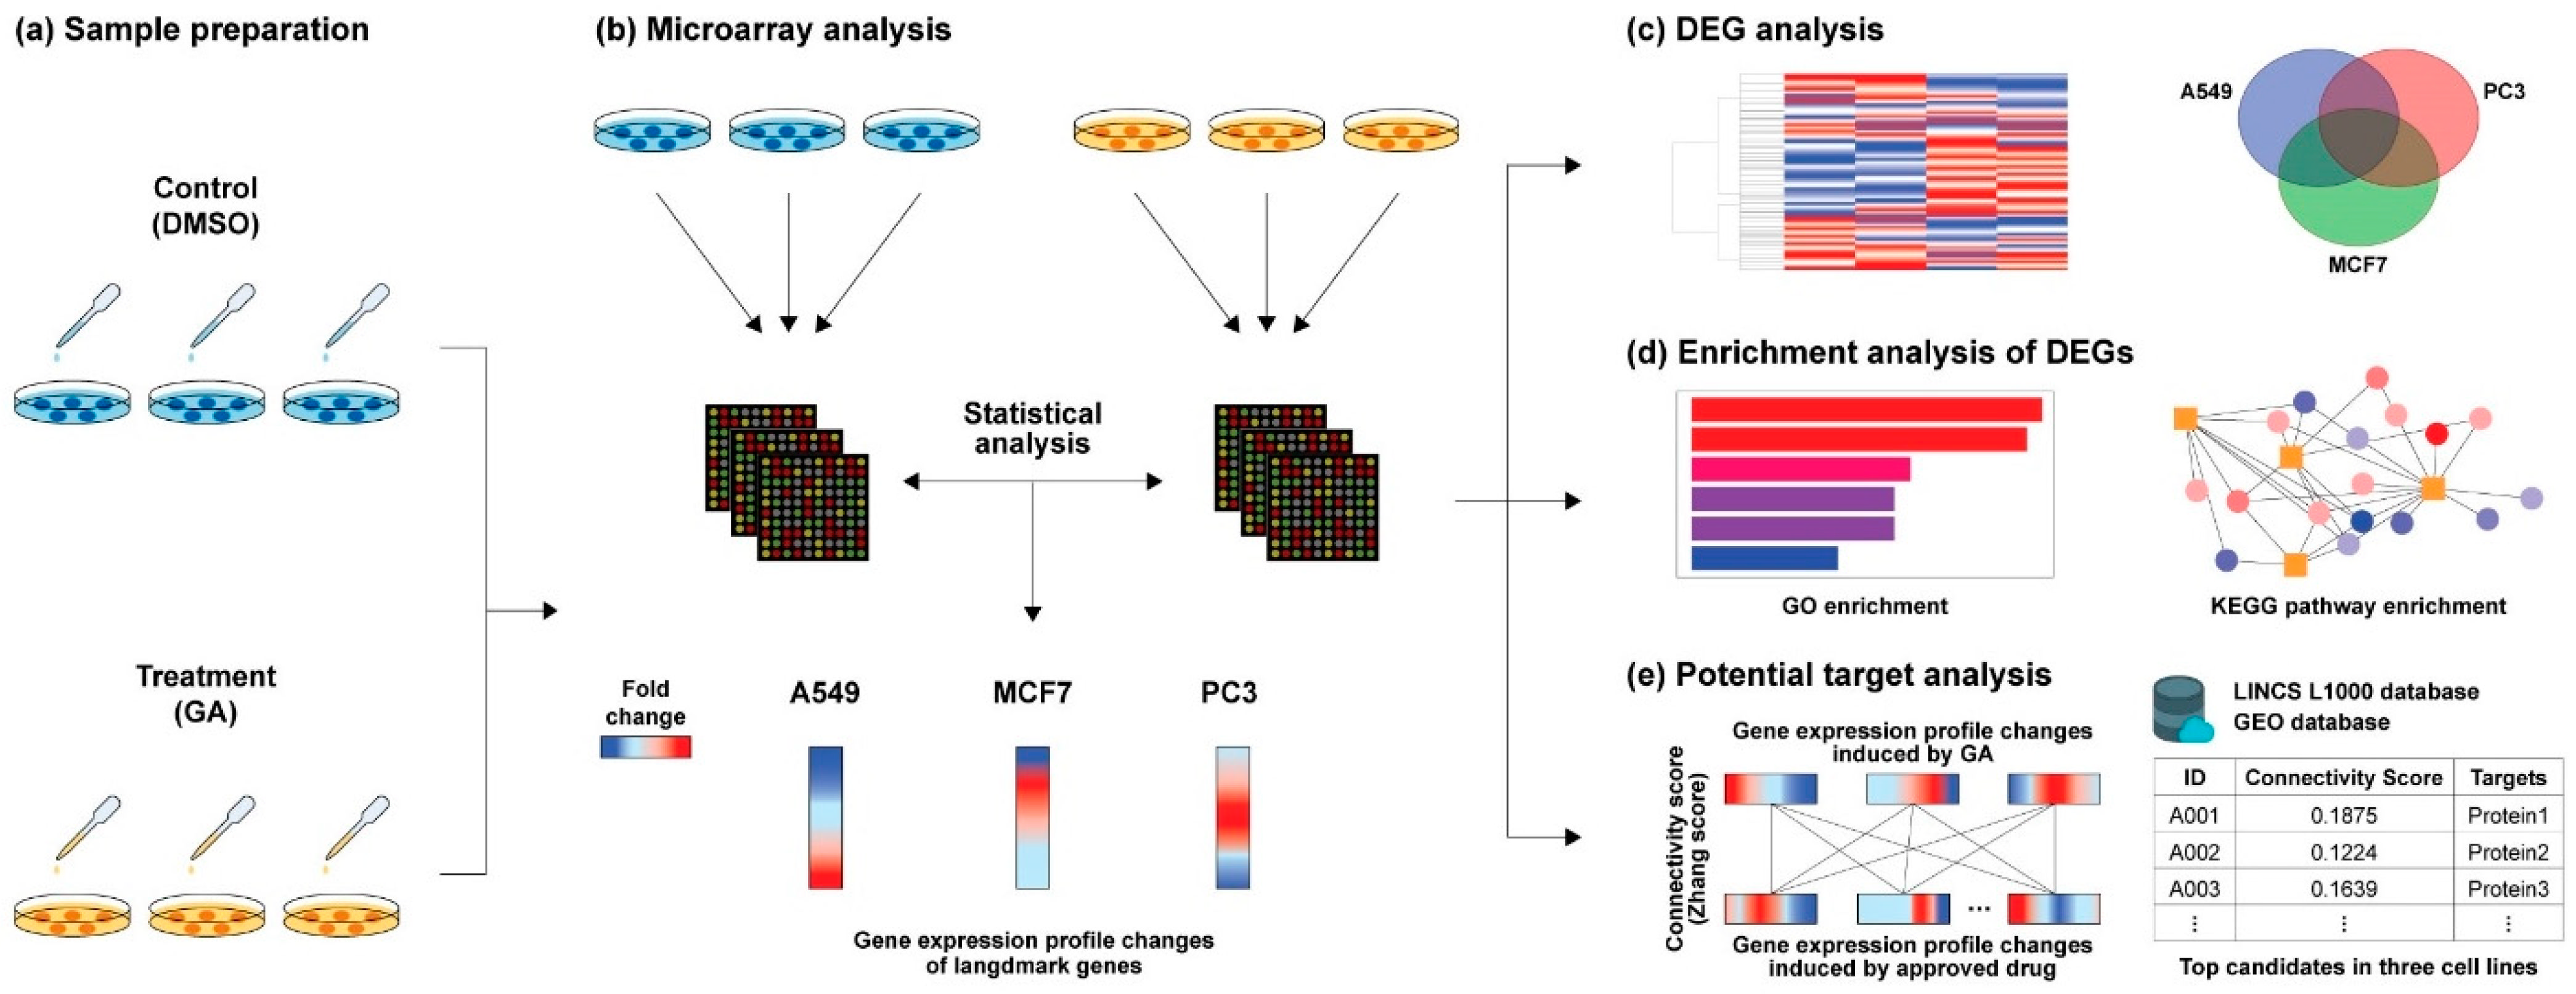
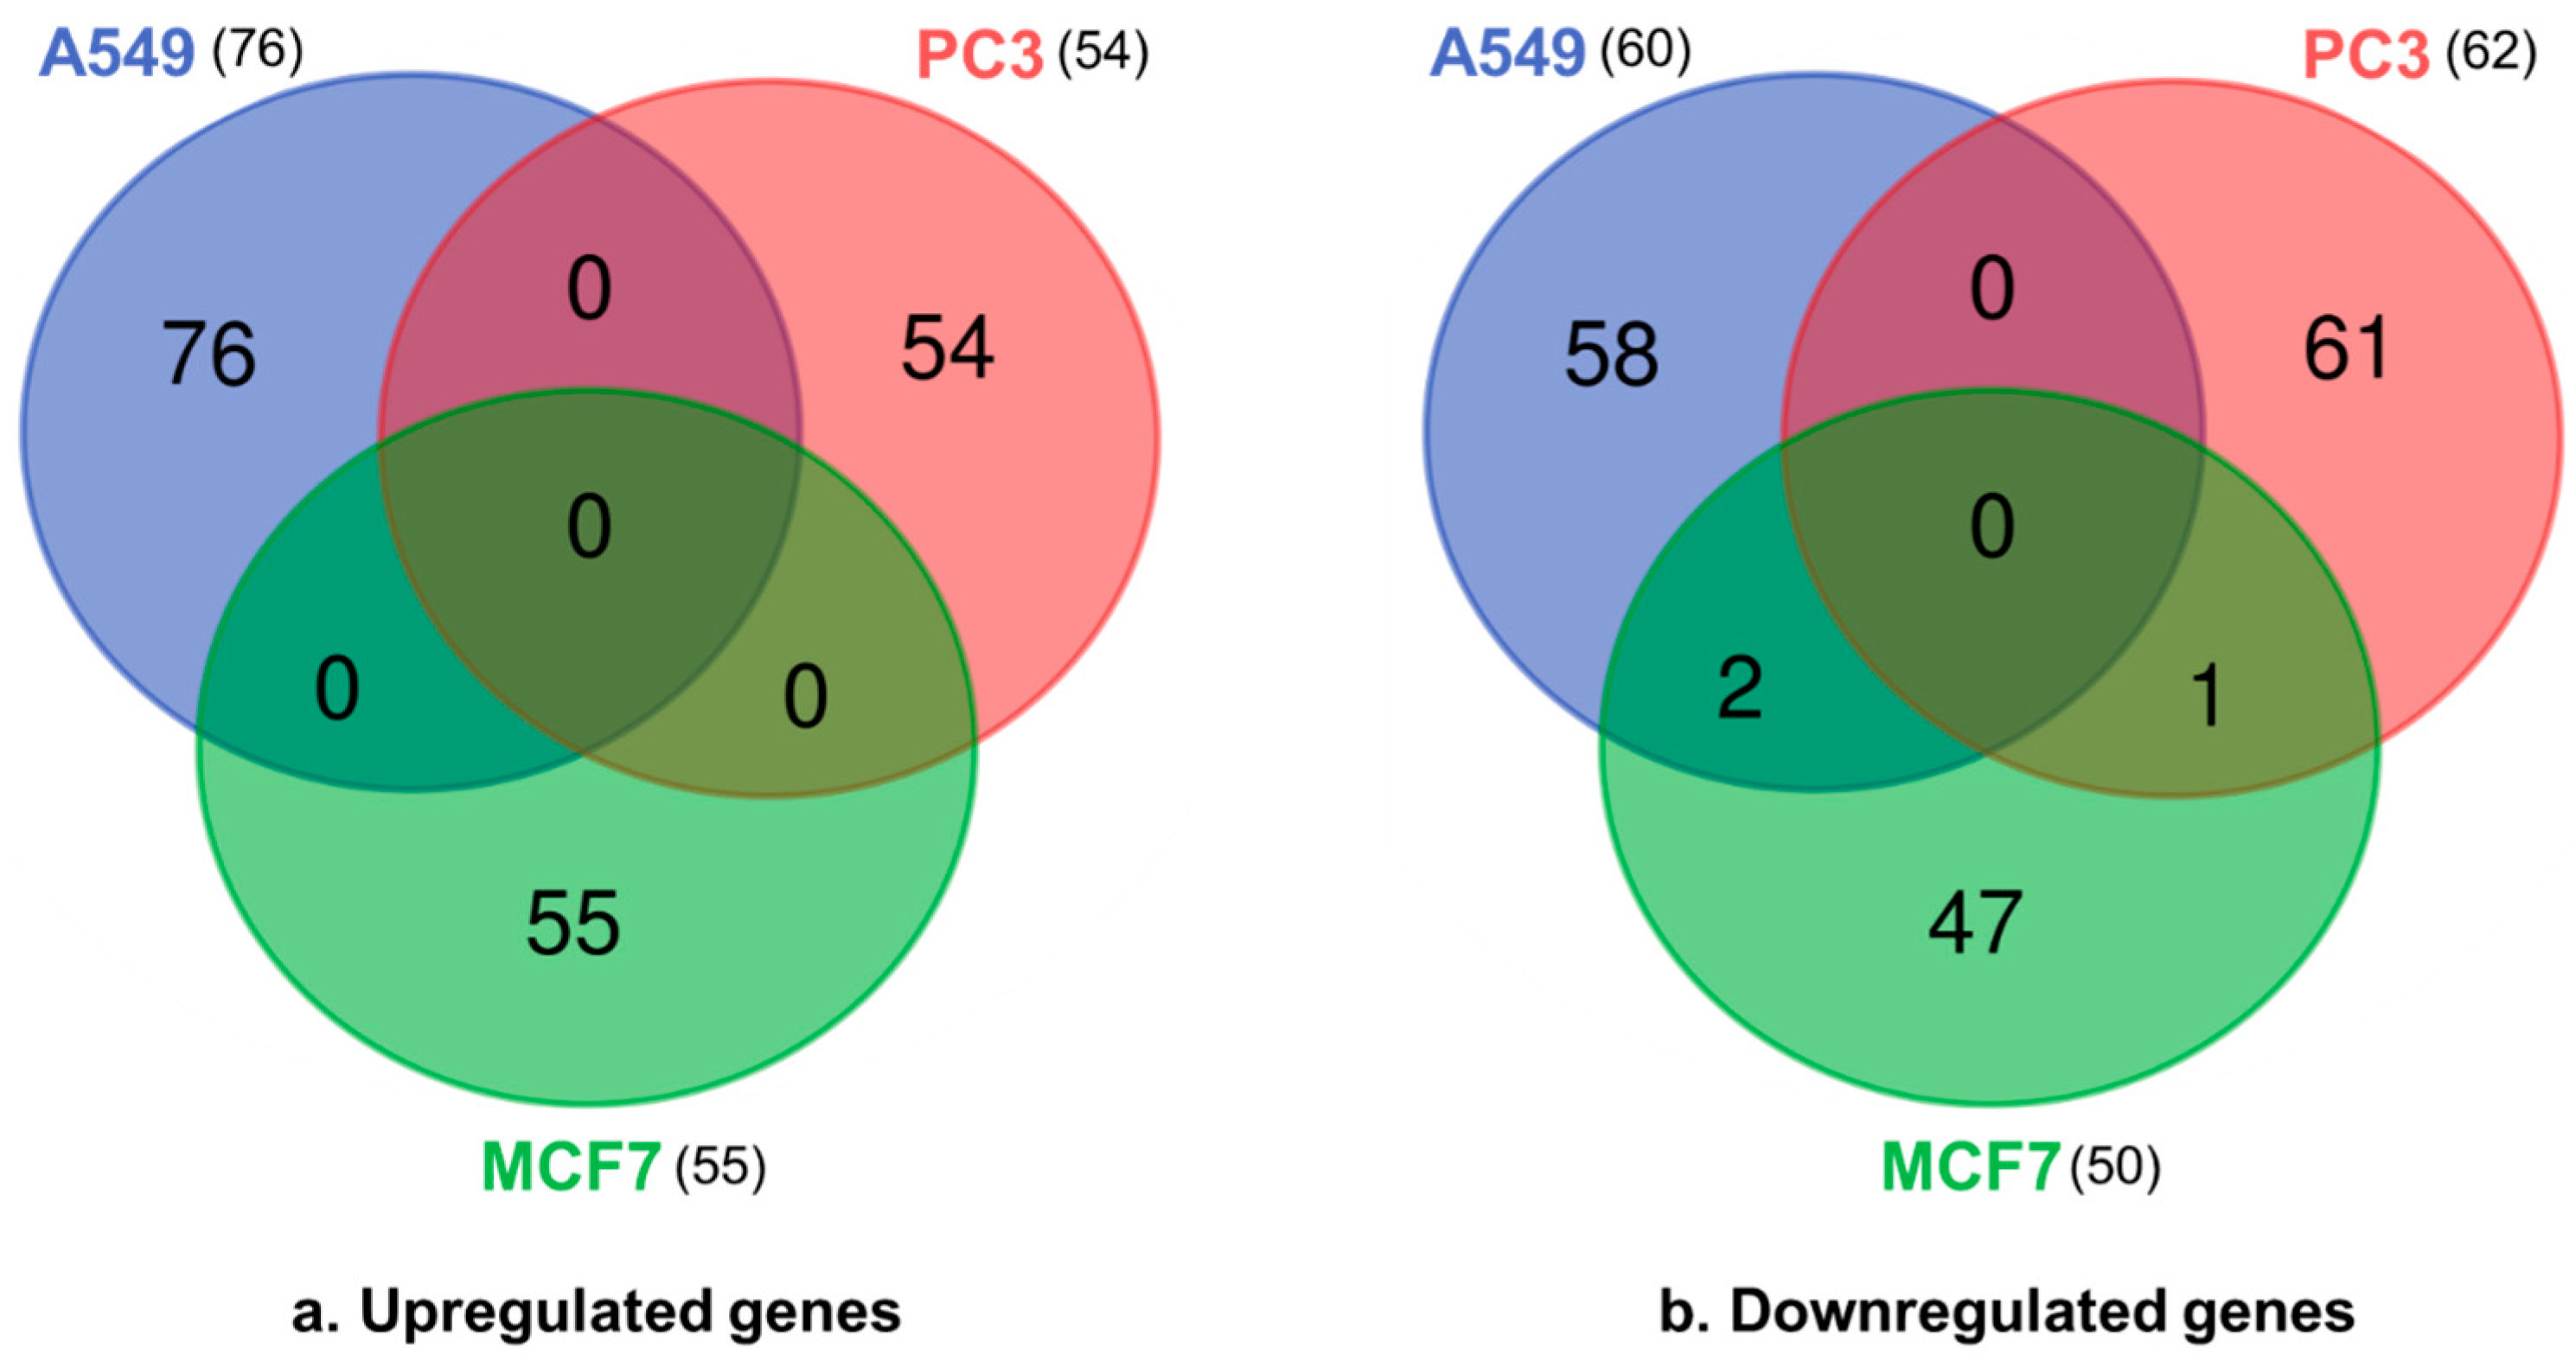
2.1. Data Analysis of GA-Induced GEPs

To obtain the GEPs, we treated three cell lines (A549 (lung carcinoma epithelial cell line), PC3 (human prostate adenocarcinoma cell line), and MCF7 (human breast carcinoma cell line)) with 10 µM GA for 6 h; DMSO served as the control. We calculated the mean value for triplicate samples individually and obtained the fold change (FC) by dividing the gene expression value of the GA treatment group by that of the control group, where FC represented the GEP changes in each cell line. An absolute value of FC < 1 indicated that gene expression was downregulated after GA treatment, which was expressed using a negative (−) sign.
For differentially expressed gene (DEG) analysis, p-values of < 0.05 indicated significant changes in the gene expressions, and the FC cutoff value was set at FC ≥ 1.5. In A549 cells, there were 76 upregulated genes and 60 downregulated genes. In PC3 cells, 54 and 62 genes were upregulated and downregulated, respectively, whereas in MCF7 cells, 55 and 50 genes were upregulated and downregulated, respectively. Among these genes, pogo transposable element derived with ZNF domain (POGZ) and T cell receptor-associated transmembrane adaptor 1 (TRAT1) were downregulated in both A549 and MCF7 cell lines, whereas Formin 1 (FMN1) was downregulated in both PC3 and MCF7 cell lines. Notably, no common regulated genes were identified in all three cell lines (Figure 2 and Table S1). TRAT1 regulates T cell-mediated immune responses [25], while POGZ is involved in neurodevelopment and mitotic cell cycle progression [26], and FMN1 regulates the organization of the actin cytoskeleton [27], which is key to many cellular processes, including the cell cycle, motility, division, and adhesion. All three genes (i.e., TRAT1, POGZ, and FMN1) have been identified as potential therapeutic targets for the treatment of some cancers [25,28,29].

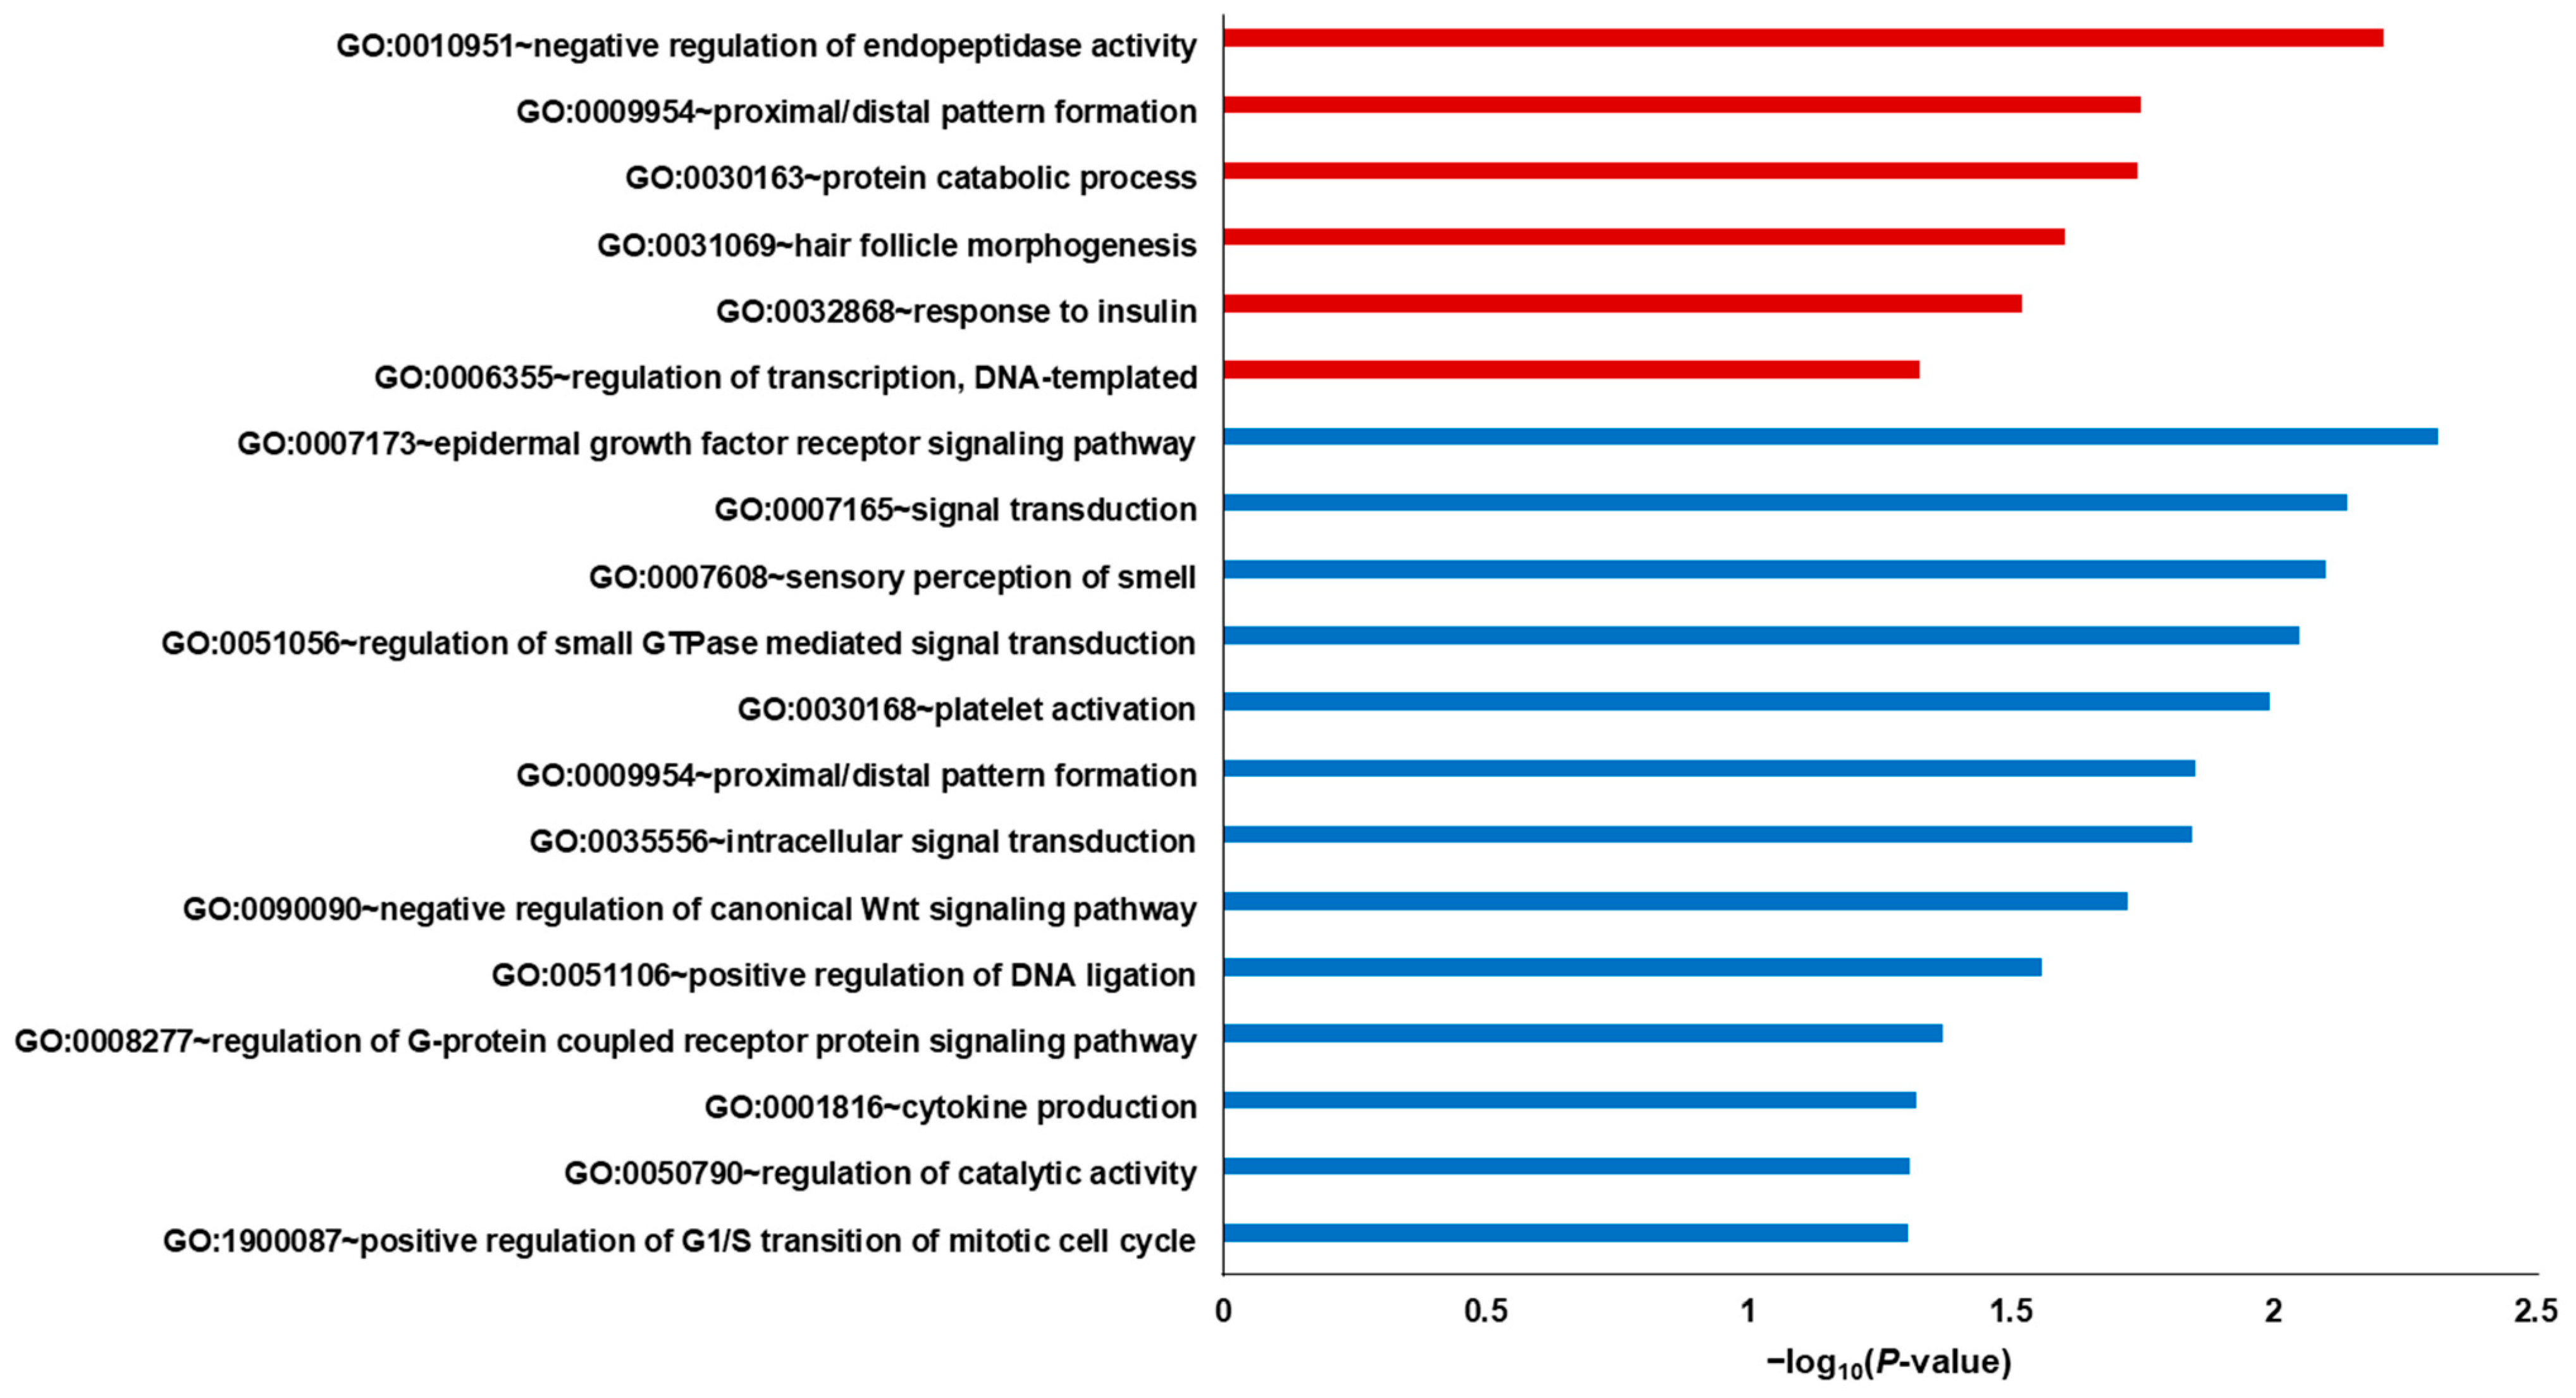
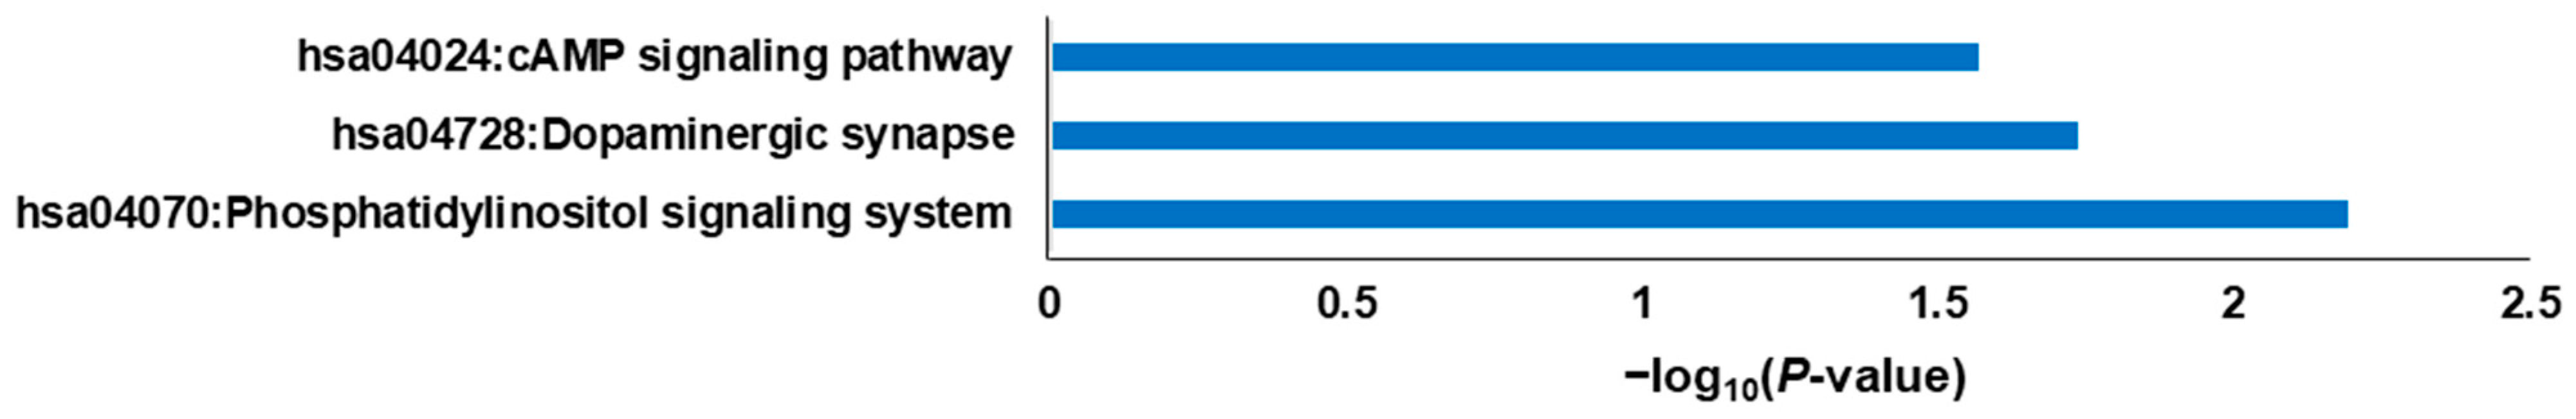
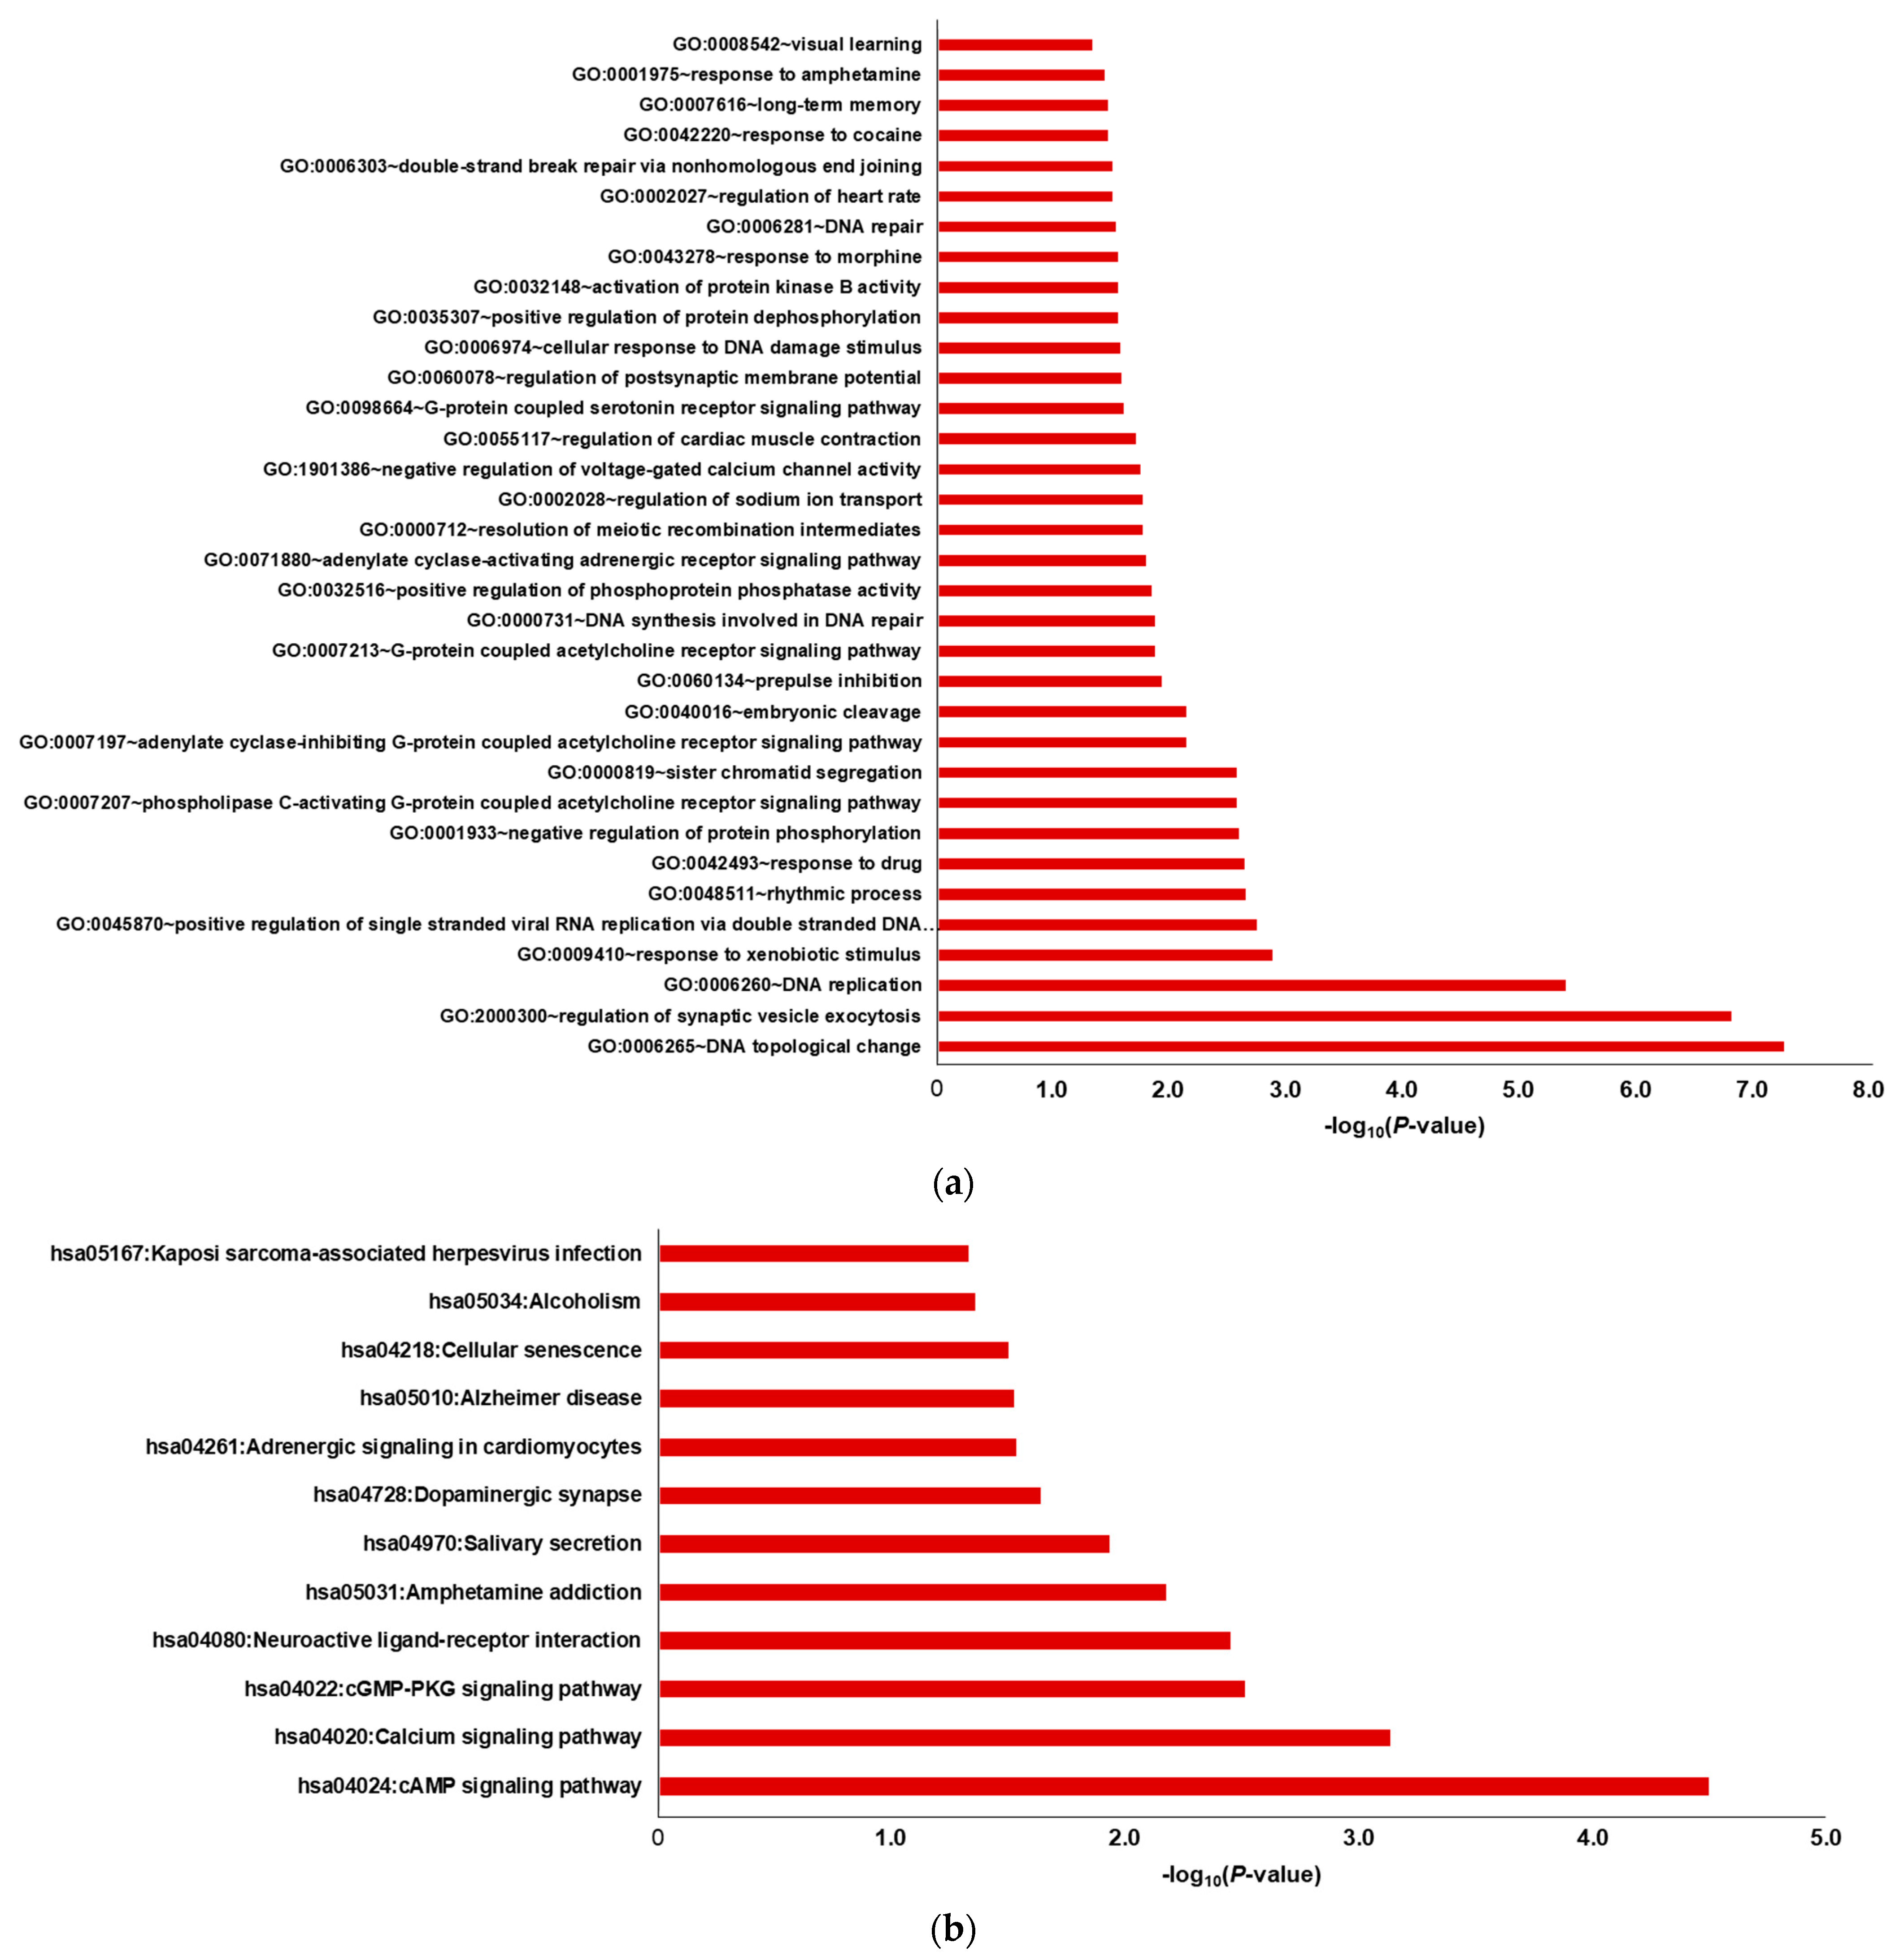
2.2. DEG Analysis through GO Mapping and KEGG Pathway Enrichment

We performed GO and KEGG pathway enrichment analyses using the Database for Annotation, Visualization, and Integrated Discovery (DAVID) [30,31] (Tables S2 and S3). Among the three GO sub-ontologies (biological process [BP], cellular component, and molecular function), we focused on BP to assess the underlying biological features. First, we extracted the GO Biological Process (GOBP) terms that were significantly enriched (p < 0.05) in each cell line. To further examine the regulatory mechanisms, the gene lists from the GOBP terms of each cell line were merged, resulting in 21 upregulated and 30 downregulated gene sets. Thereafter, each gene set was subjected to GO enrichment analysis (Figure 3). For the merged gene set comprising upregulated genes, the top-ranked GOBP terms were “regulation of transcription from RNA polymerase II promoter” and “positive regulation of transcription from RNA polymerase II promoter,” whereas the top GOBP terms for the merged gene set comprising downregulated genes included “signal transduction,” “positive regulation of transcription from RNA polymerase II promoter,” and “intracellular signal transduction” (Table S4).
In KEGG pathway enrichment analysis, we did not identify any significantly enriched pathways for the upregulated gene set of three cell lines; however, 12 genes were identified from significantly enriched metabolic pathways for the downregulated gene set of three cell lines (p < 0.05) (Figure 4). The top-ranked pathways for these downregulated genes included pathways of neurodegeneration—multiple diseases, pathways in cancer, dopaminergic synapse, axon guidance, lipid and atherosclerosis, Parkinson’s disease, and Huntington’s disease (Table S5).

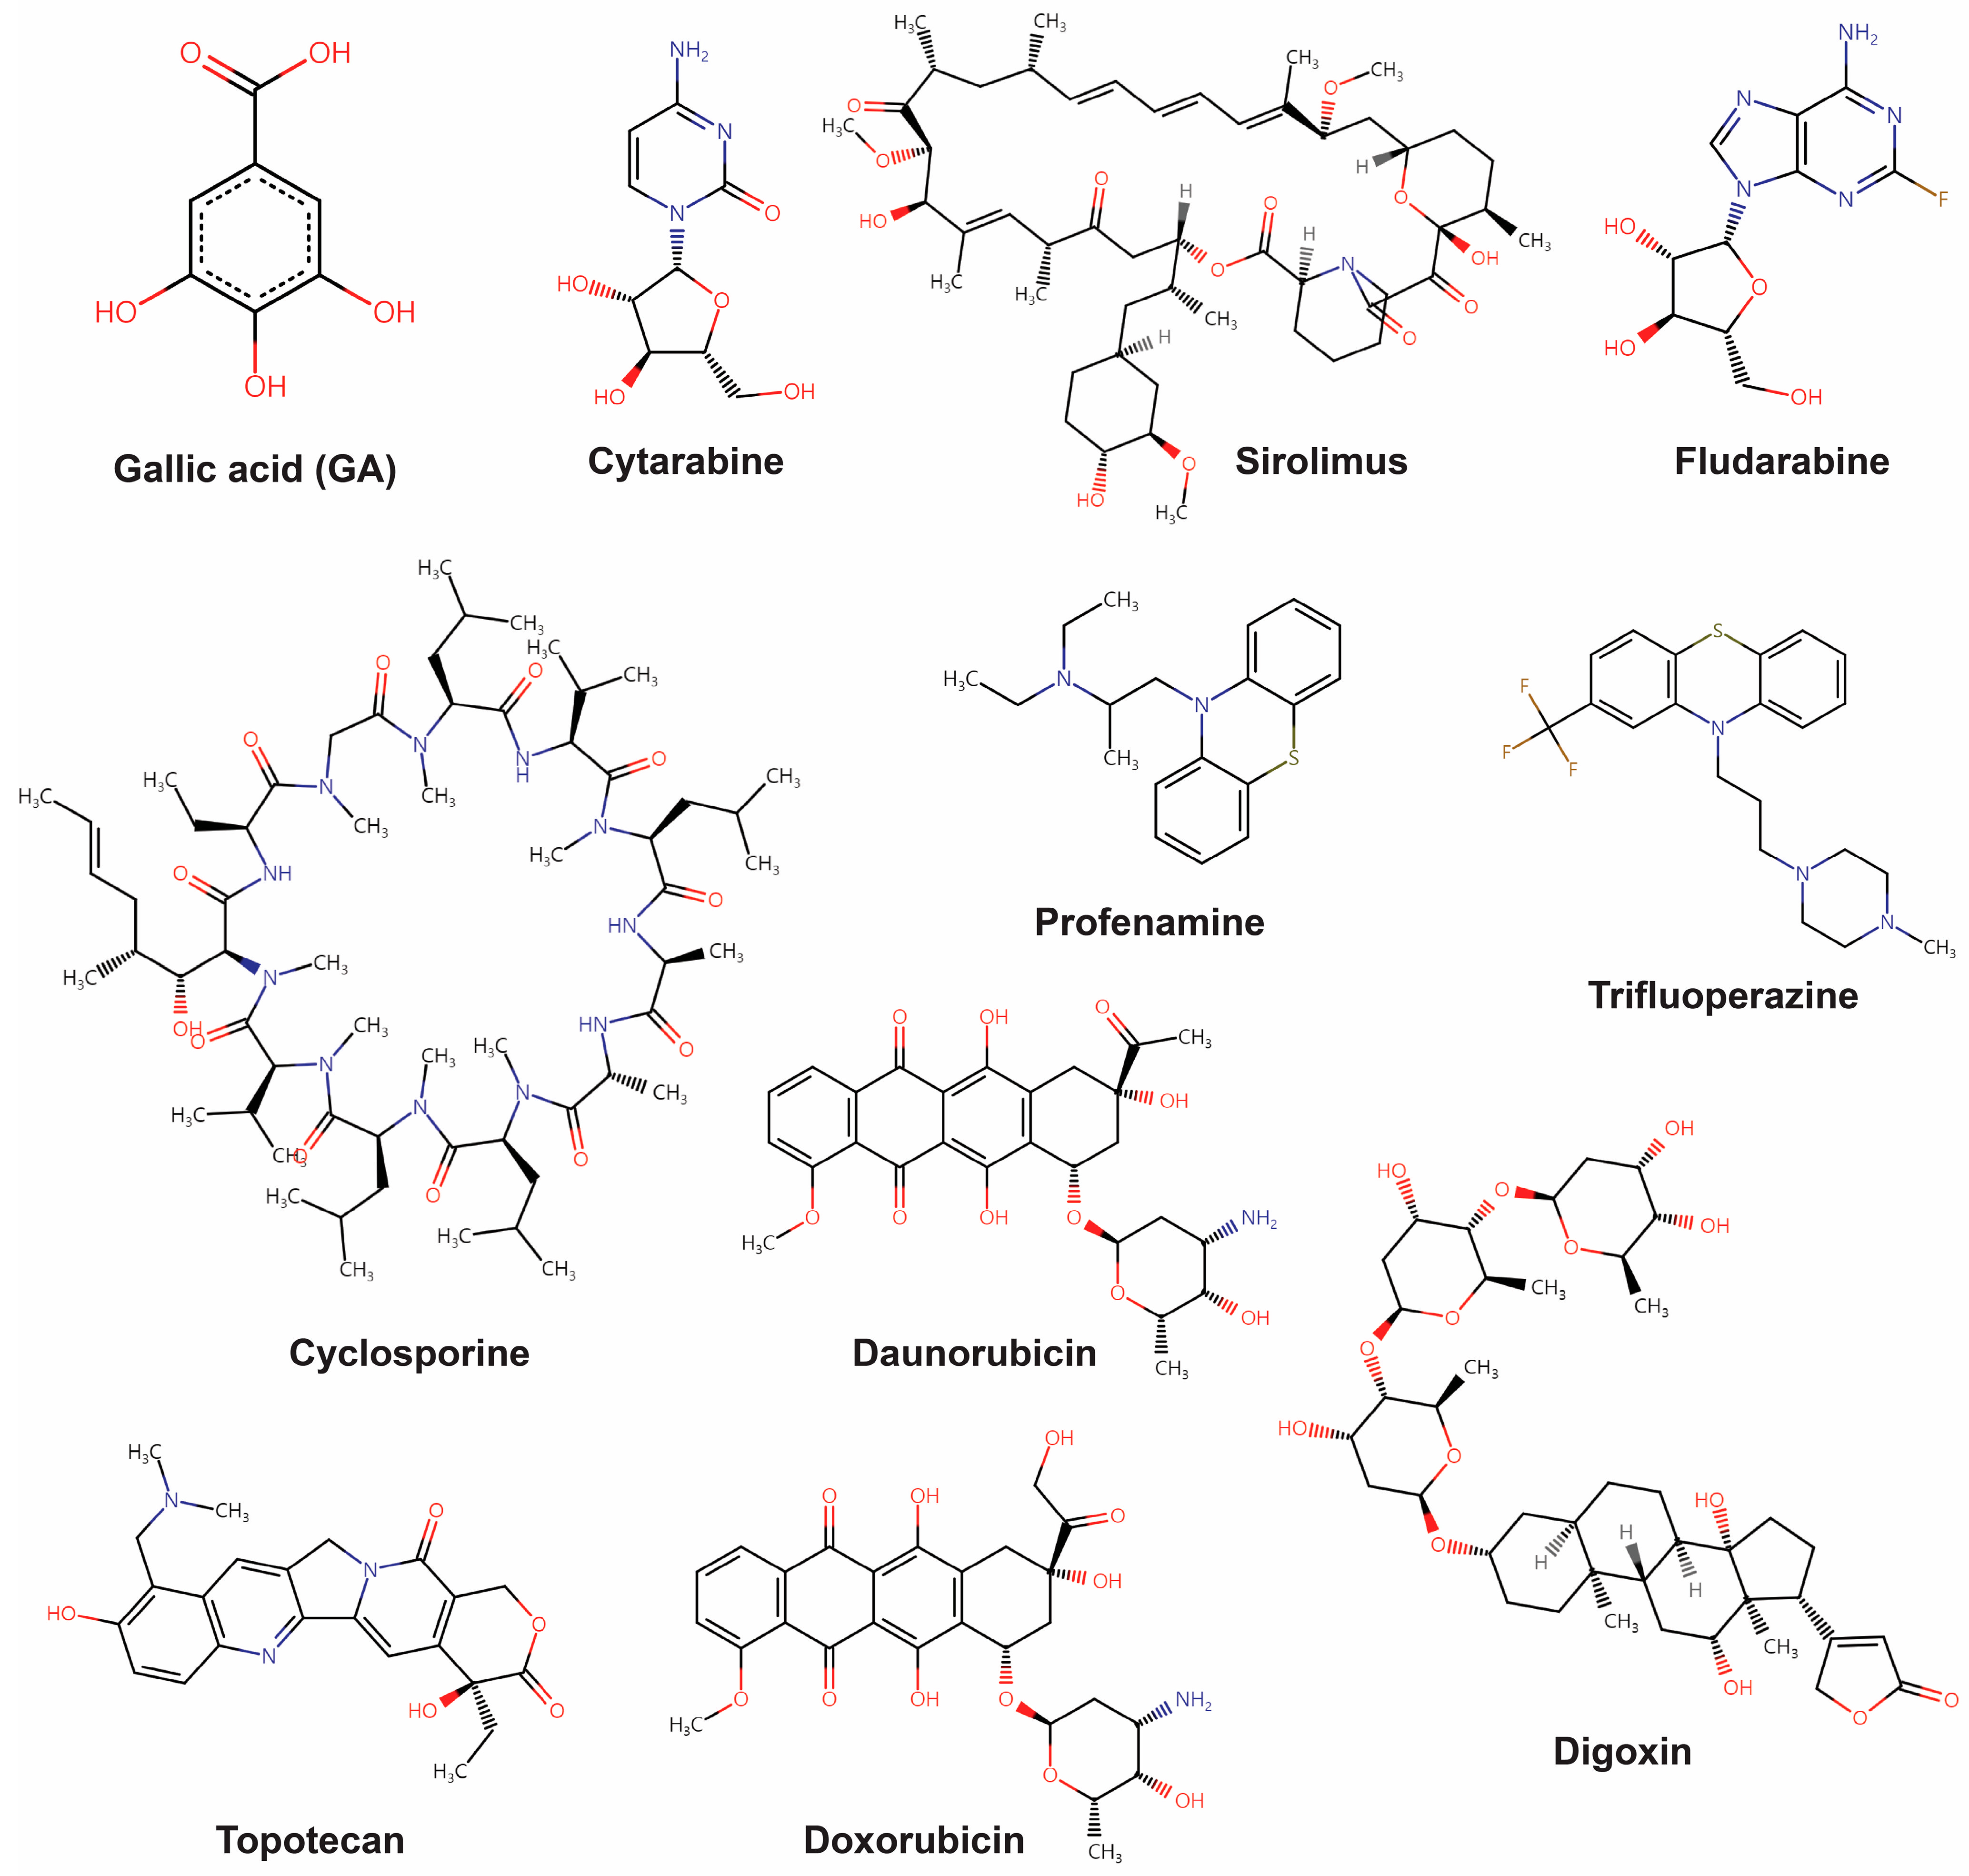
2.3. LINCS L1000 Data-Based Expression Pattern Analysis

To better understand the molecular pathways affected by GA, we used a computational drug screening platform to discover the potential target proteins that directly interact with GA. In our previous studies, we used a computational program to search for FDA-approved drugs with the highest similarity in GEP patterns [32]. Using this method, we compared the GEP changes induced by GA with those induced by the drugs in the LINCS L1000 library. Intergroup similarity was measured using the connectivity score method introduced by Zhang et al. [33]. Table 1 summarizes the top 10 drugs with the highest similarity based on the average Zhang score of the three cell lines, and their 2D structures are shown in Figure 5. We mapped the LINCS perturbagen IDs to the corresponding approved drug names using DrugBank IDs [34]. Because GA shares target proteins with these drugs due to their highly similar expression patterns, we also compiled the known target proteins of each drug (Table 1).
We focused on inhibitor drugs as they are comparatively widely available and easier to develop than activator drugs. We identified 19 antagonists and/or inhibitor proteins from DrugBank as the targets of the top 10 drugs (Table 1).
To elucidate the functions of the 19 target proteins, GO and KEGG pathway enrichment analyses were performed. The top-ranked GOBP terms (p < 0.05) were regulation of synaptic vesicle exocytosis, DNA replication, DNA topological change, response to drugs, and response to xenobiotic stimuli (Figure 6a and Table S6). KEGG pathway enrichment analysis (p < 0.05) indicated significant enrichment in the cAMP signaling, calcium signaling, neuroactive ligand-receptor interaction, and cGMP-PKG signaling pathways (Figure 6b and Table S7).

3. Discussion

In this study, we investigated the molecular mechanisms that GA may affect by conducting transcriptomic analysis based on the GEPs before and after GA treatment. We examined the GEP changes in three cancer cell lines before and after GA treatment using microarray analysis. Pathway enrichment analysis using DEGs revealed that GA downregulated the expression of genes related to neurodegenerative pathways, such as Parkinson’s and Huntington’s disease, as well as those associated with the nervous system, such as dopaminergic synapse and axon guidance.
However, this transcriptome-based pathway enrichment analysis mainly highlights the regulatory mechanisms at the pathway level, with limited information on precise mechanisms or the direct identification of inhibitory targets. To overcome these limitations, we adopted an alternative approach to compare the microarray experimental data of GA with that of the drugs in the LINCS L1000 database. This database offers information on the GEPs of various cell lines, which were induced by thousands of different perturbagens, including FDA-approved drugs with known action mechanisms. By comparing the GEP changes induced by GA with those induced by the drugs in the database, we identified the drugs showing similar GEP changes. A higher similarity indicated a higher likelihood that GA directly or indirectly targeted the known target proteins of the identified drugs.
In this study, we employed a computational program used in earlier studies to identify the drugs exhibiting similar GEP patterns. The highly accurate Zhang score, a connectivity score, was used to measure the similarity between the two GEP datasets [33]. The program allowed us to sort drugs in descending order of the Zhang score, enabling us to easily specify the top 10 drugs that induce the most similar changes in GEP as those triggered by GA. Interestingly, we observed that even with significant differences in molecular size, GA was able to induce changes in gene expression patterns similar to those induced by drugs. This may be due to the multitarget effects. However, there are many challenges in achieving a full understanding of the underlying mechanisms due to biological complexity.
Using the top 10 drug lists, we extracted drug-target protein interaction information from DrugBank [34] and identified the proteins that act as inhibitors. Overall, this approach proved to be a convenient bioinformatics tool for comparative analyses of multiple experimental groups to identify differences between them. By identifying the approved drugs with high similarity in GEP changes using LINCS L1000, we could specify the potentially shared targets of GA. Because this dataset covers most of the genes expressed in cells (widely expressed landmark genes that are directly measured as well as other genes that could be inferred), it effectively served as a useful analytical method for our study.
Using the gene list of the specified target proteins, GO and KEGG pathway enrichment analyses were performed. The results revealed the GOBP terms associated with the nervous system, such as regulation of synaptic vesicle exocytosis. In KEGG pathway analysis, cAMP signaling, calcium signaling, and neuroactive ligand–receptor interaction were among the selected pathways.
We considered these proteins as potential targets of GA and found that GA may directly or indirectly affect the related regulatory pathways of 10 drugs and their target proteins. For instance, cytarabine and fludarabine bind directly to DNA polymerase β and ribonucleoside-diphosphate reductase, respectively. GA is reported to directly bind to these proteins, thus exerting anti-diabetic effects [35]. Additionally, there is evidence suggesting that GA downregulates USP47, which is known to stabilize DNA polymerase β, potentially disabling base excision repair (BER) [36]. Also, GA has been reported to induce p53 activation in non-small-cell lung cancer (NSCLC) cells, leading to the suppression of cancer cell survival and exhibiting a tumor-suppressive effect [37]. In terms of the pathway-based approach, these findings suggest the possibility that GA may be involved in pathways associated with the potential target proteins. Sirolimus targets the serine/threonine-protein kinase: mammalian target of rapamycin (mTOR), and GA has been associated with the Akt/mTOR signaling pathway, demonstrating antileukemic efficacy in acute myeloid leukemia (AML) [38]. Cyclosporine directly binds calcineurin, inhibiting T cell activation by preventing nuclear factor of activated T cells (NF-AT) activation. It has been reported that GA may suppress cardiac hypertrophic remodeling and heart failure through inhibition of calcineurin and NF-AT in cardiac cells [39]. In a Parkinson’s disease model, GA exhibits neuroprotective effects through oxidative stress induction [40], with potential associations with muscarinic receptors implicated in oxidative stress regulation [41]. This finding suggests a possible connection between GA and muscarinic acetylcholine receptors, one of the target proteins of profenamine. Another known target protein of profenamine, NMDA glutamate receptors, may also be associated with GA in the context of glutamate-induced neurotoxicity and neuroprotective effects [42]. Trifluoperazine directly blocks dopamine D1, D2 receptors, and alpha-1A adrenergic receptors. In a mouse model, the antidepressant-like effect of GA is inhibited when treated with antagonists of dopamine D2 and alpha-1A adrenergic receptors, suggesting a potential connection with the dopaminergic and adrenergic pathways [43]. Trifluoperazine also targets calmodulin, and it has been reported that GA attenuates calcium-calmodulin-dependent kinase II-induced apoptosis in cardiac cells [44]. The known targets of daunorubicin, doxorubicin, and topotecan are DNA topoisomerases for their anti-tumor effects. GA has been reported to indirectly stabilize DNA topoisomerase I- and II-DNA complexes through hydrogen peroxide generation, inducing apoptosis [45]. Finally, digoxin is known to inhibit Na+, K+-ATPase, and a phytochemical study shows that Cuphea glutinosa, containing a high fraction of GA, inhibits Na+, K+-ATPase activity [46], suggesting a potential association between GA and Na+, K+-ATPase. To identify whether there are any interconnections between the target proteins, we performed the protein-protein interaction (PPI) analysis (Figure S1). While there seem to be certain connections between the target proteins, these connections appear to arise from the similarity within targets for a single drug, and there appears to be no distinct specialization in their interactions.
This suggests that our results using LINCS L1000 align with previous studies on GA, and support the idea of considering these proteins as potential direct targets. These findings highlight the potential of this transcriptome analysis method not only for GA but also for investigating the molecular mechanisms of various natural molecules. Nonetheless, since the results of this study are predicted using a computational program, further experimental validation is warranted.
While numerous studies have been conducted to explore phytochemicals as crucial sources in drug discovery, there have been relatively few investigations focusing on transcriptomic profile changes induced by phytochemicals. This study aims to propose a methodology for investigating natural compounds with multifaceted and comprehensive therapeutic effects, such as GA. GA, a polyphenol compound found in various plants, is renowned for its potent antioxidant and anti-inflammatory properties, contributing to therapeutic activities in cardiovascular diseases, cancer, neurodegenerative disorders, and aging [1]. Consequently, GA and its derivatives are often used as promising lead compounds for new drug development, contributing to drug modeling and medicinal chemistry research [47,48]. However, research on the mechanisms of GA has been limited due to its complexity. Recently, useful data sources, such as the LINCS database, became available for interpreting mechanisms of action, allowing us to conduct this study. The strategy proposed in this study is expected to be applicable to the investigation of the molecular mechanisms of these natural small compounds. Our study examines changes in transcriptome expression patterns, proposing potential targets for the action of GA. Based on these findings, future studies may clarify the regulatory mechanisms of GA or explore various phytochemicals, such as GA, using the methodological strategies employed in this study. Our findings may provide valuable clues not only for understanding the action mechanisms of phytochemicals but also for identifying potential side effects.

4. Materials and Methods

4.1. Materials

GA (CAS Registry No. 149-91-7; 3,4,5-trihydroxybenzoic acid) was purchased from Shaanxi Sciphar Natural Products Co., Ltd. (Shangluo, Shaanxi, China). The three cancer cell lines, namely lung carcinoma cells (A549), human prostate adenocarcinoma cells (PC3), and human breast carcinoma cells (MCF7), were purchased from the American Type Culture Collection (ATCC, Rockville, MD, USA).

4.2. Cell Culture

A549 and PC3 cells were cultured in RPMI-1640 supplemented with 10% fetal bovine serum (FBS) and 1% penicillin-streptomycin-glutamine. To culture PC3 cells, 1 mM sodium pyruvate and 10 mM 4-(2-hydroxyethyl)-1-piperazineethanesulfonic acid were additionally added to the media. MCF7 cells were cultured in Dulbecco’s modified Eagle’s medium supplemented with 10% FBS and 1% penicillin-streptomycin-glutamine. All cells were cultured at 37 °C in a 5% CO2 humidified atmosphere and incubated for 2 weeks after initial seeding for stabilization.

4.3. RNA Sample Preparation

GA was dissolved in 10 mM DMSO and stored at −80 °C. Each cell line was plated in six 60-mm dishes (three each for DMSO and GA treatments). The cell density was 1.3 × 10⁶ cells for A549, 1.496 × 10⁶ cells for PC3, and 8.45 × 10⁵ cells for MCF7. After 24 h, the cells were treated with 1000-fold diluted DMSO and GA, resulting in final concentrations of 0.1% for DMSO and 10 μM for GA. After 6 h of DMSO and GA treatment, RNA was extracted using the RNeasy Mini Kit (Qiagen, Hilden, Germany) according to the manufacturer’s instructions. The extracted RNAs were stored at −80 °C.

4.4. Microarray Data Analysis

Total RNA samples were sent to Macrogen (Seoul, Korea) for assessment using the Clariom™ S Assay, Human. The ND-2000 spectrophotometer (NanoDrop, Wilmington, NC, USA) was used to detect RNA purity, and the Agilent 2100 bioanalyzer (Agilent Technologies, Palo Alto, CA, USA) was used to detect RNA integrity.
For the Affymetrix whole-transcript (WT) expression array process, the GeneChip WT PLUS Reagent Kit (Affymetrix, Santa Clara, CA, USA) was used according to the manufacturer’s instructions. cDNA was synthesized using the GeneChip WT Amplification Kit (Affymetrix) according to the manufacturer’s instructions.
Thereafter, sense cDNA was fragmented and labeled with biotin using terminal deoxynucleotidyl transferase using the GeneChip WT Terminal Labeling Kit (Affymetrix). Approximately 5.5 μg of labeled DNA target was incubated at 45 °C for hybridization with the Affymetrix GeneChip Human Clariom S Array for 16 h. After washing and staining on the GeneChip Fluidics Station 450, the hybridized arrays were scanned on the GCS3000 Scanner (Affymetrix). The Affymetrix® GeneChip™ Command Console software was used to calculate the signal values.
Gene enrichment, pathway, and functional annotation analyses were performed to obtain a probe list using the DAVID functional annotation tool [30,31].

4.5. Identification of the Potential Target Proteins Using the LINCS L1000 Database

The LINCS L1000 database was used to screen the approved drugs that generate GEP changes similar to GA, among thousands of small molecules, including FDA-approved drugs in various cell lines at different time points and doses. The LINCS L1000 level 5 datasets that were used in this study are available in Gene Expression Omnibus (Accession number GSE92742, https://www.ncbi.nlm.nih.gov/geo/query/acc.cgi?acc=GSE92742, accessed on 18 January 2023). This dataset contains information on the GEPs of 978 landmark genes, collected from the L1000 assay [16]. The raw data obtained from LINCS L1000 were filtered based on cell type and gene expression. Note that the conditions selected for this step were similar to those for cell treatment at a dose of 10 μM GA for 6 h. FC was measured by dividing the mean expression under GA by that under DMSO for each cell line. The obtained FC was normalized using log2 and used to compare with that of the 978 landmark GEPs in the LINCS database.
A computational program that was used in one of our previous studies was used to calculate the similarity in GEP patterns between GA and the approved drugs using connectivity scores and identify the approved drugs that yielded changes most similar to those induced by GA [32]. Briefly, DrugBank was used to obtain the approved drug list from the LINCS database, and connectivity scores (the Zhang score) were used to identify the approved drugs that induce GEP changes similar to those induced by GA. As a comparative method, Lamb et al. developed CMap16 by creating a database using the GEP patterns of known chemicals and generating ranks for the test DEGs based on their expression level [15]. Subsequently, Zhang et al., introduced an improved approach to compute the connectivity scores, offering a more simplified and precise method for comparing GEP changes between groups [33]. In this method, a query signature (GA treatment) is compared to each of the drug-gene expression profiles ranked in the LINCS L1000 database based on their respective scores. The score ranges from −1 (representing the highest negative correlation) to 1 (representing the highest positive correlation), implying that a higher score indicates greater similarity. Target proteins were restricted to antagonists or inhibitors with pharmacological activity. All program scripts used in this computational software can be found in the online repository (https://bitbucket.org/krictai/predms/src/master/, accessed on 19 February 2023).

5. Conclusions

In this study, we investigated the underlying mechanisms by which GA affects cells using transcriptome-based comparative analysis. Through transcriptome analysis, potential target proteins for GA were identified. We used the LINCS L1000 database to compare the changes in GEPs induced by GA with those induced by approved drugs and identify the drugs with similar GEPs. This was crucial between the GEPs of approved drugs, and GA may indicate a similar mechanism of action. Nineteen potential target proteins were obtained, consistent with the findings of previous studies, providing further support and validation. In particular, our study indicates the direct binding of GA to DNA polymerase β and ribonucleoside-diphosphate reductase, both of which were among the top target proteins. Consequently, it is probable that GA may play a role in base excision DNA repair pathways and cell survival within p53-dependent cell survival pathways, as discussed earlier. Our findings highlight the potential of transcriptome-based comparative analysis in elucidating the molecular mechanisms of small natural compounds. To address the complex biological challenges of small compounds such as GA, a genome-wide approach using transcriptome profiles can be a powerful method to gain a comprehensive view of their multifaceted actions. The availability of valuable data sources, such as the LINCS database, has recently enabled such a study, proposing a new strategy that may be applicable to the investigation of the molecular mechanisms of these natural small compounds. Nevertheless, additional studies are warranted to comprehensively elucidate the specific targets and mechanisms of GA. This can help assess the action mechanisms of other natural compounds with therapeutic potential.

Supplementary Materials

The following supporting information can be downloaded at: https://www.mdpi.com/article/10.3390/ijms25042303/s1.

Author Contributions

Conceptualization, G.J., S.H.M. and J.Y.R.; data curation, J.K. and B.K.K.; formal analysis, J.K. and B.K.K.; funding acquisition, S.H.M. and J.Y.R.; investigation, J.K.; methodology, J.K. and B.K.K.; project administration, G.J., S.H.M. and J.Y.R.; resources, J.K. and B.K.K.; visualization, J.K.; supervision, J.Y.R.; validation, J.K. and B.K.K.; writing—original draft, J.K.; writing—review and editing, J.K. and B.K.K.; All authors have read and agreed to the published version of the manuscript.

Funding

This research was funded by the National Research Foundation of Korea (NRF) grant funded by the Korean Government (MSIT; grant no. RS-2023-00240248), Advanced Technology Center Plus (ATC+; grant no. 20017936; Development of growth factors and antibody drugs using plant cell-based platform technology and global sales expansion of fragrance materials) funded by the Ministry of Trade, Industry and Energy (MOTIE, Korea), and the research and development project “Construction, design, and commercialization of plant cell culture/production biofoundry system based on synthetic biology” funded by the Incheon Techno Park of Incheon Metropolitan City.

Institutional Review Board Statement

Not applicable.

Informed Consent Statement

Not applicable.

Data Availability Statement

All related data are present within the manuscript.

Conflicts of Interest

The authors declare no conflicts of interest. Jiyeon Kim and Sang Hyun Moh were employed by the company BIO-FD&C Co., Ltd. The remaining authors declare that the research was conducted in the absence of any commercial or financial relationships that could be construed as a potential conflict of interest. The company had no role in the design of the study, in the collection, analyses, or interpretation of data, in the writing of the manuscript, or in the decision to publish the results.

References

  1. Bai, J.; Zhang, Y.; Tang, C.; Hou, Y.; Ai, X.; Chen, X.; Zhang, Y.; Wang, X.; Meng, X. Gallic acid: Pharmacological activities and molecular mechanisms involved in inflammation-related diseases. Biomed. Pharmacother. 2021, 133, 110985. [Google Scholar] [CrossRef]
  2. Moradi, A.; Abolfathi, M.; Javadian, M.; Heidarian, E.; Roshanmehr, H.; Khaledi, M.; Nouri, A. Gallic acid exerts nephroprotective, anti-oxidative stress, and anti-inflammatory effects against diclofenac-induced renal injury in male rats. Arch. Med. Sci. 2021, 52, 380–388. [Google Scholar] [CrossRef]
  3. Nabavi, S.F.; Habtemariam, S.; Di Lorenzo, A.; Sureda, A.; Khanjani, S.; Nabavi, S.M.; Daglia, M. Post-stroke depression modulation and in vivo antioxidant activity of gallic acid and its synthetic derivatives in a murine model system. Nutrients 2016, 8, 248. [Google Scholar] [CrossRef]
  4. Variya, B.C.; Bakrania, A.K.; Patel, S.S. Antidiabetic potential of gallic acid from Emblica officinalis: Improved glucose transporters and insulin sensitivity through PPAR-γ and Akt signaling. Phytomedicine 2020, 73, 152906. [Google Scholar] [CrossRef]
  5. Ashrafizadeh, M.; Zarrabi, A.; Mirzaei, S.; Hashemi, F.; Samarghandian, S.; Zabolian, A.; Hushmandi, K.; Ang, H.L.; Sethi, G.; Kumar, A.P.; et al. Gallic acid for cancer therapy: Molecular mechanisms and boosting efficacy by nanoscopical delivery. Food Chem. Toxicol. 2021, 157, 112576. [Google Scholar] [CrossRef]
  6. Kang, N.; Lee, J.H.; Lee, W.; Ko, J.Y.; Kim, E.A.; Kim, J.S.; Heu, M.S.; Kim, G.H.; Jeon, Y.J. Gallic acid isolated from Spirogyra sp. improves cardiovascular disease through a vasorelaxant and antihypertensive effect. Environ. Toxicol. Pharmacol. 2015, 39, 764–772. [Google Scholar] [CrossRef] [PubMed]
  7. Daglia, M.; Di Lorenzo, A.; Nabavi, S.F.; Talas, Z.S.; Nabavi, S.M. Polyphenols: Well beyond the antioxidant capacity: Gallic acid and related compounds as neuroprotective agents: You are what you eat! Curr. Pharm. Biotechnol. 2014, 15, 362–372. [Google Scholar] [CrossRef] [PubMed]
  8. Wang, K.; Zhu, X.; Zhang, K.; Zhu, L.; Zhou, F. Investigation of gallic acid induced anticancer effect in human breast carcinoma MCF-7 cells. J. Biochem. Mol. Toxicol. 2014, 28, 387–393. [Google Scholar] [CrossRef] [PubMed]
  9. Phan, A.N.; Hua, T.N.; Kim, M.K.; Vo, V.T.; Choi, J.W.; Kim, H.W.; Rho, J.K.; Kim, K.W.; Jeong, Y. Gallic acid inhibition of Src-Stat3 signaling overcomes acquired resistance to EGF receptor tyrosine kinase inhibitors in advanced non-small cell lung cancer. Oncotarget 2016, 7, 54702–54713. [Google Scholar] [CrossRef] [PubMed]
  10. Lima, K.G.; Krause, G.C.; Schuster, A.D.; Catarina, A.V.; de Souza Basso, B.; de Mesquita, F.C.; Pedrazza, L.; Marczak, E.S.; Martha, B.A.; Nunes, F.B.; et al. Gallic acid reduces cell growth by induction of apoptosis and reduction of IL-8 in HepG2 cells. Biomed. Pharmacother. 2016, 84, 1282–1290. [Google Scholar] [CrossRef] [PubMed]
  11. Badhani, B.; Sharma, N.; Kakkar, R. Gallic acid: A versatile antioxidant with promising therapeutic and industrial applications. RSC Adv. 2015, 5, 27540–27557. [Google Scholar] [CrossRef]
  12. Sun, G.; Zhang, S.; Xie, Y.; Zhang, Z.; Zhao, W. Gallic acid as a selective anticancer agent that induces apoptosis in SMMC-7721 human hepatocellular carcinoma cells. Oncol. Lett. 2016, 11, 150–158. [Google Scholar] [CrossRef]
  13. Hrdlickova, R.; Toloue, M.; Tian, B. RNA-Seq methods for transcriptome analysis. WIREs RNA 2017, 8, e1364. [Google Scholar] [CrossRef] [PubMed]
  14. Zhang, Z.H.; Jhaveri, D.J.; Marshall, V.M.; Bauer, D.C.; Edson, J.; Narayanan, R.K. A comparative study of techniques for differential expression analysis on RNA-Seq data. PLoS ONE 2014, 9, e103207. [Google Scholar] [CrossRef] [PubMed]
  15. Lamb, J.; Crawford, E.D.; Peck, D.; Modell, J.W.; Blat, I.C.; Wrobel, M.J.; Lerner, J.; Brunet, J.P.; Subramanian, A.; Ross, K.N.; et al. The Connectivity Map: Using gene-expression signatures to connect small molecules, genes, and disease. Science 2006, 313, 1929–1935. [Google Scholar] [CrossRef]
  16. Subramanian, A.; Narayan, R.; Corsello, S.M.; Peck, D.D.; Natoli, T.E.; Lu, X.; Gould, J.; Davis, J.F.; Tubelli, A.A.; Asiedu, J.K.; et al. A next generation connectivity map: L1000 platform and the first 1,000,000 profiles. Cell 2017, 171, 1437–1452.e17. [Google Scholar] [CrossRef] [PubMed]
  17. Ferguson, L.; Ozburn, A.; Ponomarev, I. Genome-wide expression profiles drive discovery of novel compounds that reduce binge drinking in mice. Neuropsychopharmacology 2018, 43, 1257–1266. [Google Scholar] [CrossRef]
  18. Coelho, E.D.; Arrais, J.P.; Oliveira, J.L. Computational discovery of putative leads for drug repositioning through drug-target interaction prediction. PLoS Comput. Biol. 2016, 12, e1005219. [Google Scholar] [CrossRef]
  19. Wang, K.; Sun, J.; Zhou, S.; Wan, C.; Qin, S.; Li, C.; He, L.; Yang, L. Prediction of drug-target interactions for drug repositioning only based on genomic expression similarity. PLoS Comput. Biol. 2013, 9, e1003315. [Google Scholar] [CrossRef]
  20. Luo, Y.; Zhao, X.; Zhou, J.; Yang, J.; Zhang, Y.; Kuang, W.; Peng, J.; Chen, L.; Zeng, J. A network integration approach for drug-target interaction prediction and computational drug repositioning from heterogeneous information. Nat. Commun. 2017, 8, 573. [Google Scholar] [CrossRef]
  21. Lim, G.; Lim, C.J.; Lee, J.H.; Lee, B.H.; Ryu, J.Y.; Oh, K.S. Identification of new target proteins of a Urotensin-II receptor antagonist using transcriptome-based drug repositioning approach. Sci. Rep. 2021, 11, 17138. [Google Scholar] [CrossRef] [PubMed]
  22. Li, T.; Tong, W.; Roberts, R.; Liu, Z.; Thakkar, S. Deep learning on high-throughput transcriptomics to predict drug-induced liver injury. Front. Bioeng. Biotechnol. 2020, 8, 562677. [Google Scholar] [CrossRef] [PubMed]
  23. Ashburner, M.; Ball, C.A.; Blake, J.A.; Botstein, D.; Butler, H.; Cherry, J.M.; Davis, A.P.; Dolinski, K.; Dwight, S.S.; Eppig, J.T.; et al. Gene ontology: Tool for the unification of biology. Nat. Genet. 2000, 25, 25–29. [Google Scholar] [CrossRef] [PubMed]
  24. Kanehisa, M.; Goto, S. KEGG: Kyoto encyclopedia of genes and genomes. Nucleic Acids Res. 2000, 28, 27–30. [Google Scholar] [CrossRef] [PubMed]
  25. Guo, Q.; Wang, S.H.; Ji, Y.M.; Tong, S.; Li, D.; Ding, X.C.; Wu, C.Y. The roles and mechanisms of TRAT1 in the progression of non-small cell lung cancer. Curr. Med. Sci. 2022, 42, 1186–1200. [Google Scholar] [CrossRef]
  26. Nozawa, R.S.; Nagao, K.; Masuda, H.T.; Iwasaki, O.; Hirota, T.; Nozaki, N.; Kimura, H.; Obuse, C. Human POGZ modulates dissociation of HP1alpha from mitotic chromosome arms through Aurora B activation. Nat. Cell Biol. 2010, 12, 719–727. [Google Scholar] [CrossRef]
  27. Li, N.; Mruk, D.D.; Tang, E.I.; Lee, W.M.; Wong, C.K.; Cheng, C.Y. Formin 1 regulates microtubule and F-Actin organization to support spermatid transport during spermatogenesis in the rat testis. Endocrinology 2016, 157, 2894–2908. [Google Scholar] [CrossRef]
  28. Heath, J.; Cheyou, E.S.; Findlay, S.; Luo, V.M.; Carpio, E.P.; Lee, J.; Djerir, B.; Chen, X.; Morin, T.; Lebeau, B.; et al. POGZ promotes homology-directed DNA repair in an HP1-dependent manner. EMBO Rep. 2022, 23, e51041. [Google Scholar] [CrossRef]
  29. Labat-de-Hoz, L.; Alonso, M.A. Formins in human disease. Cells 2021, 10, 2554. [Google Scholar] [CrossRef]
  30. Huang, D.W.; Sherman, B.T.; Lempicki, R.A. Systematic and integrative analysis of large gene lists using DAVID bioinformatics resources. Nat. Protoc. 2009, 4, 44–57. [Google Scholar] [CrossRef]
  31. Huang, D.W.; Sherman, B.T.; Lempicki, R.A. Bioinformatics enrichment tools: Paths toward the comprehensive functional analysis of large gene lists. Nucleic Acids Res. 2009, 37, 1–13. [Google Scholar] [CrossRef]
  32. Ryu, J.Y.; Lee, J.H.; Lee, B.H.; Song, J.S.; Ahn, S.; Oh, K.S. PredMS: A random forest model for predicting metabolic stability of drug candidates in human liver microsomes. Bioinformatics 2022, 38, 364–368. [Google Scholar] [CrossRef]
  33. Zhang, S.D.; Gant, T.W. A simple and robust method for connecting small-molecule drugs using gene-expression signatures. BMC Bioinformatics 2008, 9, 258. [Google Scholar] [CrossRef]
  34. Wishart, D.S.; Feunang, Y.D.; Guo, A.C.; Lo, E.J.; Marcu, A.; Grant, J.R.; Sajed, T.; Johnson, D.; Li, C.; Sayeeda, Z.; et al. DrugBank 5.0: A major update to the DrugBank database for 2018. Nucleic Acids Res. 2018, 46, D1074–D1082. [Google Scholar] [CrossRef]
  35. Fayaz, S.M.; Suvanish Kumar, V.S.; Rajanikant, K.G. Finding needles in a haystack: Application of network analysis and target enrichment studies for the identification of potential anti-diabetic phytochemicals. PLoS ONE 2014, 9, e112911. [Google Scholar] [CrossRef]
  36. Chang, T.-L.; Chiang, H.-Y.; Shen, J.-Y.; Lin, S.-W.; Tsai, P.-J. Phenolic compounds stage an interplay between the ubiquitin–proteasome system and ubiquitin signal autophagic degradation for the ubiquitin-based cancer chemoprevention. J. Funct. Foods 2015, 17, 857–871. [Google Scholar] [CrossRef]
  37. Kang, D.Y.; Sp, N.; Jo, E.S.; Rugamba, A.; Hong, D.Y.; Lee, H.G.; Yoo, J.-S.; Liu, Q.; Jang, K.-J.; Yang, Y.M. The inhibitory mechanisms of tumor PD-L1 expression by natural bioactive gallic acid in non-small-cell lung cancer (NSCLC) cells. Cancers 2020, 12, 727. [Google Scholar] [CrossRef]
  38. Gu, R.; Zhang, M.; Meng, H.; Xu, D.; Xie, Y. Gallic acid targets acute myeloid leukemia via Akt/mTOR-dependent mitochondrial respiration inhibition. Biomed. Pharmacother. 2018, 105, 491–497. [Google Scholar] [CrossRef] [PubMed]
  39. Yan, X.; Zhang, Y.L.; Zhang, L.; Zou, L.X.; Chen, C.; Liu, Y.; Xia, Y.L.; Li, H.H. Gallic acid suppresses cardiac hypertrophic remodeling and heart failure. Mol. Nutr. Food Res. 2019, 63, e1800807. [Google Scholar] [CrossRef] [PubMed]
  40. Mansouri, M.T.; Farbood, Y.; Sameri, M.J.; Sarkaki, A.; Naghizadeh, B.; Rafeirad, M. Neuroprotective effects of oral gallic acid against oxidative stress induced by 6-hydroxydopamine in rats. Food Chem. 2013, 138, 1028–1033. [Google Scholar] [CrossRef]
  41. Urrunaga, N.H.; Jadeja, R.N.; Rachakonda, V.; Ahmad, D.; McLean, L.P.; Cheng, K.; Shah, V.; Twaddell, W.S.; Raufman, J.P.; Khurana, S. M1 muscarinic receptors modify oxidative stress response to acetaminophen-induced acute liver injury. Free Radic. Biol. Med. 2015, 78, 66–81. [Google Scholar] [CrossRef]
  42. Maya, S.; Prakash, T.; Madhu, K. Assessment of neuroprotective effects of gallic acid against glutamate-induced neurotoxicity in primary rat cortex neuronal culture. Neurochem. Int. 2018, 121, 50–58. [Google Scholar] [CrossRef] [PubMed]
  43. Can, Ö.D.; Turan, N.; Demir Özkay, Ü.; Öztürk, Y. Antidepressant-like effect of gallic acid in mice: Dual involvement of serotonergic and catecholaminergic systems. Life Sci. 2017, 190, 110–117. [Google Scholar] [CrossRef]
  44. Jin, L.; Piao, Z.H.; Liu, C.P.; Sun, S.; Liu, B.; Kim, G.R.; Choi, S.Y.; Ryu, Y.; Kee, H.J.; Jeong, M.H. Gallic acid attenuates calcium calmodulin-dependent kinase II-induced apoptosis in spontaneously hypertensive rats. J. Cell. Mol. Med. 2018, 22, 1517–1526. [Google Scholar] [CrossRef] [PubMed]
  45. López-Lázaro, M.; Calderón-Montaño, J.M.; Burgos-Morón, E.; Austin, C.A. Green tea constituents (-)-epigallocatechin-3-gallate (EGCG) and gallic acid induce topoisomerase I- and topoisomerase II-DNA complexes in cells mediated by pyrogallol-induced hydrogen peroxide. Mutagenesis 2011, 26, 489–498. [Google Scholar] [CrossRef] [PubMed]
  46. Zago, A.M.; Carvalho, F.B.; Gutierres, J.M.; Bohnert, C.; Fernandes, M.D.C.; Morandini, L.M.; Coelho, H.S.; Fogaça, A.O.; Andrade, C.M.; Mostardeiro, M.A.; et al. A phytochemical study of the Cuphea glutinosa from Southern Brazil: Na+, K+-ATPase activity inhibition and antioxidant properties. Nat. Prod. Res. 2019, 33, 3426–3431. [Google Scholar] [CrossRef]
  47. Sherin, L.; Sohail, A.; Shujaat, S. Time-dependent AI-Modeling of the anticancer efficacy of synthesized gallic acid analogues. Comput. Biol. Chem. 2019, 79, 137–146. [Google Scholar] [CrossRef]
  48. AL Zahrani, N.A.; El-Shishtawy, R.M.; Asiri, A.M. Recent developments of gallic acid derivatives and their hybrids in medicinal chemistry: A review. Eur. J. Med. Chem. 2020, 204, 112609. [Google Scholar] [CrossRef]
Figure 1. Overall study scheme (a) gallic acid (GA) or dimethyl sulfoxide (DMSO) was used to treat three cell lines for sample preparation. (b) Transcriptome profiles of each cell line were obtained through microarray analysis, and the fold change was calculated to identify differentially expressed genes (DEGs). (c) DEGs were listed for each cell line, and commonly expressed genes in the three cell lines were identified. (d) For DEGs, Gene Ontology (GO) and Kyoto Encyclopedia of Genes and Genomes (KEGG) pathway enrichment analyses were conducted. (e) The gene expression profile (GEP) changes were compared with those of FDA-approved drugs in LINCS L1000 by calculating the average connectivity scores (Zhang score) using computational software. The higher the score, the greater the similarity in GEPs. The known target proteins of the top 10 drugs were identified for further analysis.
Ijms 25 02303 g001
Figure 2. Venn diagrams for the (a) upregulated and (b) downregulated differentially expressed genes (DEGs) in the three cell lines (A549, PC3, and MCF7). Overlapping regions represent DEGs shared in all three groups. The cutoff for statistically significant DEGs was fold change ≥ 1.5 and p-value < 0.05. The Venn diagrams were created using the UGent website (https://bioinformatics.psb.ugent.be/webtools/Venn/, accessed on 20 March 2023).
Ijms 25 02303 g002
Figure 3. Gene Ontology Biological Process (GOBP) enrichment analysis results of the merged gene sets. Red bars reflect the results of the upregulated gene set, and blue bars represent the results of the downregulated gene set.
Ijms 25 02303 g003
Figure 4. Kyoto Encyclopedia of Genes and Genomes (KEGG) pathway enrichment analysis results of the merged gene set. Blue bars represent the results of the downregulated gene set.
Ijms 25 02303 g004
Figure 5. Structures of GA and the top 10 drugs.
Ijms 25 02303 g005
Figure 6. Results of the enriched (a) GOBP terms and (b) KEGG pathways of the potential target genes. The red bars represent the results of the upregulated gene set.
Ijms 25 02303 g006
Table 1. Top 10 drug lists from the LINCS L1000 dataset with the most similar GEP patterns.
Perturbagen IDDrug NameMean of the Zhang ScoreTargets
Gene SymbolUniProt IDName of the Target Proteins
1BRD-K33106058_DB00987Cytarabine0.402339POLBP06746DNA polymerase beta
2BRD-K89626439_DB00877Sirolimus (rapamycin)0.396491MTORP42345Serine/threonine-protein kinase mTOR
3BRD-K72238567_DB01073Fludarabine0.20117POLA1, RRM1P09884, P23921DNA polymerase alpha catalytic subunit
Ribonucleoside-diphosphate reductase large subunit
4BRD-A38030642_DB00091Cyclosporine0.192982PPP3R2, PPIAQ96LZ3, P62937Calcineurin subunit B type 2
Peptidyl-prolyl cis-trans isomerase A
5BRD-A16311756_DB00392Profenamine0.166082CHRM1, CHRM2, GRIN3AP11229, P08172, Q8TCU5Muscarinic acetylcholine receptor M1
Muscarinic acetylcholine receptor M2
Glutamate receptor ionotropic, NMDA 3A
6BRD-K89732114_DB00831Trifluoperazine0.153216DRD2, CALY, ADRA1A, CALM, S100A4P14416, Q9NYX4, P35348, P0DP23, P26447Dopamine D2 receptor
Neuron-specific vesicular protein calcyon
Alpha-1A adrenergic receptor
Calmodulin
Protein S100-A4
7BRD-K43389675_DB00694Daunorubicin0.145029TOP2A, TOP2BP11388, Q02880DNA topoisomerase 2-alpha
DNA topoisomerase 2-beta
8BRD-K23478508_DB00390Digoxin0.138012ATP1A1P05023Sodium/potassium-transporting ATPase subunit alpha-1
9BRD-A59985574_DB01030Topotecan0.127485TOP1, TOP1MTP11387, Q969P6DNA topoisomerase 1
DNA topoisomerase I, mitochondrial
10BRD-K04548931_DB00997Doxorubicin0.100585TOP1, TOP2A, TOP2BP11387, P11388, Q02880DNA topoisomerase 1
DNA topoisomerase 2-alpha
DNA topoisomerase 2-beta
The Zhang score (connectivity score) was used as a measure of similarity. A higher score indicates greater similarity. Target proteins were restricted to antagonists or inhibitors with pharmacological activity.
Disclaimer/Publisher’s Note: The statements, opinions and data contained in all publications are solely those of the individual author(s) and contributor(s) and not of MDPI and/or the editor(s). MDPI and/or the editor(s) disclaim responsibility for any injury to people or property resulting from any ideas, methods, instructions or products referred to in the content.

