
Transcriptomic and Metabolomic Analyses Reveal the Role of Phenylalanine Metabolism in the Maize Response to Stalk Rot Caused by Fusarium proliferatum


 and
and 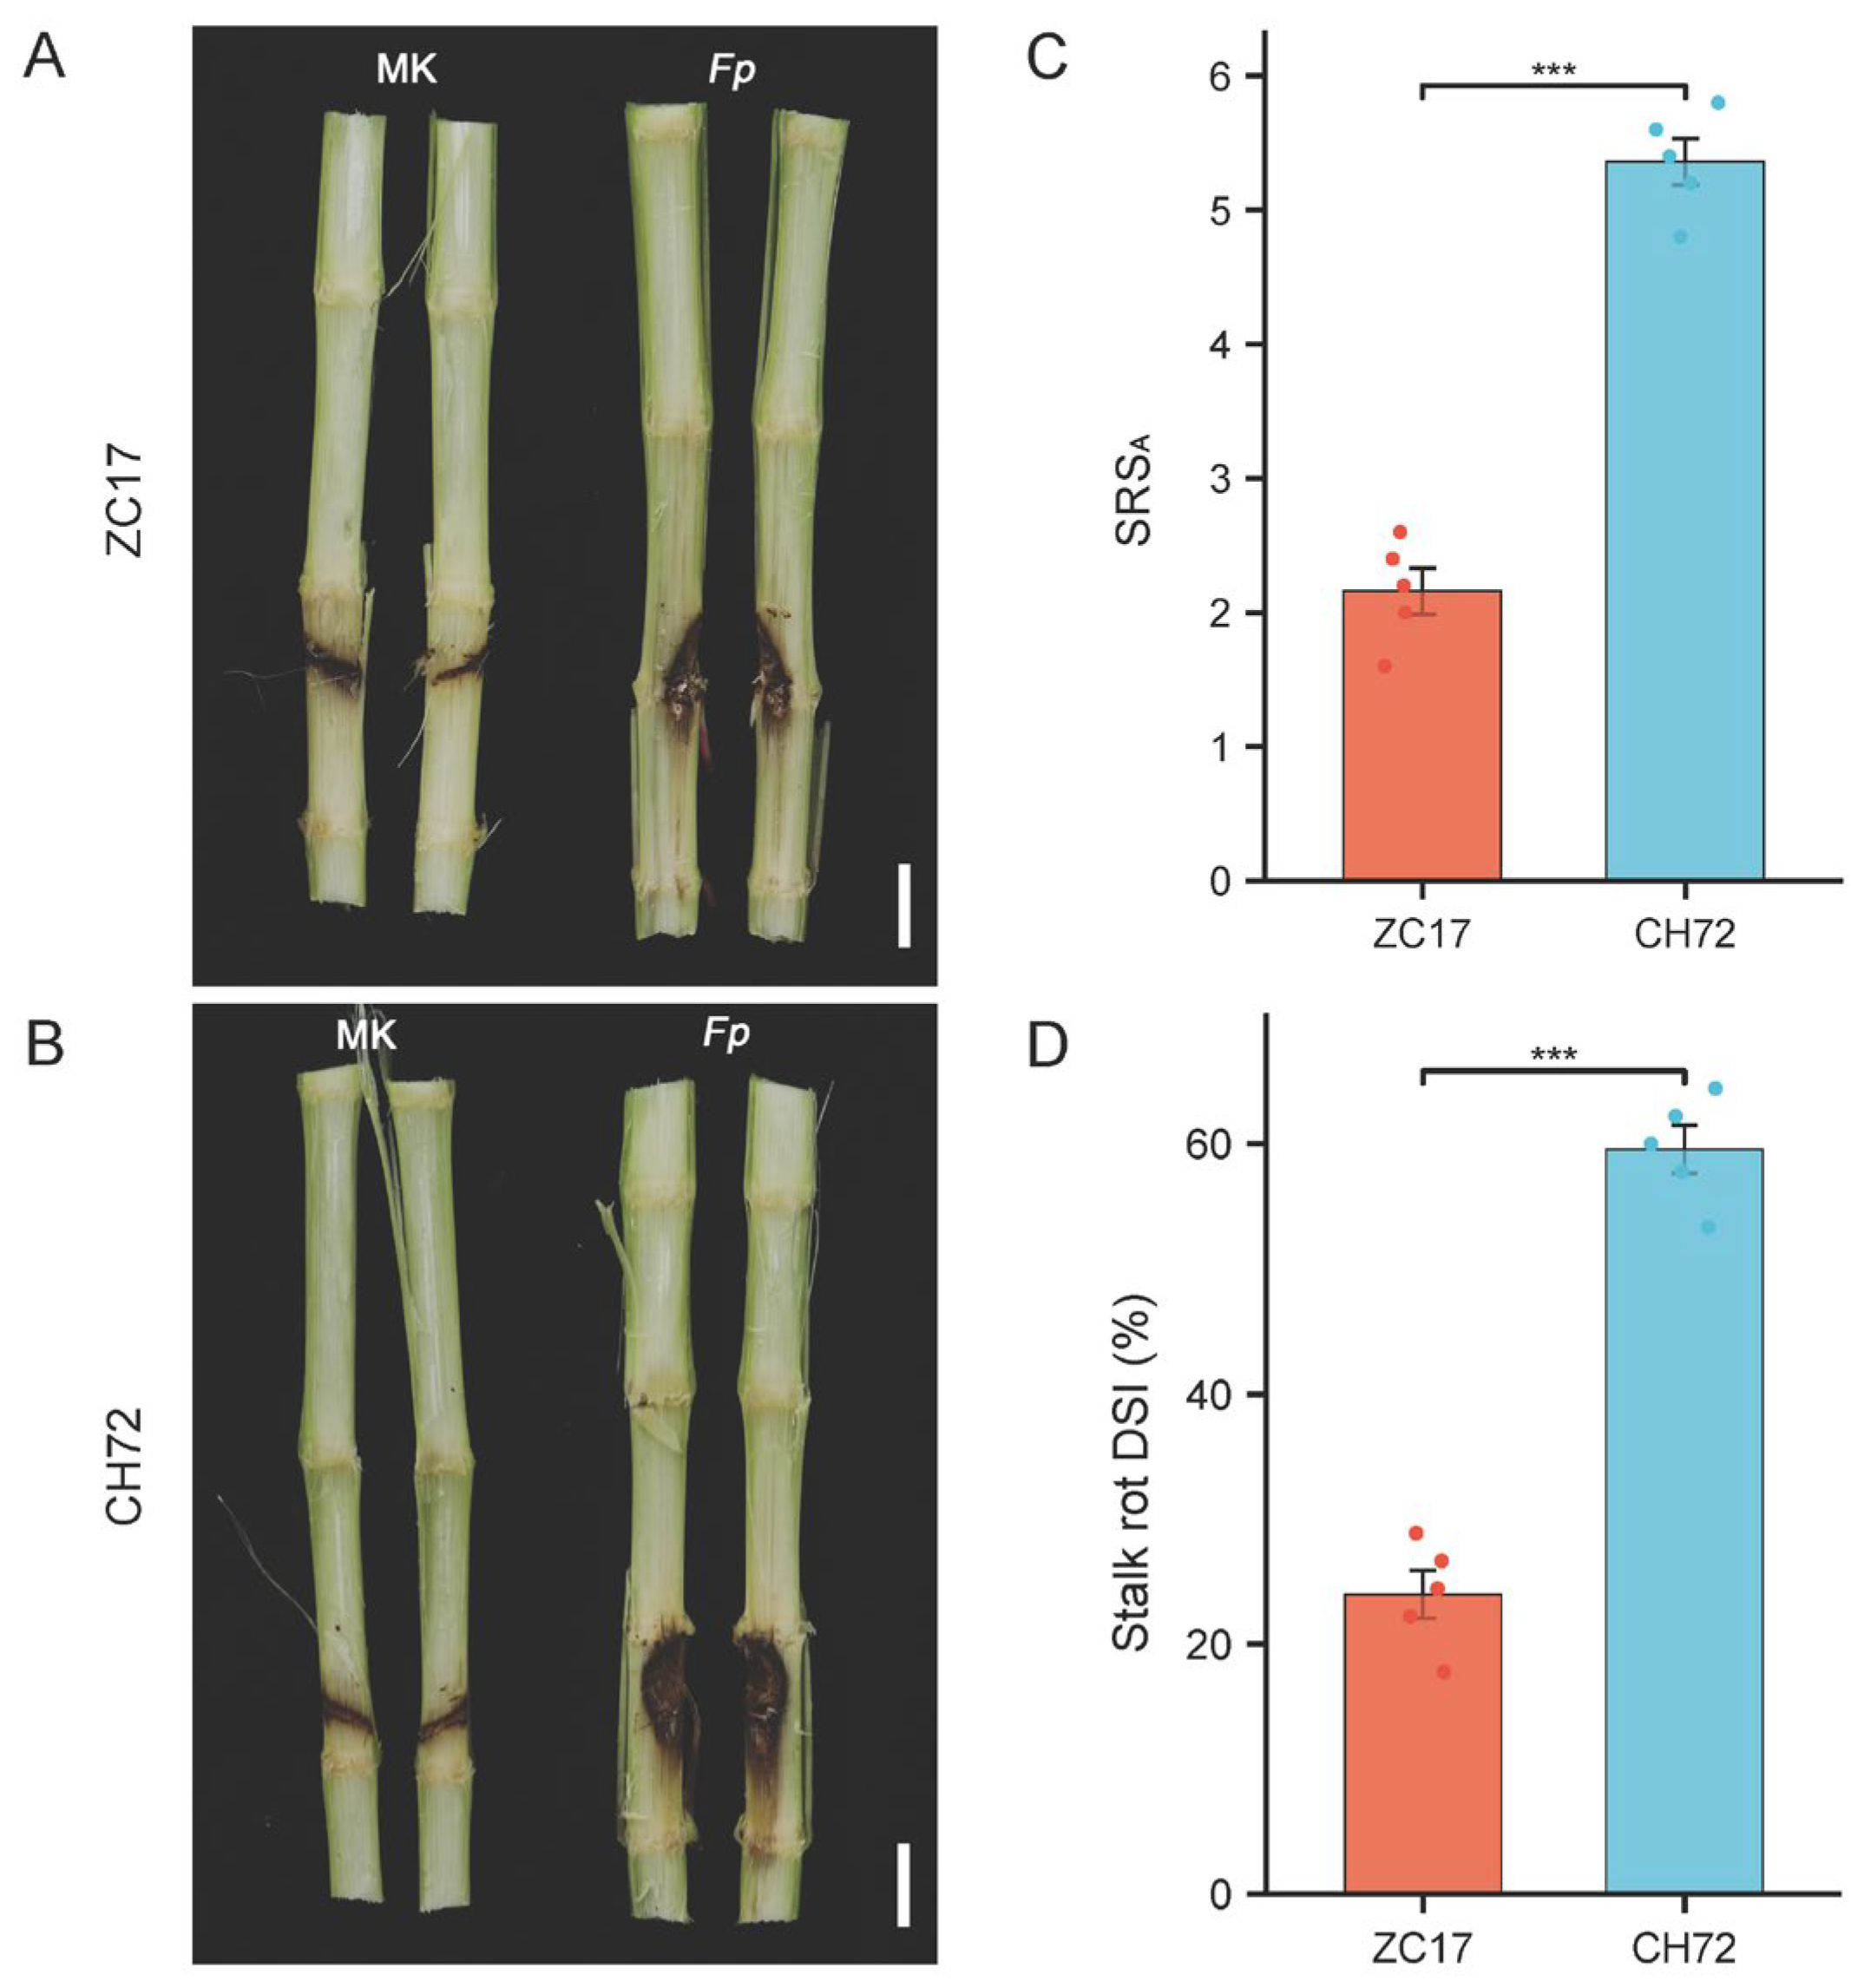
Abstract
1. Introduction
2. Results
2.1. Phenotypic and Physiological Characteristics of the Inbred Lines ZC17 and CH72 with Different Levels of Resistance to F. proliferatum after Inoculation
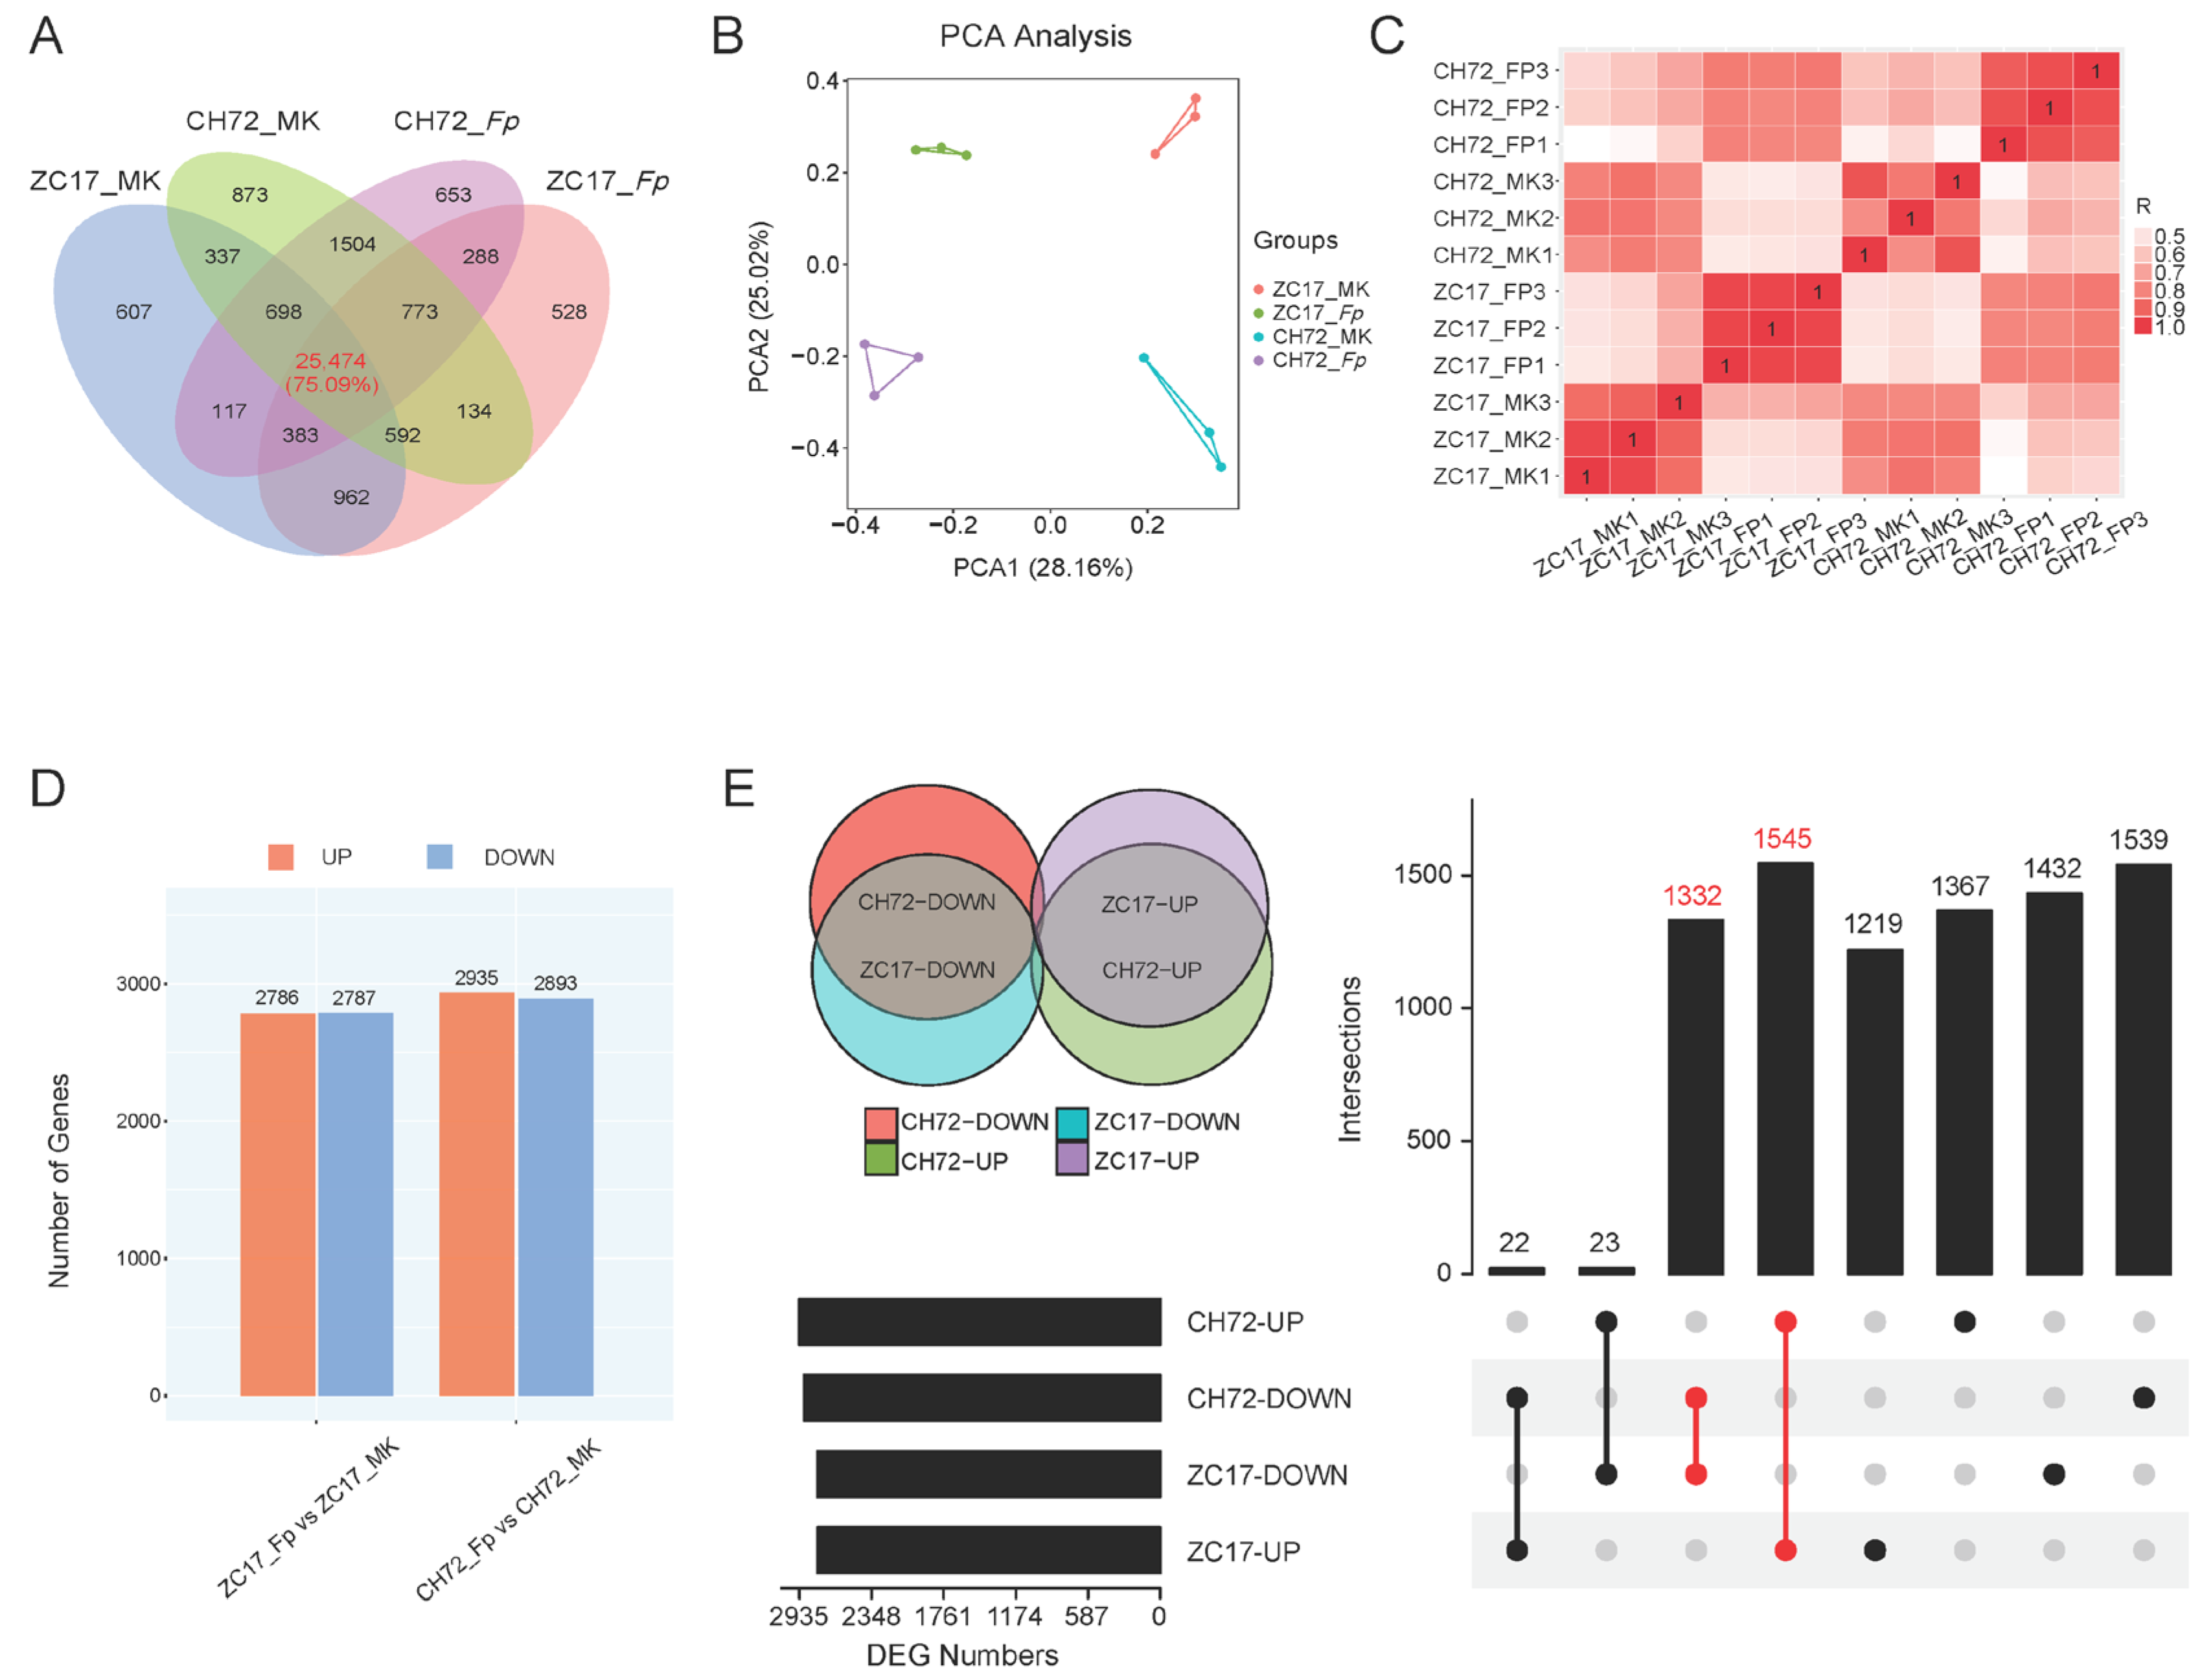
2.2. Transcriptome Analysis and DEG Screening of CH72 and ZC17 Stems Inoculated with F. proliferatum
2.3. Functional Enrichment of DEGs in Response to F. proliferatum Infestation in Maize
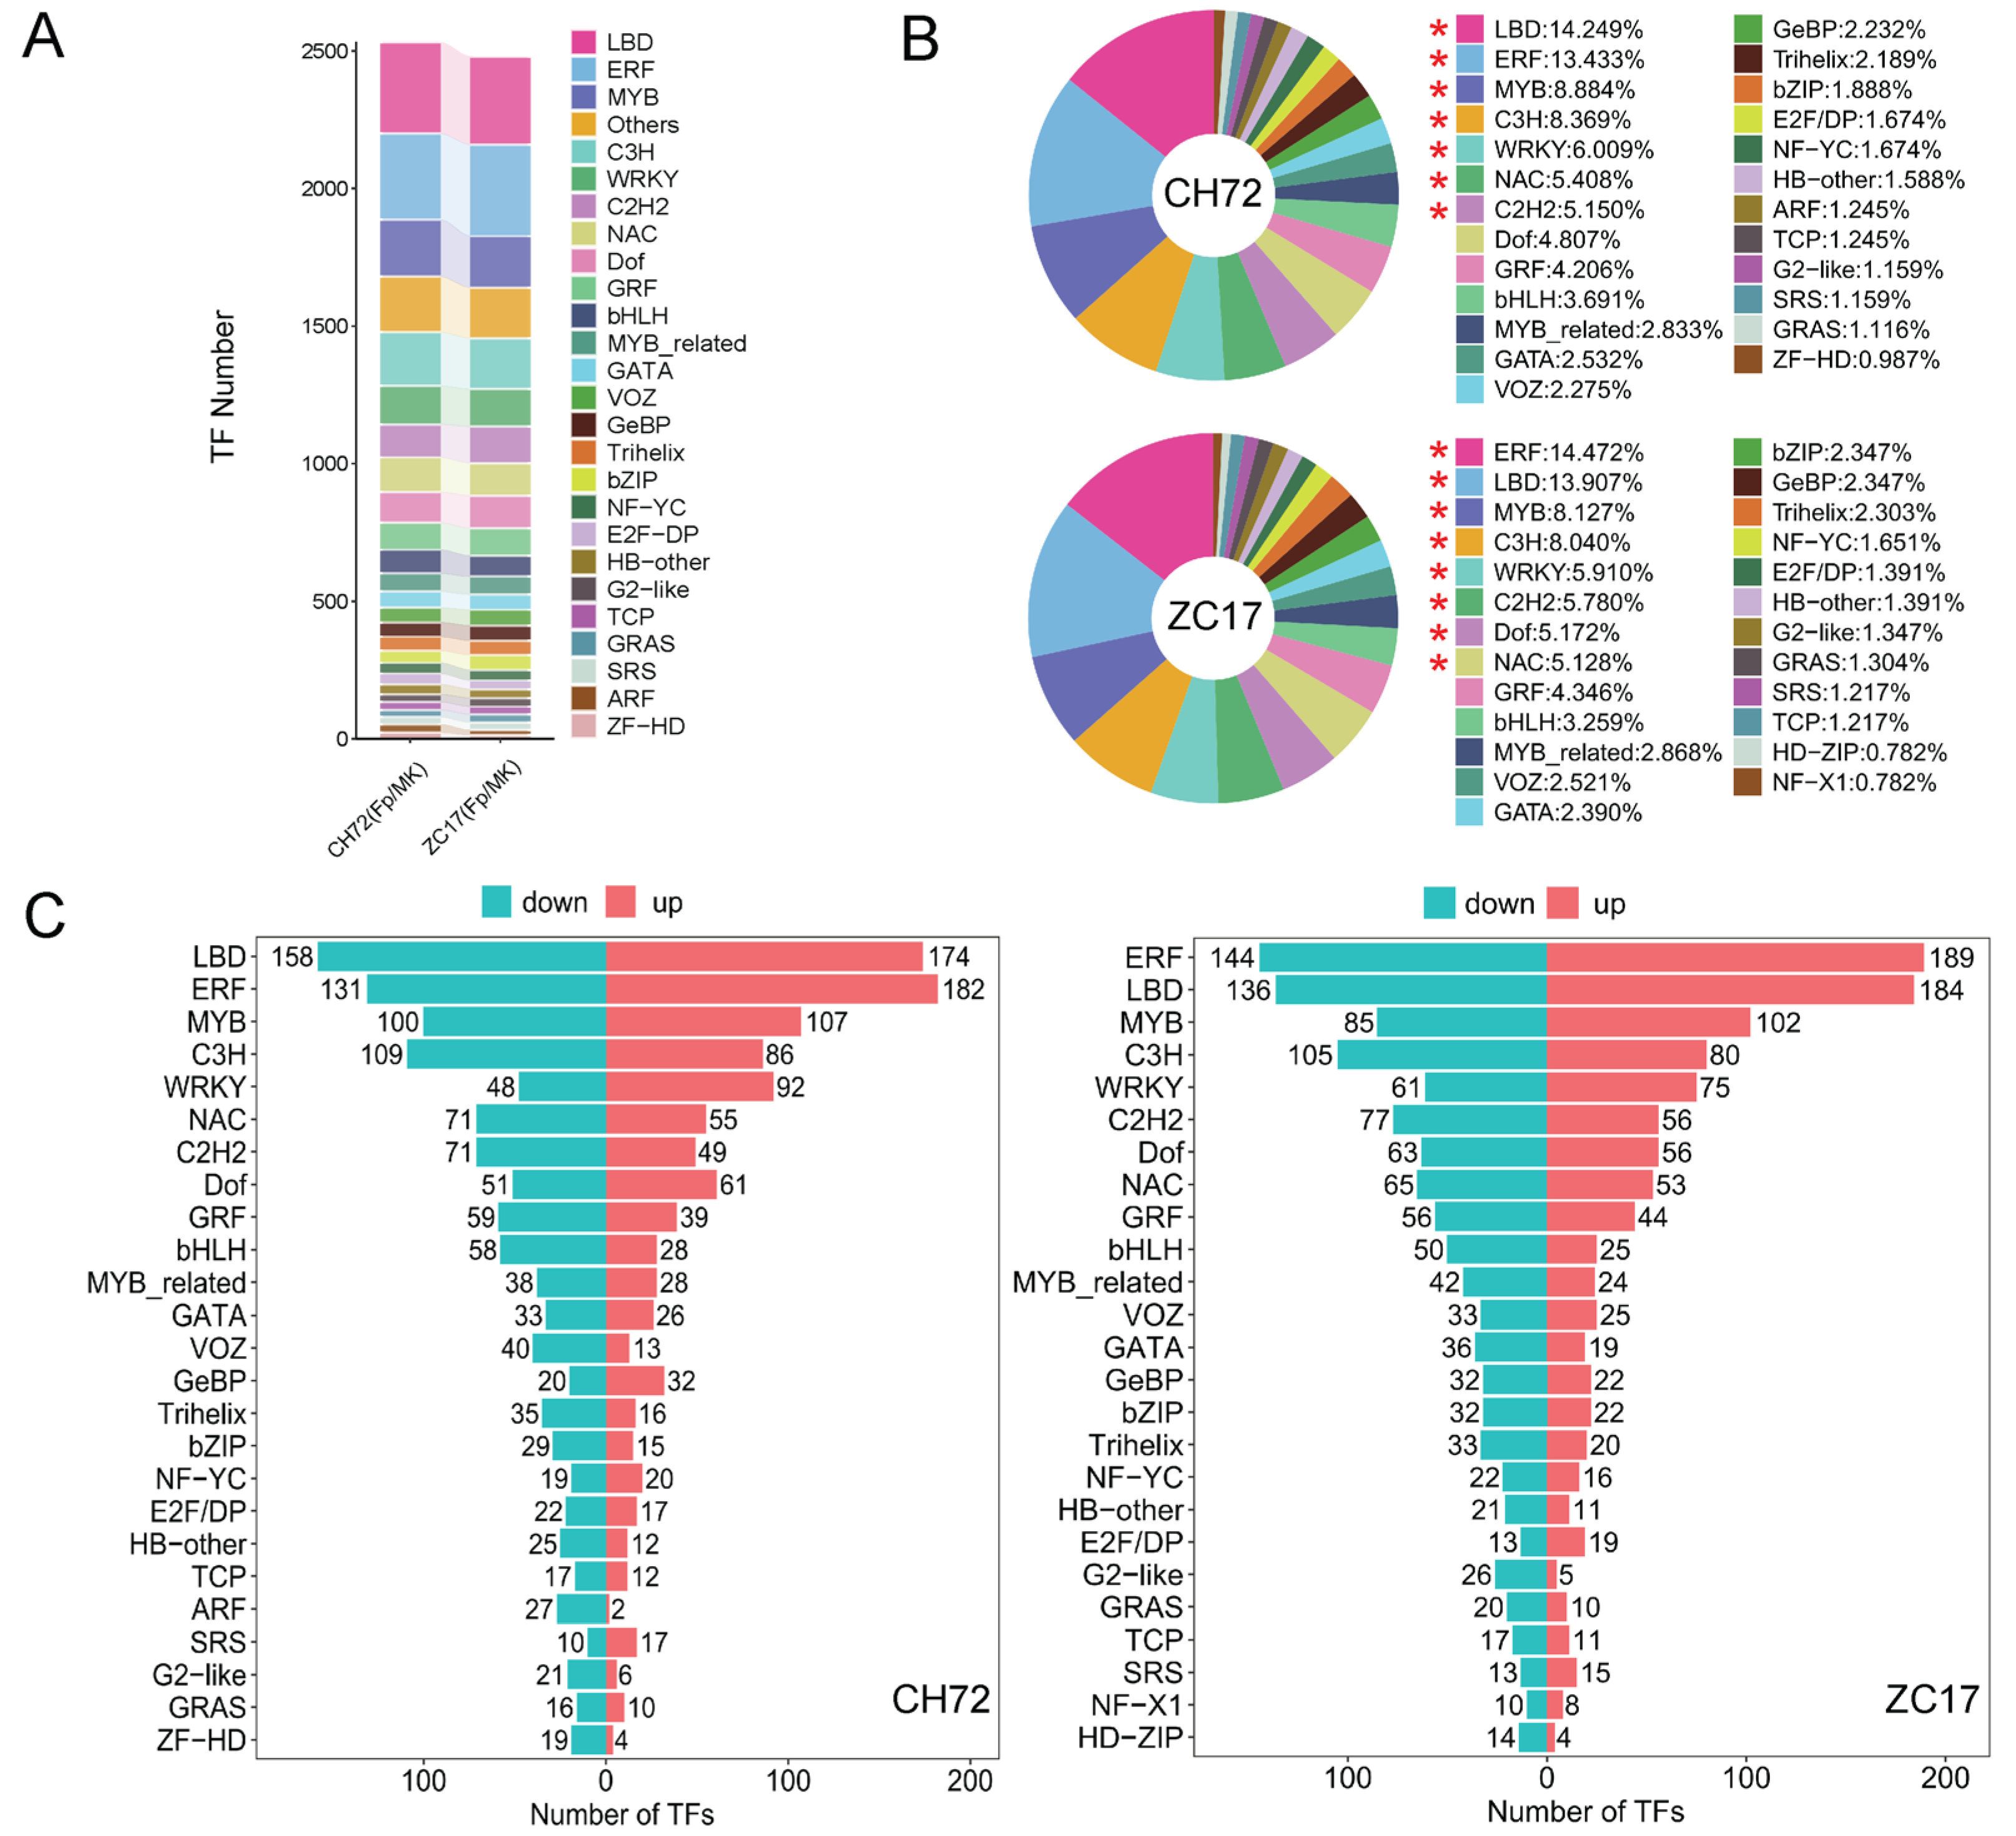
2.4. Transcription Factor (TF) Family Analysis
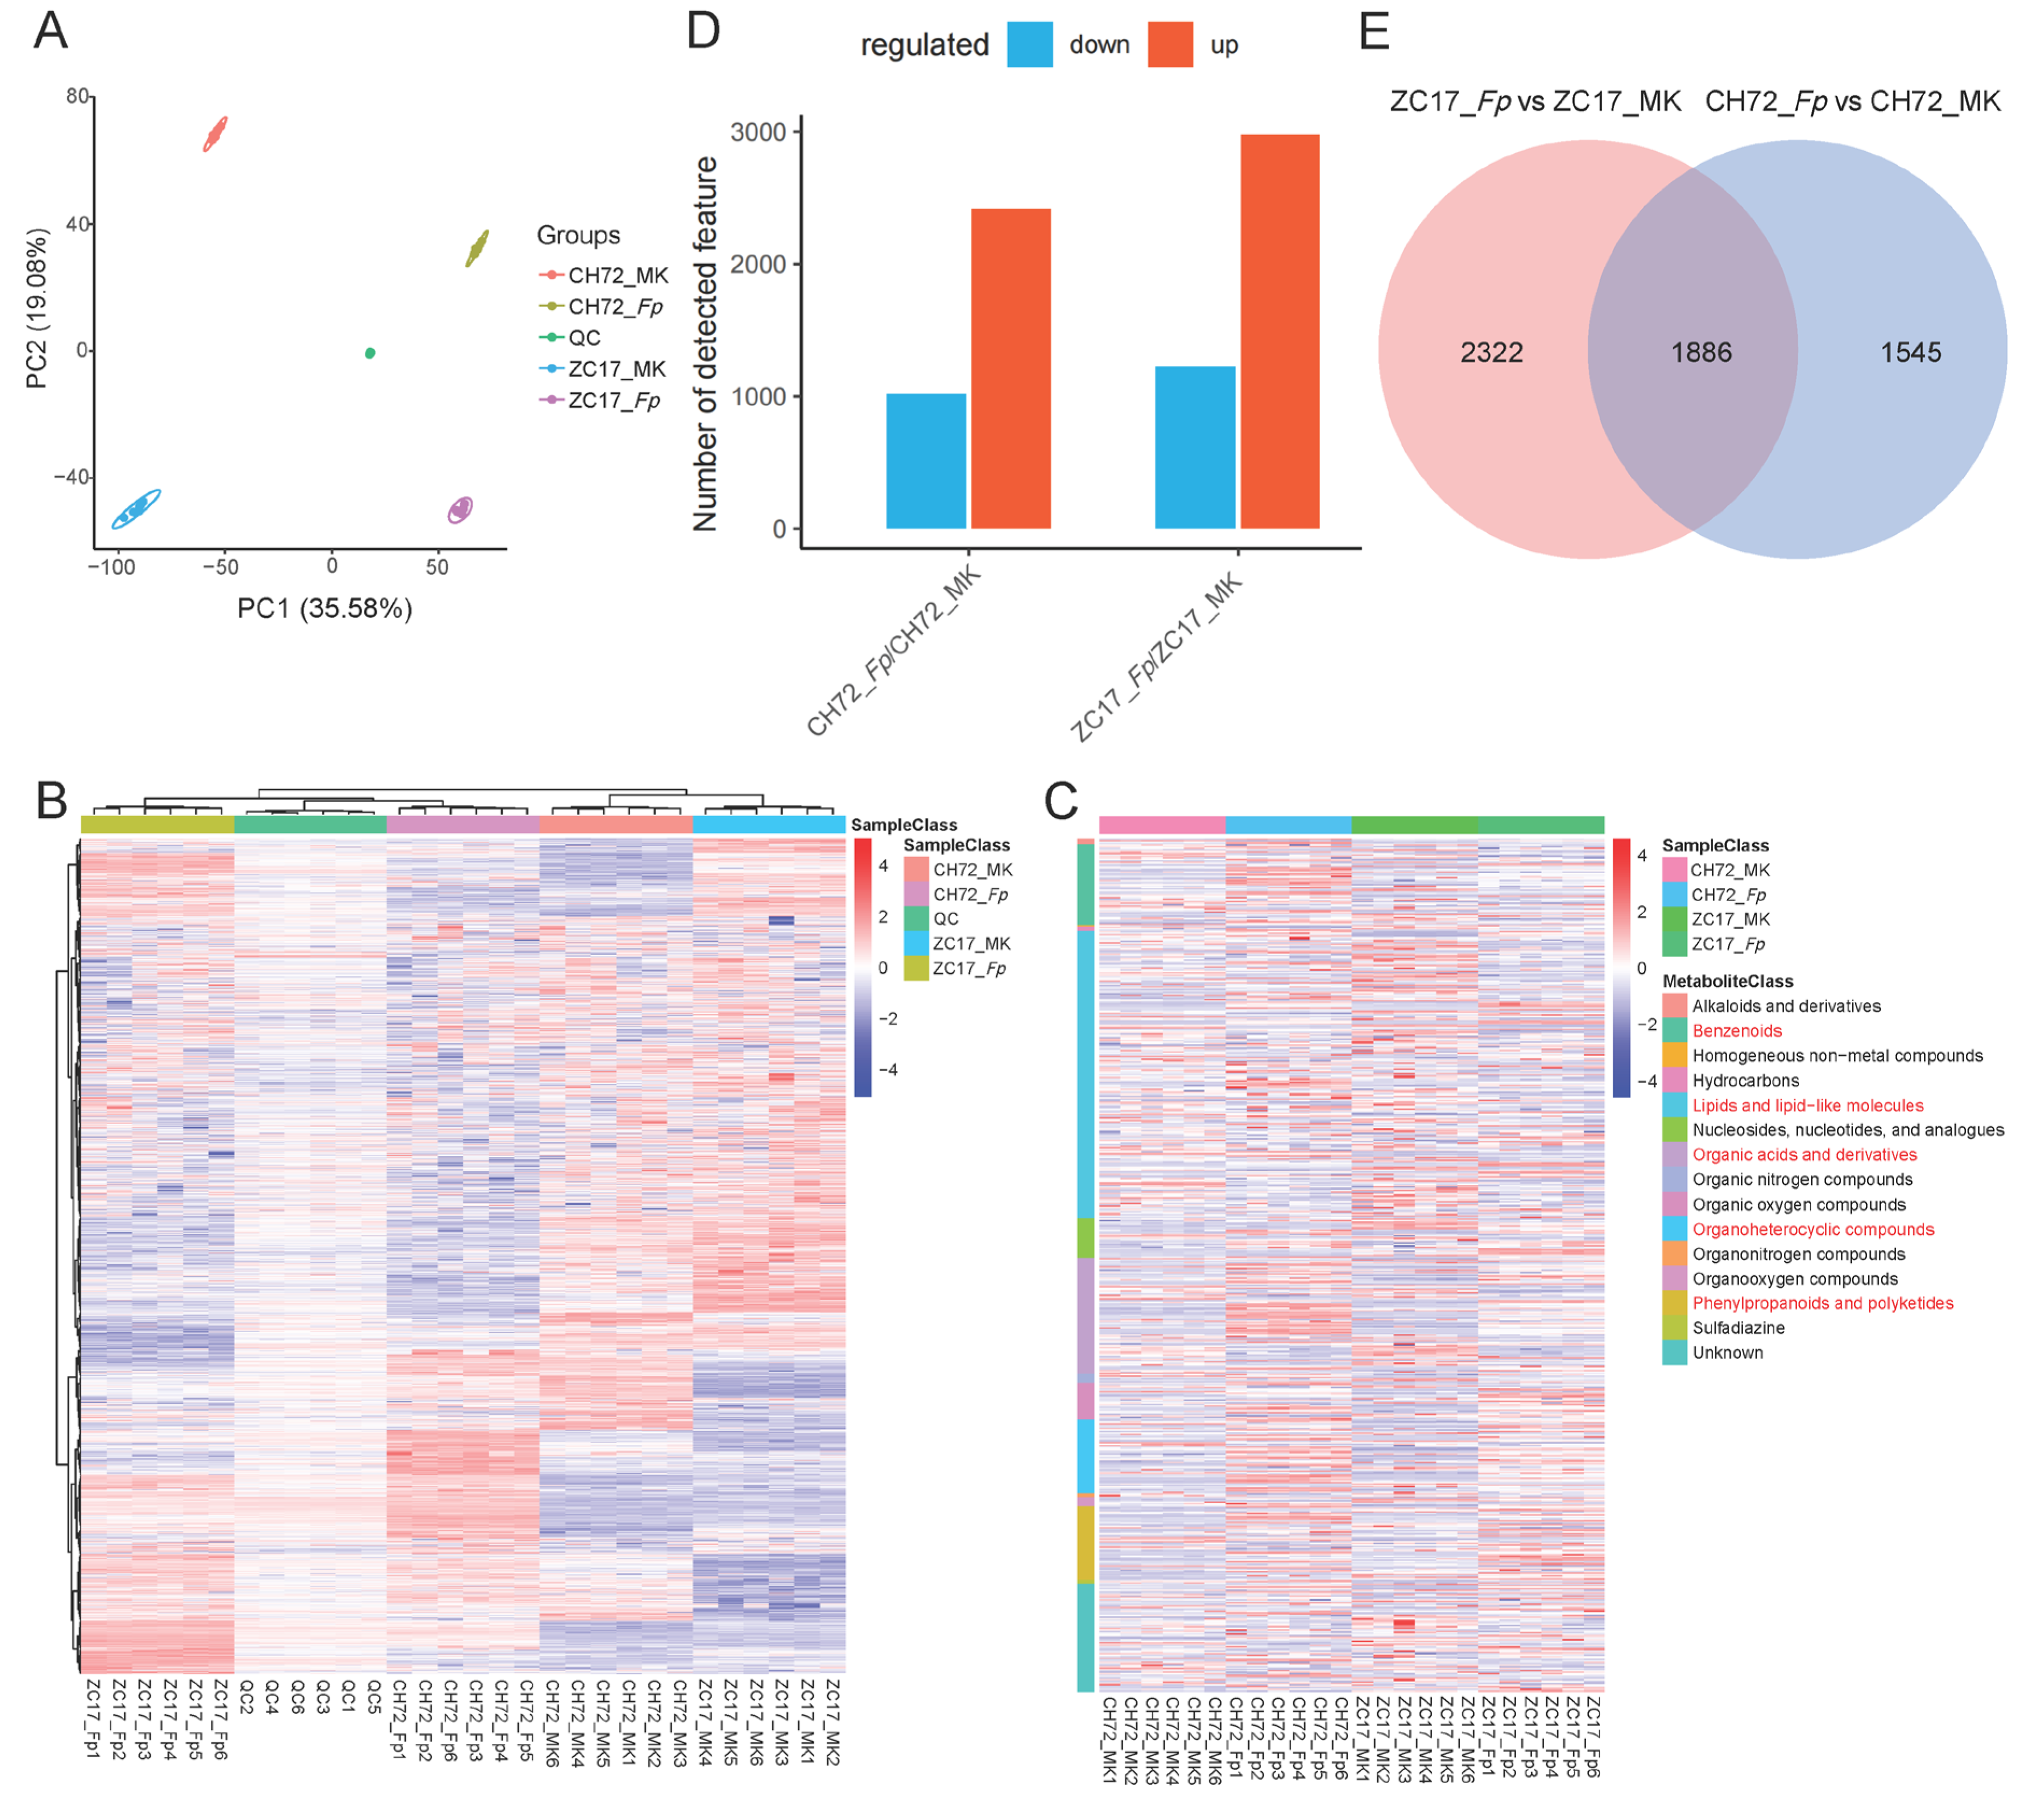
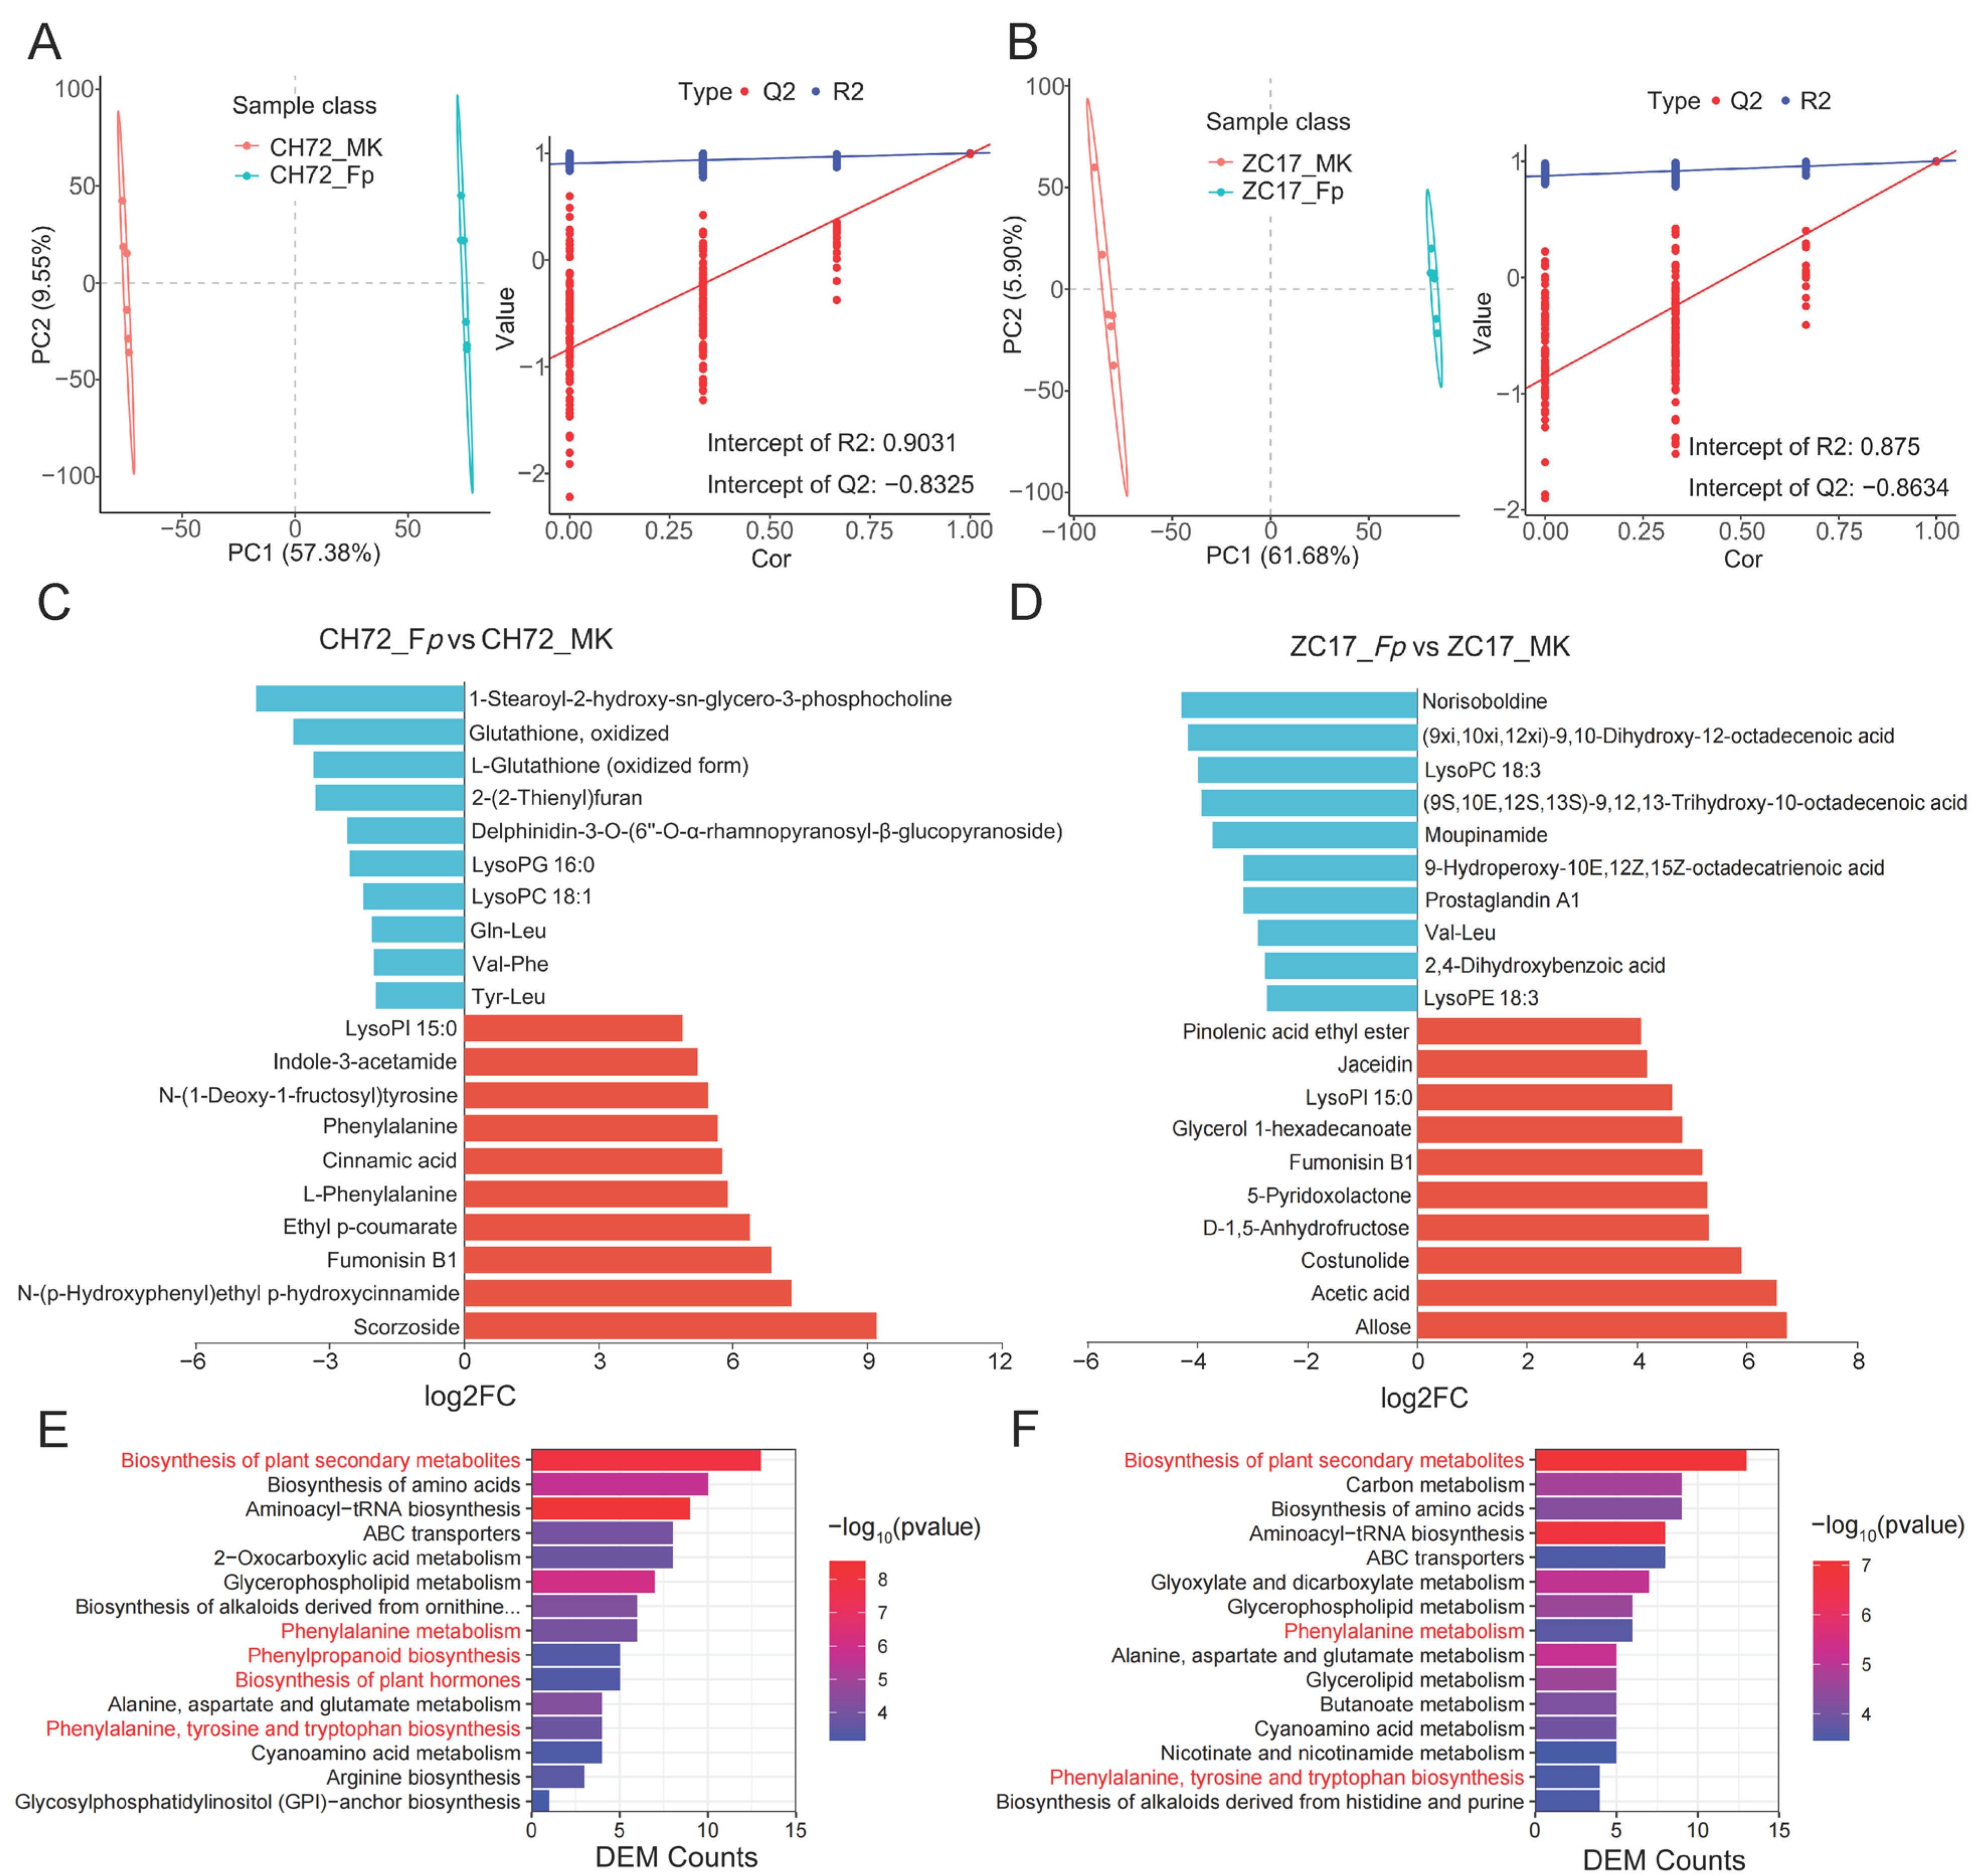
2.5. Metabolite Identification and DEM Analysis of CH72 and ZC17 after Infestation with F. proliferatum
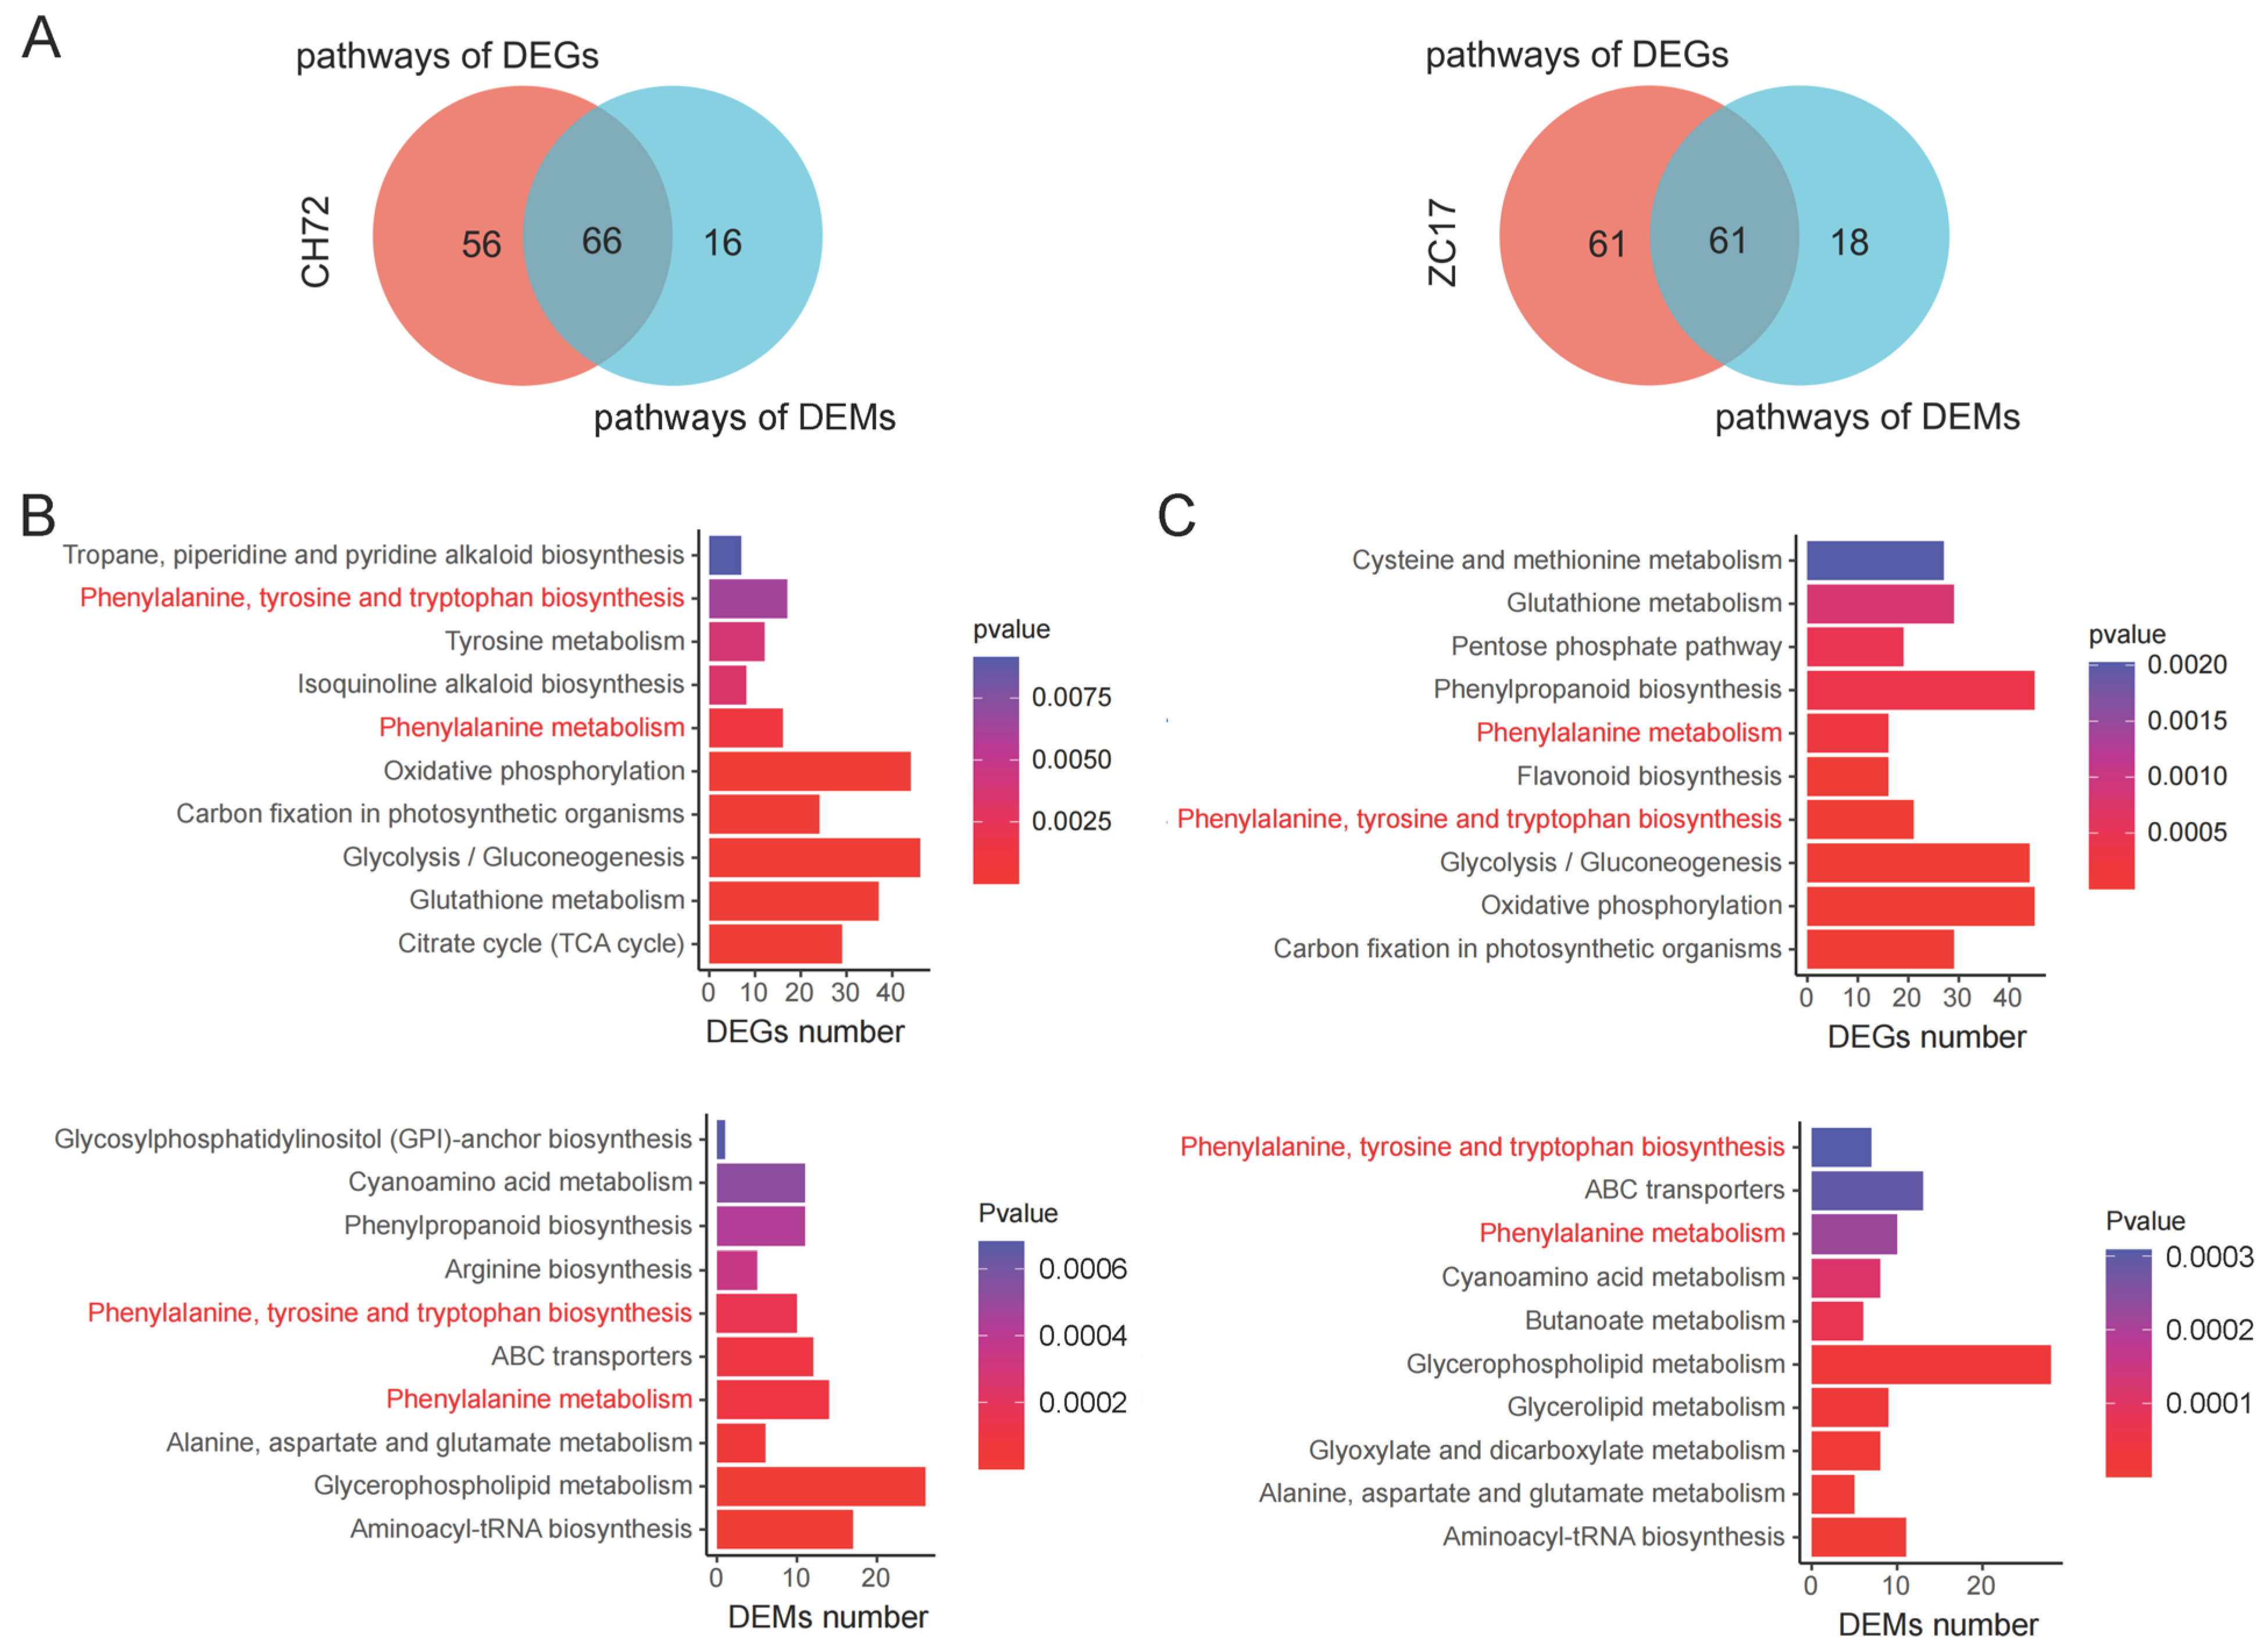
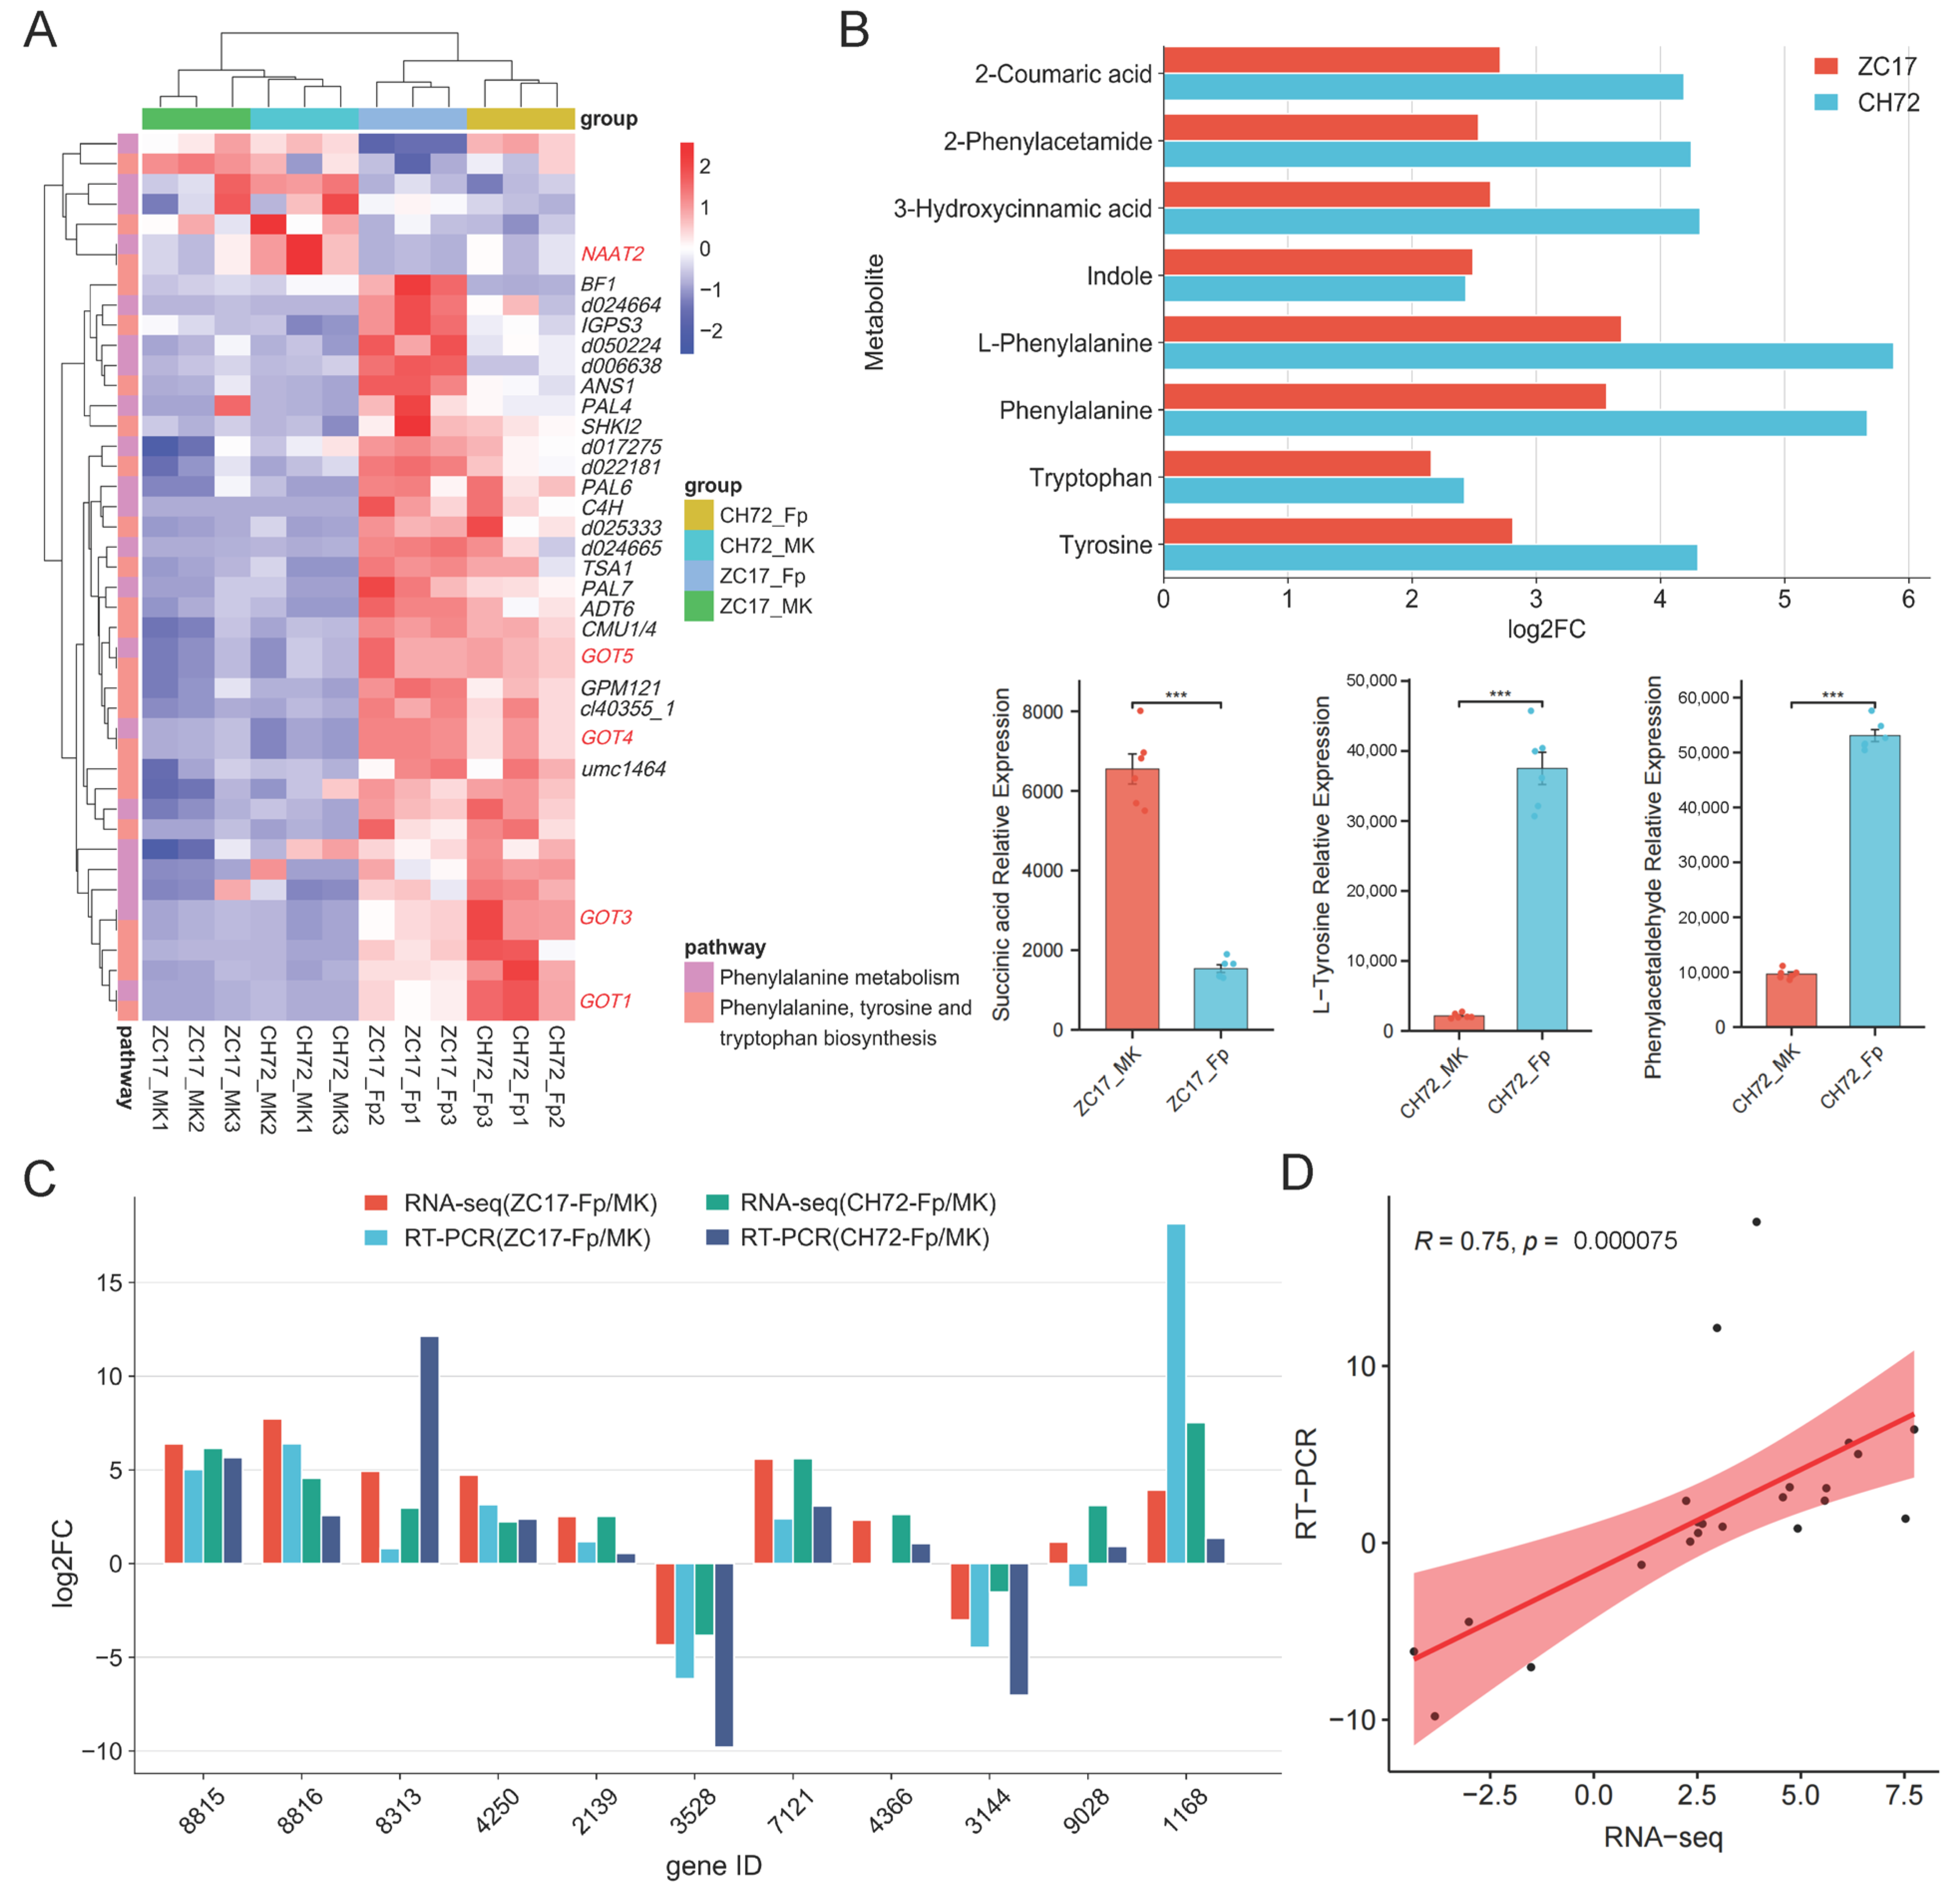
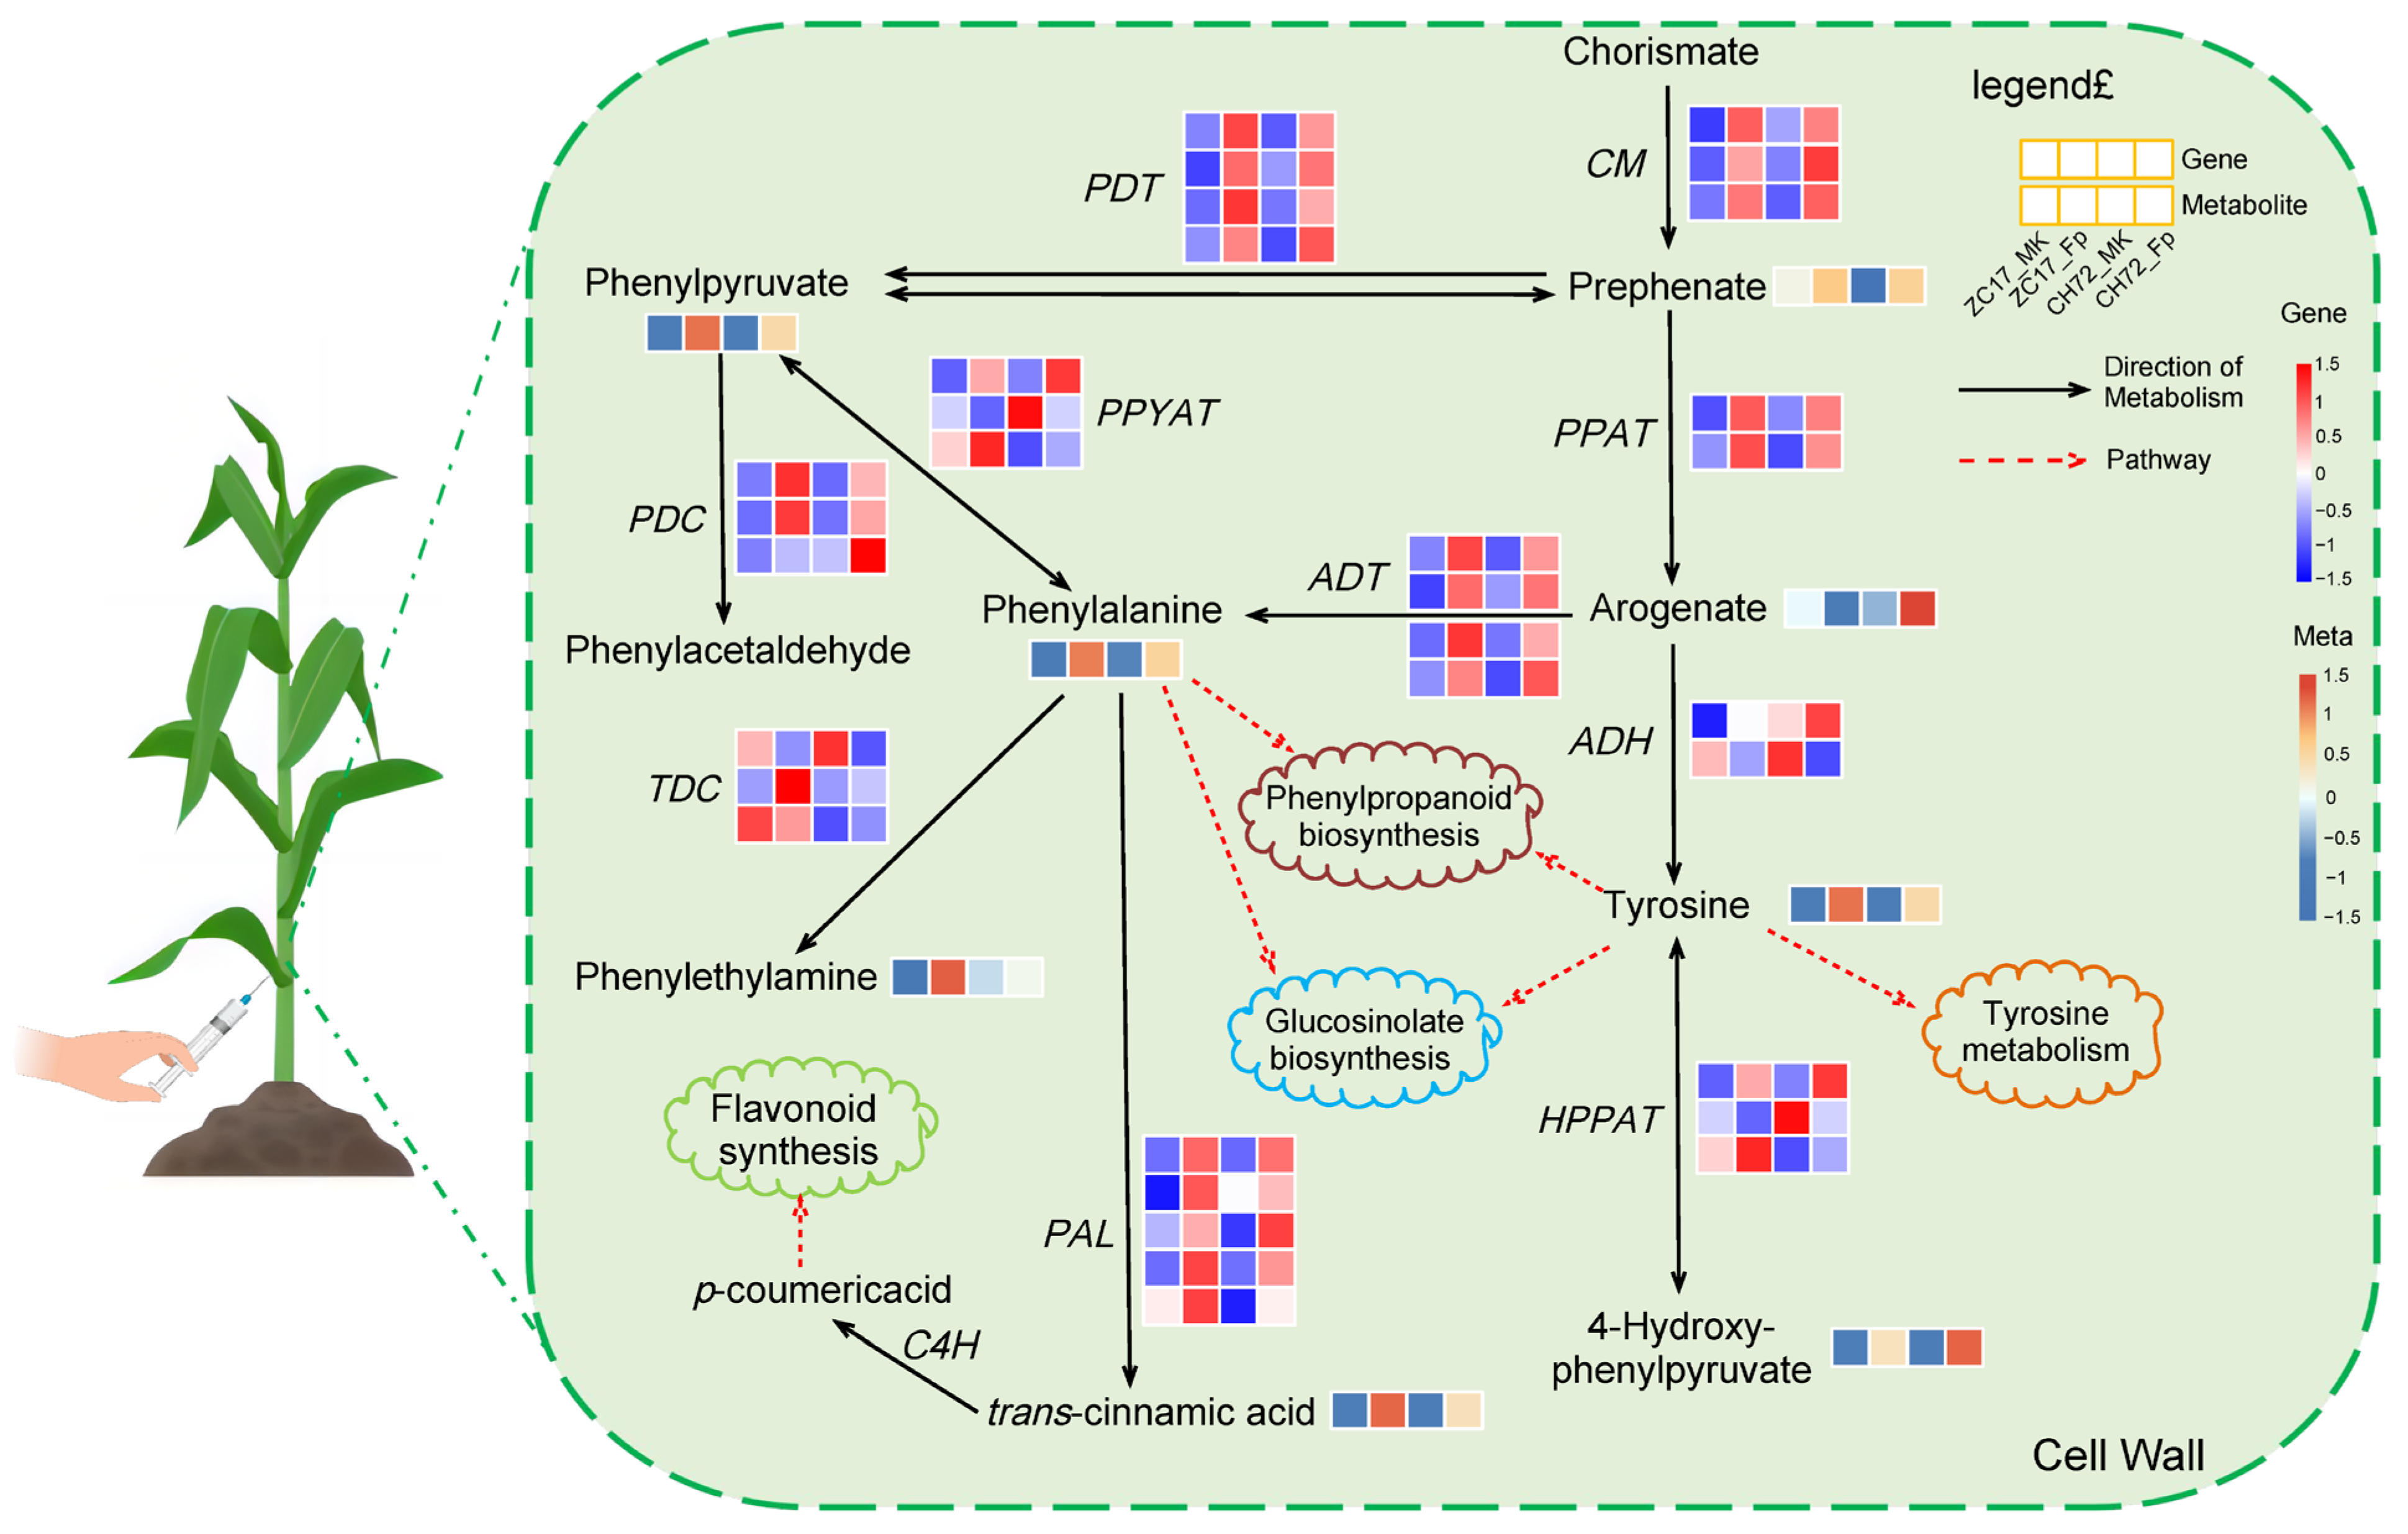
2.6. Integrated Analysis of Transcriptomics and Metabolomics Data Reveals the Mechanisms of the Maize Response to F. proliferatum
3. Discussion
3.1. Phenylalanine Metabolism Is Important for Plant Disease Resistance
3.2. The Role of TFs in the Maize Response to F. proliferatum Infestation
4. Materials and Methods
4.1. Sources of Materials, Method of Inoculation, and Assessment of Symptoms
4.2. The Method of RNA Extraction, Library Construction, and Sequencing
4.3. Bioinformatics Analysis of RNA-Seq Data
4.4. Sample Extraction and Metabolome Analysis
4.5. Quantitative Real-Time PCR Analysis
4.6. Statistical Analysis
Supplementary Materials
Author Contributions
Funding
Institutional Review Board Statement
Informed Consent Statement
Data Availability Statement
Conflicts of Interest
References
- United States Department of Agriculture-Foreign Agricultural Service. World Agricultural Production; United States Department of Agriculture-Foreign Agricultural Service: Washington, DC, USA, 2021.
- Yang, Q.; Yin, G.; Guo, Y.; Zhang, D.; Chen, S.; Xu, M. A major QTL for resistance to Gibberella stalk rot in maize. Theor. Appl. Genet. 2010, 121, 673–687. [Google Scholar] [CrossRef]
- Li, W.J.; He, P.; Jin, J.Y. Effect of potassium on ultrastructure of maize stalk pith and young root and their relation to stalk rot resistance. Agric. Sci. China 2010, 10, 1467–1474. [Google Scholar] [CrossRef]
- Yu, C.J.; Saravanakumar, K.; Xia, H.; Gao, J.X.; Fu, K.H.; Sun, J.A.; Dou, K.; Chen, J. Occurrence and virulence of Fusarium spp. associated with stalk rot of maize in North-East China. Physiol. Mol. Plant Pathol. 2017, 98, 1–8. [Google Scholar] [CrossRef]
- Tesso, T.; Ejeta, G. Stalk strength and reaction to infection by Macrophomina phaseolina of brown midrib maize (Zea mays) and sorghum (Sorghum bicolor). Fuel Ener. Abstr. 2011, 120, 271–275. [Google Scholar] [CrossRef]
- Gai, X.; Dong, H.; Wang, S.; Liu, B.; Zhang, Z.; Li, X.; Gao, Z. Infection cycle of maize stalk rot and ear rot caused by Fusarium verticillioides. PLoS ONE 2018, 13, e0201588. [Google Scholar] [CrossRef] [PubMed]
- Dorn, B.; Forrer, H.R.; Jenny, E.; Wettstein, F.E.; Bucheli, T.D.; Vogelgsang, S. Fusarium species complex and mycotoxins in grain maize from maize hybrid trials and from grower’s fields. J. Appl. Microbiol. 2011, 111, 693–706. [Google Scholar] [CrossRef] [PubMed]
- Nguyen, T.T.X.; Dehne, H.W.; Steiner, U. Histopathological assessment of the infection of maize leaves by Fusarium graminearum, F. proliferatum, and F. verticillioides. Fungal Biol. 2016, 120, 1094–1104. [Google Scholar] [CrossRef] [PubMed]
- Shu, X.M.; Livingston, D.P.; Woloshuk, C.P.; Payne, G.A. Comparative histological and transcriptional analysis of maize kernels infected with Aspergillus flavus and Fusarium verticillioides. Front. Plant Sci. 2017, 8, 2075. [Google Scholar] [CrossRef] [PubMed]
- Yassin, M.T.; Mostafa, A.F.; Al-Askar, A.A.; Sayed, S.R.M.; Rady, A.M. Antagonistic activity of Trichoderma harzianum and Trichoderma viride strains against some fusarial pathogens causing stalk rot disease of maize, in vitro. J. King Saud. Univ. Sci. 2021, 33, 101363. [Google Scholar] [CrossRef]
- Liu, S.; Ma, H.; Guo, N.; Shi, J.; Jin, G. Analysis of main pathogens and dominant species of maize stalk rot in the main summer maize producing areas of Huang-Huai-Hai. Sci. Agric. Sin. 2019, 52, 262–272. [Google Scholar]
- Wang, L.F.; Xu, G.J.; Zhang, S.L.; Zhang, J.K.; Lu, R.Q.; Li, C.J.; Wang, H.J.; Li, F.Z. Analysis of the resistance to stalk rot and yield loss evaluation of 25 maize varieties. J. Maize Sci. 2015, 23, 12–17. [Google Scholar]
- Li, X.J.; Zhang, G.G.; Wu, M.Q.; Hou, T.R.; Li, N.; Qiu, M. Effect of stem rot disease at late maturity on thousand-grain weight of summer corn. Shandong Agric. Sci. 2015, 47, 93–95. [Google Scholar]
- Wilke, A.L.; Bronson, C.R.; Tomas, A.; Munkvold, G.P. Seed transmission of Fusarium verticillioides in maize plants grown under three different temperature regimes. Plant Dis. 2007, 91, 1109–1115. [Google Scholar] [CrossRef]
- Ju, M.; Zhou, Z.; Mu, C.; Zhang, X.; Gao, J.; Liang, Y.; Chen, J.; Wu, Y.; Li, X.; Wang, S.; et al. Dissecting the genetic architecture of Fusarium verticillioides seed rot resistance in maize by combining QTL mapping and genome-wide association analysis. Sci. Rep. 2017, 7, 46446. [Google Scholar] [CrossRef]
- Maschietto, V.; Colombi, C.; Pirona, R.; Pea, G.; Strozzi, F.; Marocco, A.; Rossini, L.; Lanubile, A. QTL mapping and candidate genes for resistance to Fusarium ear rot and fumonisin contamination in maize. BMC Plant Biol. 2017, 17, 20. [Google Scholar] [CrossRef]
- Hou, M.; Cao, Y.; Zhang, X.; Zhang, S.; Jia, T.; Yang, J.; Han, S.; Wang, L.; Li, J.; Wang, H.; et al. Genome-wide association study of maize resistance to Pythium aristosporum stalk rot. Front. Plant Sci. 2023, 14, 1239635. [Google Scholar] [CrossRef] [PubMed]
- Ye, J.; Zhong, T.; Zhang, D.; Ma, C.; Wang, L.; Yao, L.; Zhang, Q.; Zhu, M.; Xu, M. The Auxin-regulated protein ZmAuxRP1 coordinates the balance between root growth and stalk rot disease resistance in maize. Mol. Plant 2019, 12, 360–373. [Google Scholar] [CrossRef] [PubMed]
- Zhang, L.; Hou, M.; Zhang, X.; Cao, Y.; Sun, S.; Zhu, Z.; Han, S.; Chen, Y.; Ku, L.; Duan, C. Integrative transcriptome and proteome analysis reveals maize responses to Fusarium verticillioides infection inside the stalks. Mol. Plant Pathol. 2023, 24, 693–710. [Google Scholar] [CrossRef] [PubMed]
- Terna, T.P.; Mohamed Nor, N.M.I.; Zakaria, L. Histopathology of Corn Plants Infected by Endophytic Fungi. Biology 2022, 11, 641. [Google Scholar] [CrossRef] [PubMed]
- Jones, J.D.G.; Dangl, J.L. The plant immune system. Nature 2006, 444, 323–329. [Google Scholar] [CrossRef] [PubMed]
- Pechanova, O.; Pechan, T. Maize–pathogen interactions: An ongoing combat from a proteomics perspective. Int. J. Mol. Sci. 2015, 16, 28429–28448. [Google Scholar] [CrossRef] [PubMed]
- Pieterse, C.M.; Van der Does, D.; Zamioudis, C.; Leon-Reyes, A.; Van Wees, S.C. Hormonal modulation of plant immunity. Annu. Rev. Cell Dev. Biol. 2012, 28, 489–521. [Google Scholar] [CrossRef]
- Lanubile, A.; Maschietto, V.; Borrelli, V.M.; Stagnati, L.; Logrieco, A.F.; Marocco, A. Molecular basis of resistance to Fusarium ear rot in maize. Front. Plant Sci. 2017, 8, 1774. [Google Scholar] [CrossRef]
- Wang, F.; Xiao, J.; Zhang, Y.; Li, R.; Liu, L.; Deng, J. Biocontrol ability and action mechanism of Bacillus halotolerans against Botrytis cinerea causing gray mold in postharvest strawberry fruit. Postharvest Biol. Technol. 2021, 174, 111456. [Google Scholar] [CrossRef]
- Berens, M.L.; Berry, H.M.; Mine, A.; Argueso, C.T.; Tsuda, K. Evolution of hormone signaling networks in plant defense. Annu. Rev. Phytopathol. 2017, 55, 401–425. [Google Scholar] [CrossRef] [PubMed]
- Licausi, F.; Ohme-Takagi, M.; Perata, P. APETALA2/Ethylene Responsive Factor (AP2/ERF) transcription factors: Mediators of stress responses and developmental programs. New Phytol. 2013, 199, 639–649. [Google Scholar] [CrossRef] [PubMed]
- Bu, Q.; Jiang, H.; Li, C.B.; Zhai, Q.; Zhang, J.; Wu, X.; Sun, J.; Xie, Q.; Li, C. Role of the Arabidopsis thaliana NAC transcription factors ANAC019 and ANAC055 in regulating jasmonic acid-signaled defense responses. Cell Res. 2008, 18, 756–767. [Google Scholar] [CrossRef]
- Wu, Y.; Deng, Z.; Lai, J.; Zhang, Y.; Yang, C.; Yin, B.; Zhao, Q.; Zhang, L.; Li, Y.; Yang, C.; et al. Dual function of Arabidopsis ATAF1 in abiotic and biotic stress responses. Cell Res. 2009, 19, 1279–1290. [Google Scholar] [CrossRef]
- Ahuja, I.; Kissen, R.; Bones, A.M. Phytoalexins in defense against pathogens. Trends Plant Sci. 2012, 17, 73–90. [Google Scholar] [CrossRef]
- Matić, S.; Bagnaresi, P.; Biselli, C.; Orru’, L.; Amaral Carneiro, G.; Siciliano, I.; Valé, G.; Gullino, M.L.; Spadaro, D. Comparative transcriptome profiling of resistant and susceptible rice genotypes in response to the seedborne pathogen Fusarium fujikuroi. BMC Genom. 2016, 17, 608. [Google Scholar] [CrossRef]
- Geng, X.; Gao, Z.; Zhao, L.; Zhang, S.; Wu, J.; Yang, Q.; Liu, S.; Chen, X. Comparative transcriptome analysis of resistant and susceptible wheat in response to Rhizoctonia cerealis. BMC Plant Biol. 2022, 22, 235. [Google Scholar] [CrossRef] [PubMed]
- Deng, Y.; Lu, S. Biosynthesis and regulation of phenylpropanoids in plants. Crit. Rev. Plant Sci. 2017, 36, 257–290. [Google Scholar] [CrossRef]
- Cheng, Q.; Li, N.; Dong, L.; Zhang, D.; Fan, S.; Jiang, L.; Wang, X.; Xu, P.; Zhang, S. Overexpression of soybean isoflavone reductase (GmIFR) enhances resistance to Phytophthora sojae in soybean. Front. Plant Sci. 2015, 6, 1024. [Google Scholar] [CrossRef] [PubMed]
- Mierziak, J.; Kostyn, K.; Kulma, A. Flavonoids as important molecules of plant interactions with the environment. Molecules 2014, 19, 16240–16265. [Google Scholar] [CrossRef] [PubMed]
- Walter, S.; Nicholson, P.; Doohan, F.M. Action and reaction of host and pathogen during Fusarium head blight disease. New Phytol. 2010, 185, 54–66. [Google Scholar] [CrossRef] [PubMed]
- Maeda, H.; Dudareva, N. The shikimate pathway and aromatic amino acid biosynthesis in plants. Annu. Rev. Plant Biol. 2012, 63, 73–105. [Google Scholar] [CrossRef] [PubMed]
- Suguiyama, V.F.; Silva, E.A.; Meirelles, S.T.; Centeno, D.C.; Braga, M.R. Leaf metabolite profile of the Brazilian resurrection plant Barbacenia purpurea Hook. (Velloziaceae) shows two time-dependent responses during desiccation and recovering. Front. Plant Sci. 2014, 5, 96. [Google Scholar] [CrossRef]
- Wang, Y.; Dang, F.; Liu, Z.; Wang, X.; Eulgem, T.; Lai, Y.; Yu, L.; She, J.; Shi, Y.; Lin, J.; et al. CaWRKY58, encoding a group I WRKY transcription factor of capsicum annuum, negatively regulates resistance to Ralstonia solanacearum infection. Mol. Plant Pathol. 2013, 14, 131–144. [Google Scholar] [CrossRef]
- Dubos, C.; Stracke, R.; Grotewold, E.; Weisshaar, B.; Martin, C.; Lepiniec, L. MYB transcription factors in Arabidopsis. Trends Plant Sci. 2010, 15, 573–581. [Google Scholar] [CrossRef]
- Cao, H.; Zhang, K.; Li, W.; Pang, X.; Liu, P.; Si, H.; Zang, J.; Xing, J.; Dong, J. ZmMYC7 directly regulates ZmERF147 to increase maize resistance to Fusarium graminearum. CROP J. 2023, 11, 10. [Google Scholar] [CrossRef]
- Li, W.; Zhu, Z.; Chern, M.; Yin, J.; Yang, C.; Ran, L.; Cheng, M.; He, M.; Wang, K.; Wang, J.; et al. A natural allele of a transcription factor in rice confers broad-spectrum blast resistance. Cell 2017, 170, 114–126. [Google Scholar] [CrossRef] [PubMed]
- Zhang, Z.; Liu, X.; Wang, X.; Zhou, M.; Zhou, X.; Ye, X.; Wei, X. An R2R3 MYB transcription factor in wheat, TaPIMP1, mediates host resistance to Bipolaris sorokiniana and drought stresses through regulation of defense- and stress-related genes. New Phytol. 2012, 196, 1155–1170. [Google Scholar] [CrossRef] [PubMed]
- Puranik, S.; Sahu, P.P.; Srivastava, P.S.; Prasad, M. NAC proteins: Regulation and role in stress tolerance. Trends Plant Sci. 2012, 17, 369–381. [Google Scholar] [CrossRef] [PubMed]
- Lin, R.; Zhao, W.; Meng, X.; Wang, M.; Peng, Y. Rice gene OsNAC19 encodes a novel NAC-domain transcription factor and responds to infection by Magnaporthe grisea. Plant Sci. 2007, 172, 120–130. [Google Scholar] [CrossRef]
- Yokotani, N.; Tsuchida-Mayama, T.; Ichikawa, H.; Mitsuda, N.; Ohme-Takagi, M.; Kaku, H.; Minami, E.; Nishizawa, Y. OsNAC111, a blast disease-responsive transcription factor in rice, positively regulates the expression of defense-related genes. Mol. Plant Microbe Interact. 2014, 27, 1027–1034. [Google Scholar] [CrossRef]
- Xiang, Y.; Bian, X.; Wei, T.; Yan, J.; Sun, X.; Han, T.; Dong, B.; Zhang, G.; Li, J.; Zhang, A. ZmMPK5 phosphorylates ZmNAC49 to enhance oxidative stress tolerance in maize. New Phytol. 2021, 232, 2400–2417. [Google Scholar] [CrossRef]
- Javed, T.; Gao, S.J. WRKY transcription factors in plant defense. Trends Genet. 2023, 10, 787–801. [Google Scholar] [CrossRef]
- Cai, R.; Dai, W.; Zhang, C.; Wang, Y.; Wu, M.; Zhao, Y.; Ma, Q.; Xiang, Y.; Cheng, B. The maize WRKY transcription factor ZmWRKY17 negatively regulates salt stress tolerance in transgenic Arabidopsis plants. Planta 2017, 246, 1215–1231. [Google Scholar] [CrossRef] [PubMed]
- Wang, C.T.; Ru, J.N.; Liu, Y.W.; Li, M.; Zhao, D.; Yang, J.F.; Fu, J.D.; Xu, Z.S. Maize WRKY transcription factor ZmWRKY106 confers drought and heat tolerance in transgenic plants. Int. J. Mol. Sci. 2018, 19, 3046. [Google Scholar] [CrossRef]
- Parish, F.; Williams, W.P.; Windham, G.L.; Shan, X. Differential expression of signaling pathway genes associated with aflatoxin reduction quantitative traitloci in maize (Zea mays L.). Front. Microbiol. 2019, 10, 2683. [Google Scholar] [CrossRef] [PubMed]
- Bai, H.; Si, H.; Zang, J.; Pang, X.; Yu, L.; Cao, H.; Xing, J.; Zhang, K.; Dong, J. Comparative proteomic analysis of the defense response to Gibberella stalk rot in maize and reveals that ZmWRKY83 is involved in plant disease resistance. Front. Plant Sci. 2021, 12, 694973. [Google Scholar] [CrossRef] [PubMed]
- Miller, J.C.; Chezem, W.R.; Clay, N.K. Ternary WD40 Repeat-containing protein complexes: Evolution, composition and roles in plant immunity. Front. Plant Sci. 2016, 6, 1108. [Google Scholar] [CrossRef] [PubMed]
- Livak, K.J.; Schmittgen, T.D. Analysis of relative gene expression data using real-time quantitative PCR and the 2−ΔΔCT method. Methods 2001, 25, 402–408. [Google Scholar] [CrossRef] [PubMed]
- Lyu, F.; Han, F.; Ge, C.; Mao, W.; Chen, L.; Hu, H.; Chen, G.; Lang, Q.; Fang, C. OmicStudio: A composable bioinformatics cloud platform with real-time feedback that can generate high-quality graphs for publication. iMeta 2023, 2, e85. [Google Scholar] [CrossRef]


Disclaimer/Publisher’s Note: The statements, opinions and data contained in all publications are solely those of the individual author(s) and contributor(s) and not of MDPI and/or the editor(s). MDPI and/or the editor(s) disclaim responsibility for any injury to people or property resulting from any ideas, methods, instructions or products referred to in the content. |
© 2024 by the authors. Licensee MDPI, Basel, Switzerland. This article is an open access article distributed under the terms and conditions of the Creative Commons Attribution (CC BY) license (https://creativecommons.org/licenses/by/4.0/).
Share and Cite
Sun, J.; Wang, Y.; Zhang, X.; Cheng, Z.; Song, Y.; Li, H.; Wang, N.; Liu, S.; Cao, Z.; Li, H.; et al. Transcriptomic and Metabolomic Analyses Reveal the Role of Phenylalanine Metabolism in the Maize Response to Stalk Rot Caused by Fusarium proliferatum. Int. J. Mol. Sci. 2024, 25, 1492. https://doi.org/10.3390/ijms25031492
Sun J, Wang Y, Zhang X, Cheng Z, Song Y, Li H, Wang N, Liu S, Cao Z, Li H, et al. Transcriptomic and Metabolomic Analyses Reveal the Role of Phenylalanine Metabolism in the Maize Response to Stalk Rot Caused by Fusarium proliferatum. International Journal of Molecular Sciences. 2024; 25(3):1492. https://doi.org/10.3390/ijms25031492
Chicago/Turabian StyleSun, Jianjun, Yanzhao Wang, Xingrui Zhang, Zeqiang Cheng, Yinghui Song, Huimin Li, Na Wang, Shen Liu, Zijia Cao, Hongxia Li, and et al. 2024. "Transcriptomic and Metabolomic Analyses Reveal the Role of Phenylalanine Metabolism in the Maize Response to Stalk Rot Caused by Fusarium proliferatum" International Journal of Molecular Sciences 25, no. 3: 1492. https://doi.org/10.3390/ijms25031492
APA StyleSun, J., Wang, Y., Zhang, X., Cheng, Z., Song, Y., Li, H., Wang, N., Liu, S., Cao, Z., Li, H., Zheng, W., Duan, C., & Cao, Y. (2024). Transcriptomic and Metabolomic Analyses Reveal the Role of Phenylalanine Metabolism in the Maize Response to Stalk Rot Caused by Fusarium proliferatum. International Journal of Molecular Sciences, 25(3), 1492. https://doi.org/10.3390/ijms25031492