

Enhancing Rats’ Diet with Ethyl Esters Derived from Linseed Oil and Examining the Resulting Changes in Their Blood Fatty Acid Profile


Abstract
1. Introduction
2. Results
2.1. Body Weight
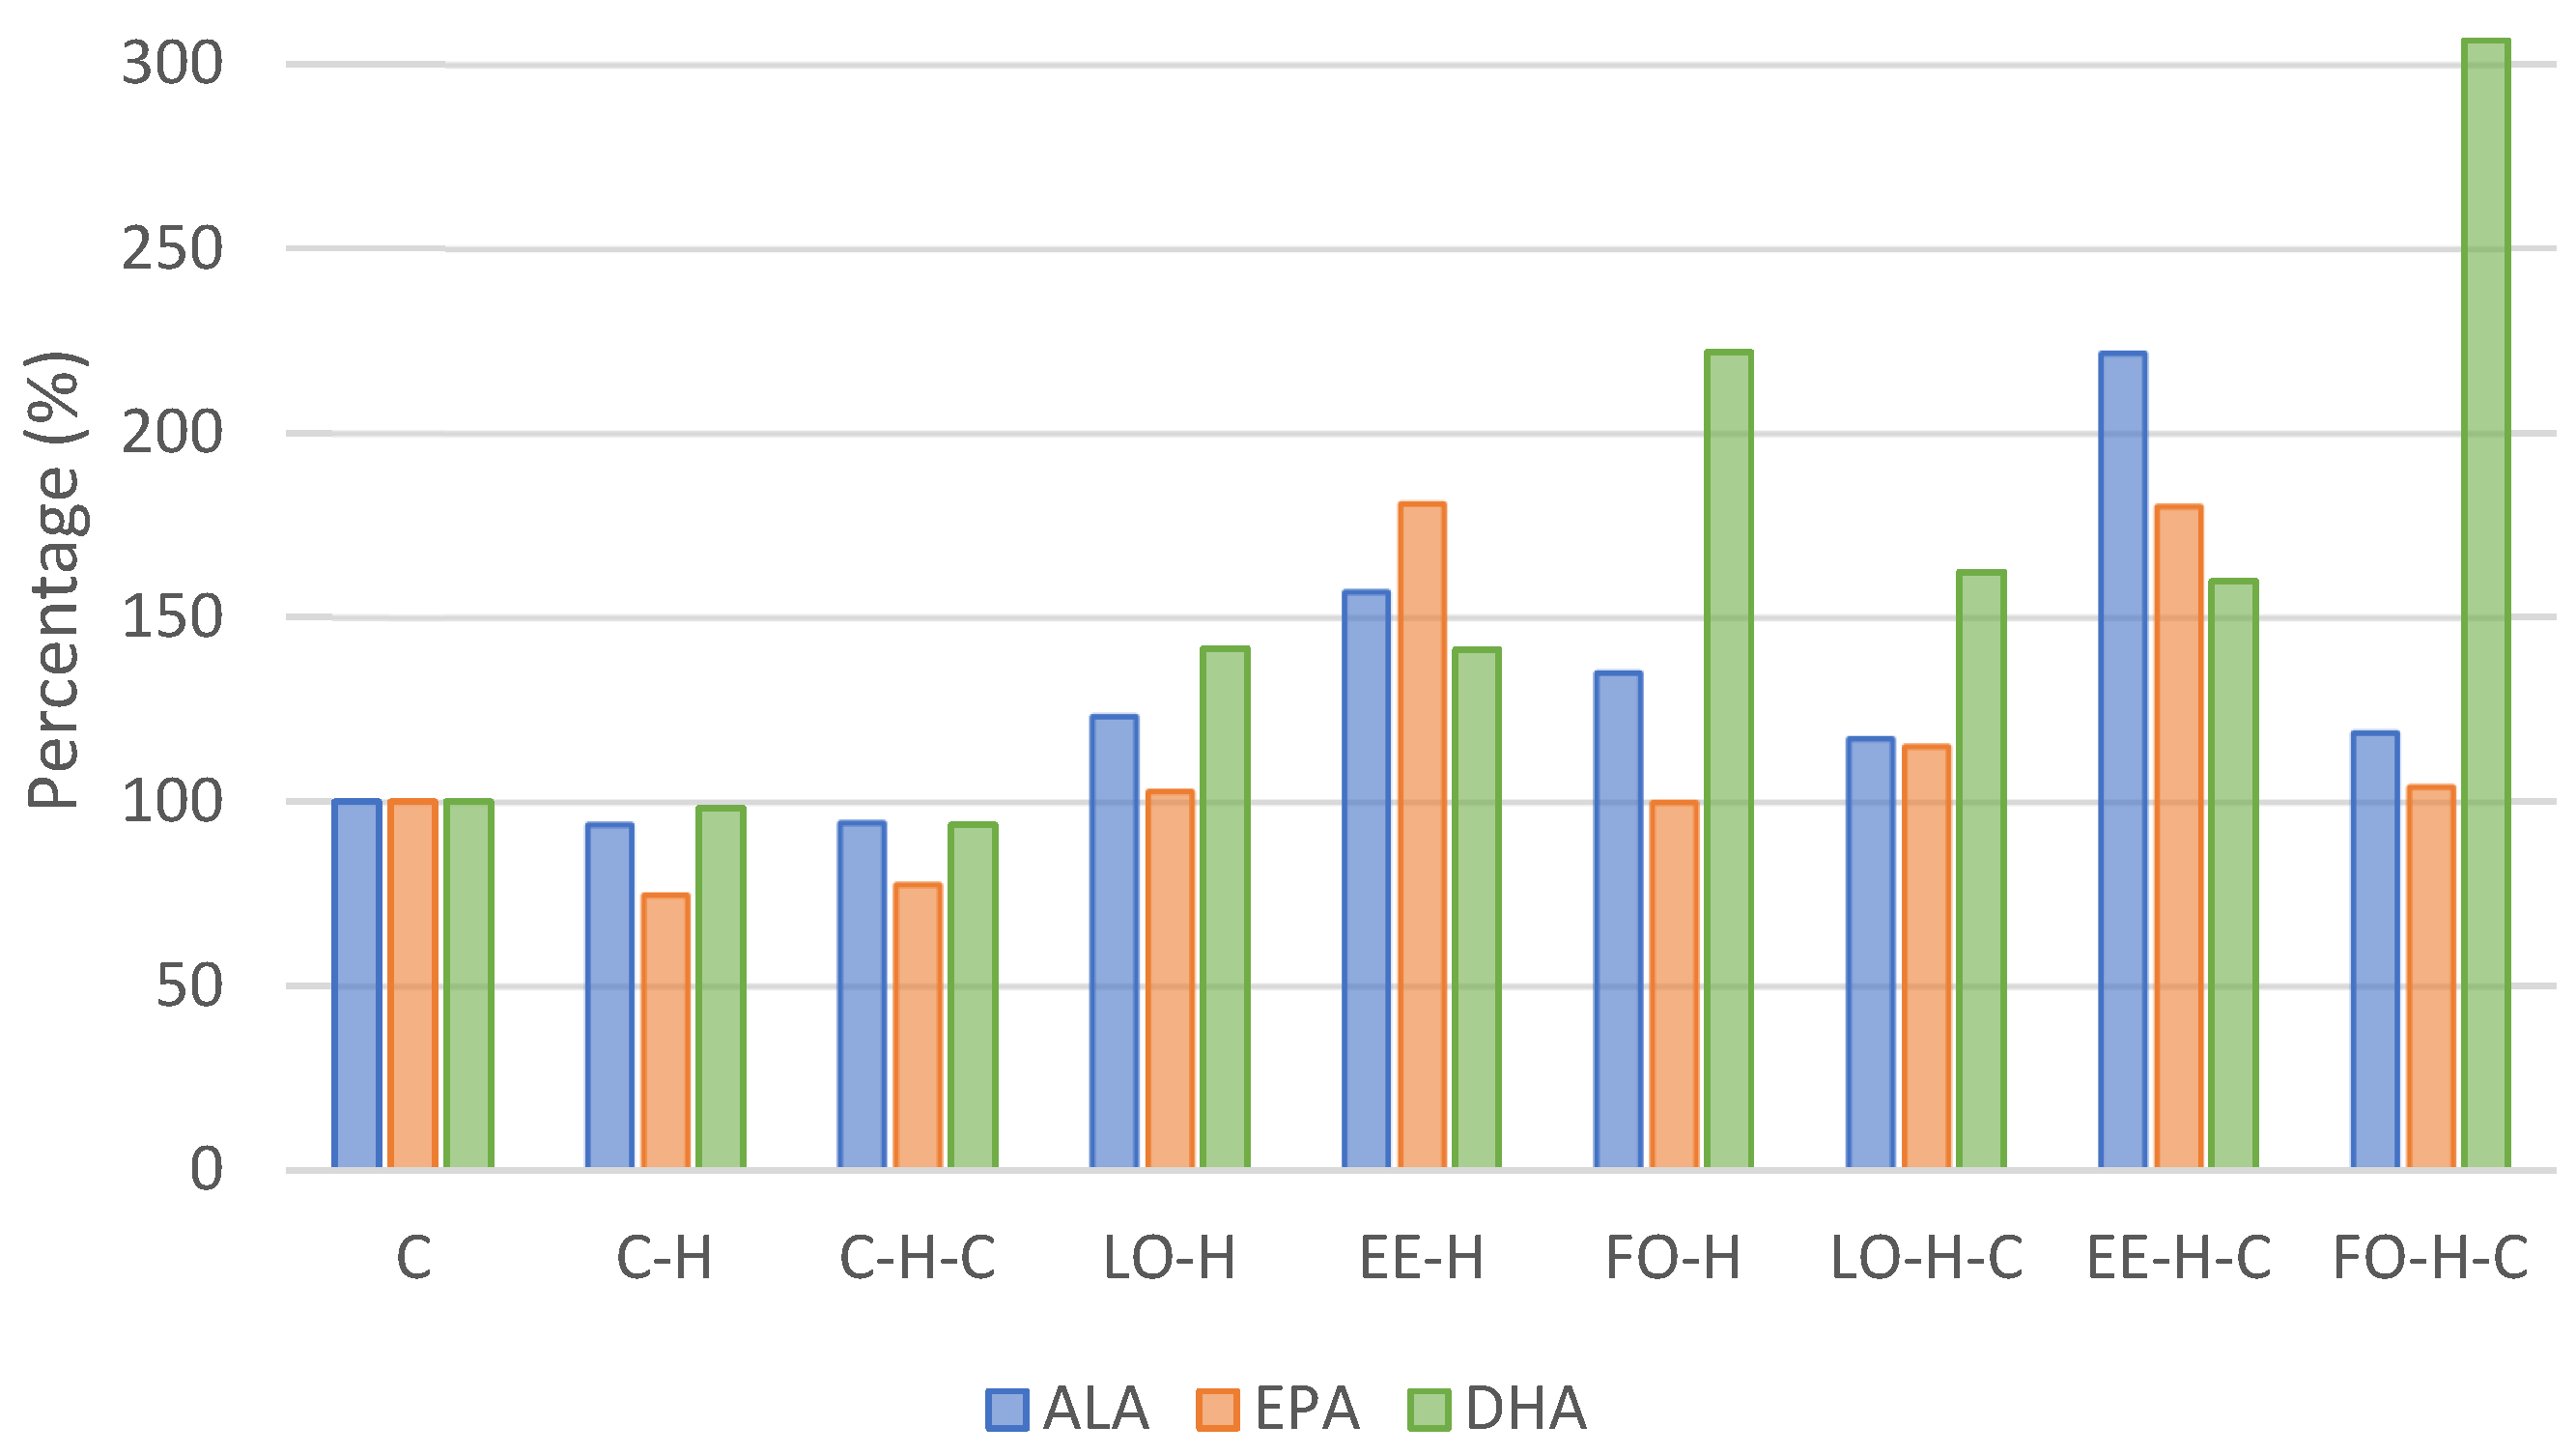
2.2. Fatty Acids Composition of Erythrocytes
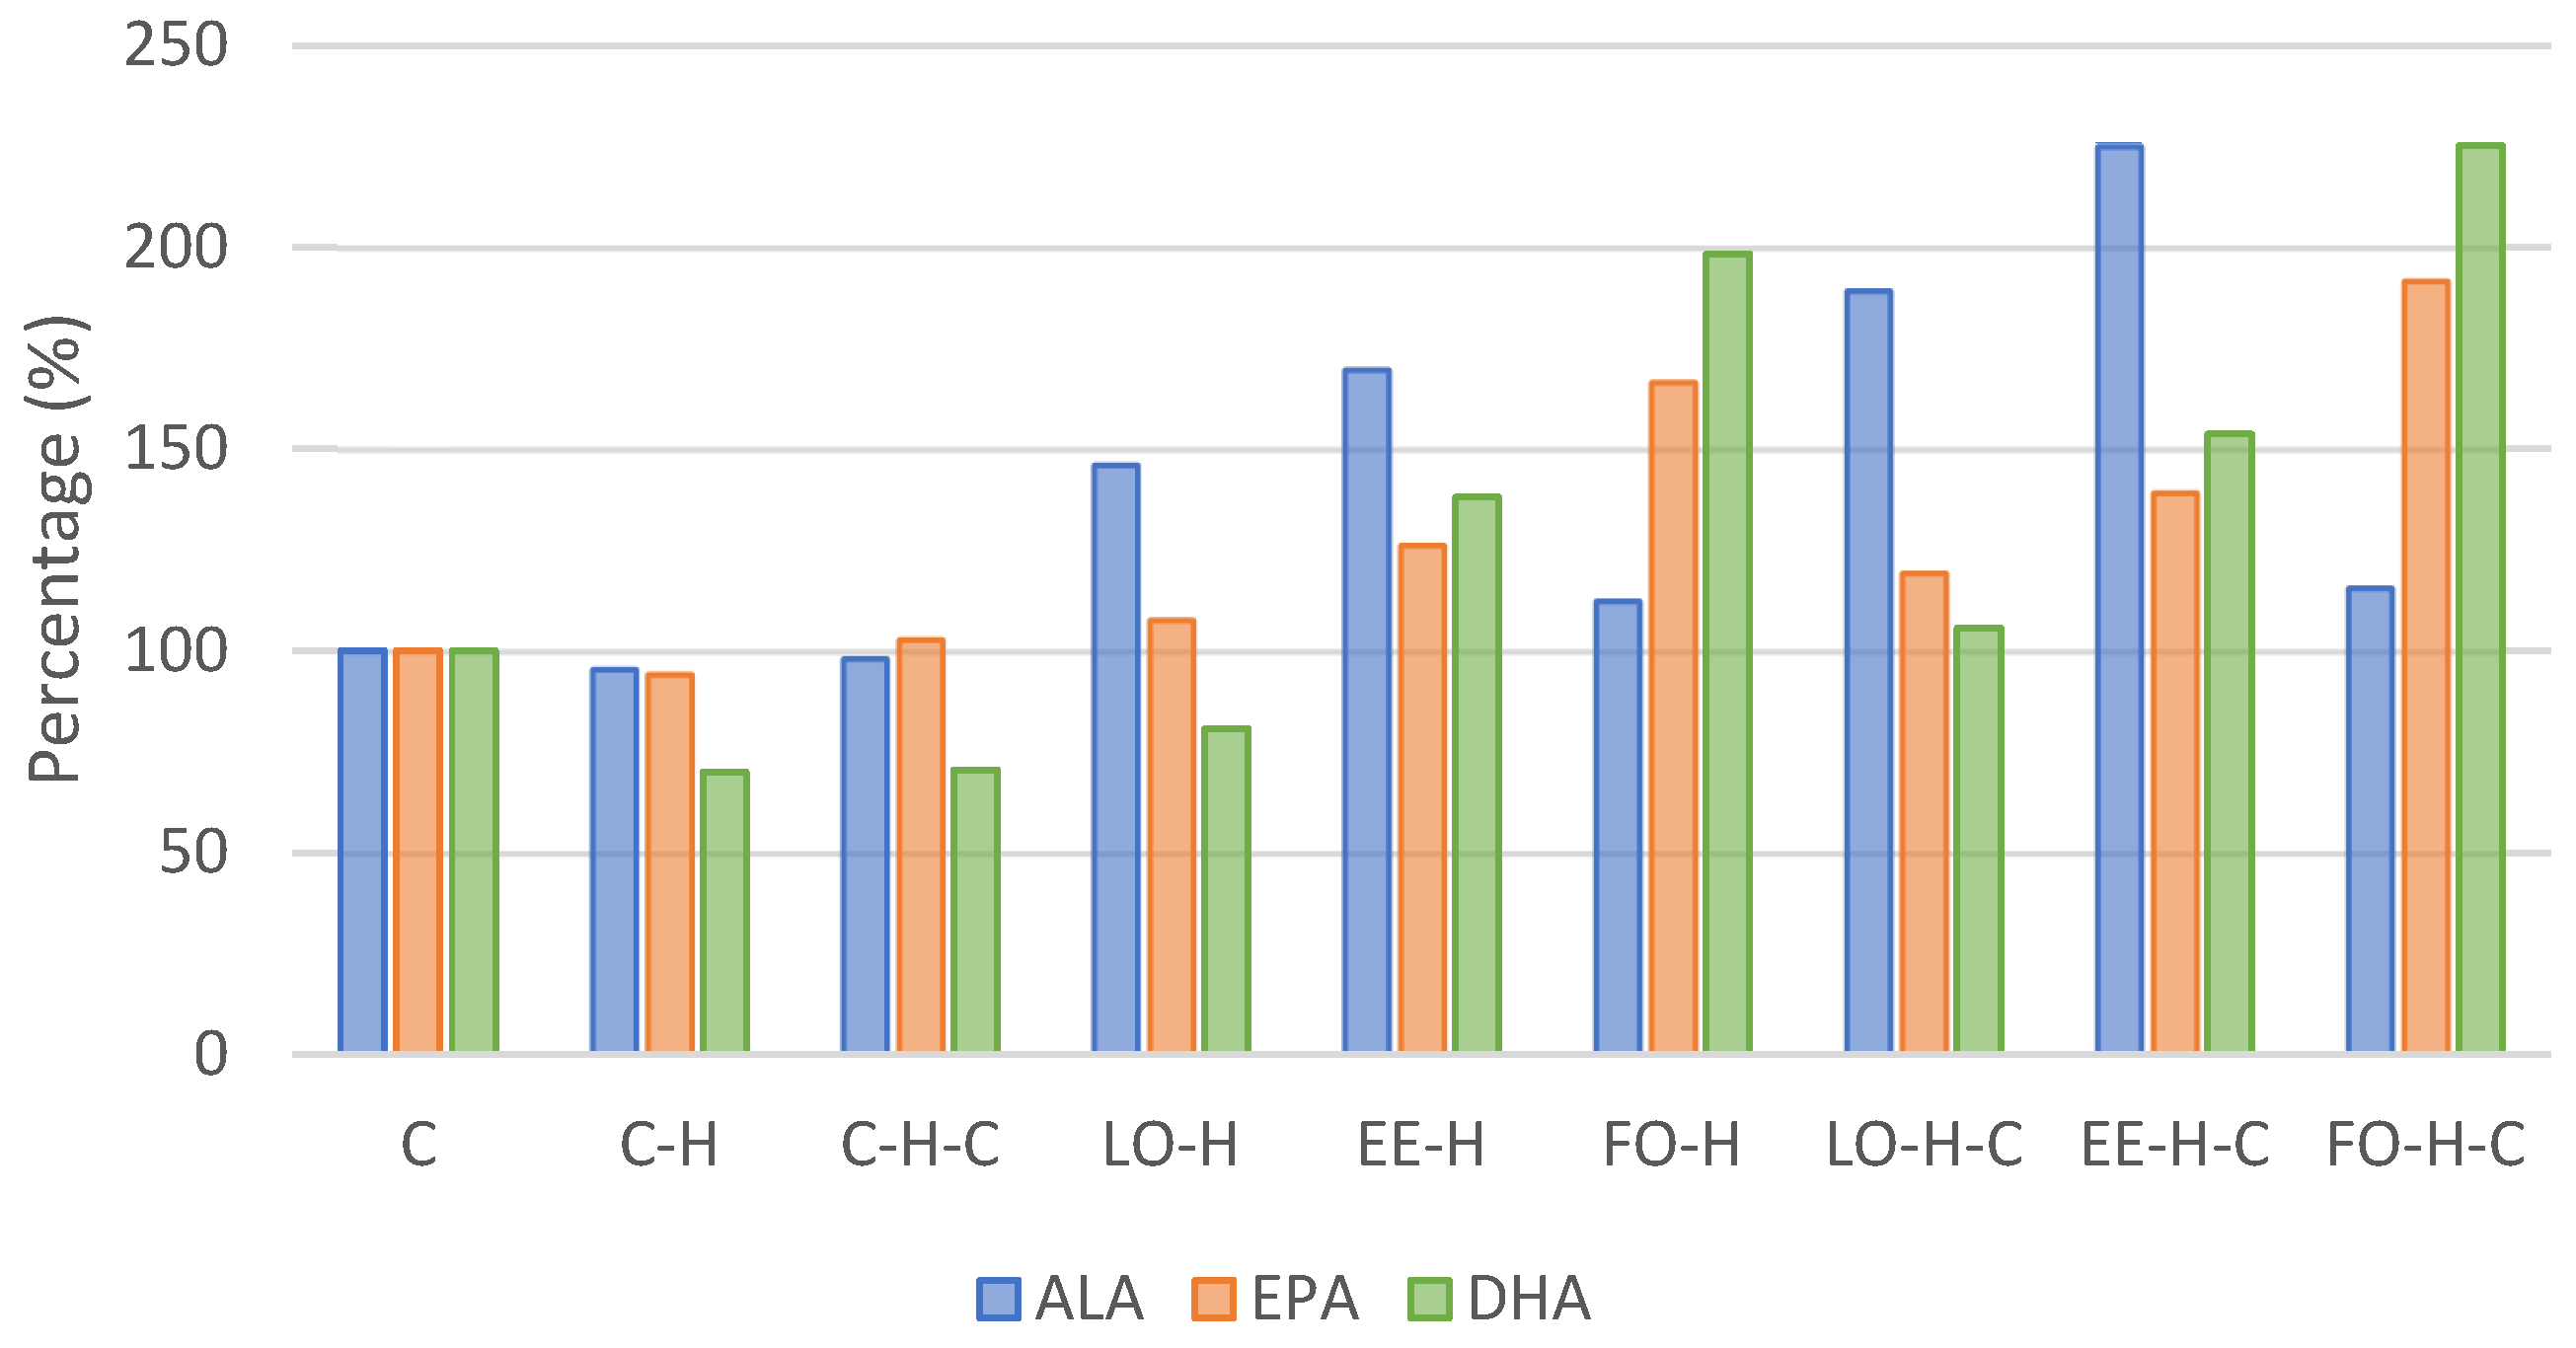
2.3. Fatty Acids Composition of Blood Serum
3. Discussion
4. Materials and Methods
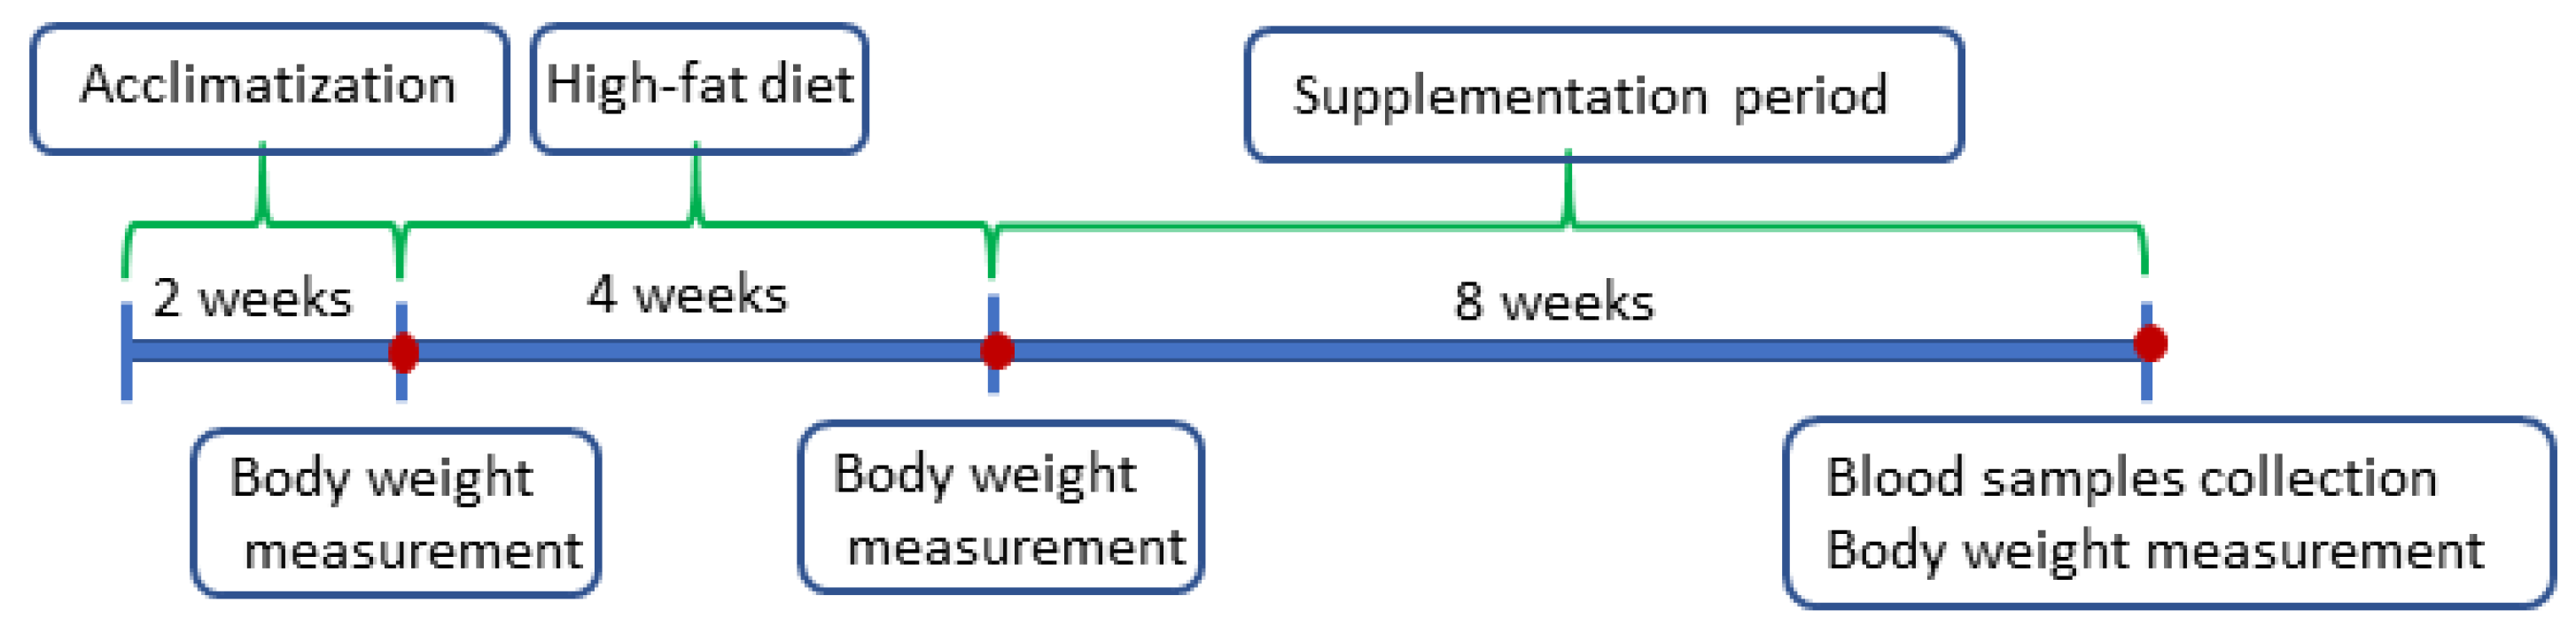
4.1. Animals and Scheme of the Experiment
4.2. Supplements
4.3. Blood Sampling and Analyses
4.4. Statistical Analysis
5. Conclusions
Author Contributions
Funding
Institutional Review Board Statement
Informed Consent Statement
Data Availability Statement
Conflicts of Interest
References
- Bekhit, A.E.D.A.; Shavandi, A.; Jodjaja, T.; Birch, J.; Teh, S.; Ahmed, I.A.M.A.; Al-Juhaimi, F.Y.; Saeedi, P.; Bekhit, A.A. Flaxseed: Composition, detoxification, utilization, and opportunities. Biocatal. Agric. Biotechnol. 2018, 13, 129–152. [Google Scholar] [CrossRef]
- Sachdev, N.; Priya, V.; Rengasamy, G. Paleo Diet—A Review. Int. J. Res. Pharm. Sci. 2018, 9, 427–429. [Google Scholar]
- Simopoulos, A.P. Evolutionary aspects of diet, the omega-6/omega-3 ratio and genetic variation: Nutritional implications for chronic diseases. Biomed. Pharm. 2006, 60, 502–507. [Google Scholar] [CrossRef]
- Zárate, R.; El Jaber-Vazdekis, N.; Tejera, N.; Pérez, J.A.; Rodríguez, C. Significance of long chain polyunsaturated fatty acids in human health. Clin. Trans. Med. 2017, 6, 25. [Google Scholar] [CrossRef]
- Czyż, K.; Sokoła-Wysoczańska, E.; Bodkowski, R.; Cholewińska, P.; Wyrostek, A. Dietary omega-3 source effect on the fatty acid profile of intramuscular and perimuscular fat—Preliminary study on a rat model. Nutrients 2020, 12, 3382. [Google Scholar] [CrossRef]
- Czyż, K.; Sokoła-Wysoczańska, E.; Wyrostek, A.; Cholewińska, P. An attempt to enrich pig meat with omega-3 fatty acids using linseed oil ethyl ester diet supplement. Agriculture 2021, 11, 365. [Google Scholar] [CrossRef]
- Sokoła-Wysoczańska, E.; Wysoczański, T.; Czyż, K.; Vogt, A.; Patkowska-Sokoła, B.; Sokoła, K.; Bodkowski, R.; Wyrostek, A.; Roman, K. Characteristics of polyunsaturated fatty acids ethyl esters from of high alpha-linolenic acid content as a component of biologically active health promoting supplements. Przem. Chem. 2014, 93, 1923–1927. [Google Scholar]
- Sokoła-Wysoczańska, E.; Czyż, K.; Wyrostek, A. Different Sources of Omega-3 Fatty Acid Supplementation vs. Blood Lipid Profiles—A Study on a Rat Model. Foods 2024, 13, 385. [Google Scholar] [CrossRef]
- Yashodhara, B.M.; Umakanth, S.; Pappachan, J.M.; Bhat, S.K.; Kamath, R.; Choo, B.H. Omega-3 fatty acids: A comprehensive review of their role in health and disease. Postgrad. Med. J. 2009, 85, 84–90. [Google Scholar] [CrossRef]
- Sokoła-Wysoczańska, E.; Wysoczański, T.; Wagner, J.; Czyż, K.; Bodkowski, R.; Lochyński, S.; Patkowska-Sokoła, B. Polyunsaturated Fatty Acids and Their Potential Therapeutic Role in Cardiovascular System Disorders—A Review. Nutrients 2018, 10, 1561. [Google Scholar] [CrossRef]
- Horman, T.; Fernandes, M.F.; Tache, M.C.; Hucik, B.; Mutch, D.M.; Leri, F. Dietary n-6/n-3 Ratio Influences Brain Fatty Acid Composition in Adult Rats. Nutrients 2020, 12, 1847. [Google Scholar] [CrossRef] [PubMed]
- Ilich, J.Z.; Kelly, O.J.; Kim, Y.; Spicer, M.T. Low-grade chronic inflammation perpetuated by modern diet as a promoter of obesity and osteoporosis. Arh. Hig. Rada Toksikol. 2014, 65, 139–148. [Google Scholar] [CrossRef] [PubMed]
- Speer, K.; Upton, D.; Semple, S.; McKune, A. Systemic low-grade inflammation in post-traumatic stress disorder: A systematic review. J. Inflamm. Res. 2018, 11, 111–121. [Google Scholar] [CrossRef] [PubMed]
- Kälsch, A.; Scharnagl, H.; Kleber, M.E.; Windpassinger, C.; Sattler, W.; Leipe, J.; Krämer, B.K.; März, W.; Malle, E. Long- and short-term association of low-grade systemic inflammation with cardiovascular mortality in the LURIC study. Clin. Res. Cardiol. 2020, 109, 358–373. [Google Scholar] [CrossRef]
- Guarner, V.; Rubio-Ruiz, M.E. Low-Grade Systemic Inflammation Connects Aging, Metabolic Syndrome and Cardiovascular Disease. In Aging and Health—A Systems Biology Perspective; Yashin, A.I., Jazwinski, S.M., Eds.; Interdisciplinary Topics in Gerontology: Basel, Switzerland, 2015; Volume 40, pp. 99–106. [Google Scholar]
- Peng, Y.; Ren, H.; Tao, H.; He, C.; Li, P.; Wan, J.B.; Su, H. Metabolomics study of the anti-inflammatory effects of endogenous omega-3 polyunsaturated fatty acids. RSC Adv. 2019, 9, 41903. [Google Scholar] [CrossRef]
- DiNicolantonio, J.J.; O’Keefe, J.H. Importance of maintaining a low omega–6/omega–3 ratio for reducing inflammation. Open Heart 2018, 5, e000946. [Google Scholar] [CrossRef]
- Campos, J.R.; Severino, P.; Ferreira, C.S.; Zielinska, A.; Santini, A.; Souto, S.B.; Souto, E.B. Linseed Essential Oil—Source of Lipids as Active Ingredients for Pharmaceuticals and Nutraceuticals. Curr. Med. Chem. 2019, 26, 4537–4558. [Google Scholar] [CrossRef]
- Shadyro, O.I.; Sosnovskaya, A.A.; Edimecheva, I.P. Flaxseed oil stabilization using natural and synthetic antioxidants. Eur. J. Lipid Sci. Technol. 2017, 119, 1700079. [Google Scholar] [CrossRef]
- Bays, H. Clinical overview of Omacor: A concentrated formulation of omega-3 polyunsaturated fatty acids. Am. J. Cardiol. 2006, 98, 71i–76i. [Google Scholar] [CrossRef]
- Myhre, A.M.; Carlsen, M.H.; Bøhn, S.K.; Wold, H.L.; Laake, P.; Blomhoff, R. Water-miscible, emulsified, and solid forms of retinol supplements are more toxic than oil-based preparations. Am. J. Clin. Nutr. 2003, 78, 1152–1159. [Google Scholar] [CrossRef]
- Sala-Vila, A.; Fleming, J.; Kris-Etherton, P.; Ros, E. Impact of α-Linolenic Acid, the Vegetable ω-3 Fatty Acid, on Cardiovascular Disease and Cognition. Adv. Nutr. 2022, 13, 1584–1602. [Google Scholar] [CrossRef] [PubMed]
- Leung, K.S.; Galano, J.M.; Oger, C.; Durand, T.; Lee, J.C. Enrichment of alpha-linolenic acid in rodent diet reduced oxidative stress and inflammation during myocardial infarction. Free Radic. Biol. Med. 2021, 162, 53–64. [Google Scholar] [CrossRef] [PubMed]
- Ghule, A.E.; Kandhare, A.D.; Jadhav, S.S.; Zanwar, A.A.; Bodhankar, S.L. Omega-3-fatty acid adds to the protective effect of flax lignan concentrate in pressure overload-induced myocardial hypertrophy in rats via modulation of oxidative stress and apoptosis. Int. Immunopharmacol. 2015, 28, 751–763. [Google Scholar] [CrossRef] [PubMed]
- Daneshmand, R.; Kurl, S.; Tuomainen, T.-P.; Virtanen, J.K. Associations of estimated Δ-5-desaturase and Δ-6-desaturase activities with stroke risk factors and risk of stroke: The Kuopio Ischaemic Heart Disease Risk Factor Study. Br. J. Nutr. 2017, 117, 582–590. [Google Scholar] [CrossRef]
- Young, G.S.; Conquer, J.A.; Thomas, R. Effect of randomized supplementation with high dose olive, flax or fish oil on serum phospholipid fatty acid levels in adults with attention deficit hyperactivity disorder. Reprod. Nutr. Dev. 2005, 45, 549–558. [Google Scholar] [CrossRef]
- Liu, H.; Wang, F.; Liu, X.; Xie, Y.; Xia, H.; Wang, S.; Sun, G. Effects of marine-derived and plant-derived omega-3 polyunsaturated fatty acids on erythrocyte fatty acid composition in type 2 diabetic patients. Lipids Health Dis. 2022, 21, 20. [Google Scholar] [CrossRef]
- Barceló-Coblijn, G.; Murphy, E.J.; Othman, R.; Moghadasian, M.H.; Kashour, T.; Friel, J.K. Flaxseed oil and fish-oil capsule consumption alters human red blood cell n–3 fatty acid composition: A multiple-dosing trial comparing 2 sources of n–3 fatty acid. Am. J. Clin. Nutr. 2008, 88, 801–809. [Google Scholar] [CrossRef]
- Arab, L. Biomarkers of Fat and Fatty Acid Intake. J. Nutr. 2003, 133, 925S–932S. [Google Scholar] [CrossRef]
- Hodson, L.; Skeaff, C.M.; Fielding, B.A. Fatty acid composition of adipose tissue and blood in humans and its use as a biomarker of dietary intake. Prog. Lipid Res. 2008, 47, 348–380. [Google Scholar] [CrossRef]
- Harris, W.S.; von Schacky, C. The Omega-3 Index: A new risk factor for death from CHD? Prev. Med. 2004, 39, 212–220. [Google Scholar] [CrossRef]
- Stark, K.D.; Aristizabal Henao, J.J.; Metherel, A.H.; Pilote, L. Translating plasma and whole blood fatty acid compositional data into the sum of eicosapentaenoic and docosahexaenoic acid in erythrocytes. Prostaglandins Leukot. Essent. Fat. Acids 2016, 104, 1–10. [Google Scholar] [CrossRef] [PubMed]
- Hu, X.F.; Sandhu, S.K.; Harris, W.S.; Chan, H.M. Conversion ratios ofn-3 fatty acids between plasma and erythrocytes: A systematic review and meta-regression. Br. J. Nutr. 2017, 117, 1162–1173. [Google Scholar] [CrossRef] [PubMed]
- Kołodziej, H.; Vogt, A.; Strzelecki, S.; Steinmetz, G. Method of Manufacturing the Ethyl or Methyl Esters of Higher Fatty Acids and the Installation to Execute This Method. Polish Patent PL211325, 31 May 2012. [Google Scholar]
- Kroger, J.; Zietemann, V.; Enzenbach, C.; Weikert, C.; Jansen, E.H.; Doring, F.; Joost, H.G.; Boeing, H.; Schulze, M.B. Erythrocyte membrane phospholipid fatty acids, desaturase activity, and dietary fatty acids in relation to risk of type 2 diabetes in the European Prospective Investigation into Cancer and Nutrition (EPIC)–Potsdam Study. Am. J. Clin. Nutr. 2011, 93, 127–142. [Google Scholar] [CrossRef] [PubMed]
- Prescha, A.; Swiedrych, A.; Biernat, J.; Szopa, J. Increase in lipid content in potato tubers modified by 14-3-3 gene overexpression. J. Agric. Food Chem. 2001, 49, 3638–3643. [Google Scholar] [CrossRef]
- Ulbricht, T.L.V.; Southgate, D.A.T. Coronary heart disease: Seven dietary factors. Lancet 1991, 338, 985–992. [Google Scholar] [CrossRef]
- De Lorenzo, A.; Petroni, M.L.; De Luca, P.P.; Andreoli, A.; Morini, P.; Iacopino, L.; Innocente, I.; Perriello, G. Use of quality control indices in moderately hypocaloric Mediterranean diet for treatment of obesity. Diabetes Nutr. Metab. 2001, 14, 181–188. [Google Scholar]

| Groups | ||||||||||
|---|---|---|---|---|---|---|---|---|---|---|
| C | C-H | C-H-C | LO-H | EE-H | FO-H | LO-H-C | EE-H-C | FO-H-C | ||
| After acclimatization | mean | 378.5 | 384.8 | 374.0 | 388.0 | 371.8 | 378.3 | 381.7 | 392.2 | 392.8 |
| SD | 9.6 | 17.8 | 12.3 | 22.4 | 14.1 | 17.8 | 22.5 | 11.2 | 14.8 | |
| Beginning of supplementation | mean | 460.3 | 473.2 | 439.5 | 445.0 | 435.5 | 456.5 | 459.0 | 433.5 | 450.7 |
| SD | 15.0 | 38.5 | 17.3 | 45.1 | 27.9 | 27.1 | 34.6 | 13.2 | 14.1 | |
| End of the experiment | mean | 575.7 b | 651.3 a | 518.3 d | 553.0 b,d | 587.8 b,c | 630.0 a,c | 580.5 b | 571.5 b | 587.3 b,c |
| SD | 16.2 | 25.4 | 35.3 | 25.6 | 20.4 | 17.8 | 26.0 | 18.3 | 20.6 | |
| Fatty Acid | Group | |||||||||
|---|---|---|---|---|---|---|---|---|---|---|
| C | C-H | C-H-C | LO-H | EE-H | FO-H | LO-H-C | EE-H-C | FO-H-C | ||
| Saturated fatty acids | ||||||||||
| Lauric acid C12:0 | X | 0.284 b,c | 0.476 a | 0.357 a,c | 0.353 a,c | 0.400 a,c | 0.289 b,c | 0.305 b,c | 0.341 a,c | 0.273 b,c |
| SD | 0.060 | 0.134 | 0.107 | 0.086 | 0.098 | 0.035 | 0.071 | 0.076 | 0.088 | |
| Myristic acid C14:0 | X | 1.003 | 1.271 | 1.216 | 1.308 | 1.376 | 1.264 | 0.995 | 1.227 | 0.996 |
| SD | 0.477 | 0.093 | 0.302 | 0.082 | 0.100 | 0.167 | 0.208 | 0.453 | 0.227 | |
| Palmitic acid C16:0 | X | 23.260 b,c | 26.024 a,c | 27.485 a | 25.422 a,c | 23.690 b,c | 25.763 a,c | 23.814 b,c | 24.842 a,c | 23.128 b,c |
| SD | 1.947 | 1.959 | 1.494 | 1.864 | 1.260 | 1.582 | 1.065 | 2.464 | 2.444 | |
| Margaric acid C17:0 | X | 0.390 b,c,d,e | 0.599 a | 0.491 a,e | 0.596 a | 0.525 a,c | 0.599 a | 0.440 b,c,d,e | 0.492 a,d | 0.384 b,d,e |
| SD | 0.078 | 0.079 | 0.083 | 0.043 | 0.037 | 0.089 | 0.066 | 0.149 | 0.082 | |
| Stearic acid C18:0 | X | 9.679 b,c,d | 10.817 a,c | 10.229 a,d | 11.601 a | 10.676 a,d | 10.717 a,d | 9.929 b,c,d | 9.608 b,c,d | 8.647 b |
| SD | 1.003 | 1.001 | 0.633 | 0.970 | 0.844 | 1.040 | 0.887 | 0.763 | 0.907 | |
| Arachidic acid C20:0 | X | 0.418 a,c | 0.275 b,c,d | 0.244 b,d | 0.304 a,d | 0.347 a,d | 0.324 a,d | 0.327 a,d | 0.417 a,c | 0.464 a |
| SD | 0.093 | 0.065 | 0.054 | 0.054 | 0.067 | 0.081 | 0.096 | 0.069 | 0.223 | |
| Behenic acid C22:0 | X | 0.275 b | 0.321 b | 0.291 b | 0.336 b | 0.238 b | 0.279 b | 0.866 a | 0.227 b | 0.656 a |
| SD | 0.123 | 0.144 | 0.087 | 0.160 | 0.041 | 0.079 | 0.333 | 0.067 | 0.247 | |
| Tricosanoic acid C23:0 | X | 0.763 | 0.474 a | 0.327 a | 0.478 a | 0.649 | 0.414 a | 0.646 | 0.830 | 0.993 b |
| SD | 0.439 | 0.059 | 0.037 | 0.147 | 0.249 | 0.346 | 0.286 | 0.497 | 0.408 | |
| Lignoceric acid C24:0 | X | 0.188 e | 0.329 e | 0.256 e | 0.943 b,d | 1.168 a,d | 1.755 a | 1.109 b,c,d | 1.559 a,c | 1.068 b,c,d |
| SD | 0.110 | 0.083 | 0.027 | 0.212 | 0.402 | 0.352 | 0.332 | 0.849 | 0.344 | |
| Unsaturated fatty acids | ||||||||||
| Palmitoleic acid C16:1 | X | 1.117 a | 0.821 d,e,g | 1.065 a,c | 0.561 f,h | 0.762 e,g,h | 0.651 e,g,h | 0.721 e,g,h | 0.866 b,c,e | 0.842 c,g |
| SD | 0.098 | 0.104 | 0.094 | 0.082 | 0.141 | 0.082 | 0.088 | 0.130 | 0.313 | |
| Margarinoleic acid C17:1 | X | 0.998 | 1.123 a | 1.061 a | 1.118 a | 0.826 | 0.904 | 0.937 | 0.889 | 0.664 b |
| SD | 0.205 | 0.149 | 0.083 | 0.138 | 0.121 | 0.358 | 0.346 | 0.223 | 0.296 | |
| Oleic acid C18:1n9 | X | 25.747 a | 20.421 b | 20.886 | 20.111 b | 23.598 | 20.545 b | 22.327 | 22.509 | 23.230 |
| SD | 4.421 | 2.056 | 1.711 | 2.699 | 2.724 | 1.850 | 2.793 | 4.788 | 3.520 | |
| Linoleic acid C18:2n6 | X | 19.529 | 16.626 a | 17.105 | 18.408 | 19.968 | 18.016 | 20.969 b | 19.074 | 20.994 b |
| SD | 3.245 | 2.431 | 1.989 | 1.488 | 2.991 | 2.841 | 1.963 | 2.961 | 2.211 | |
| Alpha-linolenic acid C18:3n3 | X | 1.852 c,d,e,f,g | 1.740 c,d,e,f,g | 1.751 c,d,e,f,g | 2.284 b,e | 2.909 b | 2.502 b,d | 2.171 b,g | 4.108 a | 2.202 b,f |
| SD | 0.496 | 0.487 | 0.478 | 0.478 | 0.855 | 1.023 | 0.471 | 0.810 | 0.204 | |
| Eicosenic acid C20:1n9 | X | 0.606 | 0.569 | 0.576 | 0.635 | 0.779 | 0.925 | 0.613 | 0.852 | 0.957 |
| SD | 0.130 | 0.244 | 0.140 | 0.247 | 0.260 | 0.356 | 0.225 | 0.349 | 0.627 | |
| c Eicosadienoic acid C20:2 | X | 0.206 a,c | 0.218 a,c | 0.265 | 0.246 | 0.252 | 0.300 b | 0.270 | 0.274 | 0.216 c |
| SD | 0.016 | 0.038 | 0.032 | 0.023 | 0.035 | 0.075 | 0.047 | 0.076 | 0.066 | |
| Arachidonic acid C20:4n6 | X | 10.649 b,c,d | 14.033 a | 13.523 a,c | 11.818 a,d | 8.751 b,d,f | 9.303 b,d,e | 10.485 b,c,d | 8.351 b,f | 6.747 e,f |
| SD | 3.152 | 2.104 | 1.392 | 0.913 | 1.453 | 1.475 | 2.134 | 2.080 | 2.000 | |
| Eicosapentaenoic acid C20:5n3 | X | 0.305 c | 0.228 c | 0.237 c | 0.314 c | 0.552 a | 0.305 c | 0.351 a,c | 0.550 a | 0.318 b,c |
| SD | 0.114 | 0.032 | 0.035 | 0.077 | 0.208 | 0.058 | 0.142 | 0.232 | 0.050 | |
| Docosahexaenoic acid C22:6n3 | X | 1.292 d,e,f | 1.270 d,e,f | 1.211 d | 1.828 c,e | 1.826 c,f | 2.866 b | 2.099 c | 2.063 c | 3.959 a |
| SD | 0.350 | 0.106 | 0.250 | 0.327 | 0.287 | 0.625 | 0.280 | 0.193 | 0.523 | |
| Nervonic acid C24:1 | X | 0.152 c,e | 0.554 a,c | 0.625 a | 0.661 a | 0.117 c,f,g | 0.508 a,e | 0.198 b,c,d,e,f | 0.185 c,d,e,g | 0.522 a,d |
| SD | 0.054 | 0.158 | 0.178 | 0.288 | 0.067 | 0.260 | 0.134 | 0.074 | 0.455 | |
| other | X | 1.287 | 1.810 | 0.799 a | 0.676 a | 0.591 a | 1.772 | 0.428 a | 0.736 a | 2.737 b |
| SD | 0.929 | 0.704 | 0.538 | 0.256 | 1.036 | 1.183 | 0.265 | 0.496 | 2.797 | |
| Parameter | Group | |||||||||
|---|---|---|---|---|---|---|---|---|---|---|
| C | C-H | C-H-C | LO-H | EE-H | FO-H | LO-H-C | EE-H-C | FO-H-C | ||
| Total SFA | X | 36.259 a,d | 40.586 | 40.896 | 41.341 b | 39.069 | 41.404 b | 38.431 | 39.544 | 36.611 c,d |
| SD | 3.041 | 2.872 | 1.759 | 2.801 | 2.074 | 2.595 | 1.604 | 4.382 | 3.722 | |
| Total UFA | X | 62.454 a | 57.604 b | 58.304 | 57.983 b | 60.34 | 56.824 b | 61.141 | 59.72 | 60.652 |
| SD | 2.795 | 2.65 | 1.89 | 2.843 | 2.051 | 3.047 | 1.718 | 4.039 | 2.404 | |
| Total MUFA | X | 28.621 a | 23.489 b | 24.212 | 23.085 b | 26.083 | 23.532 b | 24.795 | 25.301 | 26.216 |
| SD | 4.155 | 2.154 | 1.537 | 2.954 | 2.792 | 1.909 | 2.946 | 4.371 | 3.443 | |
| Total PUFA | X | 33.832 | 34.115 | 34.092 | 34.898 | 34.258 | 33.292 | 36.346 | 34.42 | 34.436 |
| SD | 2.43 | 1.121 | 1.456 | 1.455 | 3.399 | 2.916 | 2.268 | 3.243 | 3.064 | |
| PUFA/MUFA | X | 1.209 | 1.462 | 1.414 | 1.534 | 1.334 | 1.425 | 1.491 | 1.407 | 1.344 |
| SD | 0.22 | 0.131 | 0.118 | 0.209 | 0.235 | 0.192 | 0.256 | 0.328 | 0.27 | |
| PUFA/UFA | X | 0.543 | 0.593 | 0.585 | 0.603 | 0.567 | 0.585 | 0.595 | 0.578 | 0.568 |
| SD | 0.05 | 0.022 | 0.021 | 0.034 | 0.049 | 0.032 | 0.041 | 0.057 | 0.051 | |
| UFA/SFA | X | 1.737 a,c | 1.430 b,d | 1.430 b,d | 1.413 b,d | 1.55 | 1.381 b | 1.595 | 1.536 | 1.676 c,d |
| SD | 0.206 | 0.173 | 0.11 | 0.172 | 0.133 | 0.165 | 0.112 | 0.27 | 0.218 | |
| Total n3 | X | 3.449 e,g | 3.238 e | 3.198 e | 4.426 b,d,f,g | 5.287 b,c,d | 5.673 a,c | 4.622 b,c,f | 6.721 a | 6.479 a |
| SD | 0.641 | 0.553 | 0.62 | 0.434 | 0.698 | 1.193 | 0.338 | 0.658 | 0.558 | |
| Total n6 | X | 30.177 | 30.659 | 30.628 | 30.226 | 28.718 | 27.319 a | 31.454 b | 27.425 a | 27.741 a |
| SD | 2.026 | 0.854 | 1.35 | 1.165 | 3.494 | 1.986 | 2.058 | 2.871 | 2.877 | |
| Total n9 | X | 26.354 a | 20.991 b | 21.462 | 20.745 b | 24.377 | 21.47 | 22.94 | 23.361 | 24.188 |
| SD | 4.331 | 2.288 | 1.621 | 2.832 | 2.79 | 1.796 | 2.847 | 4.557 | 3.348 | |
| n6/n3 | X | 9.031 a | 9.709 a | 9.861 a | 6.876 b | 5.529 b,d | 4.954 c,d | 6.825 b | 4.098 c,d | 4.304 c,d |
| SD | 1.808 | 1.68 | 1.709 | 0.585 | 1.106 | 0.815 | 0.5 | 0.411 | 0.56 | |
| AA/EPA | X | 38.682 b,c,f | 63.627 a | 58.142 a,c | 40.200 b,c,d | 19.082 e,f,h,i | 31.565 b,d,h | 33.581 b,d,g | 17.585 e,g,h,i | 22.287 b,d,i |
| SD | 16.264 | 18.274 | 9.492 | 12.776 | 11.908 | 7.892 | 13.454 | 7.855 | 8.757 | |
| Omega-3 index | X | 1.597 e,f | 1.498 e | 1.448 e | 2.142 c,d,f | 2.378 c,d | 3.171 b | 2.451 c,d | 2.613 b,d | 4.277 a |
| SD | 0.384 | 0.107 | 0.265 | 0.292 | 0.272 | 0.629 | 0.349 | 0.37 | 0.53 | |
| AI | X | 0.445 b,d,e,f | 0.553 a,c | 0.565 a | 0.539 a,d | 0.493 a,f | 0.553 a,c | 0.462 b,c,d,e,f | 0.512 a,e | 0.455 b,d,e,f |
| SD | 0.056 | 0.06 | 0.056 | 0.056 | 0.034 | 0.057 | 0.031 | 0.1 | 0.06 | |
| TI | X | 1.339 a,d | 1.529 a | 1.568 a | 1.347 a,c | 1.184 b,c,d,f | 1.250 b,c,d | 1.171 b,c,d,g | 1.055 b,h | 0.978 e,f,g,h |
| SD | 0.153 | 0.214 | 0.173 | 0.128 | 0.137 | 0.232 | 0.082 | 0.155 | 0.081 | |
| Group | ||||||||||
|---|---|---|---|---|---|---|---|---|---|---|
| Fatty Acid | C | C-H | C-H-C | LO-H | EE-H | FO-H | LO-H-C | EE-H-C | FO-H-C | |
| Saturated fatty acids | ||||||||||
| Lauric acid C12:0 | X | 0.462 a | 0.511 a,c | 0.527 a,c | 0.638 b,c | 0.627 b,c | 0.624 b,c | 0.619 b,c | 0.590 | 0.685 b |
| SD | 0.056 | 0.067 | 0.084 | 0.057 | 0.088 | 0.064 | 0.084 | 0.069 | 0.146 | |
| Myristic acid C14:0 | X | 1.918 d,e | 1.959 c,e | 1.859 d,e | 2.592 a | 2.472 a | 2.199 a,e | 2.219 a,e | 2.059 b,c,e | 2.348 a,c |
| SD | 0.160 | 0.374 | 0.139 | 0.239 | 0.365 | 0.288 | 0.233 | 0.153 | 0.242 | |
| Palmitic acid C16:0 | X | 19.743 | 19.218 a | 19.427 a | 21.316 b | 20.461 | 20.072 | 19.614 | 19.769 | 20.429 |
| SD | 0.717 | 1.100 | 0.695 | 0.686 | 1.213 | 1.413 | 1.225 | 1.274 | 1.636 | |
| Margaric acid C17:0 | X | 0.431 | 0.463 | 0.386 | 0.533 | 0.550 a | 0.419 | 0.357 b | 0.427 | 0.378 |
| SD | 0.078 | 0.064 | 0.049 | 0.072 | 0.098 | 0.120 | 0.212 | 0.059 | 0.167 | |
| Stearic acid C18:0 | X | 6.274 c,d,f | 6.482 c,d,f | 5.878 b,e,f | 7.833 a | 7.611 a | 7.654 a | 6.518 b,c,d,e | 6.913 a,d | 7.258 a,c |
| SD | 0.214 | 0.306 | 0.402 | 0.321 | 0.585 | 0.441 | 0.601 | 0.829 | 1.250 | |
| Arachidic acid C20:0 | X | 0.474 a | 0.509 | 0.446 a | 0.484 | 0.487 | 0.528 | 0.605 | 0.458 a | 0.749 b |
| SD | 0.117 | 0.062 | 0.079 | 0.065 | 0.085 | 0.061 | 0.241 | 0.140 | 0.366 | |
| Behenic acid C22:0 | X | 0.335 | 0.367 | 0.302 a | 0.348 | 0.330 | 0.307 a | 0.357 | 0.273 a | 0.475 b |
| SD | 0.086 | 0.038 | 0.031 | 0.048 | 0.052 | 0.067 | 0.056 | 0.055 | 0.227 | |
| Tricosanoic acid C23:0 | X | 1.071 a,f | 1.348 a,c | 1.229 a,e | 1.012 c,e,f | 1.639 a | 0.672 d,e,f | 0.902 c,e,f | 1.129 a,f | 1.029 b,c,e,f |
| SD | 0.305 | 0.280 | 0.346 | 0.207 | 0.719 | 0.091 | 0.211 | 0.498 | 0.134 | |
| Lignoceric acid C24:0 | X | 0.284 g,h | 0.229 h | 0.345 e,f,h | 0.413 b,d,h | 0.874 a,c | 0.667 a,d | 0.607 b,c,d,f | 0.830 a,c | 0.935 a |
| SD | 0.029 | 0.073 | 0.049 | 0.083 | 0.304 | 0.213 | 0.156 | 0.259 | 0.239 | |
| Unsaturated fatty acids | ||||||||||
| Palmitoleic acid C16:1 | X | 1.981 a,c | 1.566 c,f,g | 2.532 a | 1.180 b,d,f,h | 0.978 e,g,h | 1.319 c,f,g | 1.499 c,f,g | 1.700 b,c,d | 1.698 c,f |
| SD | 0.482 | 0.183 | 0.880 | 0.204 | 0.161 | 0.235 | 0.386 | 0.459 | 0.147 | |
| Margarinoleic acid C17:1 | X | 0.137 a | 0.172 | 0.148 a | 0.153 a | 0.124 a | 0.135 a | 0.128 a | 0.129 a | 0.238 b |
| SD | 0.028 | 0.026 | 0.030 | 0.013 | 0.038 | 0.037 | 0.022 | 0.019 | 0.105 | |
| Oleic acid C18:1n9 | X | 26.718 b,d,e,f | 30.725 a | 28.496 b,c,d | 31.979 a | 27.155 b,d,e,f | 32.020 a | 29.754 a,c | 28.315 c,e | 27.698 c,f |
| SD | 1.070 | 1.416 | 0.452 | 1.342 | 1.602 | 1.226 | 1.989 | 1.934 | 1.431 | |
| Linoleic acid C18:2n6 | X | 23.995 | 23.423 | 25.312 | 22.569 a | 25.040 | 23.396 | 26.246 b | 24.893 | 24.173 |
| SD | 1.688 | 2.156 | 2.659 | 1.531 | 2.578 | 2.231 | 2.407 | 1.286 | 1.248 | |
| Alpha-linolenic acid C18:3n3 | X | 2.341 e,f | 2.239 e,f | 2.301 e,f | 3.423 c,d | 3.976 b,d | 2.633 e,f | 4.434 b | 5.273 a | 2.712 c,f |
| SD | 0.576 | 0.487 | 0.451 | 0.388 | 0.614 | 0.290 | 0.504 | 0.627 | 0.191 | |
| Gamma-linolenic acid C18:3n6 | X | 0.242 | 0.209 a | 0.237 a | 0.200 a | 0.223 a | 0.195 a | 0.238 a | 0.193 a | 0.316 b |
| SD | 0.064 | 0.050 | 0.040 | 0.076 | 0.042 | 0.029 | 0.046 | 0.025 | 0.042 | |
| Eicosenic acid C20:1n9 | X | 0.993 | 1.094 | 0.722 a | 1.010 | 1.127 b | 0.985 | 1.100 | 0.929 | 1.206 b |
| SD | 0.191 | 0.093 | 0.148 | 0.118 | 0.477 | 0.183 | 0.178 | 0.206 | 0.329 | |
| Eicosadienoic acid C20:2 | X | 0.287 | 0.241 | 0.245 | 0.194 a | 0.233 a | 0.237 a | 0.291 | 0.266 | 0.341 b |
| SD | 0.044 | 0.040 | 0.044 | 0.033 | 0.035 | 0.057 | 0.105 | 0.029 | 0.119 | |
| Arachidonic acid C20:4n6 | X | 8.094 a | 4.742 b | 5.444 a | 2.010 d,e,f | 3.413 c | 1.937 d,f | 2.131 d,e,f | 3.001 c,e | 2.403 c,f |
| SD | 0.696 | 1.047 | 0.914 | 0.199 | 0.515 | 0.257 | 0.483 | 0.715 | 0.435 | |
| Eicosapentaenoic acid C20:5n3 | X | 0.231 e | 0.218 e | 0.238 e | 0.249 e | 0.292 c,e | 0.385 a,c | 0.276 d,e | 0.322 b,c,e | 0.443 a |
| SD | 0.042 | 0.018 | 0.038 | 0.055 | 0.060 | 0.067 | 0.041 | 0.022 | 0.156 | |
| Docosahexaenoic acid C22:6n3 | X | 1.117 c | 0.782 c | 0.788 c | 0.902 c | 1.543 b,d | 2.215 a | 1.181 c,d | 1.717 b | 2.514 a |
| SD | 0.129 | 0.227 | 0.133 | 0.150 | 0.375 | 0.324 | 0.275 | 0.208 | 0.393 | |
| other | X | 2.870 a,c | 3.504 a | 3.141 a,c | 0.960 b | 0.845 b | 1.402 b | 0.925 b | 0.814 b | 1.974 b,c |
| SD | 1.196 | 1.030 | 1.088 | 0.348 | 0.412 | 0.690 | 0.474 | 0.521 | 1.077 | |
| Parameter | Group | |||||||||
|---|---|---|---|---|---|---|---|---|---|---|
| C | C-H | C-H-C | LO-H | EE-H | FO-H | LO-H-C | EE-H-C | FO-H-C | ||
| Total SFA | X | 30.992 d | 31.086 d | 30.398 b,d | 35.169 a | 35.050 a | 33.142 a,d | 31.797 b,d | 32.448 b,c,d | 34.285 a,c |
| SD | 0.401 | 1.607 | 0.792 | 0.982 | 2.214 | 2.043 | 1.066 | 1.038 | 1.597 | |
| Total UFA | X | 66.137 a | 65.410 a,e | 66.461 a,c | 63.871 b,d,e | 64.105 b,c,e | 65.456 a,e | 67.278 a | 66.738 a | 63.741 b,c |
| SD | 1.141 | 1.682 | 1.185 | 1.081 | 2.320 | 1.757 | 1.151 | 1.272 | 1.256 | |
| Total MUFA | X | 29.830 b,f,g,h | 33.556 a,d | 31.897 b,c,d,e,f | 34.323 a,c | 29.385 f,g,h | 34.459 a | 32.481 a,e | 31.072 b,e,g | 30.839 e,h |
| SD | 1.530 | 1.431 | 0.879 | 1.356 | 1.481 | 1.302 | 2.161 | 1.770 | 1.445 | |
| Total PUFA | X | 36.307 a | 31.854 b,d,e,f | 34.564 a,e | 29.548 f | 34.720 a,c,d | 30.997 b,f | 34.797 a,c,d | 35.665 a,c | 32.901 b,c,e |
| SD | 1.491 | 2.350 | 1.737 | 1.815 | 2.311 | 2.023 | 2.195 | 0.947 | 1.360 | |
| PUFA/MUFA | X | 1.222 a | 0.953 b,c,d | 1.085 a,c | 0.864 b | 1.185 a | 0.902 b | 1.079 a,c | 1.152 a | 1.070 a,d |
| SD | 0.104 | 0.103 | 0.079 | 0.084 | 0.112 | 0.081 | 0.134 | 0.093 | 0.083 | |
| PUFA/UFA | X | 0.549 a | 0.487 b,c | 0.520 a,c | 0.462 b | 0.541 a | 0.473 b | 0.517 a,c | 0.535 a | 0.516 a,c |
| SD | 0.021 | 0.027 | 0.018 | 0.024 | 0.023 | 0.023 | 0.031 | 0.020 | 0.020 | |
| UFA/SFA | X | 2.134 a,c | 2.111 a,c | 2.188 a | 1.818 b | 1.839 b | 1.984 b,c | 2.119 a,c | 2.060 a,c,d | 1.864 b,d |
| SD | 0.047 | 0.151 | 0.083 | 0.081 | 0.186 | 0.170 | 0.103 | 0.103 | 0.118 | |
| Total n3 | X | 3.689 e | 3.239 e | 3.326 e | 4.575 c,d | 5.810 b | 5.233 b,d | 5.891 b | 7.313 a | 5.669 b |
| SD | 0.554 | 0.420 | 0.456 | 0.463 | 0.545 | 0.502 | 0.383 | 0.709 | 0.415 | |
| Total n6 | X | 24.988 | 24.516 | 26.033 | 23.580 a | 26.167 | 24.381 | 27.346 b | 25.822 | 25.378 |
| SD | 1.580 | 2.075 | 2.723 | 1.619 | 2.552 | 2.315 | 2.403 | 1.303 | 1.253 | |
| Total n9 | X | 27.712 b,d,e | 31.819 a | 29.218 c,d | 32.990 a | 28.282 b,d,e | 33.005 a | 30.854 a,c | 29.244 b,c | 28.903 c,e |
| SD | 1.152 | 1.499 | 0.532 | 1.275 | 1.605 | 1.219 | 1.908 | 1.968 | 1.515 | |
| n6/n3 | X | 6.900 a | 7.681 a | 7.984 a | 5.183 b | 4.552 b,c | 4.705 b,c | 4.655 b,c | 3.569 c | 4.493 b,c |
| SD | 1.054 | 1.157 | 1.564 | 0.445 | 0.738 | 0.710 | 0.459 | 0.480 | 0.325 | |
| AA/EPA | X | 36.313 a | 21.955 b | 23.880 b | 8.475 c | 12.152 c | 5.215 c | 7.910 c | 9.351 c | 6.330 c |
| SD | 8.237 | 5.895 | 7.240 | 2.175 | 3.012 | 1.349 | 2.329 | 2.330 | 3.233 | |
| AI | X | 0.477 a,d | 0.450 b,c,d | 0.448 c,d | 0.518 a | 0.507 a,c | 0.461 a,d | 0.443 d | 0.446 b,d | 0.493 a,d |
| SD | 0.018 | 0.045 | 0.025 | 0.033 | 0.058 | 0.046 | 0.027 | 0.036 | 0.033 | |
| TI | X | 1.188 a,c | 1.256 a | 1.180 a,c | 1.242 a | 0.997 b,f | 1.068 b,c | 0.901 d,f,g | 0.821 e,g | 1.007 b,c |
| SD | 0.125 | 0.110 | 0.105 | 0.115 | 0.076 | 0.101 | 0.057 | 0.061 | 0.094 | |
| Diet | Supplementation Weeks 5–12 | ||
|---|---|---|---|
| Group | Weeks 1–4 | Weeks 5–12 | |
| C | control | control | - |
| C-H | high-fat | high-fat | - |
| C-H-C | high-fat | control | - |
| LO-H | high-fat | high-fat | Linseed oil |
| EE-H | high-fat | high-fat | Ethyl esters |
| FO-H | high-fat | high-fat | Fish oil |
| LO-H-C | high-fat | control | Linseed oil |
| EE-H-C | high-fat | control | Ethyl esters |
| FO-H-C | high-fat | control | Fish oil |
| Acid | LO | EE | FO |
|---|---|---|---|
| Palmitic acid-C16:0 | 4.37 | 4.44 | 11.36 |
| Stearic acid-C18:0 | 3.79 | 3.43 | 2.68 |
| Oleic acid-C18:1 | 16.41 | 16.73 | 23.95 |
| Linoleic acid-C18:2 | 16.24 | 16.68 | 1.43 |
| Alpha-linolenic acid-C18:3 | 56.29 | 58.71 | − |
| Eicosapentaenoic acid-C20:5 | − | − | 8.13 |
| Docosahexaenoic acid-C22:6 | − | − | 9.87 |
Disclaimer/Publisher’s Note: The statements, opinions and data contained in all publications are solely those of the individual author(s) and contributor(s) and not of MDPI and/or the editor(s). MDPI and/or the editor(s) disclaim responsibility for any injury to people or property resulting from any ideas, methods, instructions or products referred to in the content. |
© 2024 by the authors. Licensee MDPI, Basel, Switzerland. This article is an open access article distributed under the terms and conditions of the Creative Commons Attribution (CC BY) license (https://creativecommons.org/licenses/by/4.0/).
Share and Cite
Sokoła-Wysoczańska, E.; Czyż, K.; Wyrostek, A. Enhancing Rats’ Diet with Ethyl Esters Derived from Linseed Oil and Examining the Resulting Changes in Their Blood Fatty Acid Profile. Int. J. Mol. Sci. 2024, 25, 13668. https://doi.org/10.3390/ijms252413668
Sokoła-Wysoczańska E, Czyż K, Wyrostek A. Enhancing Rats’ Diet with Ethyl Esters Derived from Linseed Oil and Examining the Resulting Changes in Their Blood Fatty Acid Profile. International Journal of Molecular Sciences. 2024; 25(24):13668. https://doi.org/10.3390/ijms252413668
Chicago/Turabian StyleSokoła-Wysoczańska, Ewa, Katarzyna Czyż, and Anna Wyrostek. 2024. "Enhancing Rats’ Diet with Ethyl Esters Derived from Linseed Oil and Examining the Resulting Changes in Their Blood Fatty Acid Profile" International Journal of Molecular Sciences 25, no. 24: 13668. https://doi.org/10.3390/ijms252413668
APA StyleSokoła-Wysoczańska, E., Czyż, K., & Wyrostek, A. (2024). Enhancing Rats’ Diet with Ethyl Esters Derived from Linseed Oil and Examining the Resulting Changes in Their Blood Fatty Acid Profile. International Journal of Molecular Sciences, 25(24), 13668. https://doi.org/10.3390/ijms252413668