
Characterization of EpCAM-Positive and EpCAM-Negative Tumor Cells in Early-Stage Breast Cancer
 , , ,
, , ,  ,
,
Abstract
1. Introduction
2. Results
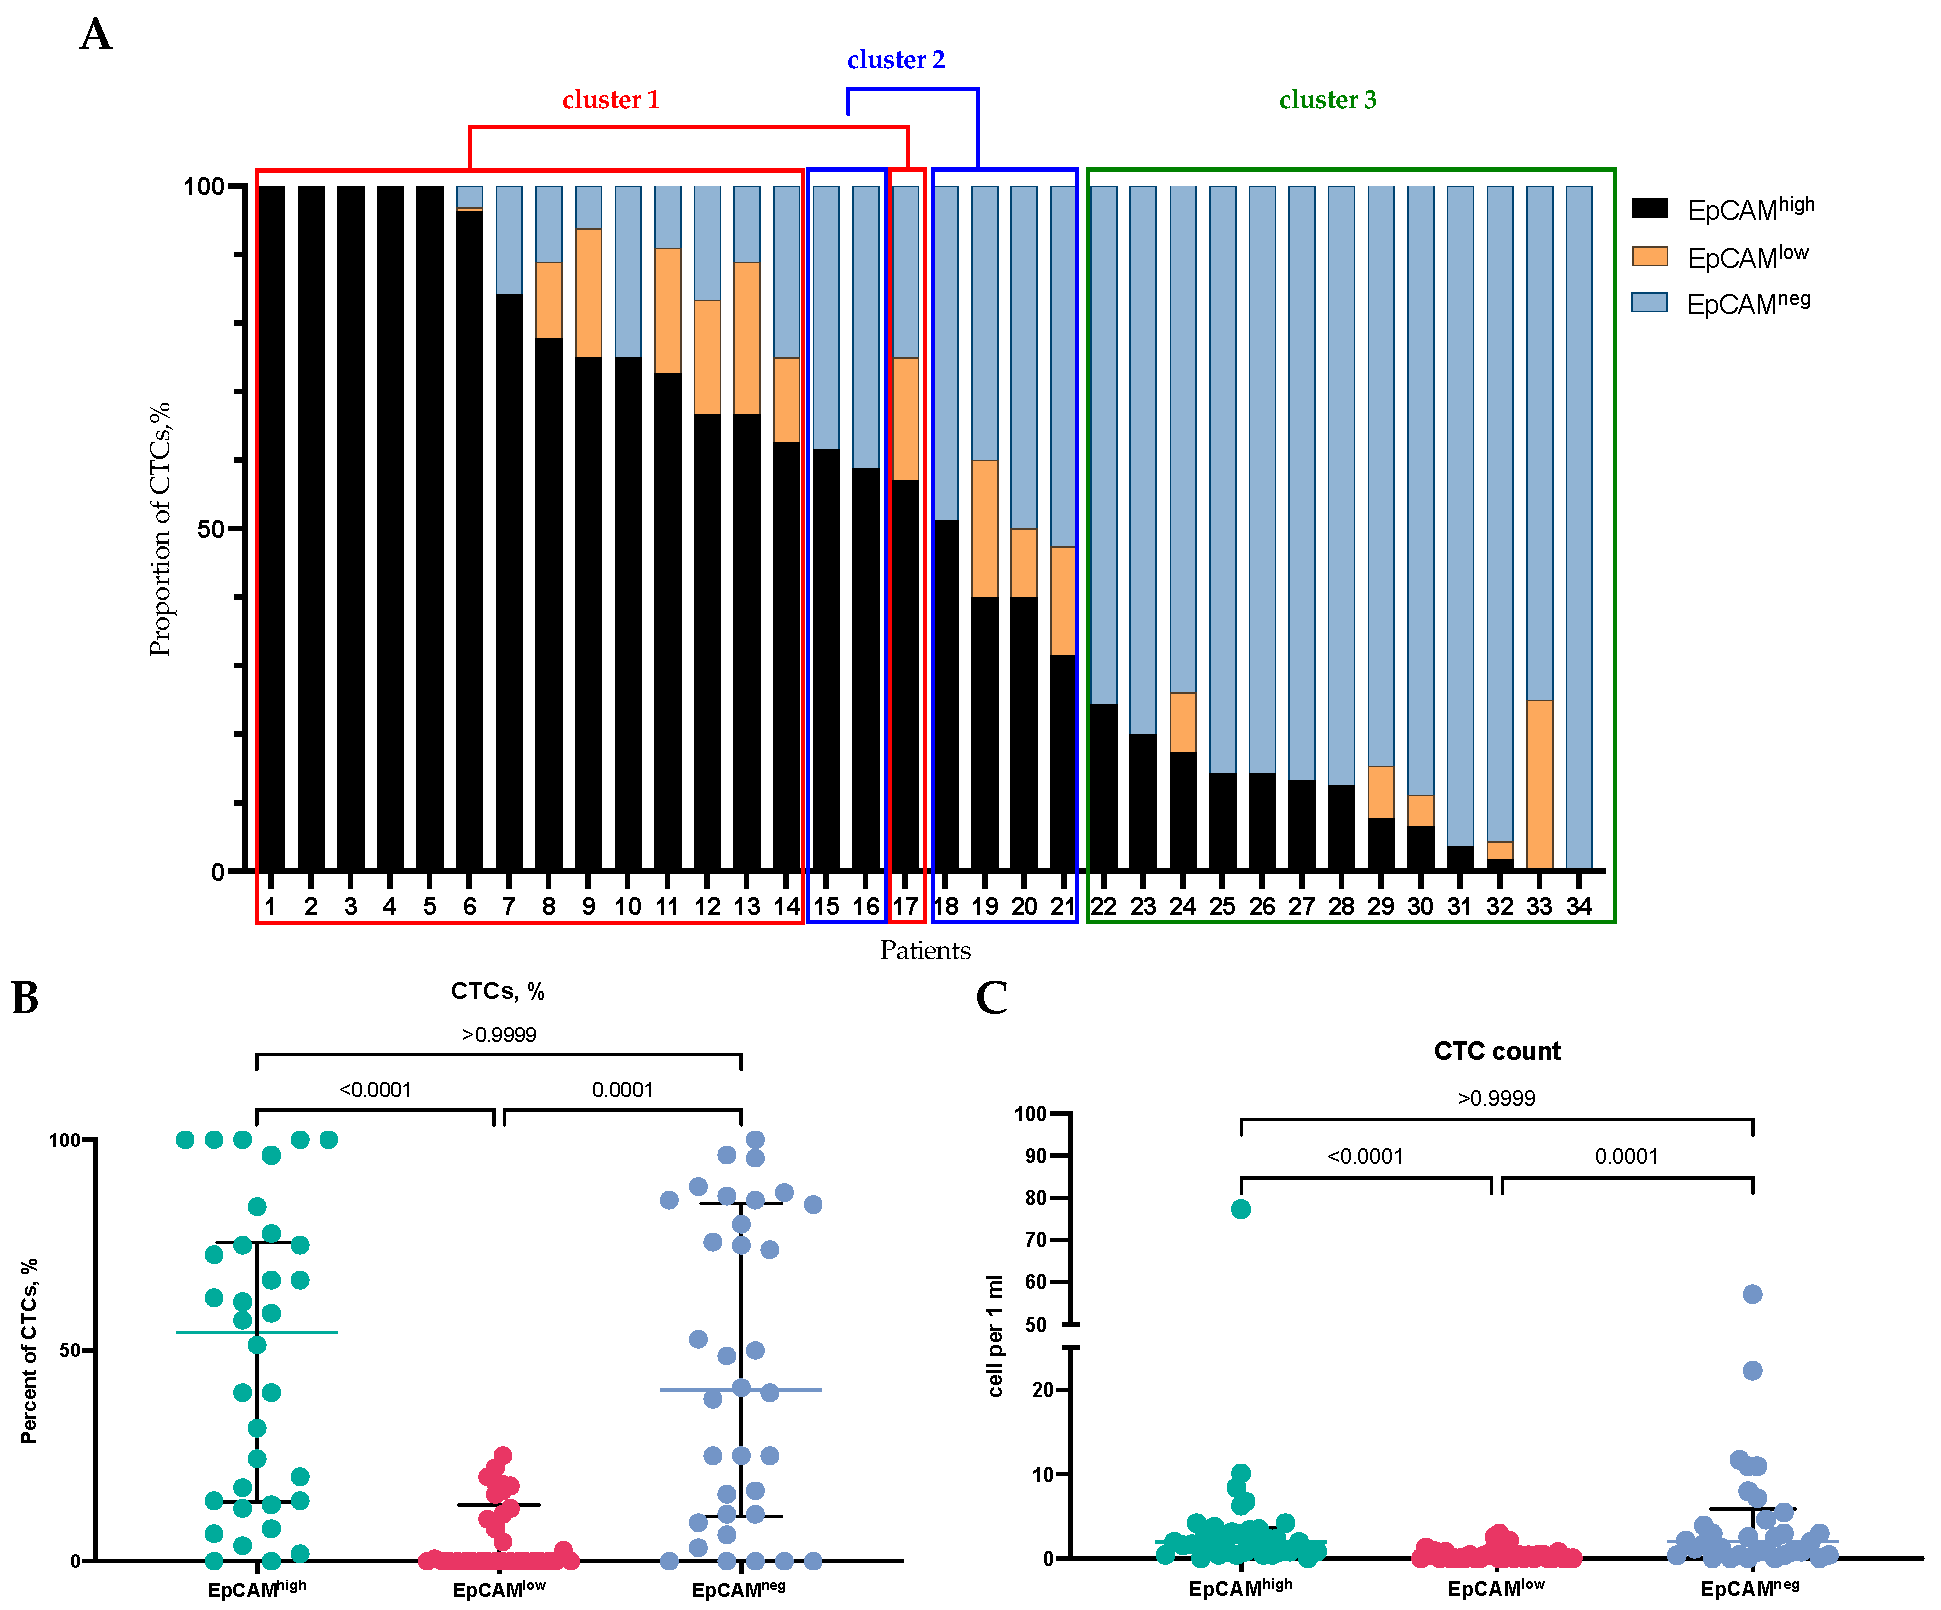
2.1. Detection of EpCAMhigh, EpCAMlow, and EpCAM-Negative CTCs in BC Patients
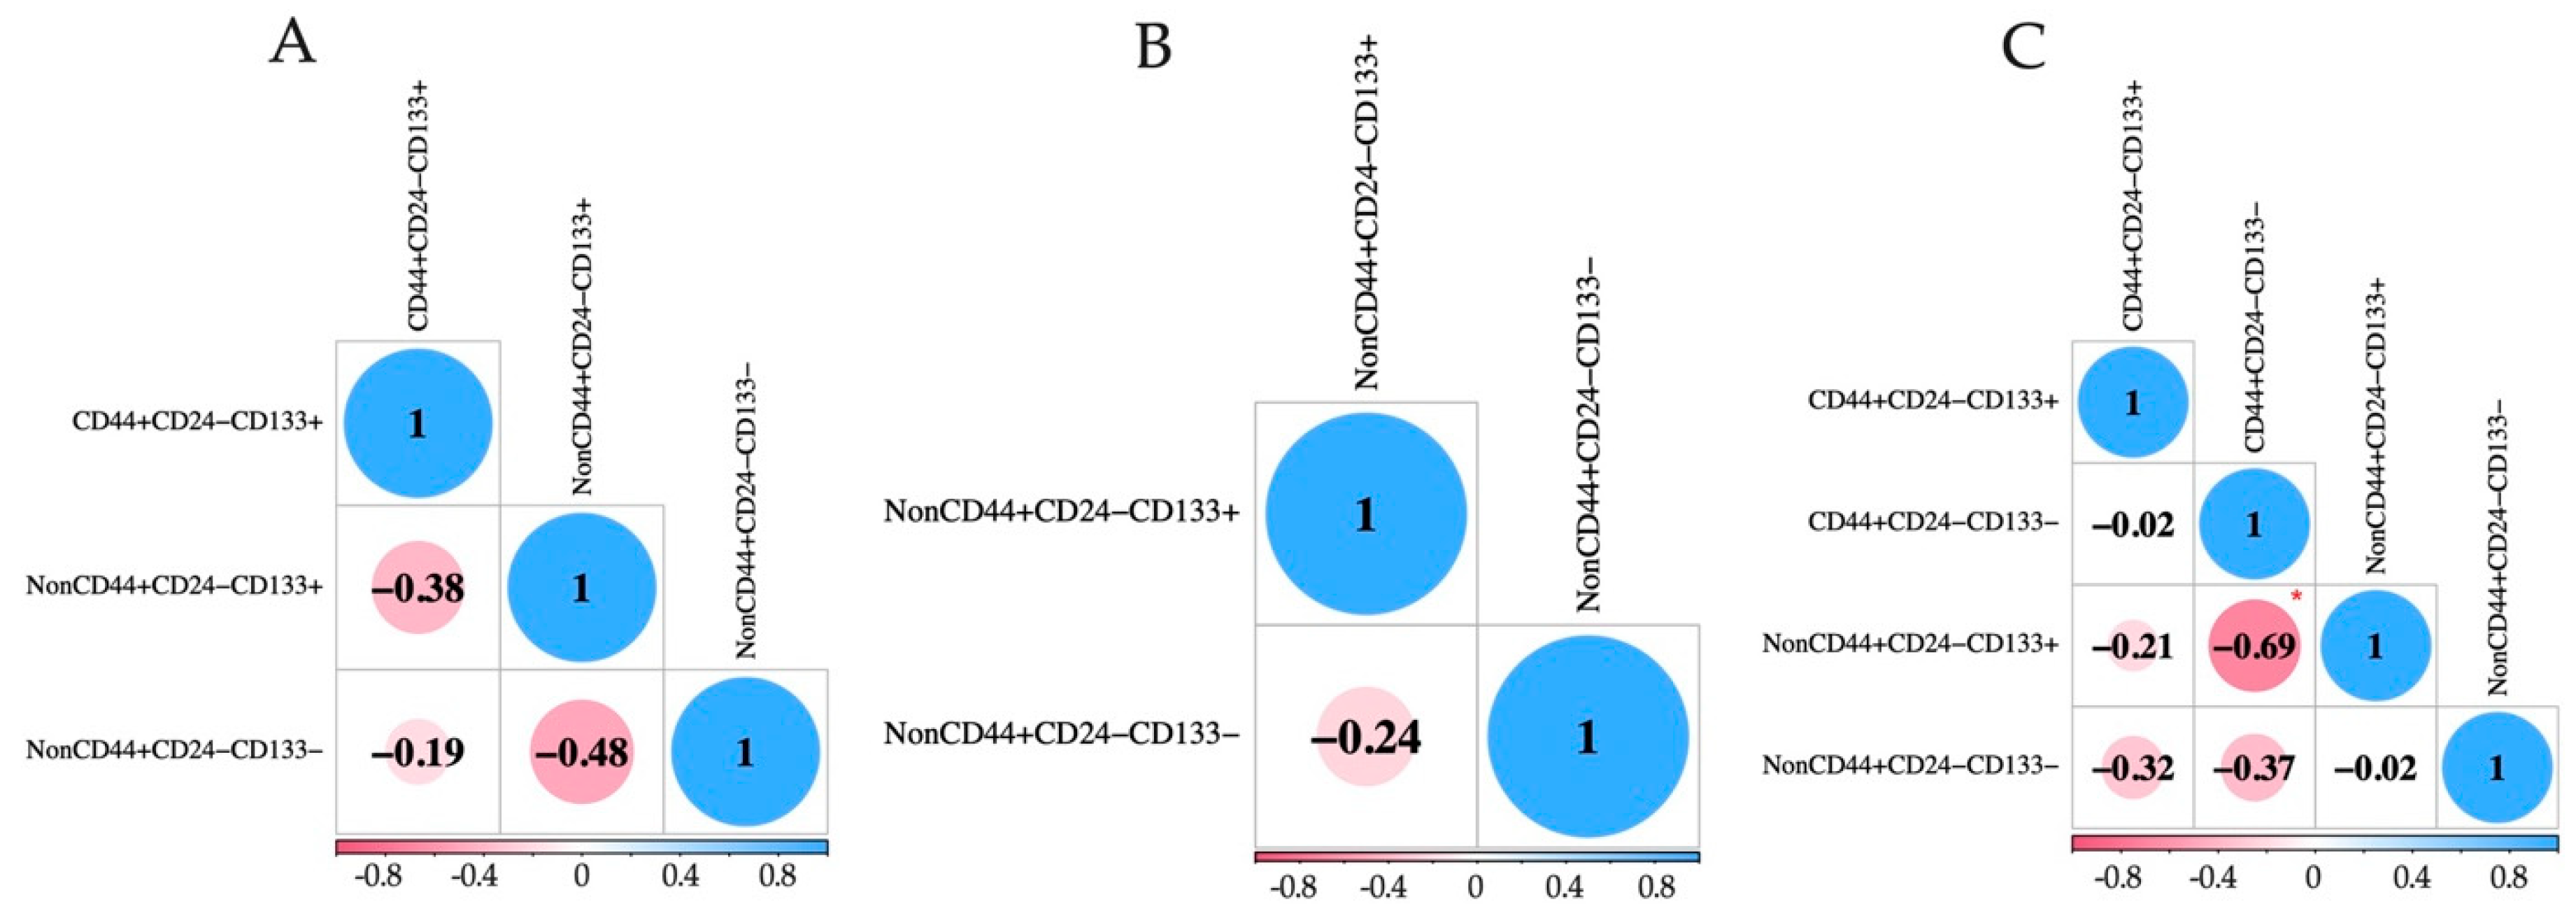
2.2. Detection of EpCAMhigh, EpCAMlow, and EpCAM-Negative CTCs with Stem-like Features in BC Patients
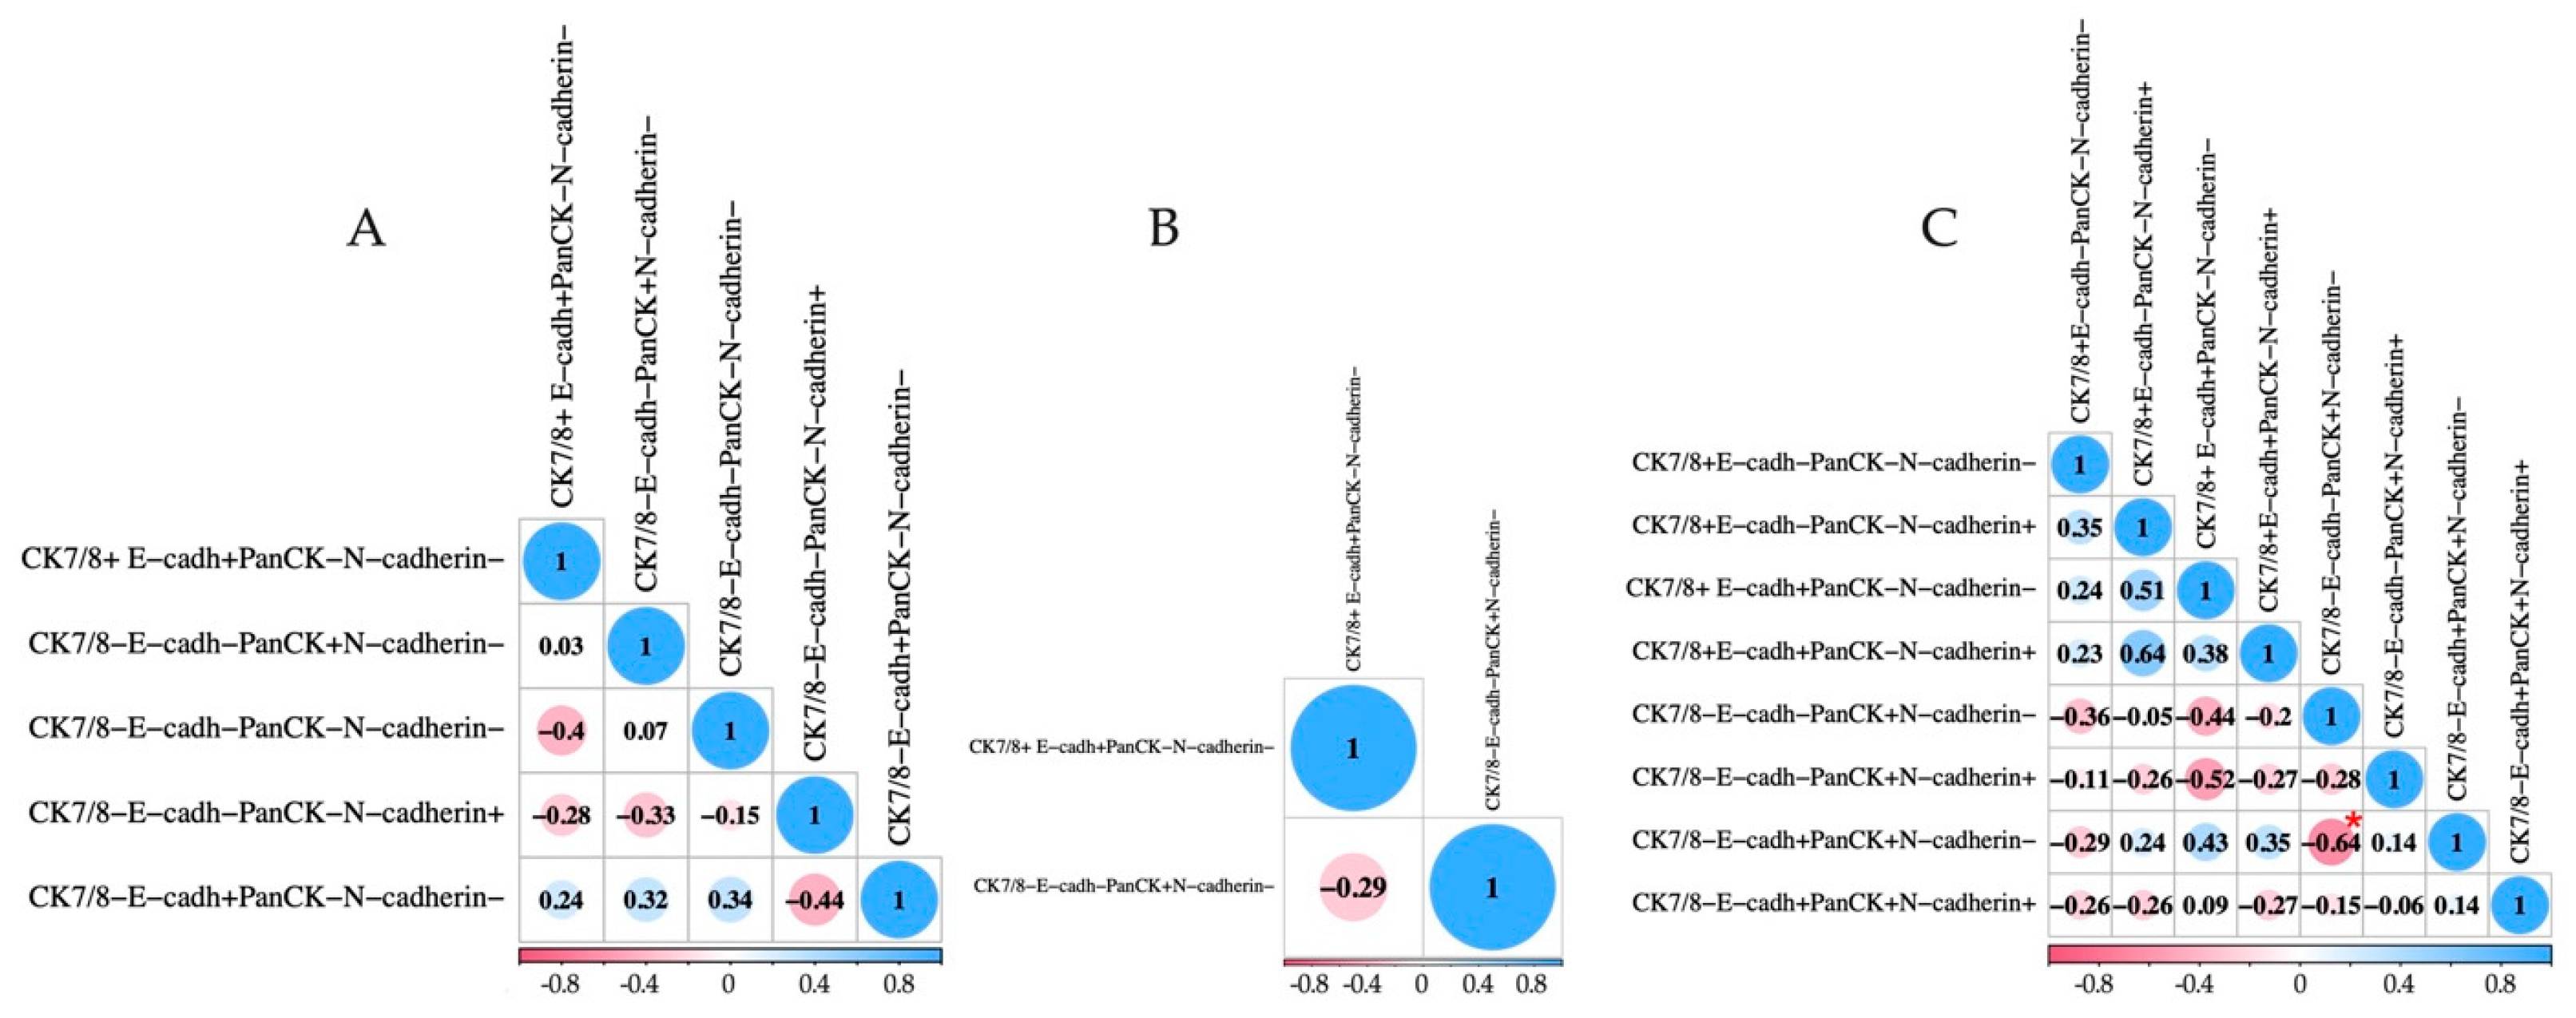
2.3. Detection of EpCAMhigh, EpCAMlow, and EpCAM-Negative CTCs with EMT Markers in BC Patients
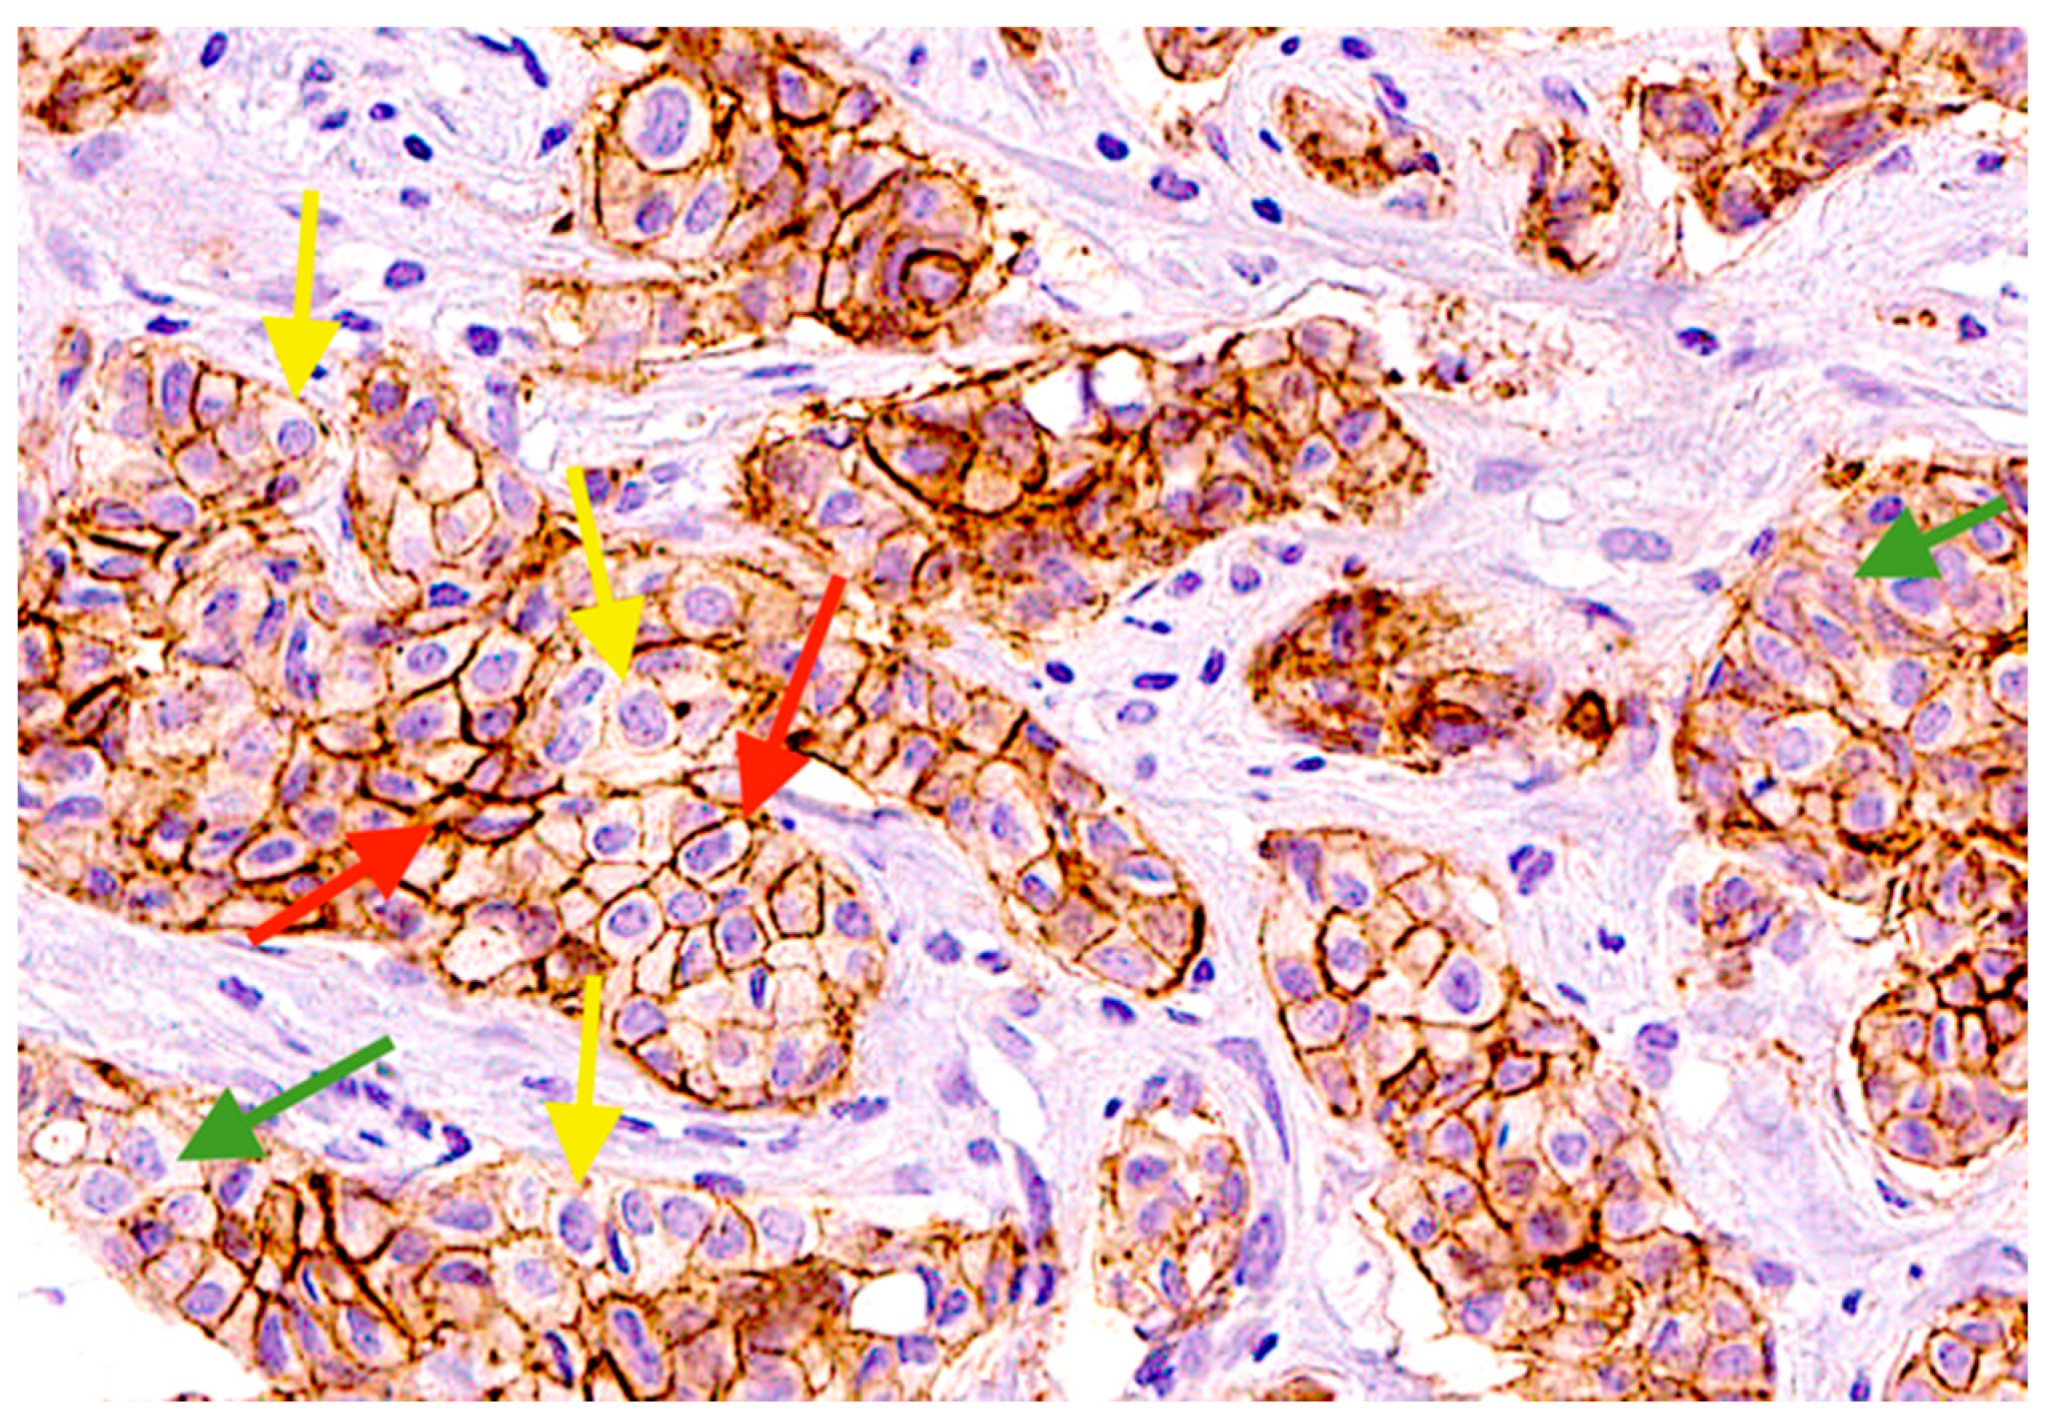
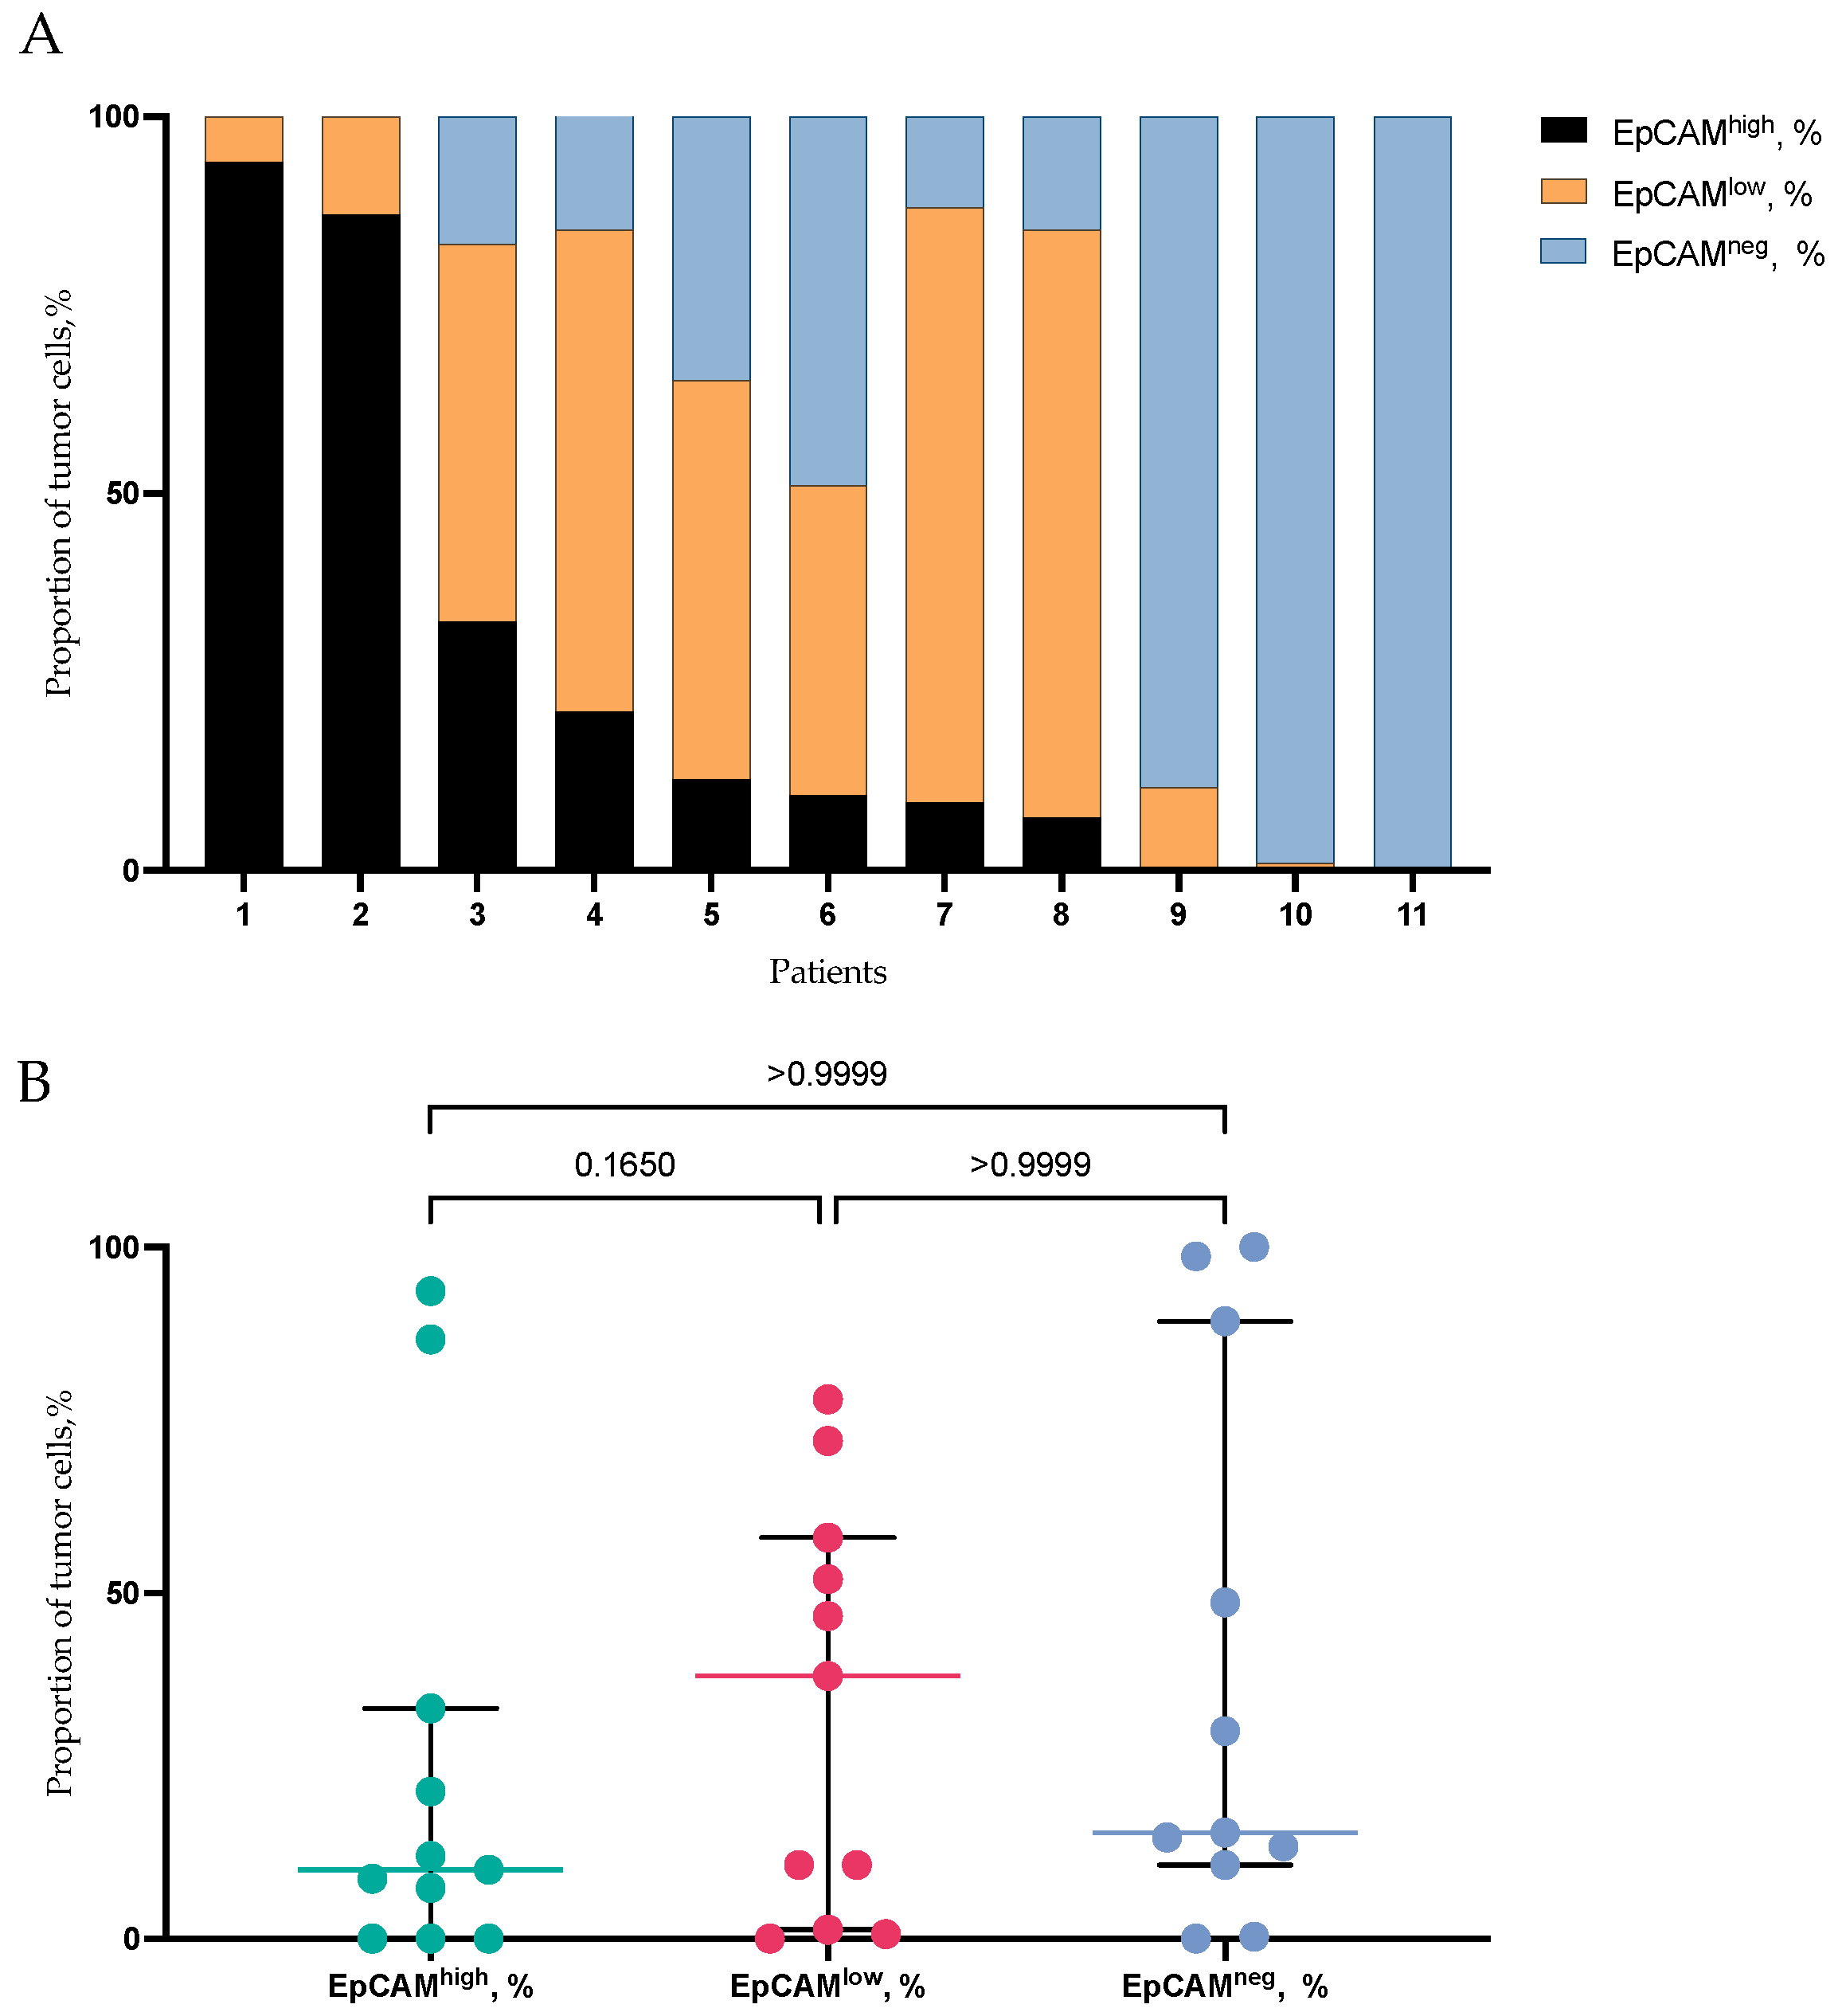
2.4. EpCAMhigh, EpCAMlow, and EpCAM-Negative Tumor Cells in Primary Tumor of BC Patients
2.5. Transcriptomic Analysis of EPCAM-Positive and EPCAM-Negative CTCs
2.6. Spatial Transcriptomic Analysis of EPCAM-Positive and EPCAM-Negative Tumor Cells
3. Discussion
- The evaluation of EpCAM expression in tumor cells, including CTCs and primary tumor cells, was conducted using different methodologies. CTCs were analyzed via flow cytometry, whereas primary tumor cells were examined through immunohistochemistry. Employing a unified approach, specifically flow cytometry, might enable a more precise comparison of EpCAM expression levels between CTCs and primary tumor cells.
- The spectrum of epithelial markers for EpCAM-negative cells differed in immunological and genetic methods. Thus, when assessing protein expression to identify EpCAM-negative cells, cytokeratin 7/8 and pan-cytokeratin, which includes a wide range of cytokeratins (1–8, 10, 14–16, and 19 but not CK17 or CK18), were used. At the same time, in the transcriptomic analysis, only three types of cytokeratins were used: KRT7, KRT8, KRT18.
- The evaluation of EpCAMhigh, EpCAMlow, and EpCAM-negative CTCs presence in relation to such important clinicopathological parameters as molecular subtype, tumor size (T), and lymph node metastasis (N), which was not the aim of this study, could provide new data about the association of these cells with a worse prognosis.
- It is known that EpCAM is associated with the proliferation potential of epithelial cells. However, our study does not cover this area of research. In this context, it would be pertinent to assess the proliferation potential of CTCs with varying levels of EpCAM expression.
4. Materials and Methods
4.1. Patients
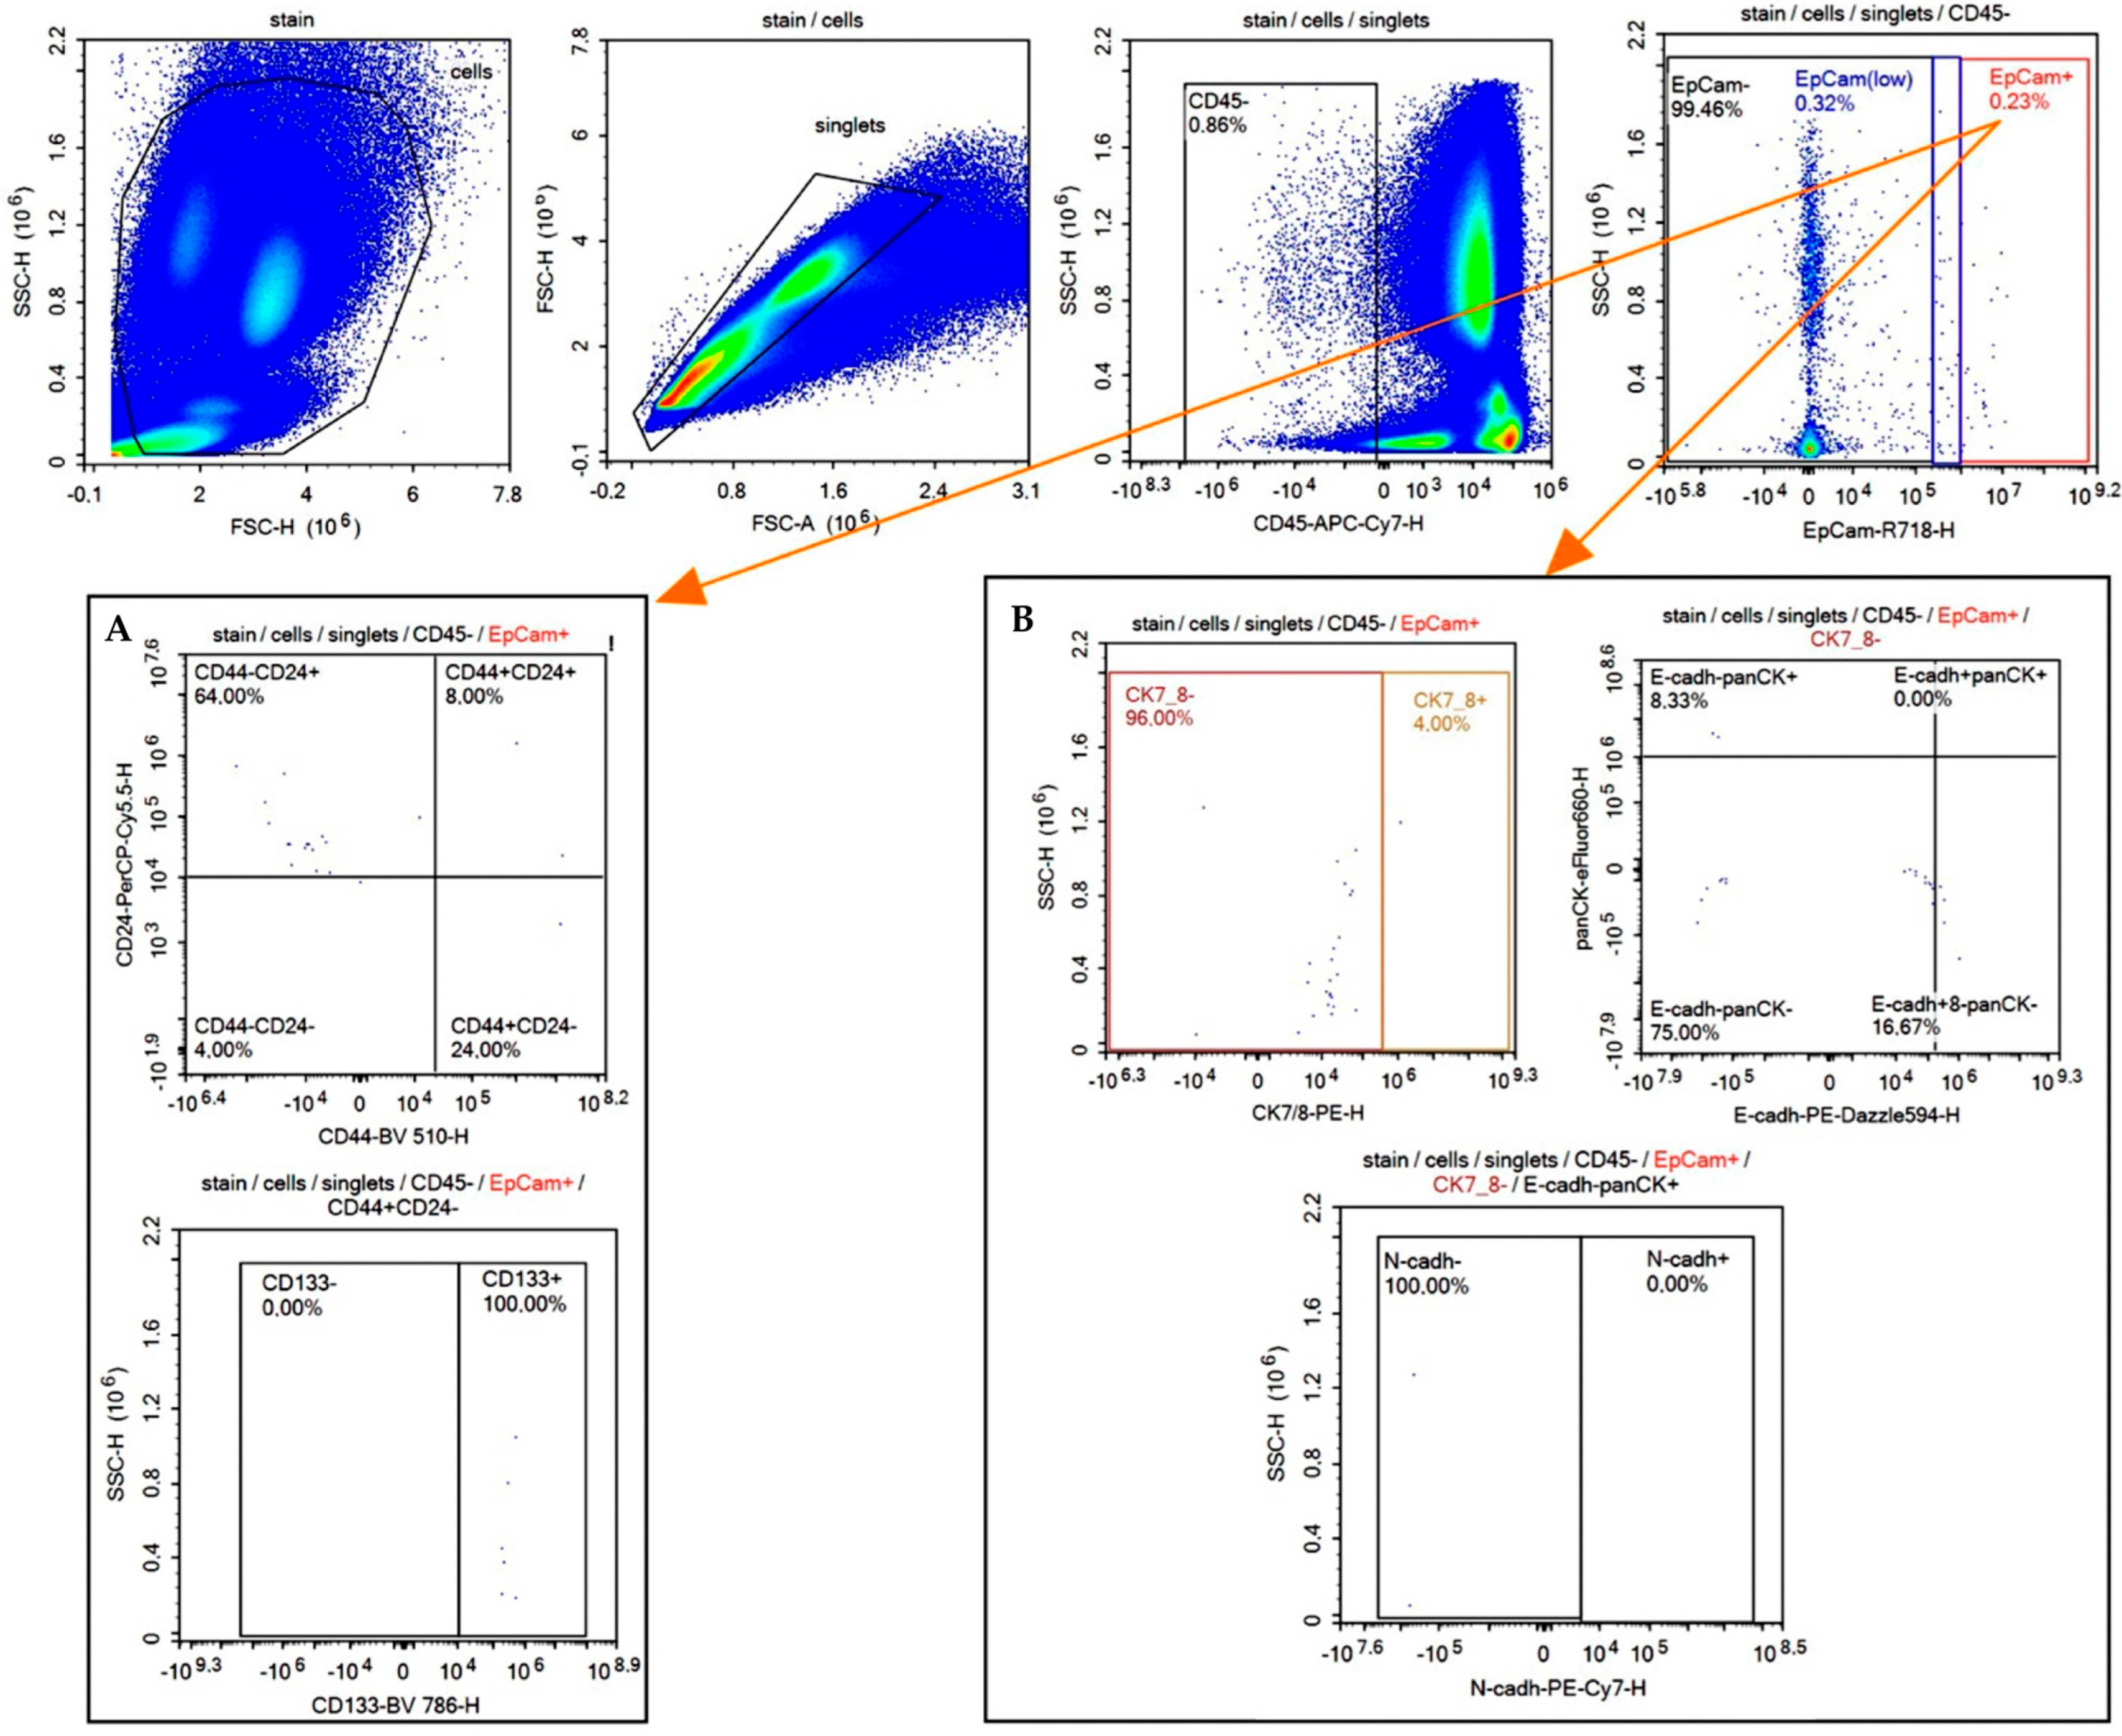
4.2. Flow Cytometry
4.3. Immunohistochemical Analysis
4.4. scRNA-Seq Data Analysis of Breast CTCs
4.5. Spatial Transcriptomics Data Analysis of Breast Tumor Tissue
4.6. Statistical Analysis
5. Conclusions
Supplementary Materials
Author Contributions
Funding
Institutional Review Board Statement
Informed Consent Statement
Data Availability Statement
Conflicts of Interest
References
- Riethdorf, S.; Fritsche, H.; Müller, V.; Rau, T.; Schindlbeck, C.; Rack, B.; Janni, W.; Coith, C.; Beck, K.; Jänicke, F.; et al. Detection of circulating tumor cells in peripheral blood of patients with metastatic BC: A validation study of the CellSearch system. Clin. Cancer Res. 2007, 13, 920–928. [Google Scholar] [CrossRef] [PubMed]
- De Bono, J.S.; Scher, H.I.; Montgomery, R.B.; Parker, C.; Miller, M.C.; Tissing, H.; Doyle, G.V.; Terstappen, L.W.; Pienta, K.J.; Raghavan, D. Circulating tumor cells predict survival benefit from treatment in metastatic castration-resistant prostate cancer. Clin. Cancer Res. 2008, 14, 6302–6309. [Google Scholar] [CrossRef] [PubMed]
- Cohen, S.; Punt, C.; Iannotti, N.; Saidman, B.H.; Sabbath, K.D.; Gabrail, N.Y.; Picus, J.; Morse, M.; Mitchell, E.; Meropol, N.J.; et al. Relationship of circulating tumor cells to tumor response, progression-free survival, and overall survival in patients with metastatic colorectal cancer. J. Clin. Oncol. 2008, 26, 3213–3221. [Google Scholar] [CrossRef] [PubMed]
- Fabisiewicz, A.; Szostakowska-Rodzos, M.; Zaczek, A.J.; Grzybowska, E.A. Circulating Tumor Cells in Early and Advanced Breast Cancer; Biology and Prognostic Value. Int. J. Mol. Sci. 2020, 21, 1671. [Google Scholar] [CrossRef]
- Bidard, F.C.; Peeters, D.J.; Fehm, T.; Nolé, F.; Gisbert-Criado, R.; Mavroudis, D.; Grisanti, S.; Generali, D.; Garcia-Saenz, J.A.; Stebbing, J.; et al. Clinical validity of circulating tumour cells in patients with metastatic BC: A pooled analysis of individual patient data. Lancet Oncol. 2014, 15, 406–414. [Google Scholar] [CrossRef] [PubMed]
- Janni, W.J.; Rack, B.; Terstappen, L.W.; Pierga, J.Y.; Taran, F.A.; Fehm, T.; Hall, C.; de Groot, M.R.; Bidard, F.C.; Friedl, T.W.; et al. Pooled analysis of the prognostic relevance of circulating tumor cells in primary BC. Clin. Cancer Res. 2016, 22, 2583–2593. [Google Scholar] [CrossRef]
- Bidard, F.C.; Michiels, S.; Riethdorf, S.; Mueller, V.; Esserman, L.J.; Lucci, A.; Naume, B.; Horiguchi, J.; Gisbert-Criado, R.; Pantel, K.; et al. Circulating Tumor Cells in Breast Cancer Patients Treated by Neoadjuvant Chemotherapy: A Meta-analysis. J. Natl. Cancer Inst. 2018, 110, 560–567. [Google Scholar] [CrossRef]
- Rack, B.; Schindlbeck, C.; Jückstock, J.; Andergassen, U.; Hepp, P.; Zwingers, T.; Friedl, T.W.; Lorenz, R.; Tesch, H.; Fasching, P.A.; et al. Circulating tumor cells predict survival in early average-to-high risk breast cancer patients. J. Natl. Cancer Inst. 2014, 106, dju066. [Google Scholar] [CrossRef]
- Sparano, J.; O’Neill, A.; Alpaugh, K.; Wolff, A.C.; Northfelt, D.W.; Dang, C.T.; Sledge, G.W.; Miller, K.D. Association of Circulating Tumor Cells with Late Recurrence of Estrogen Receptor-Positive Breast Cancer: A Secondary Analysis of a Randomized Clinical Trial. JAMA Oncol. 2018, 4, 1700–1706. [Google Scholar] [CrossRef]
- Janni, W.; Rack, B.K.; Fasching, P.A.; Haeberle, L.; Tesch, H.; Lorenz, R.; Schochter, F.; Tzschaschel, M.; De Gregorio, A.; Fehm, T.N.; et al. Persistence of circulating tumor cells in high-risk early breast cancer patients five years after adjuvant chemotherapy and late recurrence: Results from the adjuvant SUCCESS A trial. J. Clin. Oncol. 2018, 36, 515. [Google Scholar] [CrossRef]
- Eslami, S.; Cortés-Hernández, L.; Alix-Panabières, C. Circulating tumor cells: Moving forward into clinical applications. Precis. Cancer Med. 2019, 3, 4. [Google Scholar] [CrossRef]
- Kroepil, F.; Dulian, A.; Vallböhmer, D.; Geddert, H.; Krieg, A.; Vay, C.; Topp, S.A.; Schulte am Esch, J.; Baldus, S.E.; Gires, O.; et al. High EpCAM expression is linked to proliferation and lauren classification in gastric cancer. BMC Res. Notes 2013, 6, 253. [Google Scholar] [CrossRef] [PubMed]
- Pan, M.; Schinke, H.; Luxenburger, E.; Kranz, G.; Shakhtour, J.; Libl, D.; Huang, Y.; Gaber, A.; Pavšič, M.; Lenarčič, B.; et al. EpCAM ectodomain EpEX is a ligand of EGFR that counteracts EGF-mediated epithelial-mesenchymal transition through modulation of phospho-ERK1/2 in head and neck cancers. PLoS Biol. 2018, 16, e2006624. [Google Scholar] [CrossRef] [PubMed]
- Soysal, S.; Muenst, S.; Barbie, T.; Fleming, T.; Gao, F.; Spizzo, G.; Oertli, D.; Viehl, C.T.; Obermann, E.C.; Gillanders, W.E. EpCAM expression varies significantly and is differentially associated with prognosis in the luminal B HER2(+), basal-like, and HER2 intrinsic subtypes of BC. Br. J. Cancer 2013, 108, 1480–1487. [Google Scholar] [CrossRef]
- Mohtar, M.; Syafruddin, S.; Nasir, S.; Low, T. Revisiting the Roles of Pro-Metastatic EpCAM in Cancer. Biomolecules 2020, 10, 255. [Google Scholar] [CrossRef] [PubMed]
- Hiraga, T.; Ito, S.; Nakamura, H. EpCAM expression in BC cells is associated with enhanced bone metastasis formation. Int. J. Cancer 2016, 138, 1698–1708. [Google Scholar] [CrossRef]
- Schnell, U.; Cirulli, V.; Giepmans, B. EpCAM: Structure and function in health and disease. Biochim. Biophys. Acta BBA Biomembr. 2013, 1828, 1989–2001. [Google Scholar] [CrossRef]
- Lin, C.W.; Liao, M.Y.; Lin, W.W.; Wang, Y.P.; Lu, T.Y.; Wu, H.C. Epithelial cell adhesion molecule regulates tumor initiation and tumorigenesis via activating reprogramming factors and epithelial-mesenchymal transition gene expression in colon cancer. Biol. Chem. 2012, 287, 39449–39459. [Google Scholar] [CrossRef]
- Hyun, K.; Koo, G.; Han, H.; Sohn, J.; Choi, W.; Kim, S.I.; Kim, Y.S. Epithelial-to-mesenchymal transition leads to loss of EpCAM and different physical properties in circulating tumor cells from metastatic BC. Oncotarget 2016, 7, 24677–24687. [Google Scholar] [CrossRef]
- Brown, T.; Sankpal, N.; Gillanders, W. Functional Implications of the Dynamic Regulation of EpCAM during Epithelial-to-Mesenchymal Transition. Biomolecules 2021, 11, 956. [Google Scholar] [CrossRef]
- Eslami, S.; Cortés-Hernández, L.; Alix-Panabières, C. Epithelial Cell Adhesion Molecule: An Anchor to Isolate Clinically Relevant Circulating Tumor Cells. Cells 2020, 9, 1836. [Google Scholar] [CrossRef] [PubMed]
- Tashireva, L.; Savelieva, O.; Grigoryeva, E.; Nikitin, Y.V.; Denisov, E.V.; Vtorushin, S.V.; Zavyalova, M.V.; Cherdyntseva, N.V.; Perelmuter, V.M. Heterogeneous Manifestations of Epithelial-Mesenchymal Plasticity of Circulating Tumor Cells in BC Patients. Int. J. Mol. Sci. 2021, 22, 2504. [Google Scholar] [CrossRef] [PubMed]
- Königsberg, R.; Obermayr, E.; Bises, G.; Pfeiler, G.; Gneist, M.; Wrba, F.; de Santis, M.; Zeillinger, R.; Hudec, M.; Dittrich, C. Detection of EpCAM positive and negative circulating tumor cells in metastatic BC patients. Acta Oncol. 2011, 50, 700–710. [Google Scholar] [CrossRef] [PubMed]
- Lampignano, R.; Schneck, H.; Neumann, M.; Fehm, T.; Neubauer, H. Enrichment, isolation and molecular characterization of EpCAM-negative circulating tumor cells. In Isolation and Molecular Characterization of Circulating Tumor Cells. Adv. Exp. Med. Biol. 2017, 994, 181–203. [Google Scholar] [PubMed]
- Kirwan, C.; Descamps, T.; Castle, J. Circulating tumour cells and hypercoagulability: A lethal relationship in metastatic breast cancer. Clin. Transl. Oncol. 2020, 22, 870–877. [Google Scholar] [CrossRef]
- Franken, A.; Kraemer, A.; Sicking, A.; Watolla, M.; Rivandi, M.; Yang, L.; Warfsmann, J.; Polzer, B.M.; Friedl, T.W.P.; Meier-Stiegen, F.; et al. Comparative analysis of EpCAM high-expressing and low-expressing circulating tumour cells with regard to their clonal relationship and clinical value. Br. J. Cancer 2023, 128, 1742–1752. [Google Scholar] [CrossRef]
- Habli, Z.; AlChamaa, W.; Saab, R.; Kadara, H.; Khraiche, M.L. Circulating Tumor Cell Detection Technologies and Clinical Utility: Challenges and Opportunities. Cancers 2020, 12, 1930. [Google Scholar] [CrossRef]
- Wang, J.; Lu, W.; Tang, C.; Liu, Y.; Sun, J.; Mu, X.; Zhang, L.; Dai, B.; Li, X.; Zhuo, H.; et al. Label-free isolation and mRNA detection of circulating tumor cells from patients with metastatic lung cancer for disease diagnosis and monitoring therapeutic efficacy. Anal. Chem. 2015, 87, 11893–11900. [Google Scholar] [CrossRef]
- Millner, L.; Linder, M.; Valdes, R. Circulating tumor cells: A review of present methods and the need to identify heterogeneous phenotypes. Ann. Clin. Lab. Sci. 2013, 43, 295–304. [Google Scholar]
- Wen, K.C.; Sung, P.L.; Chou, Y.T.; Pan, C.M.; Wang, P.H.; Lee, O.K.; Wu, C.W. The role of EpCAM in tumor progression and the clinical prognosis of endometrial carcinoma. Gynecol. Oncol. 2018, 148, 383–392. [Google Scholar] [CrossRef]
- Grigoryeva, E.; Tashireva, L.; Alifanov, V.; Savelieva, O.; Zavyalova, M.; Menyailo, M.; Khozyainova, A.; Denisov, E.V.; Bragina, O.; Popova, N.; et al. Integrin-associated transcriptional characteristics of circulating tumor cells in BC patients. PeerJ 2024, 12, e16678. [Google Scholar] [CrossRef]
- Jin, T.; Chen, Y.; Chen, Q.; Xiong, Y.; Yang, J.Q. Circulating tumor cells in peripheral blood as a diagnostic biomarker of BC: A meta-analysis. Front. Oncol. 2023, 13, 1103146. [Google Scholar] [CrossRef]
- Banys-Paluchowski, M.; Schneck, H.; Blassl, C.; Schultz, S.; Meier-Stiegen, F.; Niederacher, D.; Krawczyk, N.; Ruckhaeberle, E.; Fehm, T.; Neubauer, H. Prognostic Relevance of Circulating Tumor Cells in Molecular Subtypes of BC. Geburtshilfe Frauenheilkd 2015, 75, 232–237. [Google Scholar] [PubMed]
- Barcellos-Hoff, M.H.; Lyden, D.; Wang, T.C. The evolution of the cancer niche during multistage carcinogenesis. Nat. Rev. Cancer 2013, 13, 511–518. [Google Scholar] [CrossRef] [PubMed]
- Imrich, S.; Hachmeister, M.; Gires, O. EpCAM and its potential role in tumor-initiating cells. Cell Adhes. Migr. 2012, 6, 30–38. [Google Scholar] [CrossRef]
- Zhang, D.; Yang, L.; Liu, X.; Gao, J.; Liu, T.; Yan, Q.; Yang, X. Hypoxia modulates stem cell properties and induces EMT through N-glycosylation of EpCAM in breast cancer cells. J. Cell. Physiol. 2020, 235, 3626–3633. [Google Scholar] [CrossRef]
- Spizzo, G.; Went, P.; Dirnhofer, S.; Obrist, P.; Simon, R.; Spichtin, H.; Maurer, R.; Metzger, U.; von Castelberg, B.; Bart, R.; et al. High Ep-CAM expression is associated with poor prognosis in node-positive breast cancer. Breast Cancer Res. Treat. 2004, 86, 207–213. [Google Scholar] [CrossRef]
- Perelmuter, V.; Grigorieva, E.; Zavyalova, M.; Tashireva, L.; Alifanov, V.; Saveleva, O.; Vtorushin, S.; Choynzonov, E.; Cherdyntseva, N. Signs of apoptosis in circulating tumor cell subpopulations with phenotypes associated with stemness and epithelial-mesenchymal transition in breast carcinoma. Adv. Mol. Oncol. 2022, 9, 96–111. [Google Scholar] [CrossRef]
- Liou, G. CD133 as a regulator of cancer metastasis through the cancer stem cells. Int. J. Biochem. Cell Biol. 2019, 106, 1–7. [Google Scholar] [CrossRef]
- Zhao, P.; Lu, Y.; Jiang, X.; Li, X. Clinicopathological significance and prognostic value of CD133 expression in triple-negative breast carcinoma. Cancer Sci. 2011, 102, 1107–1111. [Google Scholar] [CrossRef]
- Nadal, R.; Ortega, F.; Salido, M.; Lorente, J.A.; Rodríguez-Rivera, M.; Delgado-Rodríguez, M.; Macià, M.; Fernández, A.; Corominas, J.M.; García-Puche, J.L.; et al. CD133 expression in circulating tumor cells from breast cancer patients: Potential role in resistance to chemotherapy. Int. J. Cancer 2013, 133, 2398–2407. [Google Scholar] [CrossRef] [PubMed]
- Yang, J.; Antin, P.; Berx, G.; Blanpain, C.; Brabletz, T.; Bronner, M.; Campbell, K.; Cano, A.; Casanova, J.; Christofori, G.; et al. Guidelines and definitions for research on epithelial–mesenchymal transition. Nat. Rev. Mol. Cell Biol. 2020, 21, 341–352. [Google Scholar] [CrossRef] [PubMed]
- Liao, T.; Yang, M. Hybrid Epithelial/Mesenchymal State in Cancer Metastasis: Clinical Significance and Regulatory Mechanisms. Cells 2020, 9, 623. [Google Scholar] [CrossRef] [PubMed]
- Lindley, L.; Briegel, K. Molecular characterization of TGFβ-induced epithelial-mesenchymal transition in normal finite lifespan human mammary epithelial cells. Biochem. Biophys. Res. Commun. 2010, 399, 659–664. [Google Scholar] [CrossRef] [PubMed]
- Huang, R.; Wong, M.; Tan, T.; Kuay, K.T.; Ng, A.H.; Chung, V.Y.; Chu, Y.S.; Matsumura, N.; Lai, H.C.; Lee, Y.F.; et al. An EMT spectrum defines an anoikis-resistant and spheroidogenic intermediate mesenchymal state that is sensitive to e-cadherin restoration by a src-kinase inhibitor, saracatinib (AZD0530). Cell Death Dis. 2013, 4, e915. [Google Scholar] [CrossRef]
- Shi, R.; Liu, L.; Wang, F.; He, Y.; Niu, Y.; Wang, C.; Zhang, X.; Zhang, X.; Zhang, H.; Chen, M.; et al. Downregulation of cytokeratin 18 induces cellular partial EMT and stemness through increasing EpCAM expression in breast cancer. Cell Signal. 2020, 76, 109810. [Google Scholar] [CrossRef]
- Markiewicz, A.; Topa, J.; Nagel, A.; Skokowski, J.; Seroczynska, B.; Stokowy, T.; Welnicka-Jaskiewicz, M.; Zaczek, A.J. Spectrum of epithelial-mesenchymal transition phenotypes in circulating tumor cells from early breast cancer patients. Cancers 2019, 11, 59. [Google Scholar] [CrossRef]
- Grosse-Wilde, A.; Fouquier d’Hérouël, A.; McIntosh, E.; Ertaylan, G.; Skupin, A.; Kuestner, R.E.; del Sol, A.; Walters, K.A.; Huang, S. Stemness of the hybrid Epithelial/Mesenchymal State in BC and Its Association with Poor Survival. PLoS ONE 2015, 10, e0126522. [Google Scholar] [CrossRef]
- Jolly, M.; Somarelli, J.; Sheth, M.; Biddle, A.; Tripathi, S.C.; Armstrong, A.J.; Hanash, S.M.; Bapat, S.A.; Rangarajan, A.; Levine, H. Hybrid epithelial/mesenchymal phenotypes promote metastasis and therapy resistance across carcinomas. Pharmacol. Ther. 2019, 194, 161–184. [Google Scholar] [CrossRef]
- Gradishar, W.; Moran, M.; Abraham, J.; Aft, R.; Agnese, D.; Allison, K.H.; Anderson, B.; Burstein, H.J.; Chew, H.; Dang, C.; et al. Breast Cancer, Version 3.2022, NCCN Clinical Practice Guidelines in Oncology. J. Natl. Compr. Canc. Netw. 2022, 20, 691–722. [Google Scholar]
- Grigoryeva, E.; Tashireva, L.; Savelieva, O.; Zavyalova, M.; Popova, N.; Kuznetsov, G.; Andryuhova, E.; Perelmuter, V. The Association of Integrins β3, β4, and αVβ5 on Exosomes, CTCs and Tumor Cells with Localization of Distant Metastasis in BC Patients. Int. J. Mol. Sci. 2023, 24, 2929. [Google Scholar] [CrossRef] [PubMed]
- Menyailo, M.; Zainullina, V.; Khozyainova, A.; Tashireva, L.; Zolotareva, S.; Gerashchenko, T.; Alifanov, V.; Savelieva, O.; Grigoryeva, E.; Tarabanovskaya, N.; et al. Heterogeneity of Circulating Epithelial Cells in BC at Single-Cell Resolution: Identifying Tumor and Hybrid Cells. Adv. Biol. 2023, 7, e2200206. [Google Scholar] [CrossRef] [PubMed]
- Seurat. Available online: https://github.com/satijalab/seurat (accessed on 1 February 2023).
- DoubletFinder. Available online: https://github.com/chris-mcginnis-ucsf/DoubletFinder (accessed on 1 February 2023).
- Tashireva, L.; Grigoryeva, E.; Alifanov, V.; Iamshchikov, P.; Zavyalova, M.; Perelmuter, V. Spatial Heterogeneity of Integrins and Their Ligands in Primary Breast Tumors. Discov. Med. 2023, 35, 910–920. [Google Scholar] [CrossRef] [PubMed]
- Hafemeister, C.; Satija, R. Normalization and variance stabilization of single-cell RNA-seq data using regularized negative bi- nomial regression. Genome Biol. 2019, 20, 296. [Google Scholar] [CrossRef]


| Parameter | Cluster 1 | Cluster 2 | Cluster 3 |
|---|---|---|---|
| T1 | 21.4% (3/14) | 0% (0/6) | 21.4% (3/14) |
| T2 | 57.1% (8/14) | 100% (6/6) | 64.3% (9/14) |
| T3 | 7.1% (1/14) | 0% (0/6) | 0% (0/14) |
| T4 | 7.1% (1/14) | 0% (0/6) | 7.1% (1/14) |
| No data | 7.1% (1/14) | 0% (0/6) | 7.1% (1/14) |
| N0 | 71.4% (10/14) | 50.0% (3/6) | 64.3% (9/14) |
| N1 | 14.3% (2/14) | 50.0% (3/6) | 21.4% (3/14) |
| N2 | 7.1% (1/14) | 0% (0/6) | 0% (0/14) |
| N3 | 0% (0/14) | 0% (0/6) | 7.1% (1/14) |
| No data | 7.1% (1/14) | 0% (0/6) | 7.1% (1/14) |
| Luminal A | 7.1% (1/14) | 0% (0/6) | 0% (0/14) |
| Luminal B (Her2−) | 35.7% (5/14) | 33.3% (2/6) | 42.9% (6/14) |
| Luminal B (Her2+) | 21.4% (3/14) | 0% (0/6) | 7.1% (1/14) |
| TN | 28.6% (4/14) | 33.3% (2/6) | 42.9% (6/14) |
| Her2+ | 7.1% (1/14) | 33.3% (2/6) | 7.1% (1/14) |
| Grade 1 Grade 2 Grade 3 | 0% (0/14) 78.6% (11/14) 7.1% (1/14) | 0% (0/6) 83.3% (5/6) 16.7% (1/6) | 14.3% (2/14) 57.1% (8/14) 28.6% (4/14) |
| CTC Phenotype | EpCAM-Neg, % (1) | Frequency of Occurrence, % (a) | EpCAMlow, % (2) | Frequency of Occurrence, % (b) | EpCAMhigh, % (3) | Frequency of Occurrence, % (c) | p Value |
|---|---|---|---|---|---|---|---|
| CD44+CD24−/CD133+ | 0.00 (0.00–4.81) | 26.5 (9/34) | 0.00 (0.00–0.00) | 0 (0/34) | 0.00 (0.00–10.63) | 26.5 (9/34) | pa-b = 0.0021 pb-c = 0.0021 |
| CD44+CD24−/ CD133− | 0.00 (0.00–20.00) | 38.2 (13/34) | 0.00 (0.00–0.00) | 0 (0/34) | 0.00 (0.00–0.00) | 5.9 (2/34) | p2-1 = 0.0541 pa-c = 0.0026 pa-b < 0.0001 |
| NonCD44+CD24−/CD133+ | 18.33 (0.00–62.23) | 64.7 (22/34) | 0.00 (0.00–51.79) | 26.5 (9/34) | 88.75 (59.06–100.00) | 91.2 (31/34) | p3-1 = 0.0032 p3-2 = 0.0001 pa-b = 0.0032 pa-c = 0.0174 pb-c < 0.0001 |
| NonCD44+CD24−/CD133− | 30.30 (0.00–61.51) | 64.7 (22/34) | 0.00 (0.00–44.64) | 26.5 (9/34) | 0.00 (0.00–17.50) | 29.4 (10/34) | p3-1 = 0.0159 pa-b = 0.0032 pa-c = 0.0071 |
| CTC Phenotype | EpCAM-Neg (1) | Frequency, % (a) | EpCAMlow (2) | Frequency, % (b) | EpCAMhigh (3) | Frequency, % (c) | p Value |
|---|---|---|---|---|---|---|---|
| CK7/8 + E-cadh−PanCK+N-cadherin− | 0.00 (0.00–0.00) | 2.9 (1/34) | 0.00 (0.00–0.00) | 0 (0/34) | 0.00 (0.00–0.00) | 0 (0/34) | |
| CK7/8 + E-cadh−PanCK+N-cadherin+ | 0.00 (0.00–0.00) | 0 (0/34) | 0.00 (0.00–0.00) | 0 (0/34) | 0.00 (0.00–0.00) | 0 (0/34) | |
| CK7/8 + E-cadh + PanCK +N-cadherin− | 0.00 (0.00–0.00) | 0 (0/34) | 0.00 (0.00–0.00) | 0 (0/34) | 0.00 (0.00–0.00) | 0 (0/34) | |
| CK7/8 + E-cadh+ PanCK +N-cadherin+ | 0.00 (0.00–0.00) | 0 (0/34) | 0.00 (0.00–0.00) | 0 (0/34) | 0.00 (0.00–0.00) | 0 (0/34) | |
| CK7/8 + E-cadh−PanCK-N-cadherin− | 0.00 (0.00–4.75) | 26.5 (9/34) | 0.00 (0.00–0.00) | 0 (0/34) | 0.00 (0.00–0.00) | 0 (0/34) | pa-b = 0.0021 pa-c = 0.0021 |
| CK7/8 + E-cadh−PanCK− N-cadherin+ | 0.00 (0.00–0.00) | 20.6 (7/34) | 0.00 (0.00–0.00) | 5.9 (2/34) | 0.00 (0.00–0.00) | 5.9 (2/34) | |
| CK7/8 + E-cadh+ PanCK− N-cadherin− | 0.00 (0.00–0.00) | 20.6 (7/34) | 0.00 (0.00–0.00) | 17.6 (6/34) | 0.00 (0.00–0.00) | 8.8 (3/34) | |
| CK7/8 + E-cadh+ PanCK− N-cadherin+ | 0.00 (0.00–0.00) | 5.9 (2/34) | 0.00 (0.00–0.00) | 5.9 (2/34) | 0.00 (0.00–0.00) | 5.9 (2/34) | |
| CK7/8− E-cadh−PanCK+N-cadherin− | 54.78 (0.00–85.71) | 70.6 (24/34) | 0.00 (0.00–4.16) | 23.5 (8/34) | 0.00 (0.00–25.89) | 44.1 (15/34) | pa-b = 0.0002 pa-c = 0.0490 p2-1 = 0.0159 |
| CK7/8−E-cadh−PanCK+N-cadherin+ | 0.00 (0.00–6.48) | 35.3 (12/34) | 0.00 (0.00–0.00) | 2.9 (1/34) | 0.00 (0.00–0.00) | 0 (0/34) | pa-b = 0.0012 pa-c = 0.0002 |
| CK7/8−E-cadh+ PanCK+N-cadherin− | 0.00 (0.00–7.98) | 26.5 (9/34) | 0.00 (0.00–0.00) | 8.8 (3/34) | 0.00 (0.00–0.00) | 0 (0/34) | pa-c = 0.0021 |
| CK7/8−E-cadh+ PanCK+N-cadherin+ | 0.00 (0.00–0.18) | 23.5 (8/34) | 0.00 (0.00–0.00) | 2.9 (1/34) | 0.00 (0.00–0.00) | 0 (0/34) | pa-b = 0.0272 pa-c = 0.0049 |
| CK7/8−E-cadh−PanCK− N-cadherin− | - | - | - | 0.00 (0.00–25.89) | 47.1 (16/34) | ||
| CK7/8−E-cadh−PanCK− N-cadherin+ | - | - | - | 0.00 (0.00–10.63) | 29.4 (10/34) | ||
| CK7/8−E-cadh+ PanCK− N-cadherin− | - | - | - | 8.33 (0.00–57.92) | 52.9 (18/34) | ||
| CK7/8−E-cadh+ PanCK− N-cadherin+ | - | - | - | 0.00 (0.00–0.00) | 11.8 (4/34) |
| CTCs Phenotype | EpCAM-Negative (1) | EpCAMlow (2) | EpCAMhigh (3) | p Value |
|---|---|---|---|---|
| E-cadherin+ | 47.1 (16/34) | 26.5 (9/34) | 8.8 (3/34) | p3-1 = 0.0009 |
| N-cadherin+ | 55.9 (19/34) | 8.8 (3/34) | 5.9 (2/34) | p2-1 = 0.0001 p3-1 = 0.0000 |
| E-cadherin+ N-cadherin+ | 29.4 (10/34) | 8.8 (3/34) | 5.9 (2/34) | p3-1 = 0.0230 |
| EpCAM-Negative | EpCAMlow | EpCAMhigh | ||||
|---|---|---|---|---|---|---|
| Frequency, % | Proportion, % | Frequency, % | Proportion, % | Frequency, % | Proportion, % | |
| CTCs | 100 (11/11) | 75.68 (38.46–85.71) | 45.5 (5/11) | 0.00 (0.00–10.00) | 90.9 (10/11) | 20.00 (7.69–61.54) |
| Primary tumor | 90.9 (10/11) | 15.33 (10.67–89.33) | 90.9 (10/11) | 38.00 (1.33–58.00) p = 0.0371 | 72.7 (8/10) | 10.00 (0.00–33.33) |
| Gene | EPCAM−CTCs | EPCAM+CTCs | p Value |
| KRT7 | 1.3% (3/228) | 8.3% (1/11) | |
| KRT8 | 70.2% (160/228) | 25.0% (3/11) | p = 0.02 |
| KRT18 | 41.7% (95/228) | 25.0% (3/11) | |
| Stemness-related genes | |||
| CD44/CD24 | 5.3% (12/228) | 8.3% (1/11) | |
| ALDH1A1 | 0.4% (1/228) | 33.3% (4/11) | p < 0.0001 |
| PROM1 (CD133) | 0.4% (1/228) | 25.0% (3/11) | p = 0.0004 |
| POU5F1 (OCT4) | 0.4% (1/228) | 16.7% (2/11) | p = 0.0067 |
| KLF4 | 1.8% (4/228) | 16.7% (2/11) | p = 0.0100 |
| SOX2 | 0.0% (0/228) | 0.0% (0/11) | |
| MYC | 0.4% (1/228) | 16.7% (2/11) | p = 0.0067 |
| Epithelial–mesenchymal transition genes | |||
| CDH1 | 0.0% (0/228) | 16.7% (2/11) | p = 0.0023 |
| CDH2 | 0.4% (1/228) | 0.0% (0/11) | |
| VIM | 18.0% (41/228) | 66.7% (8/11) | p = 0.0005 |
| ZEB1 | 0.4% (1/228) | 25.0% (3/11) | p = 0.0004 |
| ZEB2 | 19.7% (45/228) | 50.0% (6/11) | p = 0.005 |
| SNAI1 | 0.0% (0/228) | 8.3% (1/11) | |
| SNAI2 | 0.0% (0/228) | 8.3% (1/11) | |
| TWIST | 0.0% (0/228) | 8.3% (1/11) | |
| FN1 | 0.4% (1/228) | 8.3% (1/11) | |
| SCGB2A (mammoglobin A) | 1.8% (4/228) | 8.3% (1/11) | |
| Gene | EPCAM-Negative (1) | EPCAMlow (2) | EPCAMhigh (3) | p Value |
| KRT7 | 69.1% (1037/1500) | 66.0% (1037/1571) | 76.7% (1420/1851) | p3-1 < 0.0001 p2-3 < 0.0001 |
| KRT8 | 95.9% (1438/1500) | 97.9% (1538/1571) | 99.9% (1849/1851) | p2-1 = 0.0012 p3-1 < 0.0001 p2-3 < 0.0001 |
| KRT18 | 93.2% (1398/1500) | 95.9% (1507/1571) | 98.5% (1823/1851) | p2-1 = 0.0010 p3-1 < 0.0001 p2-3 < 0.0001 |
| Stemness-related genes | ||||
| CD44/CD24 | 6.7% (100/1500) | 1.2% (18/1571) | 0.3% (5/1851) | p2-1 < 0.0001 p3-1 < 0.0001 p2-3 = 0.0025 |
| ALDH1A1 | 9.4% (141/1500) | 6.3% (99/1571) | 3.6% (67/1851) | p2-1 = 0.0015 p3-1 < 0.0001 p2-3 = 0.0003 |
| PROM1 (CD133) | 7.7% (115/1500) | 16.6% (261/1571) | 52.4% (970/1851) | p2-1 < 0.0001 p3-1 < 0.0001 p2-3 < 0.0001 |
| POU5F1 (OCT4) | 1.1% (17/1500) | 1.6% (25/1571) | 2.5% (46/1851) | p3-1 = 0.0046 |
| KLF4 | 25.5% (383/1500) | 20.3% (319/1571) | 27.6% (511/1851) | p2-1 = 0.0006 p2-3 < 0.0001 |
| SOX2 | 0.3% (4/1500) | 0.2% (3/1571) | 0.0% (0/1851) | p3-1 = 0.0401 |
| MYC | 65.0% (975/1500) | 80.8% (1269/1571) | 95.6% (1770/1851) | p2-1 < 0.0001 p3-1 < 0.0001 p2-3 < 0.0001 |
| Epithelial–mesenchymal transition genes | ||||
| CDH1 | 81.4% (1221/1500) | 93.0% (1461/1571) | 98.0% (1814/1851) | p2-1 < 0.0001 p3-1 < 0.0001 p2-3 < 0.0001 |
| CDH2 | 4.5% (67/1500) | 4.9% (77/1571) | 3.6% (66/1851) | |
| VIM | 95.7% (1435/1500) | 96.2% (1511/1571) | 96.3% (1783/1851) | |
| SNAI1 | 2.4% (41/1500) | 4.1% (65/1571) | 5.9% (109/1851) | p2-1 = 0.0376 p3-1 < 0.0001 p2-3 = 0.0233 |
| SNAI2 | 51.2% (768/1500) | 52.1% (819/1571) | 58.1% (1075/1851) | p3-1 < 0.0001 p2-3 = 0.0006 |
| ZEB1 | 33.6% (505/1500) | 29.2% (458/1571) | 26.1% (484/1851) | p2-1 = 0.0073 p3-1 < 0.0001 |
| ZEB2 | 27.3% (409/1500) | 25.1% (394/1571) | 34.1% (631/1851) | p3-1 < 0.0001 p2-3 < 0.0001 |
| TWIST | 7.1% (106/1500) | 5.8% (92/1571) | 5.2% (97/1851) | p3-1 = 0.0290 |
| FN1 | 99.1% (1486/1500) | 100.0% (1571/1571) | 100.0% (1851/1851) | p2-1 < 0.0001 p3-1 < 0.0001 |
| SCGB2A2 (mammoglobin A) | 29.1% (437/1500) | 13.5% (212/1571) | 2.32% (43/1851) | p2-1 < 0.0001 p3-1 < 0.0001 p2-3 < 0.0001 |
| Parameter | ||
|---|---|---|
| Age | <35 | 8.82% (3/34) |
| 35–50 | 58.82% (20/34) | |
| >50 | 32.36% (11/34) | |
| Tumor size (T) | 1 | 20.59% (7/34) |
| 2 | 70.59% (24/34) | |
| 3 | 2.94% (1/34) | |
| 4 | 5.88% (2/34) | |
| Stage | I | 20.59% (7/34) |
| IIA | 50.00% (17/34) | |
| IIB | 20.59% (7/34) | |
| IIIA | 2.94% (1/34) | |
| IIIB | 2.94% (1/34) | |
| Molecular subtype | Luminal A | 2.94% (1/34) |
| Luminal B (HER2−) | 38.25% (13/34) | |
| Luminal B (HER2+) | 11.76% (4/34) | |
| Triple negative | 35.29% (12/34) | |
| HER2-enriched | 11.76% (4/34) | |
| Lymph node metastasis | Yes | 32.35% (11/34) |
| No | 67.65% (23/34) | |
Disclaimer/Publisher’s Note: The statements, opinions and data contained in all publications are solely those of the individual author(s) and contributor(s) and not of MDPI and/or the editor(s). MDPI and/or the editor(s) disclaim responsibility for any injury to people or property resulting from any ideas, methods, instructions or products referred to in the content. |
© 2024 by the authors. Licensee MDPI, Basel, Switzerland. This article is an open access article distributed under the terms and conditions of the Creative Commons Attribution (CC BY) license (https://creativecommons.org/licenses/by/4.0/).
Share and Cite
Perelmuter, V.M.; Grigoryeva, E.S.; Alifanov, V.V.; Kalinchuk, A.Y.; Andryuhova, E.S.; Savelieva, O.E.; Patskan, I.A.; Bragina, O.D.; Garbukov, E.Y.; Vostrikova, M.A.; et al. Characterization of EpCAM-Positive and EpCAM-Negative Tumor Cells in Early-Stage Breast Cancer. Int. J. Mol. Sci. 2024, 25, 11109. https://doi.org/10.3390/ijms252011109
Perelmuter VM, Grigoryeva ES, Alifanov VV, Kalinchuk AY, Andryuhova ES, Savelieva OE, Patskan IA, Bragina OD, Garbukov EY, Vostrikova MA, et al. Characterization of EpCAM-Positive and EpCAM-Negative Tumor Cells in Early-Stage Breast Cancer. International Journal of Molecular Sciences. 2024; 25(20):11109. https://doi.org/10.3390/ijms252011109
Chicago/Turabian StylePerelmuter, Vladimir M., Evgeniya S. Grigoryeva, Vladimir V. Alifanov, Anna Yu. Kalinchuk, Elena S. Andryuhova, Olga E. Savelieva, Ivan A. Patskan, Olga D. Bragina, Evgeniy Yu. Garbukov, Mariya A. Vostrikova, and et al. 2024. "Characterization of EpCAM-Positive and EpCAM-Negative Tumor Cells in Early-Stage Breast Cancer" International Journal of Molecular Sciences 25, no. 20: 11109. https://doi.org/10.3390/ijms252011109
APA StylePerelmuter, V. M., Grigoryeva, E. S., Alifanov, V. V., Kalinchuk, A. Y., Andryuhova, E. S., Savelieva, O. E., Patskan, I. A., Bragina, O. D., Garbukov, E. Y., Vostrikova, M. A., Zavyalova, M. V., Denisov, E. V., Cherdyntseva, N. V., & Tashireva, L. A. (2024). Characterization of EpCAM-Positive and EpCAM-Negative Tumor Cells in Early-Stage Breast Cancer. International Journal of Molecular Sciences, 25(20), 11109. https://doi.org/10.3390/ijms252011109