Article

Shotgun Metagenomics Reveals Minor Micro“bee”omes Diversity Defining Differences between Larvae and Pupae Brood Combs

1
Institute of Environmental and Agricultural Biology (X-BIO), Tyumen State University, Tyumen 625003, Russia
2
Faculty of Information Technology and Programming, ITMO University, St. Petersburg 197101, Russia
3
Institute of Biomedical Chemistry, Moscow 119121, Russia
4
Research Center for Molecular Mechanisms of Aging and Age-Related Diseases, Moscow Institute of Physics and Technology, Dolgoprudny 141700, Russia
*
Author to whom correspondence should be addressed.
These authors contributed equally to this work.
Int. J. Mol. Sci. 2024, 25(2), 741; https://doi.org/10.3390/ijms25020741
Submission received: 8 November 2023 / Revised: 29 December 2023 / Accepted: 4 January 2024 / Published: 6 January 2024
(This article belongs to the Section Molecular Genetics and Genomics)

Abstract

:
Bees represent not only a valuable asset in agriculture, but also serve as a model organism within contemporary microbiology. The metagenomic composition of the bee superorganism has been substantially characterized. Nevertheless, traditional cultural methods served as the approach to studying brood combs in the past. Indeed, the comb microbiome may contribute to determining larval caste differentiation and hive immunity. To further this understanding, we conducted a shotgun sequencing analysis of the brood comb microbiome. While we found certain similarities regarding species diversity, it exhibits significant differentiation from all previously described hive metagenomes. Many microbiome members maintain a relatively constant ratio, yet taxa with the highest abundance level tend to be ephemeral. More than 90% of classified metagenomes were Gammaproteobacteria, Bacilli and Actinobacteria genetic signatures. Jaccard dissimilarity between samples based on bacteria genus classifications hesitate from 0.63 to 0.77, which for shotgun sequencing indicates a high consistency in bacterial composition. Concurrently, we identified antagonistic relationships between certain bacterial clusters. The presence of genes related to antibiotic synthesis and antibiotic resistance suggests potential mechanisms underlying the stability of comb microbiomes. Differences between pupal and larval combs emerge in the total metagenome, while taxa with the highest abundance remained consistent. All this suggests that a key role in the functioning of the comb microbiome is played by minor biodiversity, the function of which remains to be established experimentally.

Graphical Abstract

1. Introduction

1.1. Bee Hive as Microbiology Model Object

Microbiomes, as well as any other communities, are closely related to each other within a biocenosis [1,2]. Functioning together, they form an environment. Some microorganisms may occupy more than one ecological microniche and can disrupt the functioning of microbiomes by inherently becoming introduced species [3,4,5]. Therefore, the stability of communities is determined by their complexity and complex genomic signatures—metagenome [1,6,7,8]. Functional differences and host genomics influence between microbiomes with similar conditions are often determined by minor representatives of communities [9,10,11]. Even these small variations in microbiota mediate big proteomics, metabolomics and full microbiome composition changes [11,12].
Bee colonies form an environment for a distinct microbiota [13,14]. Hive members, their microflora and microorganisms living on different hive substrates influence each other and function together as a superorganism [13,15,16]. The microbiota influences the metabolism [13,14,15,17], development [18,19,20], immunity [21,22,23,24] and even behavior [25,26,27] and evolution and speciation [28,29] of bees. The gut microflora of bees and its role are well studied [13,15,30,31]. In adults, it includes only nine major groups of bacteria that populate the gastrointestinal tract during the first days after hatching from the pupae [13]. The pupal intestine contains almost no bacteria, which makes bees a good object for setting up model experiments to study the microbiome in adults [13,30]. The other components of the hive microbiome, such as the comb microbiome, have received far less research attention, with traditional culture methods typically being the primary approach [15,16,31,32,33]. However, even this small number of articles indicates the huge role of the hive microbiome in the life of its inhabitants [15,23,34,35]. It is the bee hologenome, which includes the genomes of all hive organisms, that should determine its characteristics [31,32].

1.2. Bee Hologenome Parts

Hive environments contain three functional parts of microbiota. Some bacteria can be transposed between hive members from different hive substrates [36]. Worker bees transfer bacteria and fungi from plants and air into the hive [35,37]. The main part, normal microflora, protects the hive environment from undesirable and pathogenic invaders [23,24,33]. Also, it is involved in hive metabolism systems [16,37,38]. Apilactobacillus kunkeei, Bombella apis and other species play a role in honey and pollen processing [16,38].
Honey contains a large number of microbes [14,35,39,40,41]. The composition of species within the hive environment is influenced by two primary factors: firstly, it is contingent upon the floral sources from which the bees forage for nectar [35,40]; and secondly, it undergoes a progressive alteration throughout the process of honey maturation [39]. Bee bread, bee pollen and propolis also contain bacteria involved in their formation [33,34,38,42,43,44]. These sugar-rich substrates, however, maintain a fairly constant microflora [16,35,37,43,44]. This is controlled by a multitude of antimicrobials [34,45,46,47], which also influence other microbiota communities of hive [44,48,49,50] and landscape [16,51], and bees themselves [19,34,37,52,53]. Like in most hive niches, the majority of studies report domination of bacteria, especially Bacillus, Lactobacillus, Apilactobacillus and Bifidobacterium [16,35,37]. Lipidome and shotgun metagenomics studies predict higher amounts of fungi than expected in previous articles [41,43,53,54].
Comb microbiota community might be similar to honey, but less rich [15,54]. Previous articles had reported low biomass and diversity of microorganisms of brood combs [15,54,55,56,57]. Cultural methods reveal that combs hives contained only 10–106 CFU/g [55]. Investigated brood combs recovered less diversity and biomass than common hive floors, especially in spring and winter. At least eight Bacillus species, Lactobacillus, Apilactobacillus, Brevibacillus, Corynebacterium, Leifsonia, one Enterobacteriaceae group and several Actinobacteria were identified in combs [55,56,58]. Amount of microorganisms on hive floors are higher [28], while they contain notably lower concentrations of nutrients [16]. So, there might be a mechanism of comb microbiota control.

2. Results

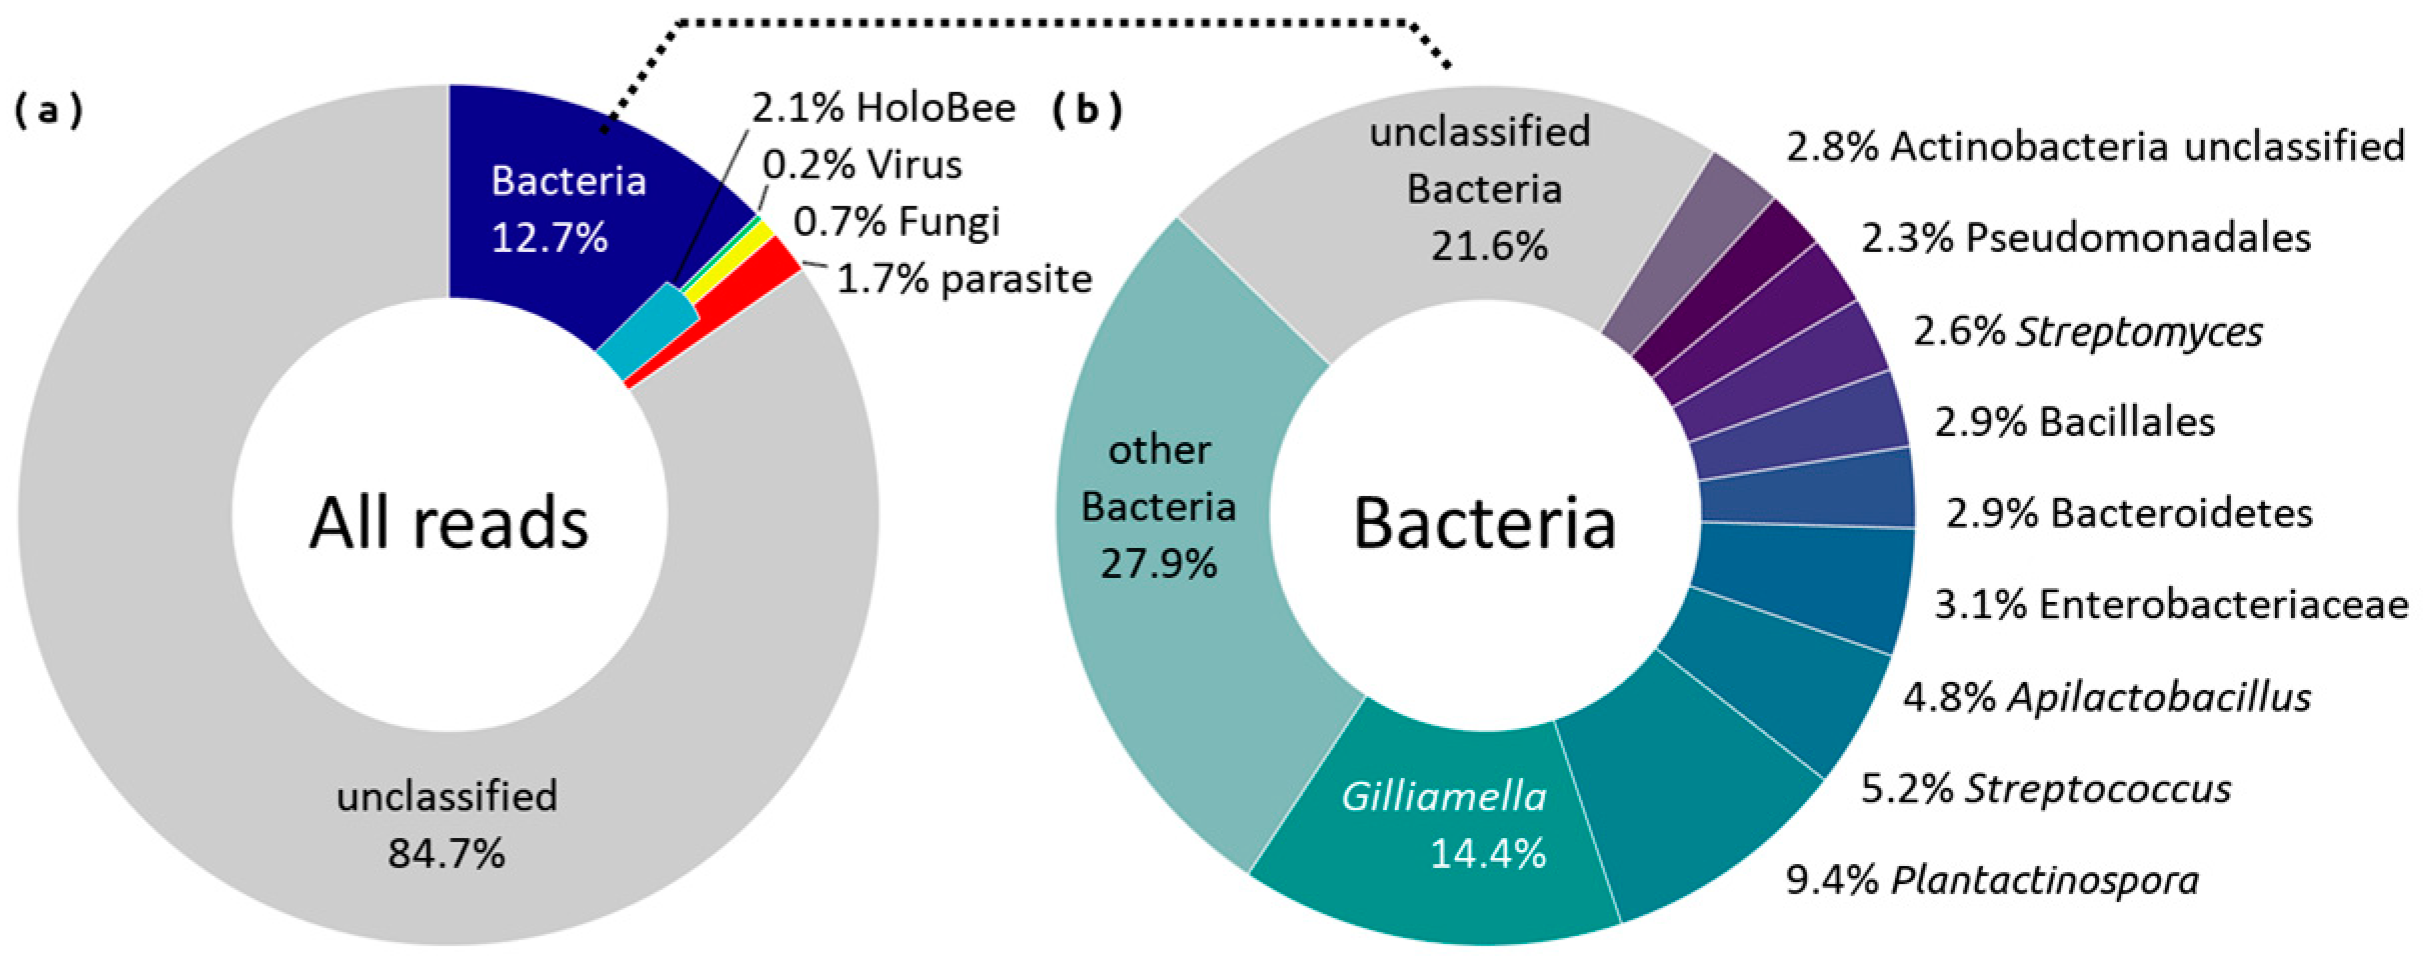
2.1. Taxonomy Annotation

Approximately two million Illumina shotgun reads per sample were sequenced across a dataset comprising 17 samples—equivalent to a cumulative data corpus of about 35 million reads. More than 95% of all reads were identified as Apis mellifera, and more than 80% of remaining reads were not classified.
Only 2.1% of all reads were classified on the HoloBee database [59] (Figure S1). Despite results on the RefSeq database, it well identifies DNA from different metazoans, but their numbers fluctuate considerably (Figure S2).
Bacterial abundance and diversity (more than 260k reads, 9000 species, 1497 genus) significantly exceed total viral (6.7k reads, 79 species, 59 genus) and fungi (8k reads, 96 species, 258 genus) (Figure 1). It is likely that some of the taxa were misclassified (Comment S1, Figure S3). Among the dominant species, this applies primarily to Buchnera and Plantactinospora. These classifications most likely refer to other representatives of Enterobacteriaceae and Micromonosporaceae, respectively. Therefore, henceforth we regard them as putative taxa in relation to these genera exhibiting clustered dissimilarities among metagenomes.
Most numerous fungal groups were Ascomycota, Basidiomycota and Mucoromycota (Figure S4). Of the 258 fungal genus, a minimum of 223 are classified by multiple reads from more than two samples. No species dominates that microbiome part.
Some bee pathogens also were detected. All samples were infected by Varroa destructor and some also by Apis mellifera filamentosus virus (AMFV) (Figure 2).
All analyses show a fairly high taxonomic diversity. Major groups by amount are Actinobacteria (Plantactinospora, Streptomyces and unclassified taxa), Gammaproteobacteria (mainly Gilliamella and Pseudomonas), Lactobacillales (Streptococcus, Apilactobacillus and Lactobacillus) and Bacillales.
Of the widely represented microorganisms, only representatives of the genera Bacillus, Apilactobacillus and Lactobacillus have been previously isolated from brood combs. Representatives of Corynebacterium and Brevibacillus, whose biodiversity in the hive has been described by culture and biochemical methods, were observed in small numbers.
The greatest number fluctuations between samples are characteristic of Gilliamella, Apilactobacillus, Serratia and Parasacharibacter (Figure S2). Other bacteria are classified in the metagenome in almost constant amounts.
Analysis performed on HoloBee database discovers high levels of Aethina in the sample majority (Figure S5). Classification of Gilliamella and Apilactobacillus remain similar with analysis on the RefSeq database, whereas other Bacteria taxa are classified badly.
The level of Varroa destructor DNA in the metagenome was also constant. Eight samples contain AMFV reads (Figure 2). This plot shows no correlation between virus infection and metagenome member amount.
The composition of bacterial and fungal microbiomes in the combs is fairly constant (Figure 2 and Figure S4). A large number of Gilliamella in samples 4, 7 and 17 and Apilactobacillus in 2, 5 and 6 are isolated. At the same time, the ratios of other groups remain close to constant.
In further analysis, we used bacteria, virus, and HoloBee Kraken 2 and Kaiju fungal taxonomies.

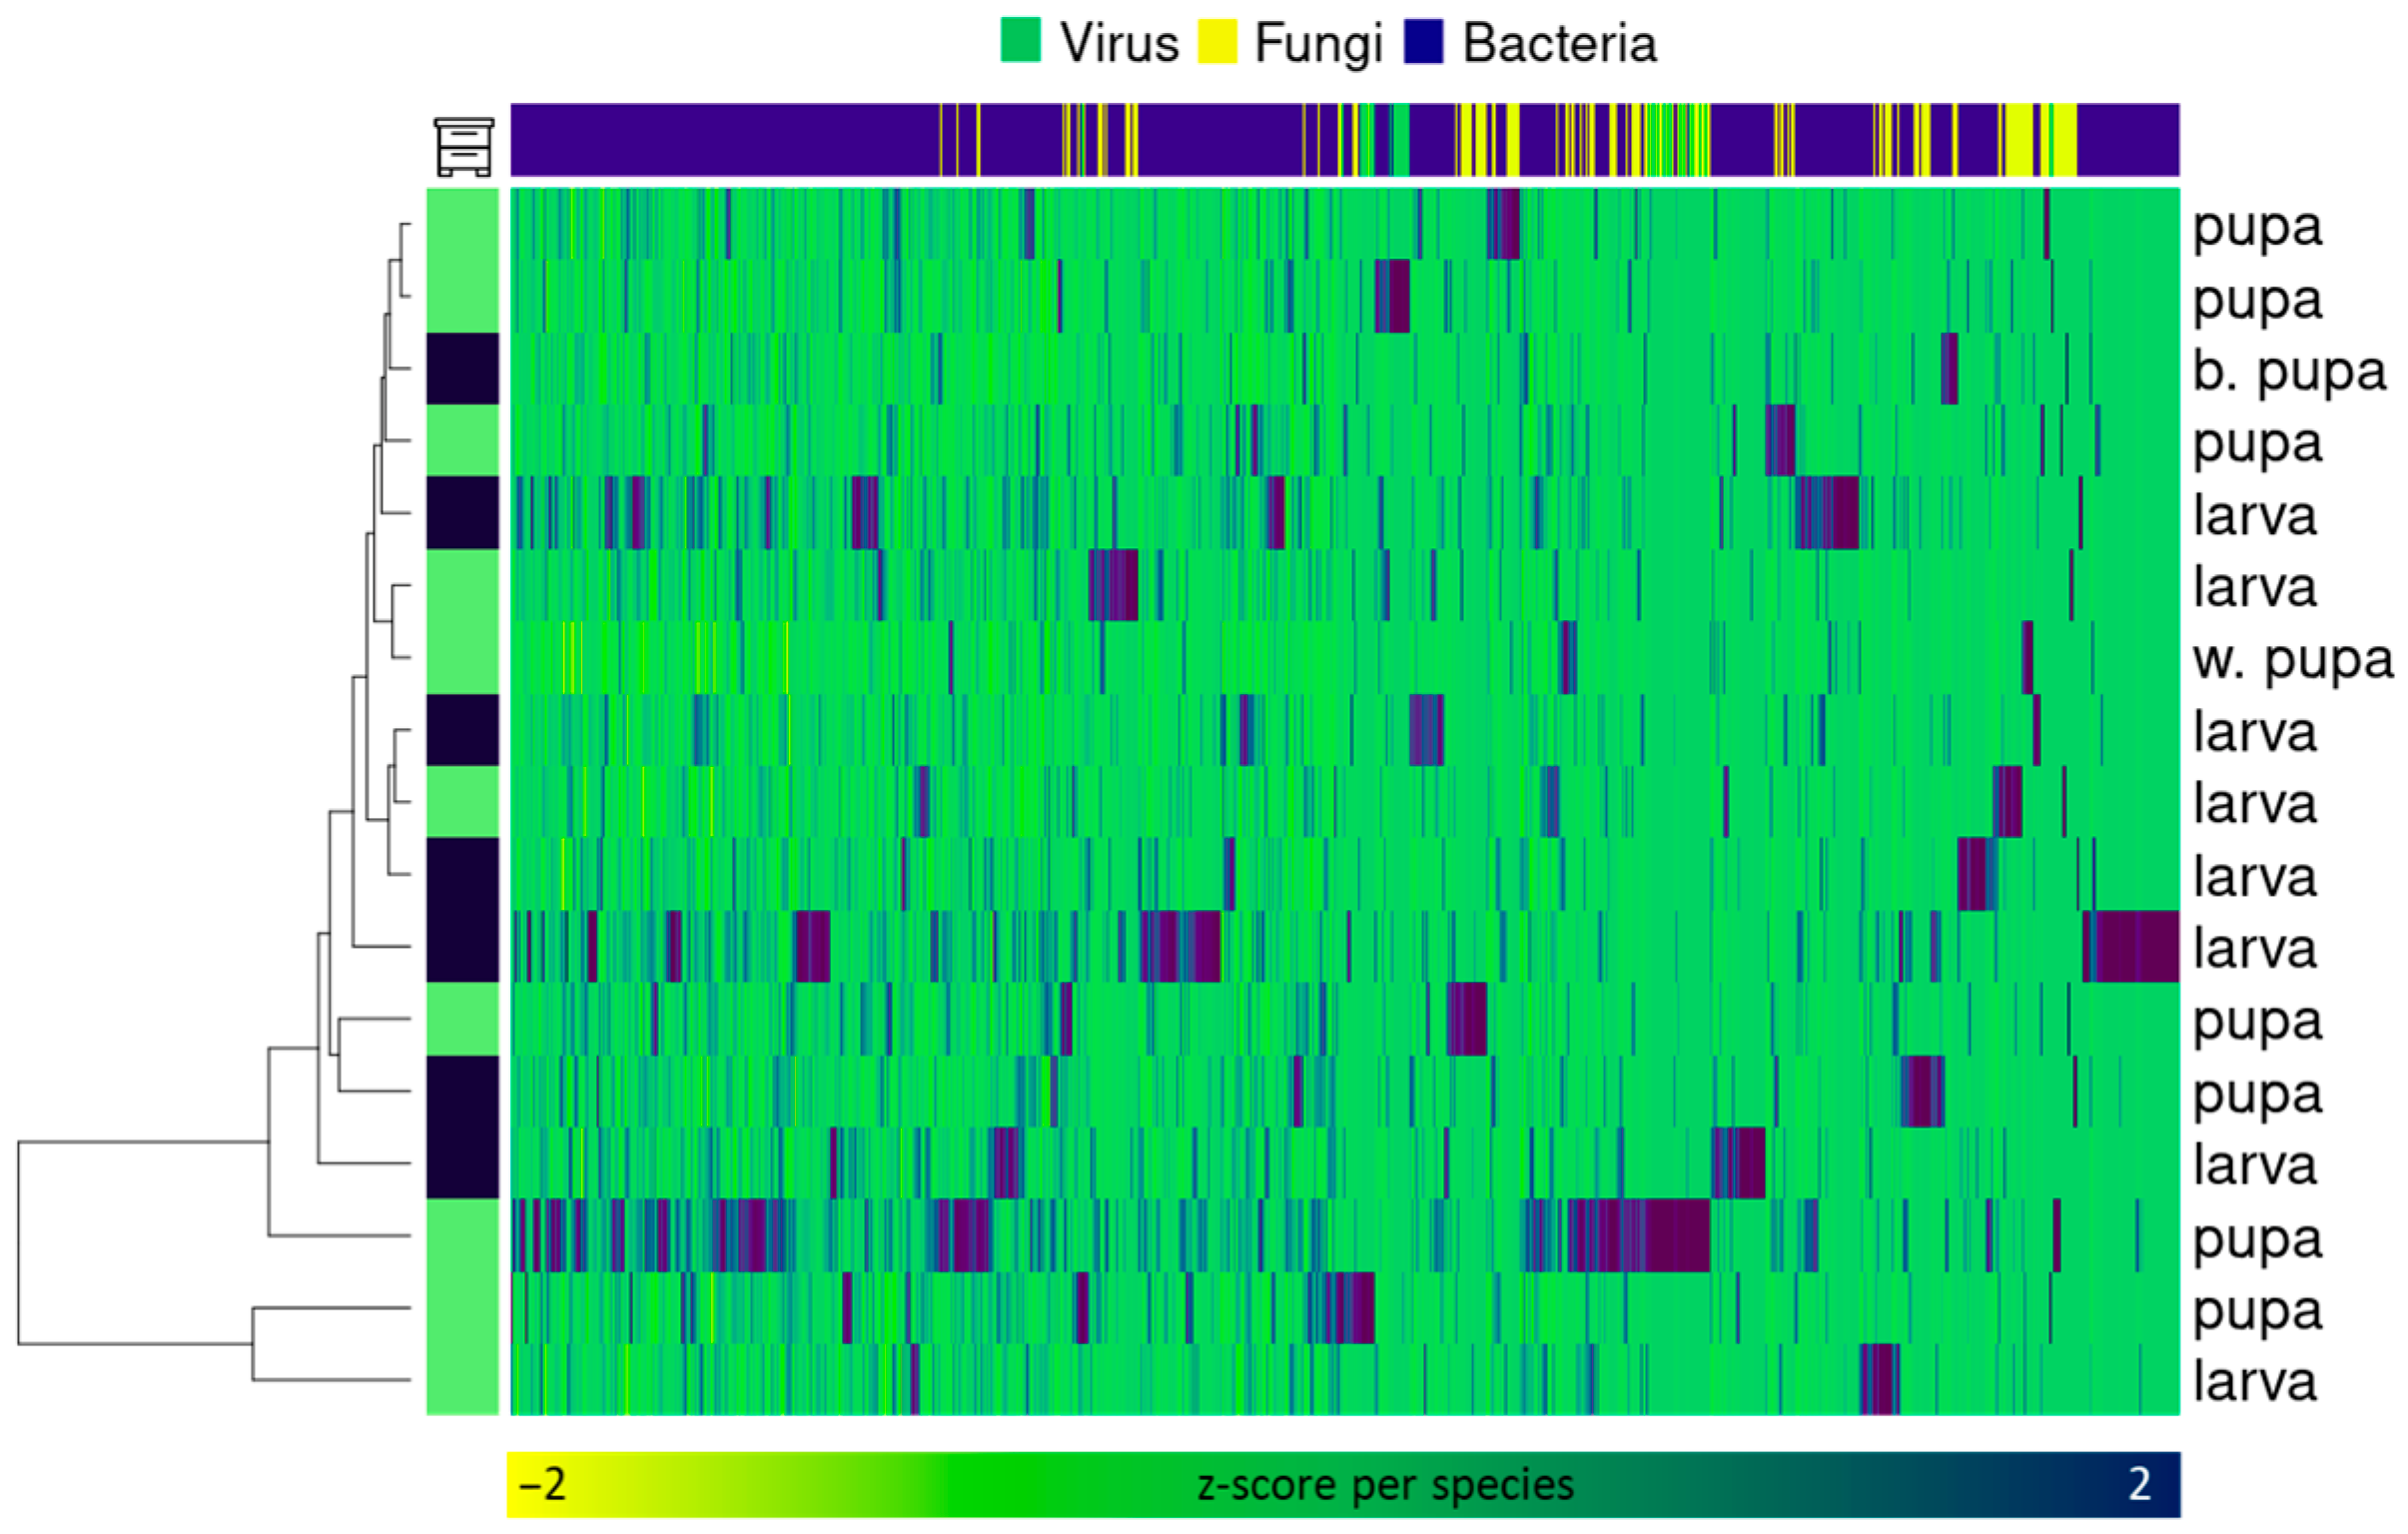
2.2. Diversity Analysis

The alpha-diversity analysis is presented on Figure S6. The dominance analyses show that 2–4 samples fall out of the total sample depending on the analysis. All of these samples show large amounts of Gilliamella and Protobacteria in general, which may have been introduced from the gut of adults. Evenness analyses isolate these same samples, or describe all samples homogeneous. In contrast, the remaining samples do not exhibit significant differences from each other in terms of these metrics.
Different richness measures and Kempton and Taylor’s Q coefficient differ in the other two samples, from different hives and at different stages. The sizes of these metagenomes do not differ from the others, similar numbers of Apis mellifera reeds were isolated in these samples, and their metagenomic compositions are similarly typical.
Jaccard’s dissimilarity does not show any grouping of samples by overall diversity (Figure S7). The individual difference between the bacterial composition of the samples is greater than between any groups. The coefficient values range from 0.63 to 0.77, indicating a high consistency in bacterial composition. The composition of viruses and fungi differs to a greater extent. This is due, on the one hand, to the fact that fewer of these taxonomic units are annotated in the samples. On the other hand, these groups are mostly represented by few species with stochastic occurrence in the samples.
Bray–Curtis dissimilarity separates samples by hive and sampling stage (Figure S8). Moreover, it is most pronounced for the coefficient calculated on virus diversity. It is worth noting that the only detected pathogenic Apis mellifera virus, AMFV, is more prevalent in the first hive and among larvae (Figure 2). Although individual differences in fungal diversity between samples are greater than group differences, they cluster in a similar manner. Bacterial and total diversity separated samples by hive and stage to a lesser extent. The three samples falling out of the total sample by alpha diversity form a separate cluster.

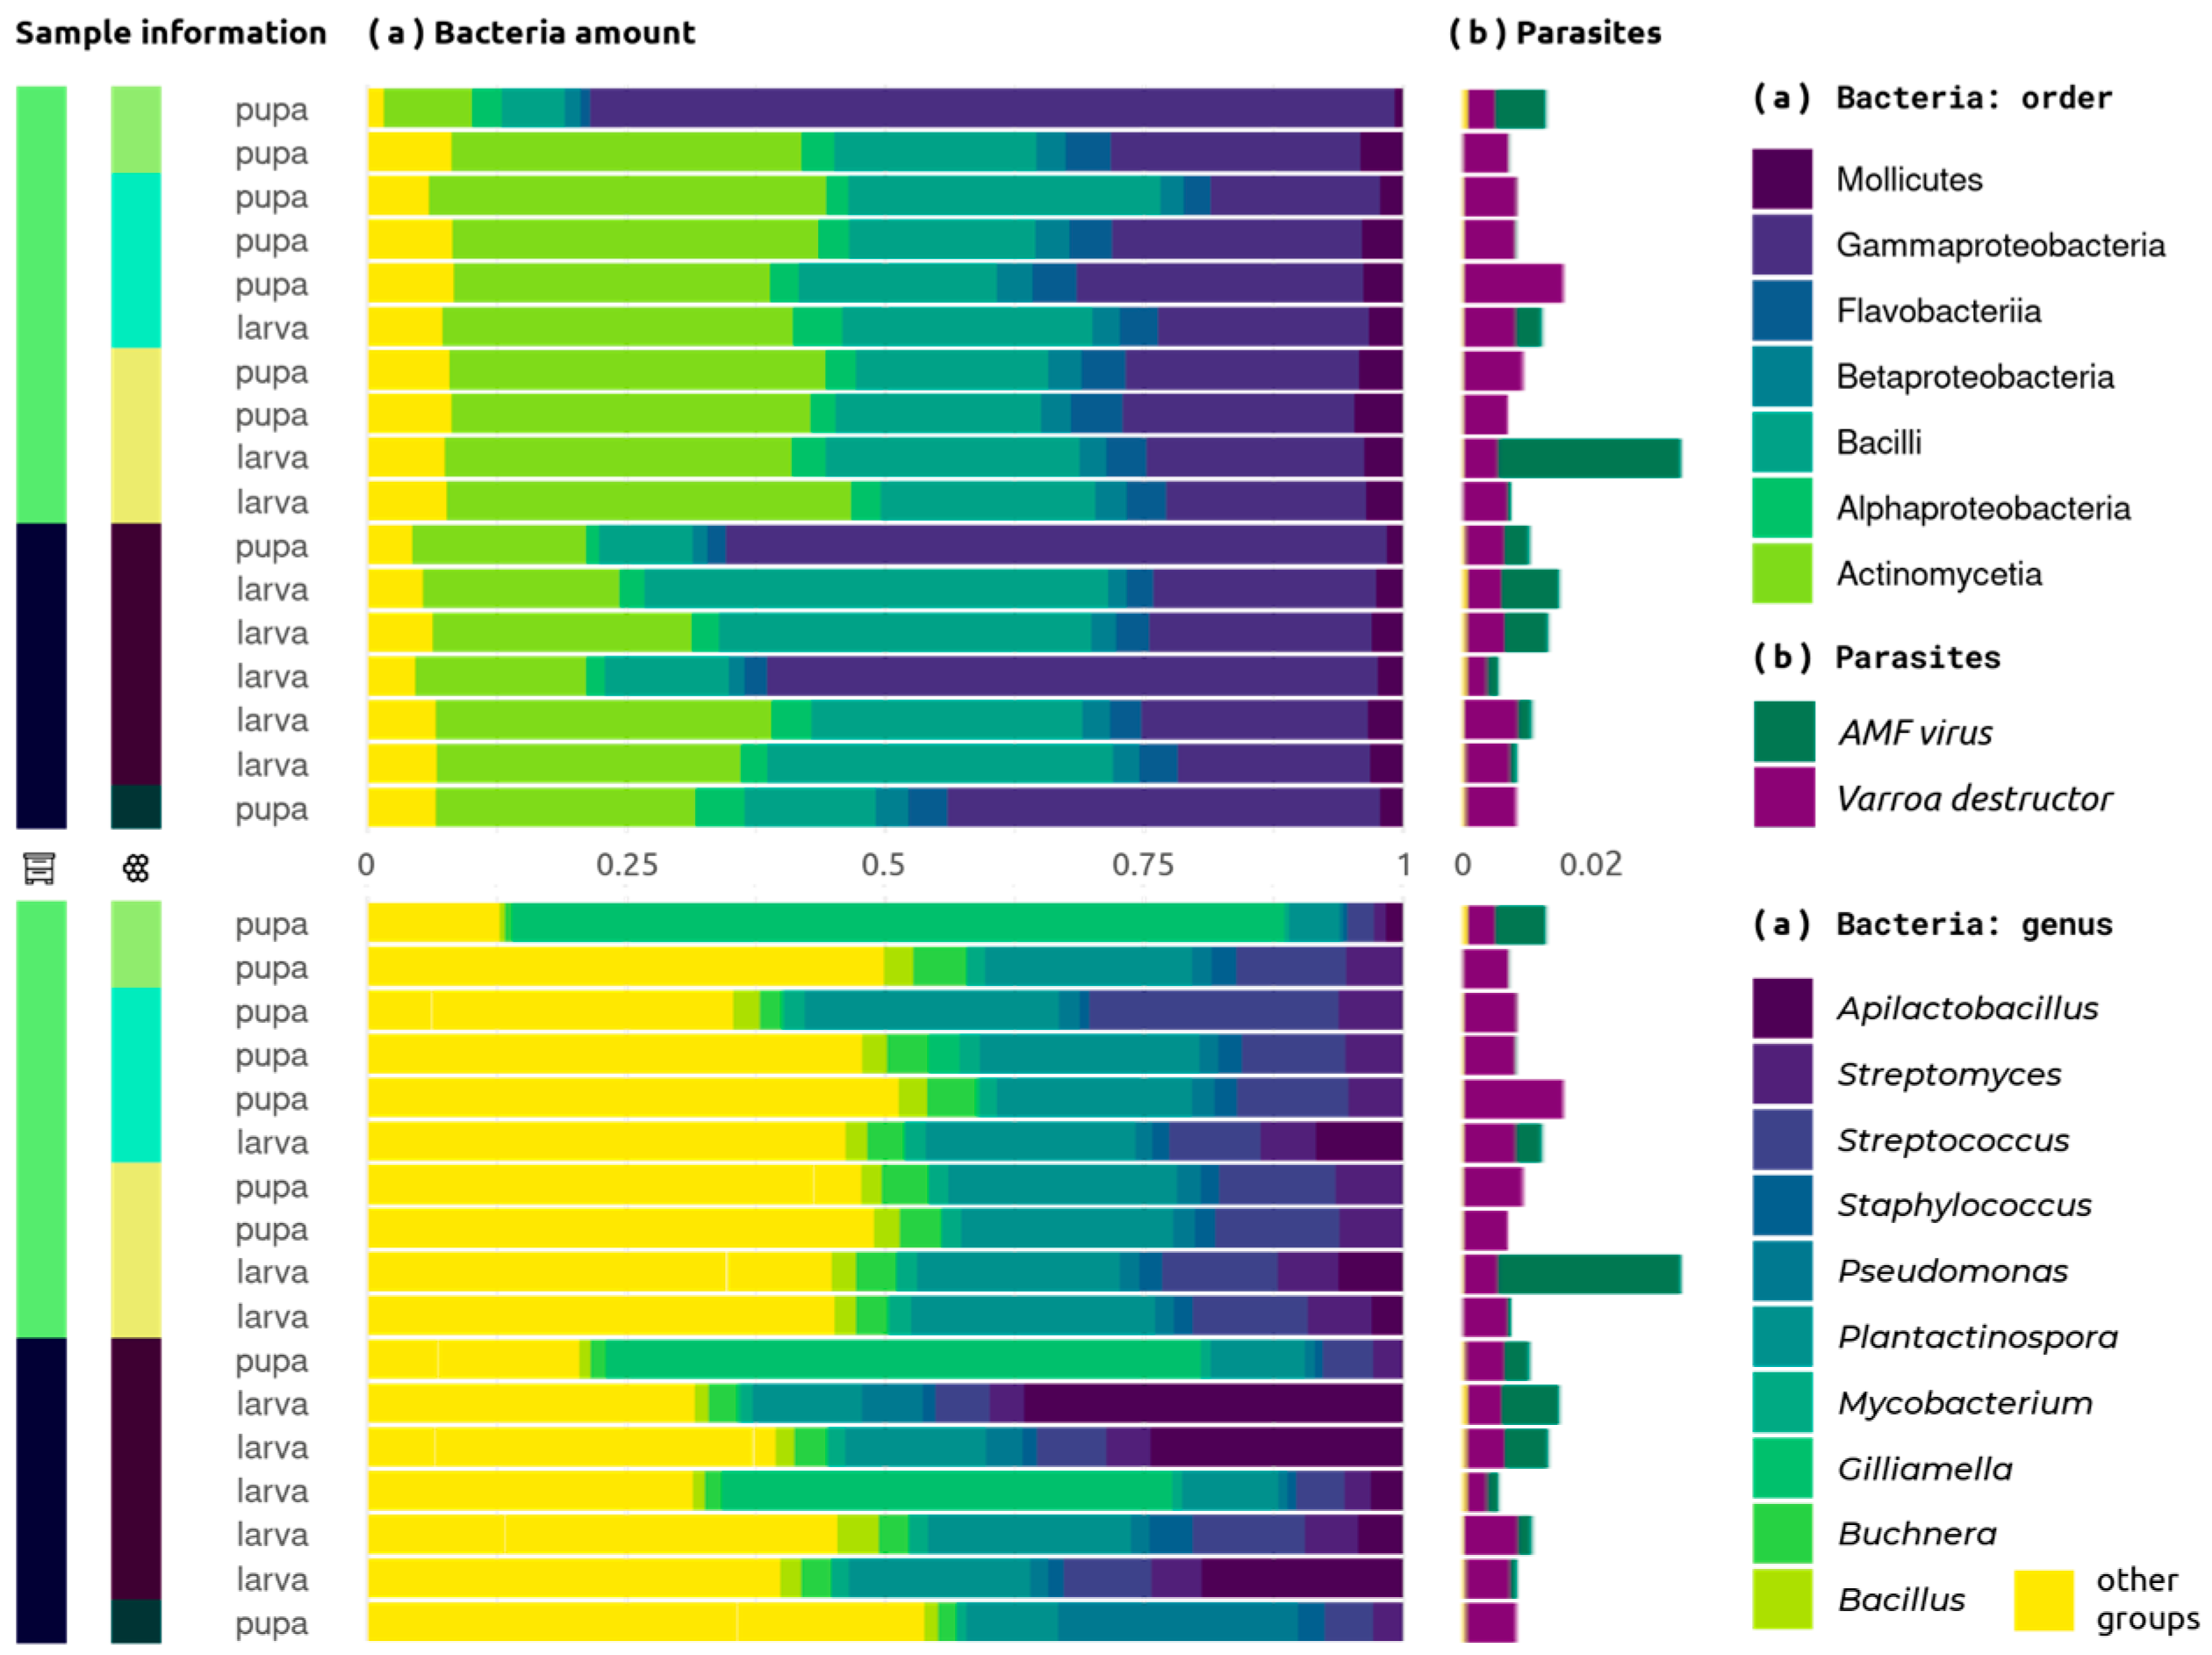
2.3. Composition Analysis

To identify the relationships between microbiome members, cluster (Figure S9), correlation (Figure S10) and tSNE (Figure S11) analyses of the most represented bacterial genera were performed. The results of these analyses are summarized in Figure 3.
Most of the diversity forms a single cluster (Figure S9). Bacillaceae, Lactobacillaceae and Enterobacteriaceae are most widely represented in it. Separating from this cluster are Streptococcus and Plantactinospora, Streptomyces, Pseudomonas and Buchnera, and separately, Gilliamella and Apilactobacillus.
A correlation analysis showed more distinct clusters. No significant correlations were found for Apilactobacillus, AMFV and Parasacharibacter (Figure S10). For some other species, correlation patterns seem to be random.
The most abundant taxa form five distinctive groups (Figure 3). Members of the bee gut microbiome Gilliamella, Frishella, Snograsella [13], Bartonella [60] and Parasacharibacter [61] show similar patterns of correlation with other species and their numbers in the metagenome are highly correlated with each other. This cluster could be divided in two subgroups—bigger “gut” include core adult gut members, and smaller “Bartonella” have higher correlations among them and slightly lower between.
The most represented, Actinobacteria, Bacillaceae and Enteobacteriaceae, form separate clusters we named “ABE”. Their composition is significantly negatively correlated with the “gut” cluster, but not with the “Bartonella” group. The strongest negative correlations in this cluster are observed for Bacillus, Streptomyces and Plantactinospora.
Another cluster includes potentially pathogenic bacteria—Pseudomonas [62,63] and Corynebacterium [64]—also found in small numbers in guts. However, it may include different members of Pseudomonas that differ in their ecology in the hive [65]. Its abundance correlates weakly with the other clusters.
Spiroplasma and Serratia, previously found in bees [66,67], with some other bacteria form two clusters (“S+S”). They do not correlate with each other very much, while the correlation patterns with other clusters are similar. Members of this cluster also could be potential pathogens. Bee louse is also related to them and might mediate transmission [68].
The tSNE compositions show some clustering patterns (Figure S11). The most species amount belongs to the “ABE”, gut and “Bartonella” groups, which do not separate from each other in the graph. tSNE shows that other heterogeneity can be observed in this group. The main representatives of these clusters are evenly distributed among this “super”-group in the graph. This may be due to their high constancy in all samples.
Apilactobacillus, Lactobacillus and AMFV form clusters with a small number of species. These signatures may be random, the results of species misclassification, or have some relationship with these species. Numerous species are not found among them.
A separate cluster is formed by Pseudomonas while “S+S” genomic signatures are scattered among all diversity. Also, tSNE reveals two mostly Acetobacteraceae groups, and three other clusters with small amount and diversity.

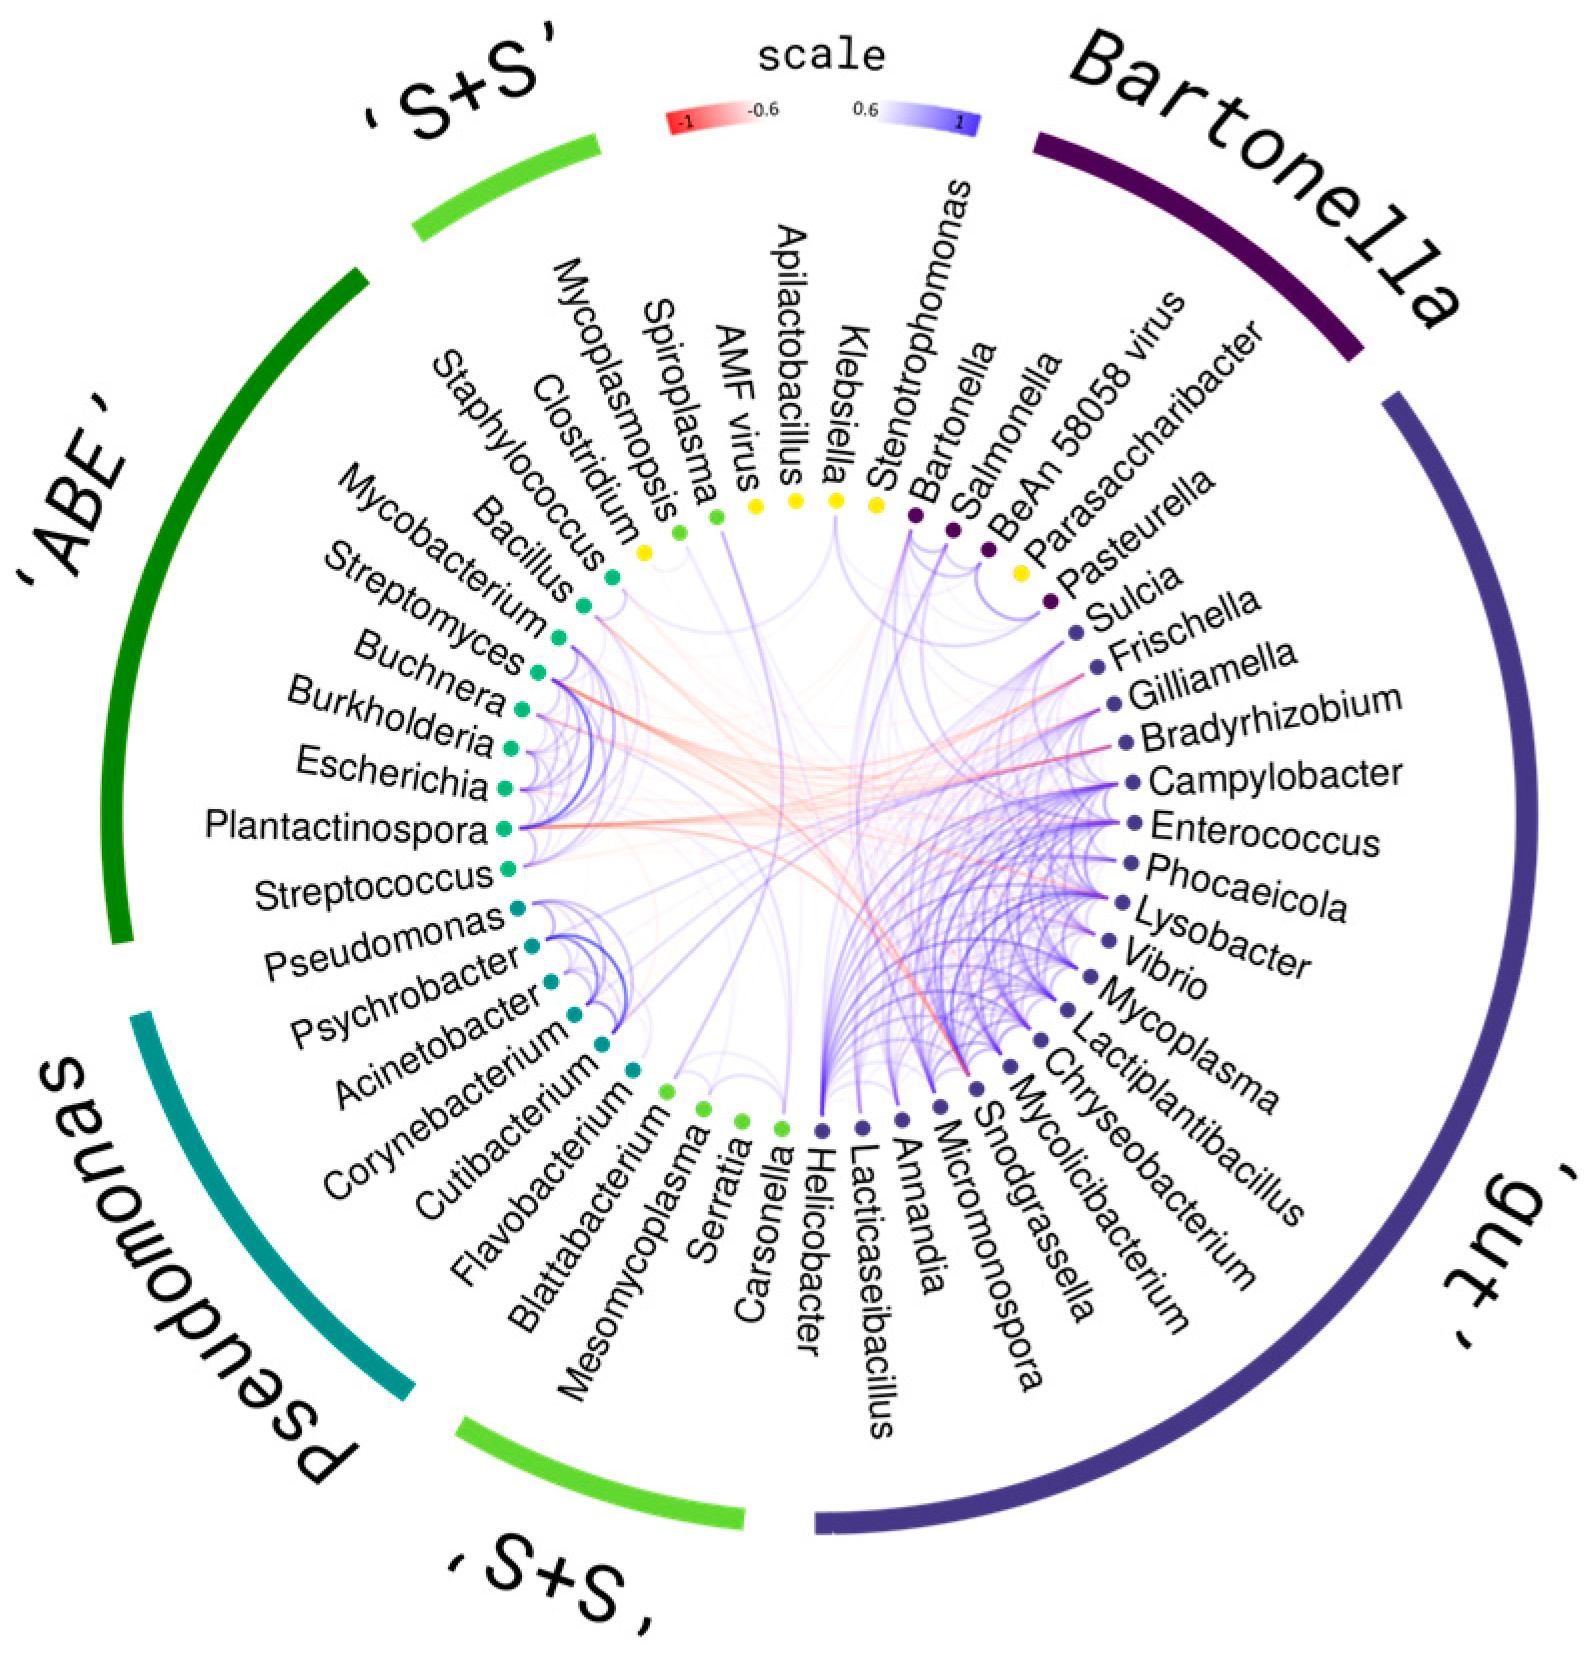
2.4. Composition Associations

While metagenome compositions provide valuable insights, it is imperative to also consider their functional significance within the community. To figure this out, we constructed a heatmap of samples across the most represented taxa (Figure 4). The clustering of combs with bees at the same stages and predominantly from the same hive is observed. Microorganisms may be grouped into small clusters according to environmental tolerance.
The heatmap does not form any discernible patterns in sample composition. Classified viruses and other taxa with slight abundances are usually detected in only one sample each, which makes them almost unaffected by clustering. Numbers of fungi and bacteria fluctuate between samples, but not significantly. But in general, samples form clusters by brood stage.
We compared taxa abundances between hive combs with different stages (Figure S12). In both hives studied, higher numbers of Apilactobacillus are found in cells with larvae. Gilliamella is more abundant in pupal cells, but only in one of the hives. Between brood combs with different stages vary the z-scale of Klebsiella, Snoegrasella, Buchnera and Streptomyces amount, while most other numerous members’ z-scaled amount differs between samples (Figure S10). Combs metagenome mappings differ both by stage and by the hive from which they were sampled (Figure 5). Dissimilarity between combs with different stages must be bigger than dissimilarity between combs from different hives. Differences are observed for projections on the second to fourth rather than first component. This possibly indicates an important role of minor diversity.

2.5. Genome Annotations

We analyzed gene annotations in the metagenome. Among the known genes, Gilliamella, Bacillus and Streptococcus genes are the most widely represented. The best InterPro annotations were obtained on large scaffolds with an ORF length greater than 100 on the PANTHER database (Figure S13). Most of the predicted genes have a Pollen A allergen signature, and a significant fraction of proteins were simply recognized as hypothetical allergens (Figure S14). Antifreeze, ferredoxin and IGF-like proteins were the most widely annotated.
There were also a lot of genes identified related to energy, cell wall, shikimate and b12 metabolism. Surprisingly, a lot of genes were related to tagatose, petrobactin and molybdopterin metabolism. Also, we find several genes related to antibiotic production and resistance: macB, ycaO, cvaA, bcr and bceA.

3. Discussion

Brood combs provide a medium for a diverse microbiome. All major representatives of the gut microbiome of adult and larvae bees [29,69,70,71] and honey [35,40] were observed in the samples. Bacteria abundance is much higher than eukaryotic. The most abundant bacterial species coincide in most microbiomes. Similar situations are observed in other hive metagenomes [14,32,44,72,73,74]. Metagenomes vary due to environmental factors and control systems. The bee gut microbiome contains only a few species that determine almost all of its functionality and stability [13,17,75]. At the same time, honey [14,39,40], propolis [43,48], royal jelly [24,61,76] and brood cells contain a diverse microbiota without sharply distinguished dominants. Unlike the gut, representatives of these microbiomes can be found outside the hive [15,23,31]. Their specialization and transmission between hives remains an open question [15,72,77]. In fact, some strains and species appear to be specialized only to specific hive microniches [78,79,80], so they must be transduced between hives. Environmental species also adapt to specific ecological factors of the hive and form community parts depending on that and pollination landscape [16,35,37].
More than 18% of taxa in shotgun honey research was identified using a custom database, while HoloBee reveals only 8% of species listed [35]. We investigated hives remote from the usual study sites, and among other reasons, the results of taxonomic annotation are different from those known on bees (Figure S1). The brood comb metagenome shows significant numbers of bacilli, as in the honey metagenome [35], and gamma-proteobacteria, as in larvae at some stages [69,70,71]. Unlike other hive metagenomes, combs are dominated by Actinobacteria (Figure 2).
The number of taxa detected is very much higher than predicted by culture methods [55]. This may be due to the fact that nutrient agar was used in this work. Gilliamella and some other representatives of the adult gut are not cultured on aerobic media, although they can be found in the hive under aerobic conditions. Plantactinospora grows poorly on nutrient agar, as do other bacteria, especially compared to Bacilli. Actinobacteria genus Actinomadura, Nocardiopsis, Nonomuraea [58] and Leifsonia [55], previously identified in hive combs, were not found. Other taxa found in previous studies were also found by us. Streptomyces, Bacillus, Lactobacillus, Corynebacterium and Apilactobacillus species are represented by a large number of closely related reads in the pooled microbiome. We cannot verify the presence of Enterobacteriaceae enteric group 60 from previous research [55]. It was firstly described as Morganella [81] and might be related to hypothetical Erwiniaceae and Buchnera or other Enterobacteriales members of comb microbiome.
Bacteria form three groups by their abundance correlations (Figure 3). Most likely, an admixture of adult gut core species representatives is a contamination. Gilliamella, Frishella and Bartonella are rare in hive environments [15,37], obligate anaerobic [13] and do not determine the clustering of samples. Parasacharibacter apium that cluster with them are found in the larval midgut and food stores [82]. So, this contamination might be mediated by foragers. Mycoplasma, Lysobacter, Vibrio, Helicobacter and some other bacteria were not previously found in hives. But reads of these hypothetical taxa also cluster with core gut species, so all this group (“gut” and “Bartonella”) could be a contamination.
Other big group include the majority of saccharolytic Bacillaceae and Enterococcaceae, Actinobacteria and also gut Burkholderia [83] (“ABE” group). Klebsiella, Shigella, Esherichia and other Enterobacteriaceae might have main metabolic functions [84]. Small hive beetle amount correlates positively with members of this group. Some “ABE” Enterobacteriaceae species previously were found as associated with Aethina microbiota [59]. All taxa that we also found were not unique for that beetle, so it could play the role of transferring part of brood comb microbiota [59,85]. Majority Bacillaceae and any Actinobacteria from “ABE” were not previously found in association with Aethina, so understanding of their transmission and function validation is a future work.
“ABE” group composition is negatively correlated with the abundance of the “gut” group. The introduction of gut microbiota from the hive can be random but should be an ongoing process. Bacilli species should increase stability of microbiome [57]. Actinobacteria and some Bacillus and Streptomyces species can produce antimicrobials against invaders [46,86,87]. So, in addition to contamination, the “gut” group may include organisms that are in an antagonistic relationship with “ABE” species. They may have lost some of their resistance genes to secreted antimicrobials. Their consistency and function in brood combs should be investigated in future.
Gene annotation analysis identified several known genes including five genes associated with antibiotic synthesis or resistance. MinPath predicts multiple genes for basic metabolism and cell wall synthesis which are common in bacterial metagenomes. A lot of Gilliamella genes with well-annotated functions also were detected [88].
Surprisingly a lot of annotated genes were related to tagatose metabolism and possibly to D-tagatose pathway. This sugar may be found in nectar and honey [89], and apparently some members are specialized to metabolize it. This niche may be occupied by some Staphylococcus or Bacillus strains in which a relevant metabolism has been previously discovered [90].
Three genes (folB, moaB and moaC) are related to the metabolism of molybdenum cofactor. Genes containing this prosthetic group are formate dehydrogenase, nitrate reductase and some others [91]. Molybdopterin biosynthesis genes, including those in our metagenome (moaB and moeB), have been identified in the Gilliamella genome [92]. Members with these pathways have yet to be identified.
Petrobactin biosynthesis genes have been identified in presumably Bacillus reads (yclN, yclB and yclP). This siderophore is responsible for iron uptake in pathogenic bacteria [93]. In small hive beetles, the presence of Bacillus licheniformis was previously noted [59], some strains of which are capable of producing it.
Microcin biosynthesis genes ycaO and colicin biosynthesis genes cvaA are found in the metagenome. These antibiotics are produced by a variety of Bacilli.
Macrolide resistance gene macB, bicyclomycin bcr and bacitracin bceA have been found. Streptomyces from Apis dorsata bees and hive environments are known to produce antimicrobials [86]. Bacitracin is a well-known Bacillus antimicrobial. It is suggested to be found in honey [87].
All antimicrobial-related genes could be theoretically found in the “ABE” group species, first of all in Actinobacteria and Bacillus. It is these species that show the highest negative correlations with other groups, including the potentially pathogenic “S+S” and “Pseudomonas”. The “ABE” group is just as negatively correlated with “gut”, but much less so with “Bartonella”. This may be both an artifact of the analysis and an indication that “Bartonella” representatives have a separate function in this microbiome. Unlike other bacteria associated with the bee gut, members of this subgroup are facultative aerobes [60,82] and their development is probably less suppressed in combs.
Apilactobacillus kunkeei is a member of adult and larvae gut microbiota [13,80], but also was found in honey [35,78]. No significant correlations were found for it as well as for Bifidobacterium, Clostridium and some other species. These groups may include random microorganisms, for example—it should include closely related organisms and organisms with low abundance in samples, because they may appear and disappear randomly in the metagenome and its classifications. On the other hand, it will also include microorganisms with special functions that define some meaningful differences between different combs.
The composition of the microbiome varied little between individuals (Figure 2, Figures S3 and S4). All “ABE” group and fungi species represent 30–70% of the total classified signatures, and correlations between their amounts seems to be stable. Cluster analysis and PCA show differences between combs with larvae and pupae (Figure 4 and Figure 5).
Bee larvae guts contain many bacteria [15]. The composition of these communities is less constant than that of the adults [70], but it differs considerably from that found in their food [69,94]. Theoretically, the main sources of microbiota in larval combs should be communities from their gut or food. But it looks like brood combs carry an independent community, which may influence its own larvae communities. While some groups have similar amounts, the dominant group of larvae gut microbiome—Acetobacteraceae, Parasacharibacter apium—was detected in trace amounts.
How important is this microbiome in larval nutrition? A culture study predicts a significant shifting of the larval microbiome during adulthood [70]. No Actinobacteria were detected, and the overwhelming number of identified representatives belong to Lactobacillus and Apilactobacillus. On the other hand, gut examination by RT-PCR of prepupal larvae detects Actinobacteria in the gut of some larvae and pupae, but in much lower numbers than other bacteria [95]. DGGE analysis predicts much more consistency for larvae gut microbiome than pupal [71] and bigger amounts of proteobacteria (maybe Gilliamella) in pupal guts. In this study, the number of Actinobacteria and Gammaproteobacteria 16S in larval guts seems to be constant, while the Firmicutes amount grows to the sixth-instar larvae and then significantly decreases. The difference in Apilactobacillus amount and minor species composition between pupae and larvae combs in the present study must be an indicator of these processes.
It is known that the gut microbiota of pupae in bumblebees can influence changes in their phenotypes [96]. In bees themselves, an antagonistic effect of this microbiome on Paenibacillus alvi has been shown [97]. This may be due to the secondary metabolites it secretes and less likely to its composition because of its inconsistency. Microbes themselves increase antimicrobial response by the host bee [98].
The larval microbiome was previously thought to be populated by ingestion of contaminated food [69,94]. It appears that the comb microbiome may play a probiotic role in initiating the development of normal microflora. It is likely that the microbiome of larvae, and most likely from combs as well, does not directly affect the pupation process [98]. Major bacteria from the larval gut are not inhibited by royal jelly [70]. The influence of larval nutrition on the brood comb microbiome remains to be elucidated.
Any analysis except PCA does not reveal differences between combs with larvae and pupae (Figure 5). Perhaps this is an indicator of the permanence of the microbiome, which remains stable across most taxonomic units regardless of environmental factors. On the other hand, the complex differences detected by PCA may indicate some difference in their functioning. Major differences in the number of Apilactobacillus and Gilliamella unreliably distinguish combs with pupae and larvae (Figure 4), and these are the ones that define the first major components. Differences between brood combs are observed only from the second component onwards, indicating the role of the remaining diversity.
Before pupation, bees plug the comb [13,57]. Pupae do not feed and their gut is almost completely devoid of microbes, especially in the later stages [13,71]. Their comb community may be less rich due to fewer nutrients. On the other hand, larval combs contain fewer CFUs than hive surfaces [15,55]. Perhaps some species responsible for the constancy of their microbiome may disappear from the microflora, leading to an increase in diversity. Finally, a change in conditions may lead to the development of a new community altogether. Thus, the study of this community and its role in hive life is just beginning.

4. Materials and Methods

4.1. Sample Collection

Organisms for the description of surface microorganisms were collected from two different hives on 7 July 2022. Samples were collected from different frames. We used only 5th instar larvae and mostly white pupae. Every sampled comb was washed using Qiagen lysis buffer for DNA extraction (Qiagen, Hilden, Germany). Every comb was flushed twice, per 200 μL. For better cell destruction, samples were frozen and unfrozen for 3 times. Next day DNA from all samples were extracted using Blood & Cell Culture DNA Mini Kit (Qiagen, Hilden, Germany). All obtained samples were stored in individual Eppendorf Tubes at −20 °C.

4.2. Sequencing

Library preparation for shotgun metagenomics DNA was quantified and quality-assured with a capillary electrophoresis TapeStation 4200 (Agilent, Santa Clara, CA, USA), and sequenced using the Illumina HiSeq (San Diego, CA, USA). Expected read length was 100 bp. In total, we sequenced 17 comb materials from 2 different hives. Both hives are engaged in Russia, Leningrad oblast.

4.3. Data Processing

Reads were trimmed using Trimmomatic [99]. Then, contamination was removed by bowtie2 [100]. For decontamination of human DNA and removing host DNA we used the recent GRCh38 human genome and Apis mellifera genome GCA_003254395.2 from NCBI RefSeq.

4.4. Taxonomic Analysis

Taxonomic analysis was performed using Kraken 2 [101] and Kaiju [102] on RefSeq and HoloBee databases. All charts were plotted using a customized script using R programming language [103], RStudio [104] and necessary libraries [105,106,107,108,109,110,111,112,113]. Various metrics available in the R abdiv package [114] were used to analyze alpha diversity. Beta diversity was assessed using the Bray–Curtis and Jaccard dissimilarity coefficients.
IDBA-UD [115] assembly from pooled reads with k-mers 34–104, and a step size of 10 was used to analyze gene functions. Secondary metabolites and pathways were analyzed using Interproscan [116], antiSMASH [117], Prokka [118] with Artemis [119] and MinPath [120]. All results were summarized.

5. Conclusions

The brood combs microbiome exhibits distinct characteristics compared to other hive microbiomes, including honey. Most of the dominant species are aerobic saccharolytic bacteria. Although certain species may experience occasional outbreaks of diversity, the overall diversity remains remarkably stable and shows minimal variation between combs.
The differences observed between larval and pupal combs are primarily determined by the whole present community. It is possible that there are quantitative variations in metagenome abundance between these two types of combs, leading to the disappearance of some species with lower diversity from the annotations. This phenomenon could be attributed to the changing conditions between larval and pupal combs, such as the depletion of a constant source of new sugars and alterations in other environmental factors. Surprisingly, these changes do not significantly impact the underlying biodiversity of the combs. Therefore, it is likely that the minor diversity plays a crucial role in the functioning of this microbiome.
The contribution of the comb microbiome to the developmental trajectory of bees remains an enigma that requires further exploration. While the mechanisms involved in the metamorphosis of typical larvae into prospective hive queens are well understood and associated with nutritional factors, the precise mechanisms that regulate the decision-making process, determining which larvae will receive an adequate diet, remain obscure. It is possible that a selection protocol exists for larvae allocated to receive the royal jelly intended for emerging queens, which may be intertwined with the biochemistry of the comb microbiomes.

Supplementary Materials

The supporting information can be downloaded at: https://www.mdpi.com/article/10.3390/ijms25020741/s1. References [121,122,123,124,125,126,127,128,129,130,131,132,133,134,135,136] are cited in the supplementary materials.

Author Contributions

L.A. and D.S. formed the idea of this study. D.S. gathered the biological specimens, and collected and structured information; D.S. and A.T. developed the theory, performed the computations and verified the analytical methods. E.L. assisted in writing the draft manuscript and data visualization. All authors discussed the results and contributed to the final manuscript. All authors have read and agreed to the published version of the manuscript.

Funding

This study was supported by the Ministry of Science and Higher Education of the Russian Federation within the framework of the Federal Scientific and Technical Program for the Development of Genetic Technologies for 2019–2027 (agreement No. 075-15-2021-1345, unique identifier RF-193021X0012).

Institutional Review Board Statement

Not applicable.

Informed Consent Statement

Not applicable.

Data Availability Statement

All data used in the manuscript was published at BioProject PRJNA1048732. For reproducibility and possible use in other studies, we have also added information about the code availability: R scripts for visualizations are available at https://github.com/dsmutin/aRchiteutis (accessed on 1 October 2023).

Acknowledgments

This research would not have been possible without the assistance of A. Lisitsa and A. Kargin. The authors would like to thank L.Okorokova and A.Drozdov for valuable comments, which helped in structuring and information selection. The authors would like to thank D. Solovey for help in classifying fungal metagenomes and V. Volkova for help in plot design. Sequencing was performed at Genetico (Russia).

Conflicts of Interest

The authors declare no conflicts of interest. The funders had no role in the design of the study; in the collection, analyses, or interpretation of data; in the writing of the manuscript; or in the decision to publish the results.

References

  1. Berg, G.; Rybakova, D.; Fischer, D.; Cernava, T.; Vergès, M.-C.C.; Charles, T.; Chen, X.; Cocolin, L.; Eversole, K.; Corral, G.H.; et al. Microbiome definition re-visited: Old concepts and new challenges. Microbiome 2020, 8, 103. [Google Scholar] [CrossRef]
  2. Robinson, C.D.; Bohannan, B.J.; Britton, R.A. Scales of persistence: Transmission and the microbiome. Curr. Opin. Microbiol. 2019, 50, 42–49. [Google Scholar] [CrossRef] [PubMed]
  3. Warren, J.R.; Marshall, B. Unidentified curved bacilli on gastric epithelium in active chronic gastritis. Lancet Lond. Engl. 1983, 1, 1273–1275. [Google Scholar]
  4. Foley, K.; Fazio, G.; Jensen, A.B.; Hughes, W.O.H. The distribution of Aspergillus spp. opportunistic parasites in hives and their pathogenicity to honey bees. Vet. Microbiol. 2014, 169, 203–210. [Google Scholar] [CrossRef]
  5. Diggle, S.P.; Whiteley, M. Microbe, Profile: Pseudomonas aeruginosa: Opportunistic pathogen and lab rat. Microbiol. Read. Engl. 2020, 166, 30–33. [Google Scholar] [CrossRef]
  6. Coyte, K.Z.; Schluter, J.; Foster, K.R. The ecology of the microbiome: Networks, competition, and stability. Science 2015, 350, 663–666. [Google Scholar] [CrossRef] [PubMed]
  7. Yonatan, Y.; Amit, G.; Friedman, J.; Bashan, A. Complexity-stability trade-off in empirical microbial ecosystems. Nat. Ecol. Evol. 2022, 6, 693–700. [Google Scholar] [CrossRef] [PubMed]
  8. Shaw, L.P.; Bassam, H.; Barnes, C.P.; Walker, A.S.; Klein, N.; Balloux, F. Modelling microbiome recovery after antibiotics using a stability landscape framework. ISME J. 2019, 13, 1845–1856. [Google Scholar] [CrossRef]
  9. Watanabe, H.; Nakamura, I.; Mizutani, S.; Kurokawa, Y.; Mori, H.; Kurokawa, K.; Yamada, T. Minor taxa in human skin microbiome contribute to the personal identification. PLoS ONE 2018, 13, e0199947. [Google Scholar] [CrossRef]
  10. Tabrett, A.; Horton, M.W. The influence of host genetics on the microbiome. F1000Research 2020, 9, 84. [Google Scholar] [CrossRef]
  11. Barber, C.; Mego, M.; Sabater, C.; Vallejo, F.; Bendezu, R.A.; Masihy, M.; Guarner, F.; Espín, J.C.; Margolles, A.; Azpiroz, F. Differential, Effects of Western and Mediterranean-Type, Diets on Gut, Microbiota: A Metagenomics and Metabolomics, Approach. Nutrients 2021, 13, 2638. [Google Scholar] [CrossRef] [PubMed]
  12. Kešnerová, L.; Emery, O.; Troilo, M.; Liberti, J.; Erkosar, B.; Engel, P. Gut microbiota structure differs between honeybees in winter and summer. ISME J. 2020, 14, 801–814. [Google Scholar] [CrossRef] [PubMed]
  13. Kwong, W.K.; Moran, N.A. Gut microbial communities of social bees. Nat. Rev. Microbiol. 2016, 14, 374–384. [Google Scholar] [CrossRef] [PubMed]
  14. Bovo, S.; Ribani, A.; Utzeri, V.J.; Schiavo, G.; Bertolini, F.; Fontanesi, L. Shotgun metagenomics of honey DNA: Evaluation of a methodological approach to describe a multi-kingdom honey bee derived environmental DNA signature. PLoS ONE 2018, 13, e0205575. [Google Scholar] [CrossRef]
  15. Khan, K.A.; Al-Ghamdi, A.A.; Ghramh, H.A.; Ansari, M.J.; Ali, H.; Alamri, S.A.; Kahtani, S.N.A.; Adgaba, N.; Qasim, M.; Hafeez, M. Structural diversity and functional variability of gut microbial communities associated with honey bees. Microb. Pathog. 2020, 138, 103793. [Google Scholar] [CrossRef]
  16. Anderson, K.E.; Sheehan, T.H.; Mott, B.M.; Maes, P.; Snyder, L.; Schwan, M.R.; Walton, A.; Jones, B.M.; Corby-Harris, V. Microbial ecology of the hive and pollination landscape: Bacterial associates from floral nectar, the alimentary tract and stored food of honey bees (Apis mellifera). PLoS ONE 2013, 8, e83125. [Google Scholar] [CrossRef]
  17. Bonilla-Rosso, G.; Engel, P. Functional roles and metabolic niches in the honey bee gut microbiota. Curr. Opin. Microbiol. 2018, 43, 69–76. [Google Scholar] [CrossRef]
  18. Copeland, D.C.; Anderson, K.E.; Mott, B.M. Early queen development in honey bees: Social context and queen breeder source affect gut microbiota and associated metabolism. Microbiol. Spectr. 2022, 10, e0038322. [Google Scholar] [CrossRef]
  19. Maes, P.W.; Rodrigues, P.A.P.; Oliver, R.; Mott, B.M.; Anderson, K.E. Diet-related gut bacterial dysbiosis correlates with impaired development, increased mortality and Nosema disease in the honeybee (Apis mellifera). Mol. Ecol. 2016, 25, 5439–5450. [Google Scholar] [CrossRef]
  20. Tarpy, D.R.; Mattila, H.R.; Newton, I.L.G. Development of the honey bee gut microbiome throughout the queen-rearing process. Appl. Environ. Microbiol. 2015, 81, 3182–3191. [Google Scholar] [CrossRef]
  21. Kwong, W.K.; Mancenido, A.L.; Moran, N.A. Immune system stimulation by the native gut microbiota of honey bees. R. Soc. Open Sci. 2017, 4, 170003. [Google Scholar] [CrossRef]
  22. Leonard, S.P.; Powell, J.E.; Perutka, J.; Geng, P.; Heckmann, L.C.; Horak, R.D.; Davies, B.W.; Ellington, A.D.; Barrick, J.E.; Moran, N.A. Engineered symbionts activate honey bee immunity and limit pathogens. Science 2020, 367, 573–576. [Google Scholar] [CrossRef]
  23. Anderson, K.E.; Sheehan, T.H.; Eckholm, B.J.; Mott, B.M.; DeGrandi-Hoffman, G. An emerging paradigm of colony health: Microbial balance of the honey bee and hive (Apis mellifera). Insectes Sociaux 2011, 58, 431–444. [Google Scholar] [CrossRef]
  24. Harwood, G.; Salmela, H.; Freitak, D.; Amdam, G. Social immunity in honey bees: Royal jelly as a vehicle in transferring bacterial pathogen fragments between nestmates. J. Exp. Biol. 2021, 224, jeb231076. [Google Scholar] [CrossRef]
  25. Liberti, J.; Engel, P. The gut microbiota—Brain axis of insects. Curr. Opin. Insect Sci. 2020, 39, 6–13. [Google Scholar] [CrossRef]
  26. Huang, Y.; Li, N.; Yang, C.; Lin, Y.; Wen, Y.; Zheng, L.; Zhao, C. Honeybee as a food nutrition analysis model of neural development and gut microbiota. Neurosci. Biobehav. Rev. 2023, 153, 105372. [Google Scholar] [CrossRef]
  27. Good, A.P.; Gauthier, M.-P.L.; Vannette, R.L.; Fukami, T. Honey bees avoid nectar colonized by three bacterial species, but not by a yeast species, isolated from the bee gut. PLoS ONE 2014, 9, e86494. [Google Scholar] [CrossRef] [PubMed]
  28. Gaggìa, F.; Jakobsen, R.R.; Alberoni, D.; Baffoni, L.; Cutajar, S.; Mifsud, D.; Nielsen, D.S.; Di Gioia, D. Environment or genetic isolation? An atypical intestinal microbiota in the Maltese honey bee Apis mellifera spp. ruttneri. Front. Microbiol. 2023, 14, 1127717. [Google Scholar] [CrossRef]
  29. Kwong, W.K.; Moran, N.A. Evolution of host specialization in gut microbes: The bee gut as a model. Gut Microbes 2015, 6, 214–220. [Google Scholar] [CrossRef] [PubMed]
  30. Zheng, H.; Steele, M.I.; Leonard, S.P.; Motta, E.V.S.; Moran, N.A. Honey bees as models for gut microbiota research. Lab. Anim. 2018, 47, 317–325. [Google Scholar] [CrossRef] [PubMed]
  31. Smutin, D.; Lebedev, E.; Selitskiy, M.; Panyushev, N.; Adonin, L. Micro”bee”ota: Honey bee normal microbiota as a part of superorganism. Microorganisms 2022, 10, 2359. [Google Scholar] [CrossRef]
  32. Schwarz, R.S.; Huang, Q.; Evans, J.D. Hologenome theory and the honey bee pathosphere. Curr. Opin. Insect Sci. 2015, 10, 1–7. [Google Scholar] [CrossRef]
  33. Ghosh, S.; Namin, S.M.; Jung, C. Differential bacterial community of bee bread and bee pollen revealed by 16s rrna high-throughput sequencing. Insects 2022, 13, 863. [Google Scholar] [CrossRef]
  34. Dharampal, P.S.; Carlson, C.; Currie, C.R.; Steffan, S.A. Pollen-borne microbes shape bee fitness. Proc. Biol. Sci. 2019, 286, 20182894. [Google Scholar] [CrossRef] [PubMed]
  35. Bovo, S.; Utzeri, V.J.; Ribani, A.; Cabbri, R.; Fontanesi, L. Shotgun sequencing of honey DNA can describe honey bee derived environmental signatures and the honey bee hologenome complexity. Sci. Rep. 2020, 10, 9279. [Google Scholar] [CrossRef] [PubMed]
  36. Miller, D.L.; Parish, A.J.; Newton, I.L. Transitions and transmission: Behavior and physiology as drivers of honey bee-associated microbial communities. Curr. Opin. Microbiol. 2019, 50, 1–7. [Google Scholar] [CrossRef] [PubMed]
  37. Anderson, K.E.; Carroll, M.J.; Sheehan, T.; Mott, B.M.; Maes, P.; Corby-Harris, V. Hive-stored pollen of honey bees: Many lines of evidence are consistent with pollen preservation, not nutrient conversion. Mol. Ecol. 2014, 23, 5904–5917. [Google Scholar] [CrossRef] [PubMed]
  38. Nicolson, S.W.; Neves, S.D.S.D.; Human, H.; Pirk, C.W. Digestibility and nutritional value of fresh and stored pollen for honey bees (Apis mellifera scutellata). J. Insect Physiol. 2018, 107, 302–308. [Google Scholar] [CrossRef] [PubMed]
  39. Wen, Y.; Wang, L.; Jin, Y.; Zhang, J.; Su, L.; Zhang, X.; Zhou, J.; Li, Y. The microbial community dynamics during the vitex honey ripening process in the honeycomb. Front. Microbiol. 2017, 8, 1649. [Google Scholar] [CrossRef] [PubMed]
  40. Wirta, H.; Abrego, N.; Miller, K.; Roslin, T.; Vesterinen, E. DNA traces the origin of honey by identifying plants, bacteria and fungi. Sci. Rep. 2021, 11, 4798. [Google Scholar] [CrossRef]
  41. Anderson, K.E.; Mott, B.M. Ecology of pollen storage in honey bees: Sugar tolerant yeast and the aerobic social microbiota. Insects 2023, 14, 265. [Google Scholar] [CrossRef] [PubMed]
  42. Donkersley, P.; Rhodes, G.; Pickup, R.W.; Jones, K.C.; Wilson, K. Bacterial communities associated with honeybee food stores are correlated with land use. Ecol. Evol. 2018, 8, 4743–4756. [Google Scholar] [CrossRef] [PubMed]
  43. Casalone, E.; Cavalieri, D.; Daly, G.; Vitali, F.; Perito, B. Propolis hosts a diversemicrobial community. World J. Microbiol. Biotechnol. 2020, 36, 50. [Google Scholar] [CrossRef] [PubMed]
  44. Garcia-Mazcorro, J.F.; Kawas, J.R.; Marroquin-Cardona, A.G. Descriptive bacterial and fungal characterization of propolis using ultra-high-throughput marker gene sequencing. Insects 2019, 10, 402. [Google Scholar] [CrossRef] [PubMed]
  45. Alberoni, D.; Gaggìa, F.; Baffoni, L.; Di Gioia, D. Beneficial microorganisms for honey bees: Problems and progresses. Appl. Microbiol. Biotechnol. 2016, 100, 9469–9482. [Google Scholar] [CrossRef] [PubMed]
  46. Boukraâ, L.; Sulaiman, S.A. Rediscovering the antibiotics of the hive. Recent Pat. Anti-Infect. Drug Discov. 2009, 4, 206–213. [Google Scholar] [CrossRef] [PubMed]
  47. Khataybeh, B.; Jaradat, Z.; Ababneh, Q. Anti-bacterial, anti-biofilm and anti-quorum sensing activities of honey: A review. J. Ethnopharmacol. 2023, 317, 116830. [Google Scholar] [CrossRef] [PubMed]
  48. Saelao, P.; Borba, R.S.; Ricigliano, V.; Spivak, M.; Simone-Finstrom, M. Honeybee microbiome is stabilized in the presence of propolis. Biol. Lett. 2020, 16, 20200003. [Google Scholar] [CrossRef]
  49. Vásquez, A.; Olofsson, T.C. The lactic acid bacteria involved in the production of bee pollen and bee bread. J. Apic. Res. 2009, 48, 189–195. [Google Scholar] [CrossRef]
  50. Castelli, L.; Branchiccela, B.; Romero, H.; Zunino, P.; Antúnez, K. Seasonal dynamics of the honey bee gut microbiota in colonies under subtropical climate: Seasonal dynamics of honey bee gut microbiota. Microb. Ecol. 2022, 83, 492–500. [Google Scholar] [CrossRef]
  51. Prado, A.; Barret, M.; Vaissière, B.E.; Torres-Cortes, G. Honey bees change the microbiota of pollen. bioRxiv 2022, 101, 127–133. [Google Scholar] [CrossRef]
  52. Ricigliano, V.A.; Fitz, W.; Copeland, D.C.; Mott, B.M.; Maes, P.; Floyd, A.S.; Dockstader, A.; Anderson, K.E. The impact of pollen consumption on honey bee (Apis mellifera) digestive physiology and carbohydrate metabolism. Arch. Insect Biochem. Physiol. 2017, 96, e21406. [Google Scholar] [CrossRef] [PubMed]
  53. Fernandes, K.E.; Frost, E.A.; Remnant, E.J.; Schell, K.R.; Cokcetin, N.N.; Carter, D.A. The role of honey in the ecology of the hive: Nutrition, detoxification, longevity, and protection against hive pathogens. Front. Nutr. 2022, 9, 954170. [Google Scholar] [CrossRef] [PubMed]
  54. Grubbs, K.J.; Scott, J.J.; Budsberg, K.J.; Read, H.; Balser, T.C.; Currie, C.R. Unique honey bee (Apis mellifera) hive component-based communities as detected by a hybrid of phospholipid fatty-acid and fatty-acid methyl ester analyses. PLoS ONE 2015, 10, e0121697. [Google Scholar] [CrossRef]
  55. Piccini, C.; Antúnez, K.; Zunino, P. An approach to the characterization of the honey bee hive bacterial flora. J. Apic. Res. 2004, 43, 101–104. [Google Scholar] [CrossRef]
  56. Tajabadi, N.; Mardan, M.; Manap, M.Y.A.; Mustafa, S. Molecular identification of Lactobacillus spp. isolated from the honey comb of the honey bee (Apis dorsata) by 16S rRNA gene sequencing. J. Apic. Res. 2013, 52, 235–241. [Google Scholar] [CrossRef]
  57. Gilliam, M. Identification and roles of non-pathogenic microflora associated with honey bees. FEMS Microbiol. Lett. 1997, 155, 1–10. [Google Scholar] [CrossRef]
  58. Promnuan, Y.; Kudo, T.; Chantawannakul, P. Actinomycetes isolated from beehives in Thailand. World J. Microbiol. Biotechnol. 2009, 25, 1685–1689. [Google Scholar] [CrossRef]
  59. Huang, Q.; Lopez, D.; Evans, J.D. Shared and unique microbes between Small hive beetles (Aethina tumida) and their honey bee hosts. MicrobiologyOpen 2019, 8, e899. [Google Scholar] [CrossRef]
  60. Kešnerová, L.; Moritz, R.; Engel, P. Bartonella apis sp. nov., a honey bee gut symbiont of the class Alphaproteobacteria. Int. J. Syst. Evol. Microbiol. 2016, 66, 414–421. [Google Scholar] [CrossRef]
  61. Corby-Harris, V.; Snyder, L.A.; Schwan, M.R.; Maes, P.; McFrederick, Q.S.; Anderson, K.E. Origin and effect of Alpha 2.2 Acetobacteraceae in honey bee larvae and description of Parasaccharibacter apium gen. nov., sp. nov. Appl. Environ. Microbiol. 2014, 80, 7460–7472. [Google Scholar] [CrossRef] [PubMed]
  62. Pattemore, D.E.; Goodwin, R.M.; McBrydie, H.M.; Hoyte, S.M.; Vanneste, J.L. Evidence of the role of honey bees (Apis mellifera) as vectors of the bacterial plant pathogen Pseudomonas syringae. Australas. Plant Pathol. 2014, 43, 571–575. [Google Scholar] [CrossRef]
  63. Papadopoulou-Karabela, K.; Iliadis, N.; Liakos, V.; Bourdzy-Hatzopoulou, E. Experimental infection of honeybees by Pseudomonas aeruginosa. Apidologie 1992, 23, 393–397. [Google Scholar] [CrossRef]
  64. Anjum, S.I.; Shah, A.H.; Aurongzeb, M.; Kori, J.; Azim, M.K.; Ansari, M.J.; Bin, L. Characterization of gut bacterial flora of Apis mellifera from north-west Pakistan. Saudi J. Biol. Sci. 2018, 25, 388–392. [Google Scholar] [CrossRef] [PubMed]
  65. Tsadila, C.; Amoroso, C.; Mossialos, D. Microbial diversity in bee species and bee products: Pseudomonads’ contribution to bee well-being and the biological activity exerted by honey bee products: A narrative review. Diversity 2023, 15, 1088. [Google Scholar] [CrossRef]
  66. Raymann, K.; Coon, K.L.; Shaffer, Z.; Salisbury, S.; Moran, N.A. Pathogenicity of Serratia marcescens strains in honey bees. mBio 2018, 9, e01649-18. [Google Scholar] [CrossRef] [PubMed]
  67. Schwarz, R.S.; Teixeira, É.W.; Tauber, J.P.; Birke, J.M.; Martins, M.F.; Fonseca, I.; Evans, J.D. Honey bee colonies act as reservoirs for two Spiroplasma facultative symbionts and incur complex, multiyear infection dynamics. MicrobiologyOpen 2014, 3, 341–355. [Google Scholar] [CrossRef] [PubMed]
  68. Avalos, J.; Rosero-Mayanquer, H.; Maldonado, G.; Reynaldi, F. Honey bee louse (Braula schmitzi) as a honey bee virus vector? J. Apic. Res. 2019, 58, 427–429. [Google Scholar] [CrossRef]
  69. Kowallik, V.; Mikheyev, A.S. Honey bee larval and adult microbiome life stages are effectively decoupled with vertical transmission overcoming early life perturbations. mBio 2021, 12, e0296621. [Google Scholar] [CrossRef]
  70. Vojvodic, S.; Rehan, S.M.; Anderson, K.E. Microbial gut diversity of africanized and european honey bee larval instars. PLoS ONE 2013, 8, e72106. [Google Scholar] [CrossRef]
  71. Hroncova, Z.; Havlik, J.; Killer, J.; Doskocil, I.; Tyl, J.; Kamler, M.; Titera, D.; Hakl, J.; Mrazek, J.; Bunesova, V.; et al. Variation in honey bee gut microbial diversity affected by ontogenetic stage, age and geographic location. PLoS ONE 2015, 10, e0118707. [Google Scholar] [CrossRef] [PubMed]
  72. Engel, P.; Kwong, W.K.; McFrederick, Q.; Anderson, K.E.; Barribeau, S.M.; Chandler, J.A.; Cornman, R.S.; Dainat, J.; de Miranda, J.R.; Doublet, V.; et al. The bee microbiome: Impact on bee health and model for evolution and ecology of host-microbe interactions. mBio 2016, 7, e02164-02115. [Google Scholar] [CrossRef] [PubMed]
  73. Cox-Foster, D.L.; Conlan, S.; Holmes, E.C.; Palacios, G.; Evans, J.D.; Moran, N.A.; Quan, P.-L.; Briese, T.; Hornig, M.; Geiser, D.M.; et al. A metagenomic survey of microbes in honey bee colony collapse disorder. Science 2007, 318, 283–287. [Google Scholar] [CrossRef]
  74. Regan, T.; Barnett, M.W.; Laetsch, D.R.; Bush, S.J.; Wragg, D.; Budge, G.E.; Highet, F.; Dainat, B.; de Miranda, J.R.; Watson, M.; et al. Characterisation of the British honey bee metagenome. Nat. Commun. 2018, 9, 4995. [Google Scholar] [CrossRef] [PubMed]
  75. Li, C.; Tang, M.; Li, X.; Zhou, X. Community dynamics in structure and function of honey bee gut bacteria in response to winter dietary shift. mBio 2022, 13, e0113122. [Google Scholar] [CrossRef] [PubMed]
  76. Crovadore, J.; Gérard, F.; Chablais, R.; Cochard, B.; Bergman Jensen, K.K.; Lefort, F. Deeper, Insight in beehives: Metagenomes of royal jelly, pollen, and honey from lavender, chestnut, and fir honeydew and epiphytic and endophytic microbiota of lavender and rose flowers. Genome Announc. 2017, 5, e00425-17. [Google Scholar] [CrossRef] [PubMed]
  77. Powell, J.E.; Martinson, V.G.; Urban-Mead, K.; Moran, N.A. Routes of Acquisition of the Gut Microbiota of the Honey Bee Apis mellifera. Appl. Environ. Microbiol. 2014, 80, 7378–7387. [Google Scholar] [CrossRef] [PubMed]
  78. Neveling, D.P.; Endo, A.; Dicks, L.M.T. Fructophilic, Lactobacillus kunkeei and Lactobacillus brevis isolated from fresh flowers, bees and bee-hives. Curr. Microbiol. 2012, 65, 507–515. [Google Scholar] [CrossRef]
  79. Hilgarth, M.; Redwitz, J.; Ehrmann, M.A.; Vogel, R.F.; Jakob, F. Bombella favorum sp. nov. and Bombella mellum sp. nov., two novel species isolated from the honeycombs of Apis mellifera. Int. J. Syst. Evol. Microbiol. 2021, 71, 4633. [Google Scholar] [CrossRef]
  80. Maeno, S.; Tanizawa, Y.; Kanesaki, Y.; Kubota, E.; Kumar, H.; Dicks, L.; Salminen, S.; Nakagawa, J.; Arita, M.; Endo, A. Genomic characterization of a fructophilic bee symbiont Lactobacillus kunkeei reveals its niche-specific adaptation. Syst. Appl. Microbiol. 2016, 39, 516–526. [Google Scholar] [CrossRef]
  81. Farmer, J.J.; Davis, B.R.; Hickman-Brenner, F.W.; McWhorter, A.; Huntley-Carter, G.P.; Asbury, M.A.; Riddle, C.; Wathen-Grady, H.G.; Elias, C.; Fanning, G.R.; et al. Biochemical identification of new species and biogroups of Enterobacteriaceae isolated from clinical specimens. J. Clin. Microbiol. 1985, 21, 46–76. [Google Scholar] [CrossRef] [PubMed]
  82. Corby-Harris, V.; Snyder, L.; Meador, C.a.D.; Naldo, R.; Mott, B.; Anderson, K.E. Parasaccharibacter apium, gen. nov., sp. nov., improves honey bee (Hymenoptera: Apidae) resistance to Nosema. J. Econ. Entomol. 2016, 109, 537–543. [Google Scholar] [CrossRef] [PubMed]
  83. Martinson, V.G.; Danforth, B.N.; Minckley, R.L.; Rueppell, O.; Tingek, S.; Moran, N.A. A simple and distinctive microbiota associated with honey bees and bumble bees. Mol. Ecol. 2011, 20, 619–628. [Google Scholar] [CrossRef] [PubMed]
  84. Gilliam, M.; Morton, H.L. Enterobacteriaceae isolated from honey bees, Apis mellifera, treated with 2,4-D and antibiotics. J. Invertebr. Pathol. 1974, 23, 42–45. [Google Scholar] [CrossRef]
  85. de Landa, G.F.; Porrini, M.P.; Revainera, P.; Porrini, D.P.; Farina, J.; Correa-Benítez, A.; Maggi, M.D.; Eguaras, M.J.; Quintana, S. Pathogens detection in the small hive beetle (Aethina tumida (Coleoptera: Nitidulidae)). Neotrop. Entomol. 2021, 50, 312–316. [Google Scholar] [CrossRef]
  86. Promnuan, Y.; Promsai, S.; Meelai, S. Antimicrobial activity of Streptomyces spp. isolated from Apis dorsata combs against some phytopathogenic bacteria. PeerJ 2020, 8, e10512. [Google Scholar] [CrossRef] [PubMed]
  87. Brudzynski, K. Honey as an ecological reservoir of antibacterial compounds produced by antagonistic microbial interactions in plant nectars, honey and honey bee. Antibiotics 2021, 10, 551. [Google Scholar] [CrossRef] [PubMed]
  88. Ellegaard, K.M.; Engel, P. New, Reference Genome, Sequences for 17 Bacterial, Strains of the Honey, Bee Gut, Microbiota. Microbiol. Resour. Announc. 2018, 7, e00834-18. [Google Scholar] [CrossRef]
  89. Gismondi, A.; De Rossi, S.; Canuti, L.; Novelli, S.; Di Marco, G.; Fattorini, L.; Canini, A. From, Robinia pseudoacacia L. nectar to Acacia monofloral honey: Biochemical changes and variation of biological properties. J. Sci. Food Agric. 2018, 98, 4312–4322. [Google Scholar] [CrossRef]
  90. Van der Heiden, E.; Delmarcelle, M.; Lebrun, S.; Freichels, R.; Brans, A.; Vastenavond, C.M.; Galleni, M.; Joris, B. A pathway closely related to the (D)-tagatose pathway of gram-negative enterobacteria identified in the gram-positive bacterium Bacillus licheniformis. Appl. Environ. Microbiol. 2013, 79, 3511–3515. [Google Scholar] [CrossRef]
  91. Rajagopalan, K.V. Molybdopterin–problems and perspectives. BioFactors 1988, 1, 273–278. [Google Scholar] [PubMed]
  92. Zhang, Z.; Guo, Y.; Yang, F.; Li, J. Pan-genome analysis reveals functional divergences in gut-restricted Gilliamella and Snodgrassella. Bioengineering 2022, 9, 544. [Google Scholar] [CrossRef]
  93. Hagan, A.K.; Carlson, P.E.; Hanna, P.C. Flying under the radar: The non-canonical biochemistry and molecular biology of petrobactin from Bacillus anthracis. Mol. Microbiol. 2016, 102, 196–206. [Google Scholar] [CrossRef] [PubMed]
  94. Gilliam, M.; Prest, D.B. Microbiology of feces of the larval honey bee, Apis mellifera. J. Invertebr. Pathol. 1987, 49, 70–75. [Google Scholar] [CrossRef]
  95. Hroncova, Z.; Killer, J.; Hakl, J.; Titera, D.; Havlik, J. In-hive variation of the gut microbial composition of honey bee larvae and pupae from the same oviposition time. BMC Microbiol. 2019, 19, 110. [Google Scholar] [CrossRef] [PubMed]
  96. Guo, B.; Tang, J.; Ding, G.; Mashilingi, S.K.; Huang, J.; An, J. Gut microbiota is a potential factor in shaping phenotypic variation in larvae and adults of female bumble bees. Front. Microbiol. 2023, 14, 1117077. [Google Scholar] [CrossRef] [PubMed]
  97. Al-Ghamdi, A.; Ali Khan, K.; Javed Ansari, M.; Almasaudi, S.B.; Al-Kahtani, S. Effect of gut bacterial isolates from Apis mellifera jemenitica on Paenibacillus larvae infected bee larvae. Saudi J. Biol. Sci. 2018, 25, 383–387. [Google Scholar] [CrossRef] [PubMed]
  98. Chen, W.-F.; Wang, H.-F.; Wang, Y.; Liu, Z.-G.; Xu, B.-H. Honey bee larval culture in vitro: Gut emptying determines the transition from larva to prepupa and recombinant AccApidaecin improves antibacterial activity. Bull. Entomol. Res. 2023, 113, 368–379. [Google Scholar] [CrossRef]
  99. Bolger, A.M.; Lohse, M.; Usadel, B. Trimmomatic: A flexible trimmer for Illumina sequence data. Bioinformatics 2014, 30, 2114–2120. [Google Scholar] [CrossRef]
  100. Langmead, B.; Trapnell, C.; Pop, M.; Salzberg, S.L. Ultrafast and memory-efficient alignment of short DNA sequences to the human genome. Genome Biol. 2009, 10, R25. [Google Scholar] [CrossRef]
  101. Wood, D.E.; Lu, J.; Langmead, B. Improved metagenomic analysis with Kraken 2. Genome Biol. 2019, 20, 257. [Google Scholar] [CrossRef]
  102. Menzel, P.; Ng, K.L.; Krogh, A. Fast and sensitive taxonomic classification for metagenomics with Kaiju. Nat. Commun. 2016, 7, 11257. [Google Scholar] [CrossRef] [PubMed]
  103. R Core Team. R: A Language and Environment for Statistical Computing; R Foundation for Statistical Computing: Vienna, Austria, 2023. [Google Scholar]
  104. RStudio Team. RStudio: Integrated Development Environment for R; RStudio, P.B.C.: Boston, MA, USA, 2020. [Google Scholar]
  105. Gu, Z.; Gu, L.; Eils, R.; Schlesner, M.; Brors, B. Circlize implements and enhances circular visualization in R. Bioinformatics 2014, 30, 2811–2812. [Google Scholar] [CrossRef] [PubMed]
  106. Kassambara, A.; Mundt, F. Factoextra: Extract and Visualize the Results of Multivariate Data Analyses; R package: Vienna, Austria, 2020. [Google Scholar]
  107. Pedersen, T.L. Ggraph: An. Implementation of Grammar of Graphics for Graphs and Networks; R package: Vienna, Austria, 2022. [Google Scholar]
  108. Slowikowski, K. Ggrepel: Automatically Position Non-Overlapping Text Labels with “ggplot2”; R package: Vienna, Austria, 2023. [Google Scholar]
  109. Csárdi, G.; Nepusz, T.; Kirill, M.; Traag, V.; Horvát, S.; Zanini, F.; Noom, D. Igraph: Network, Analysis and Visualization in R; Zenodo: Genève, Switzerland, 2023. [Google Scholar] [CrossRef]
  110. Wei, T.; Simko, V.R. Package “corrplot”: Visualization of a Correlation Matrix; R package: Vienna, Austria, 2021. [Google Scholar]
  111. Krijthe, J.H. Rtsne: T-Distributed Stochastic Neighbor Embedding Using Barnes-Hut Implementation; R package: Vienna, Austria, 2015. [Google Scholar]
  112. Garnier, S.; Ross, N.; Rudis, R.; Filipovic-Pierucci, A.; Galili, T.; timelyportfolio; O’Callaghan, A.; Greenwell, B.; Sievert, C.; Harris, D.J.; et al. Viridis(Lite)—Colorblind-Friendly Color Maps for R; Zenodo: Genève, Switzerland, 2023. [Google Scholar] [CrossRef]
  113. Wickham, H.; Averick, M.; Bryan, J.; Chang, W.; McGowan, L.D.; François, R.; François, R.; Grolemund, G.; Hayes, A.; Henry, L.; et al. Welcome to the tidyverse. J. Open Source Softw. 2019, 4, 1686. [Google Scholar] [CrossRef]
  114. Bittinger, K. Abdiv: Alpha and Beta Diversity Measures; R package: Vienna, Austria, 2020. [Google Scholar]
  115. Peng, Y.; Leung, H.C.M.; Yiu, S.M.; Chin, F.Y.L. IDBA-UD: A de novo assembler for single-cell and metagenomic sequencing data with highly uneven depth. Bioinformatics 2012, 28, 1420–1428. [Google Scholar] [CrossRef]
  116. Quevillon, E.; Silventoinen, V.; Pillai, S.; Harte, N.; Mulder, N.; Apweiler, R.; Lopez, R. InterProScan: Protein domains identifier. Nucleic Acids Res. 2005, 33, W116–W120. [Google Scholar] [CrossRef] [PubMed]
  117. Medema, M.H.; Blin, K.; Cimermancic, P.; de Jager, V.; Zakrzewski, P.; Fischbach, M.A.; Weber, T.; Takano, E.; Breitling, R. Antismash: Rapid identification, annotation and analysis of secondary metabolite biosynthesis gene clusters in bacterial and fungal genome sequences. Nucleic Acids Res. 2011, 39, W339–W346. [Google Scholar] [CrossRef] [PubMed]
  118. Seemann, T. Prokka: Rapid prokaryotic genome annotation. Bioinformatics 2014, 30, 2068–2069. [Google Scholar] [CrossRef] [PubMed]
  119. Carver, T.; Harris, S.R.; Berriman, M.; Parkhill, J.; McQuillan, J.A. Artemis: An integrated platform for visualization and analysis of high-throughput sequence-based experimental data. Bioinformatics 2012, 28, 464–469. [Google Scholar] [CrossRef]
  120. Ye, Y.; Doak, T. A Parsimony approach to biological pathway reconstruction/inference for metagenomes. PLoS Comput. Biol. 2009, 5, e1000465. [Google Scholar] [CrossRef]
  121. Sun, Z.; Huang, S.; Zhang, M.; Zhu, Q.; Haiminen, N.; Carrieri, A.P.; Vázquez-Baeza, Y.; Parida, L.; Kim, H.-C.; Knight, R.; et al. Challenges in Benchmarking Metagenomic Profilers. Nat. Methods 2021, 18, 618–626. [Google Scholar] [CrossRef]
  122. Lu, J.; Rincon, N.; Wood, D.E.; Breitwieser, F.; Pockrandt, C.; Langmead, B.; Salzberg, S.L.; Steinegger, M. Metagenome analysis using the Kraken software suite. Nat. Protoc. 2022, 17, 2815–2839. [Google Scholar] [CrossRef] [PubMed]
  123. Johnson, J.; Sun, S.; Fodor, A.A. Systematic classification error profoundly impacts inference in high-depth Whole Genome Shotgun Sequencing datasets. bioRxiv 2022. [Google Scholar] [CrossRef]
  124. Garrido-Sanz, L.; Senar, M.À.; Piñol, J. Drastic reduction of false positive species in samples of insects by intersecting the default output of two popular metagenomic classifiers. PLoS ONE 2022, 17, e0275790. [Google Scholar] [CrossRef] [PubMed]
  125. Ye, S.H.; Siddle, K.J.; Park, D.J.; Sabeti, P.C. Benchmarking Metagenomics Tools for Taxonomic Classification. Cell 2019, 178, 779–794. [Google Scholar] [CrossRef] [PubMed]
  126. Kang, D.D.; Li, F.; Kirton, E.; Thomas, A.; Egan, R.; An, H.; Wang, Z. MetaBAT 2: An adaptive binning algorithm for robust and efficient genome reconstruction from metagenome assemblies. PeerJ 2019, 7, e7359. [Google Scholar] [CrossRef] [PubMed]
  127. Baumann, P.; Baumann, L.; Lai, C.Y.; Rouhbakhsh, D.; Moran, N.A.; Clark, M.A. Genetics, physiology, and evolutionary relationships of the genus Buchnera: Intracellular symbionts of aphids. Annu. Rev. Microbiol. 1995, 49, 55–94. [Google Scholar] [CrossRef] [PubMed]
  128. Li, W.; Larsen, A.; Murphy, B.; Fregulia, P. Liver microbial community and associated host transcriptome in calves with feed induced acidosis. Front. Vet. Sci. 2023, 10, 1193473. [Google Scholar] [CrossRef]
  129. Martyn, C.; Hayes, B.; Lauko, D.; Mithun, E.; Castañeda, G.; Bosco-Lauth, A.; Kistler, A.; Pollard, K.S.; Chou, S. mNGS Investigation of Single Ixodes pacificus Ticks Reveals Diverse Microbes, Viruses, and a Novel mRNA-like Endogenous Viral Elements. bioRxiv 2022. [Google Scholar] [CrossRef]
  130. Mehta, P.; Soni, J.; Chattopadhyay, P.; Devi, P.; Habyarimana, T.; Tardalkar, K.; Joshi, M.; Pandey, R. Single-cell RNA-Seq reveals intracellular microbial diversity within Immune cells during SARS-CoV-2 Infection and Recovery. iScience 2023, 26, 108357. [Google Scholar] [CrossRef]
  131. Contreras-Castro, L.; Maldonado, L.A.; Quintana, E.T.; Raggi, L.; Sánchez-Flores, A. Draft Genome Sequence of Two Marine Plantactinospora spp. from the Gulf of California. Genome Announc. 2018, 6, e00436-18. [Google Scholar] [CrossRef]
  132. Sarmiento-Ramírez, J.M.; van der Voort, M.; Raaijmakers, J.M.; Diéguez-Uribeondo, J. Unravelling the microbiome of eggs of the endangered sea turtle Eretmochelys imbricata identifies bacteria with activity against the emerging pathogen Fusarium falciforme. PLoS ONE 2014, 9, e95206. [Google Scholar] [CrossRef] [PubMed]
  133. Pascar, J. Characterizing Microbiome Variation in Wild Populations of Mosquito Species. Master’s Thesis, Syracuse University, Syracuse, NY, USA, 2022. [Google Scholar]
  134. Usié, A.; Leão, C.; Gaspar, D.; Monteiro, H.; Tábuas, L.; Bettencourt, E.; Caetano, P.; Padre, L.; Carolino, N.; Ramos, A.M.; et al. A metagenomics approach to characterize the footrot microbiome in Merino sheep. Vet. Microbiol. 2023, 281, 109745. [Google Scholar] [CrossRef] [PubMed]
  135. Kim, D.; Yu, Y.; Jung, K.S.; Kim, Y.H.; Kim, J.-J. Tumor Microenvironment Can Predict Chemotherapy Response of Patients with Triple-Negative Breast Cancer Receiving Neoadjuvant Chemotherapy. Cancer Res. Treat. 2023. [Google Scholar] [CrossRef] [PubMed]
  136. Carstens, C.K.; Salazar, J.K.; Sharma, S.V.; Chan, W.; Darkoh, C. Evaluation of the kitchen microbiome and food safety behaviors of predominantly low-income families. Front. Microbiol. 2022, 13, 987925. [Google Scholar] [CrossRef] [PubMed]
Figure 1. Results of taxonomic annotations with Kraken 2 on RefSeq database. (a): mean composition of all reads; (b): mean composition of bacterial reads.
Ijms 25 00741 g001
Figure 2. Composition of bacterial sequences in the microbiome based on Kraken 2 results. The side colors indicate the hive and sampling frame, while the column sizes correspond to the percentage of all reads. Top chart (a) shows the composition of different phylotypes, while the bottom (b) shows genus composition. Yellow corresponds to other species groups in all parts of the figure.
Ijms 25 00741 g002
Figure 3. Edge bundling diagram illustrates the correlations between 50 most abundant genera. Color of each line represents Pearson correlation level between taxa abundances among classified samples. Circle colors describe clusters on correlation matrix using complete distance. On 7 k-mers, 5 groups show intergroup correlations with levels above 0.5 (Figure S10). Clusters named by the species with the highest amount. ‘Gut’ cluster is composed mostly of the genus previously described as a part of bee gut microbiota. ‘S+S’ is an abbreviation for Spiroplasma and Serratia. ‘ABE’ refers to the names of groups which include most genus of this cluster: Actinobacteria, Bacilliaceae and Enterococcacce. Members with weak correlations with other groups are indicated in yellow. Only correlations with absolute value bigger than 0.6 are shown.
Ijms 25 00741 g003
Figure 4. Heatmap on composition analysis. Dataset has been assembled from fungi genus, and bacteria and virus species amounts. The dendrogram was constructed using the ward.d2 method for samples and species both. Colors on the side indicate the hive and sampling frame. Colors on top indicate taxonomic affiliation. The map is colored according to z-score. b. pupa is an abbreviation for late = black pupa, and w. pupa is for early one.
Ijms 25 00741 g004
Figure 5. PCA of the metagenome compositions. (a): based on developmental stage; (b): based on hive. Dots and circles represent samples, while lines indicate vector projections of selected clades. Full dataset has been assembled from fungi and bacteria genus and virus species amounts.
Ijms 25 00741 g005
Disclaimer/Publisher’s Note: The statements, opinions and data contained in all publications are solely those of the individual author(s) and contributor(s) and not of MDPI and/or the editor(s). MDPI and/or the editor(s) disclaim responsibility for any injury to people or property resulting from any ideas, methods, instructions or products referred to in the content.

