1. Introduction
Intracellular pH (pH
i) regulates various cellular functions, including airway ciliary beating [
1,
2]. In many cell types, including the airway ciliated epithelial cell, the pH
i is controlled by CO
2 and ion transporters, such as Na
+/HCO
3− cotransporter (NBC), Cl
−/HCO
3− exchanger (anion exchanger, AE) and Na
+/H
+ exchanger (NHE). The pH
i is controlled by the reaction mediated by carbonic anhydrase (CA) (Equation (1)).
CA is an enzyme that catalyzes the hydration and dehydration of CO2. In general, experimental procedures, such as the switch to a CO2/HCO3−-free solution (Zero-CO2) from a CO2/HCO3−-containing solution (control solution) and activation of NBC (HCO3− entry), shift Equation (1) to the left (an increase in pHi), and contrarily, a procedure such as the switch to the control solution from the Zero-CO2 shifts Equation (1) to the right (a decrease in pHi).
The ciliated nasal epithelium is a unique tissue placed under a low temperature [
3] and an unusual CO
2 condition. The CO
2 concentration of the apical surface is changed from 0.04% (fresh air) to 1% (exhaled air) with non-exercised respiration. The periodic air exposure (0.04% CO
2) appears to increase pH
i, leading to a ciliary beat frequency (CBF) increase in the ciliated nasal epithelial cells, since the application of the Zero-CO
2 has been shown to increase pH
i, CBF and ciliary bend distance (CBD, an index of amplitude) in tracheal and lung airway ciliated cells [
1,
4,
5]. To keep an adequate ciliary beating during the periodic exposure to the air (an extremely low CO
2 concentration), the ciliated nasal epithelial cells need a special mechanism. For example, to maintain CBF when cells are exposed to a low temperature, ciliated nasal epithelial cells express the thermosensitive transient receptor potentials (TRP) A1 and M8 [
3]. However, it still remains uncertain how ciliated nasal epithelial cells keep an adequate ciliary beating during a periodical exposure to low and high CO
2 concentrations. Ciliated human nasal epithelial cells (c-hNECs) were differentiated by the air liquid interface (ALI) culture. In c-hNECs, an application of Zero-CO
2 induced small transient increases in pH
i, CBF and CBD [
2], while it induced their large sustained increases in the tracheal airway ciliary cells [
1]. Respectively, an application of an NH
4+ pulse induced a gradual decrease in pH
i and CBF (acetazolamide (an inhibitor of CA)-sensitive) following an immediate increase in c-hNECs [
2] but a sustained increase in tracheal airway ciliary cells [
1]. The gradual decreases in CBF following immediate increases indicate decreases in pH
i in c-hNECs upon applications of the Zero-CO
2 and the NH
4+ pulse. Since these decreases were acetazolamide-sensitive [
2], the application of the Zero-CO
2 or the NH
4+ pulse appears to shift Equation (1) to the right to increase H
+ in c-hNECs, but not in tracheal ciliary cells. However, it remains uncertain what decreases pH
i (the right shift of Equation (1)) upon applying Zero-CO
2 or the NH
4+ pulse.
A previous study demonstrated that eleven CA subtypes are expressed in nasal epithelia, including CAIV (a membrane-associated CA) [
6]. The CAIV plays important roles in the regulation of pH
i in several cell types [
7,
8,
9,
10]. The physical and functional interactions between CAIV and NBC have been shown in co-transfected HEK239 cells with NBC1b and CAIV, and they maximize the rate of HCO
3− transport [
7,
8]. The C-terminal tail of CAIV is anchored in the outer surface of the plasma membrane, and a physical interaction between extracellular CAIV and NBC1 occurs via the fourth extracellular loop of NBC1 [
7]. In the basolateral membrane of renal proximal tubules, CAIV, which colocalizes with NBC1, increases NBC1 activity [
9]. The R14W mutation of CAIV, which has been detected in an autosomal dominant form of retinitis pigmentosa, impairs pH balances of photoreceptor cells by affecting HCO
3− influx [
10]. These findings suggest that CAIV interacts with NBC to increase the rate of HCO
3− transport in the c-hNECs. Moreover, NBC and AE have been shown to express in nasal epithelia [
11]. Thus, CAIV may interact with NBC, forming the bicarbonate transport metabolon in c-hNECs [
7,
8,
12].
We hypothesized that the interactions between CAIV and NBC would maximize the rate of HCO
3− influx in c-hNECs, leading to a high pH
i [
7,
8,
12]. The high pH
i (low [H
+]
i) may shift Equation (1) to the right to maintain CBF or CBD or cause their negligibly small increases, even upon Zero-CO
2 application, and to induce their gradual decreases during the NH
4+ pulse. We also used ciliated human bronchial epithelial cells (c-hBECs), which were differentiated from normal human bronchial epithelial cells (NHBE) by the ALI [
13]. We found that c-hBECs, similar to c-hNECs, express CAs except CAIV, NBCs and AEs. The c-hBECs appear to be a good model of airway ciliated cells expressing no CAIV. The goal of this study is to clarify the CAIV-mediated mechanism, which suppresses increases in CBF, CBD and pH
i in c-hNECs upon applying Zero-CO
2. 3. Discussion
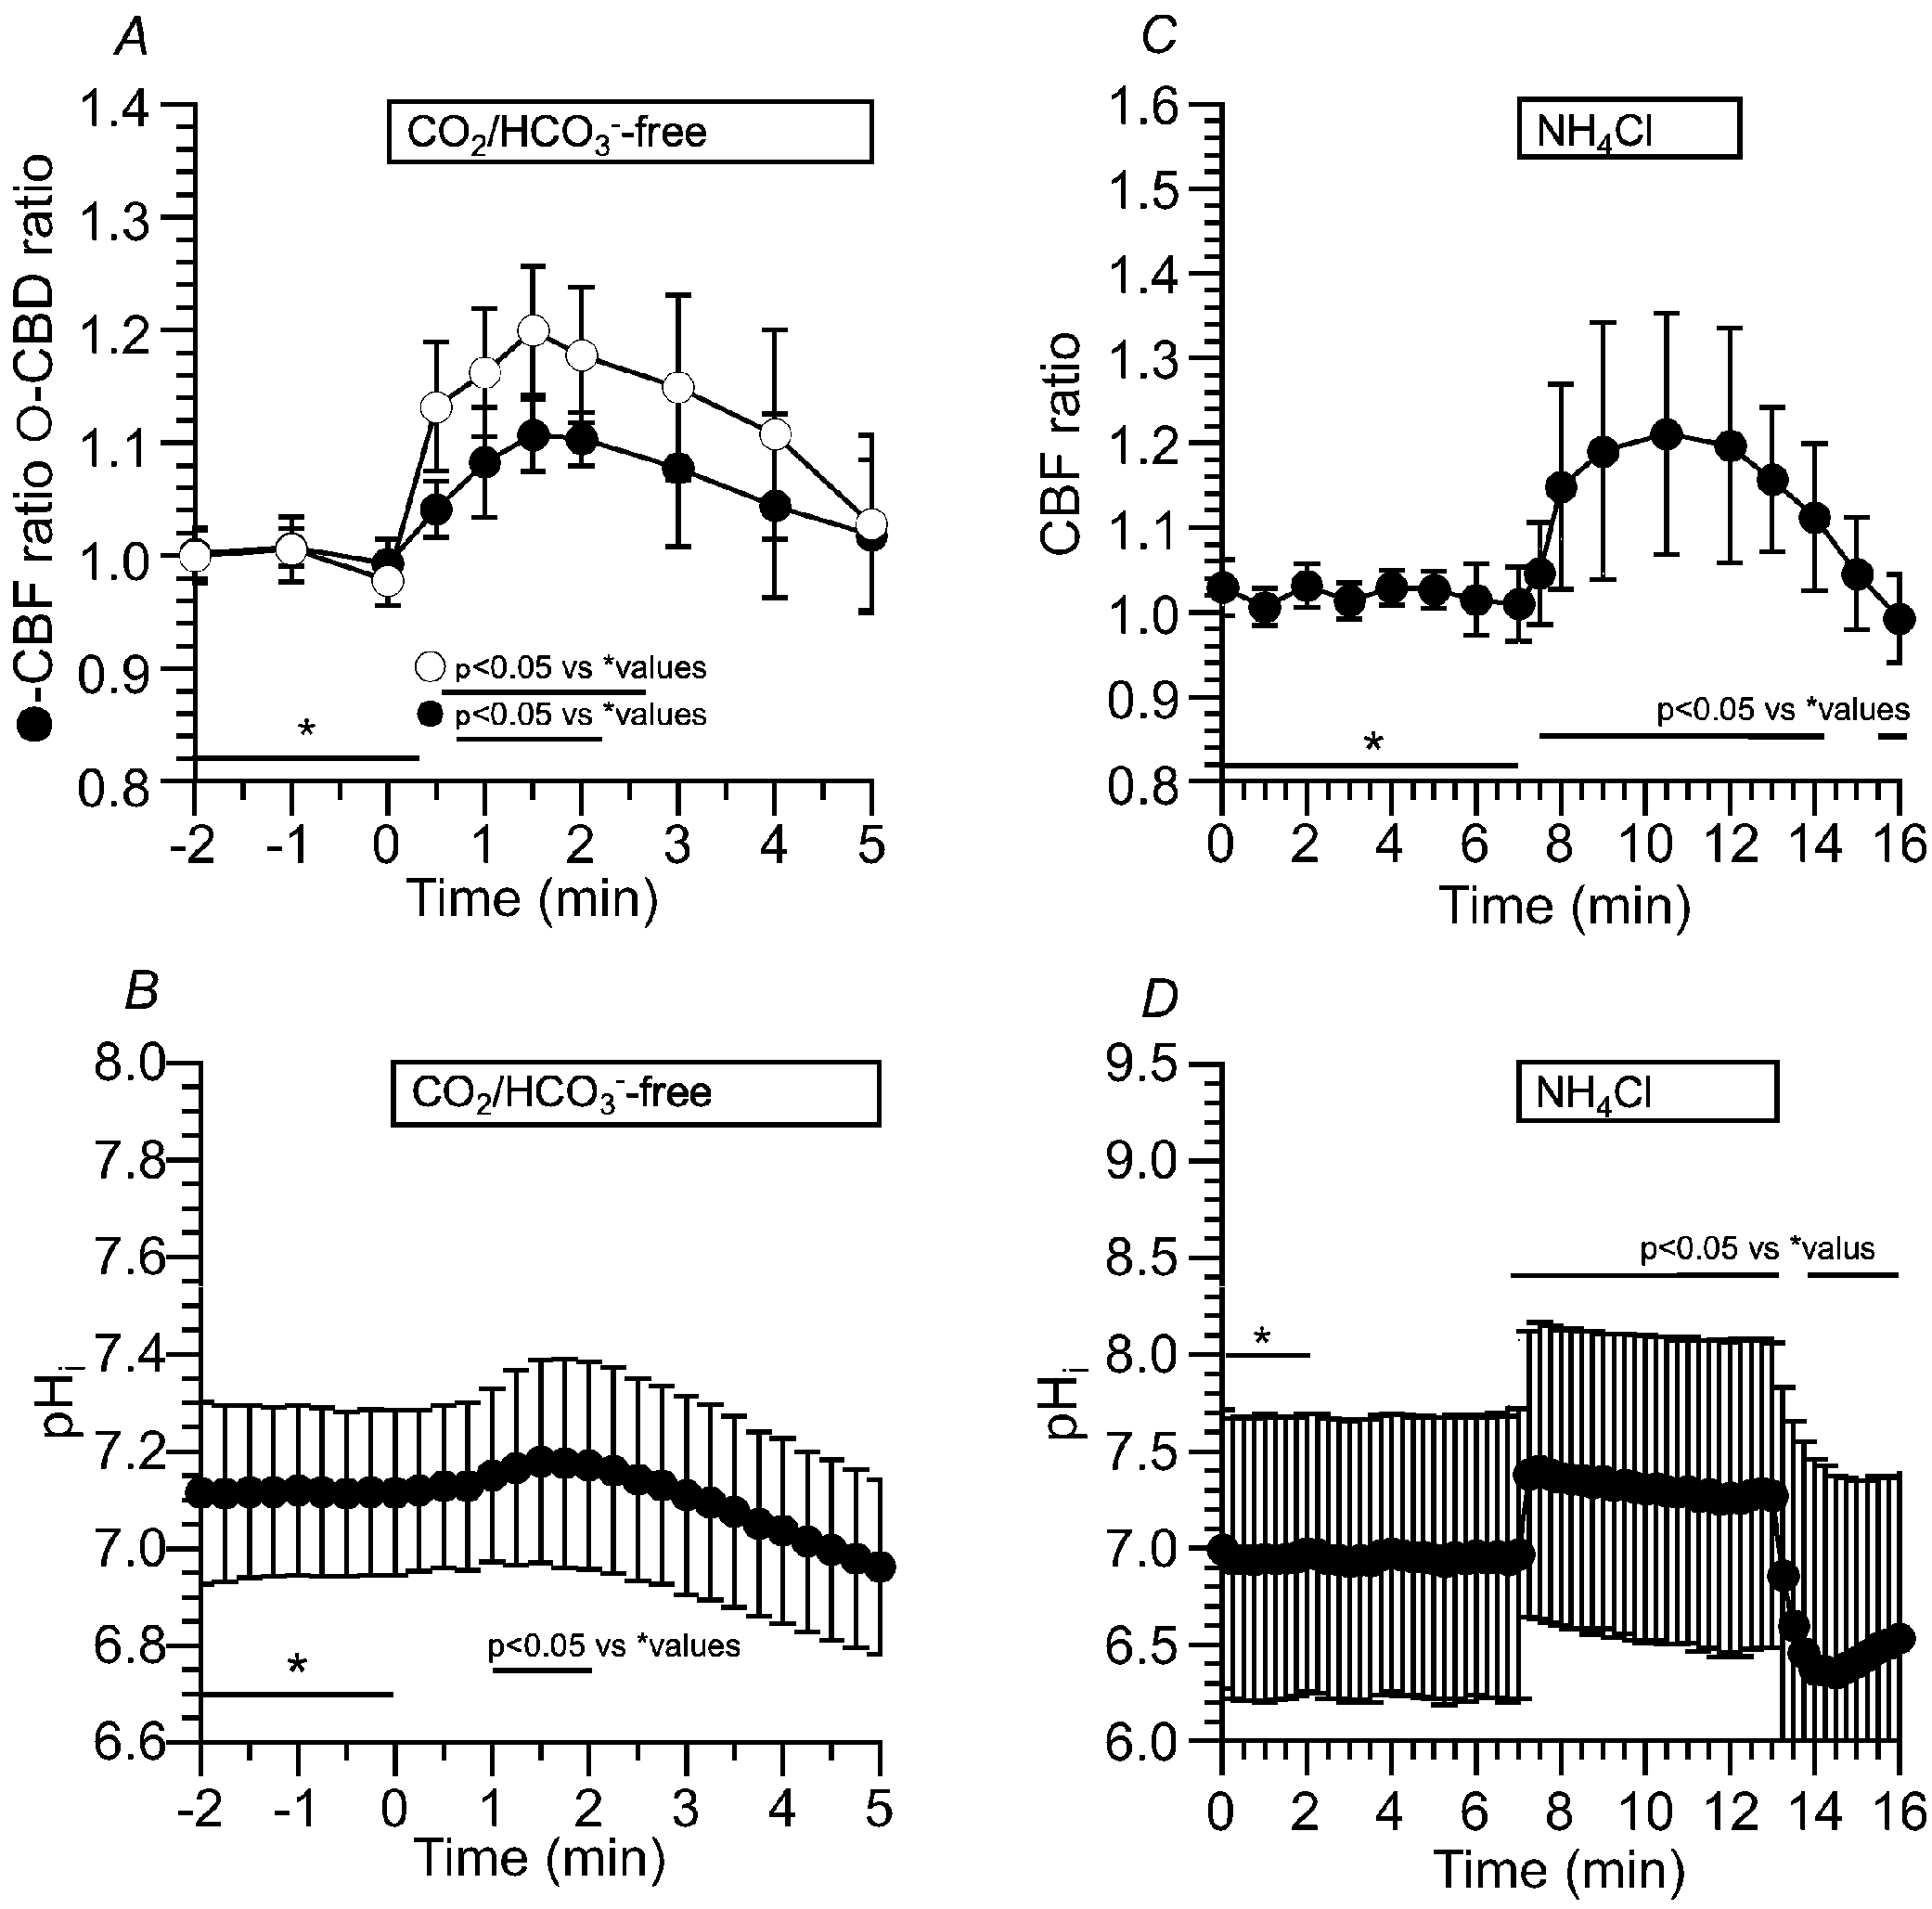
The present study demonstrated that the pHi of c-hNECs is extremely high (7.66), and the high pHi is generated by a high rate of HCO3− influx in c-hNECs. The [HCO3−]i is calculated to be 41.4 mM from pHi (7.66) and pCO2 (5% CO2, 38 mmHg) by the Henderson–Hasselbalch equation in c-hNECs. This study also demonstrated that the pHi of c-hBECs is low (7.10), and the low pHi is generated by a low rate of HCO3− influx. The [HCO3−]i is calculated to be 11.4 mM from the pHi (7.1) and pCO2 (38 mmHg) in c-hBECs. The [HCO3−]i of c-hNECs is approximately four times higher than that of c-hBECs.
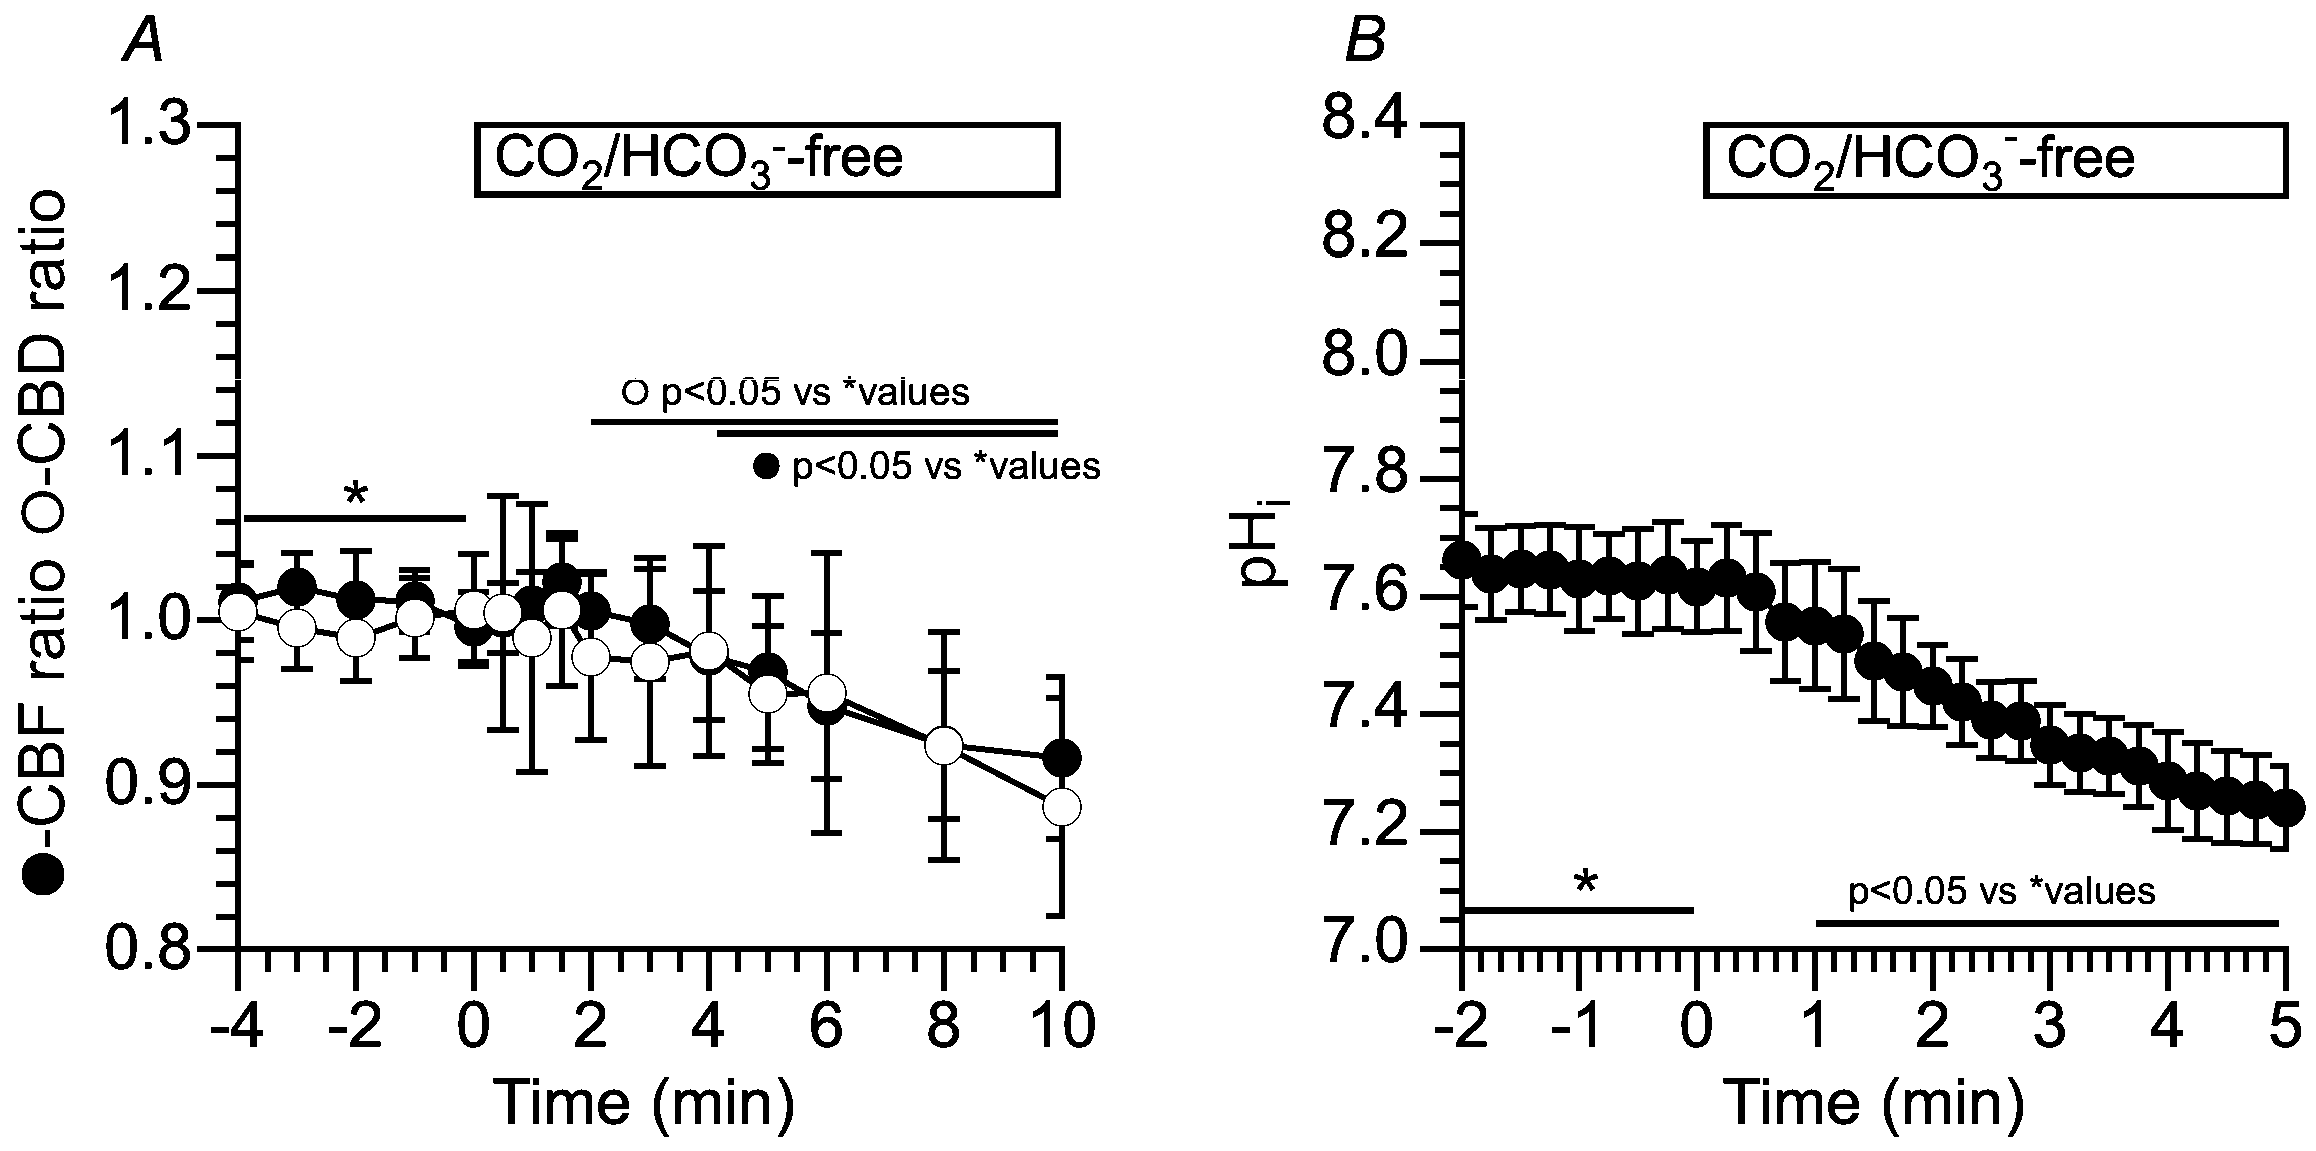
The present study revealed that the application of Zero-CO
2 decreases pH
i mediated via decreases in [HCO
3−]
i due to no HCO
3− entry. An extremely high pH
i (a low [H
+]
i) and a low [HCO
3−]
i appear to induce the right shift (H
+ production) or no shift (no elimination of H
+) of Equation (1) even in Zero-CO
2, in which a small amount of H
+ is supplied from the cellular metabolism. A decrease in pH
i caused CBF and CBD to decrease in c-hNECs [
1,
2,
4]. However, in the c-hBECs, the pH
i and [HCO
3−]
i were low because of a low rate of HCO
3− influx. The switch to the Zero-CO
2 from the control solution immediately removes CO
2 from the extracellular space to decrease CO
2 concentration ([CO
2]
i), keeping a low pH
i in c-hBECs. The low pH
i and lowered [CO
2]
i shift Equation (1) to the left to increase pH
i in c-hBECs. The pH
i increase enhances CBF and CBD in c-hBECs [
1,
2,
4]. Thus, a low pH
i shifts Equation (1) to the left upon applying the Zero-CO
2 in c-hBECs.
The application of Zero-CO2 appears to induce a large decrease in [HCO3−]i in c-hNECs. The effects of the decrease in [HCO3−]i on Equation (1) may be much larger than those of the decrease in [CO2]i in c-hNECs upon applying Zero-CO2. In c-hBECs, however, the application of Zero-CO2 decreases [CO2]i to an extremely low level and may induce little decrease in [HCO3−]i, because of a low HCO3− influx rate. The effects of the decrease in [CO2]i on Equation (1) may be much larger than those of the [HCO3−]i decrease in c-hBECs, to induce the left shift upon applying Zero-CO2.
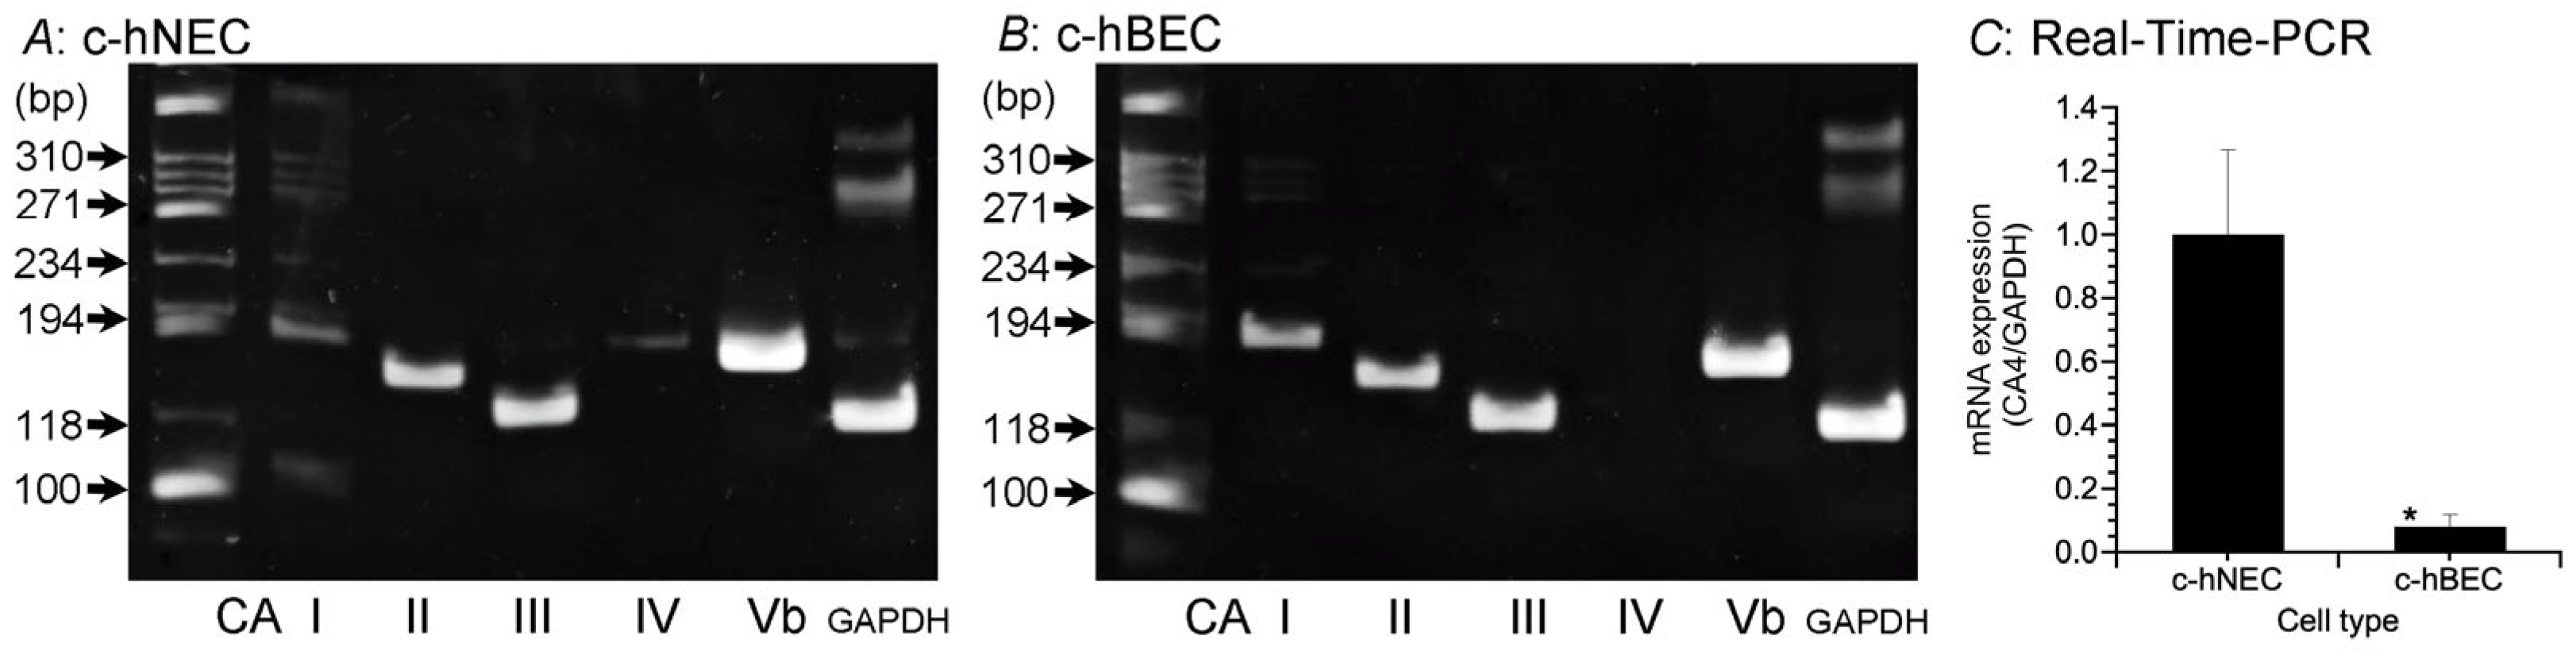
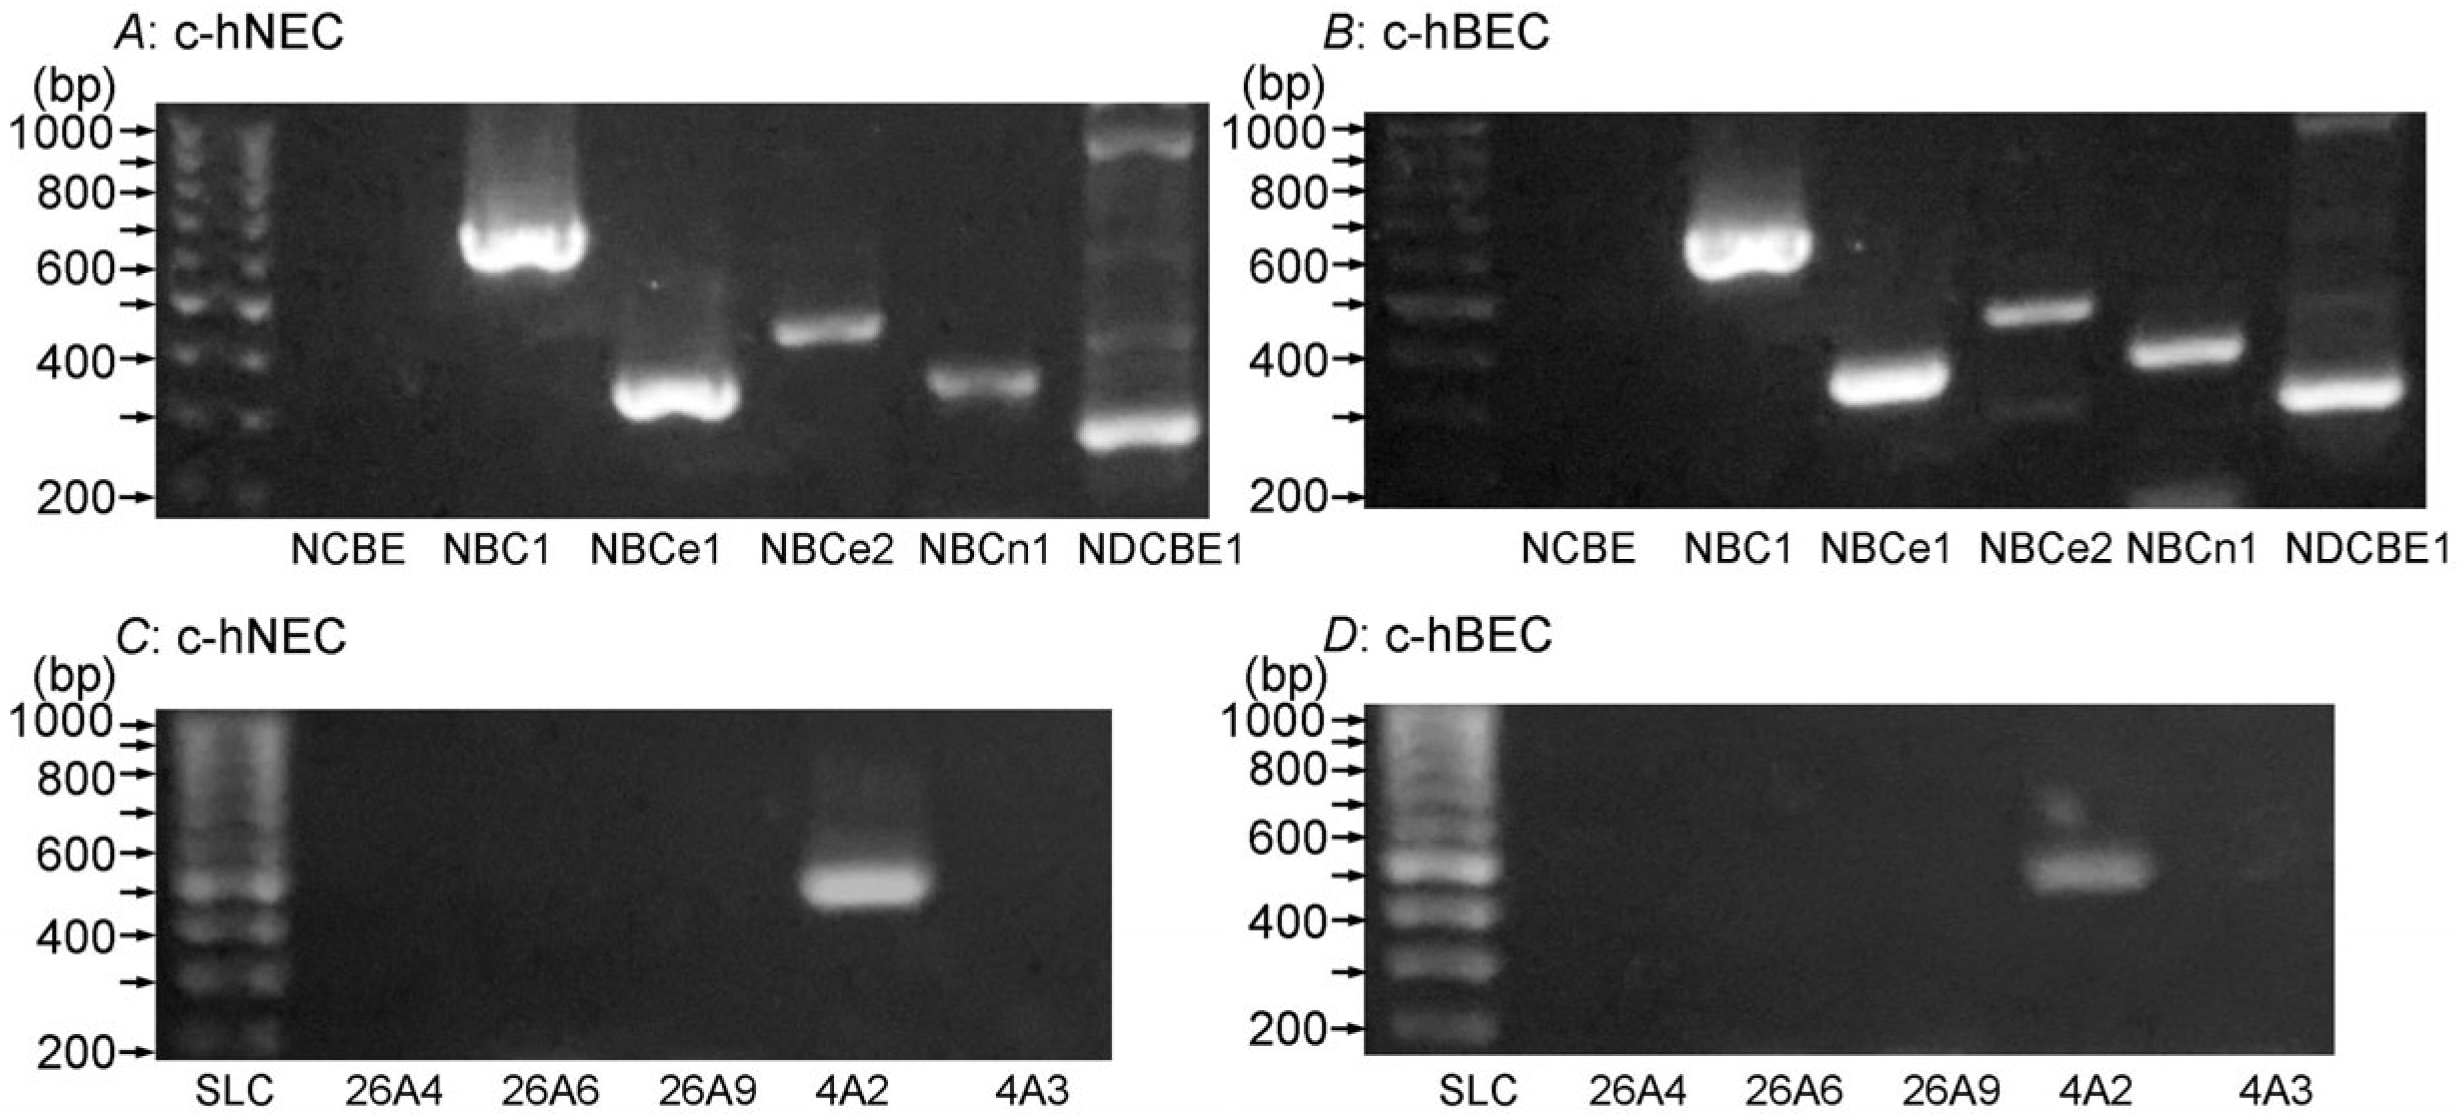
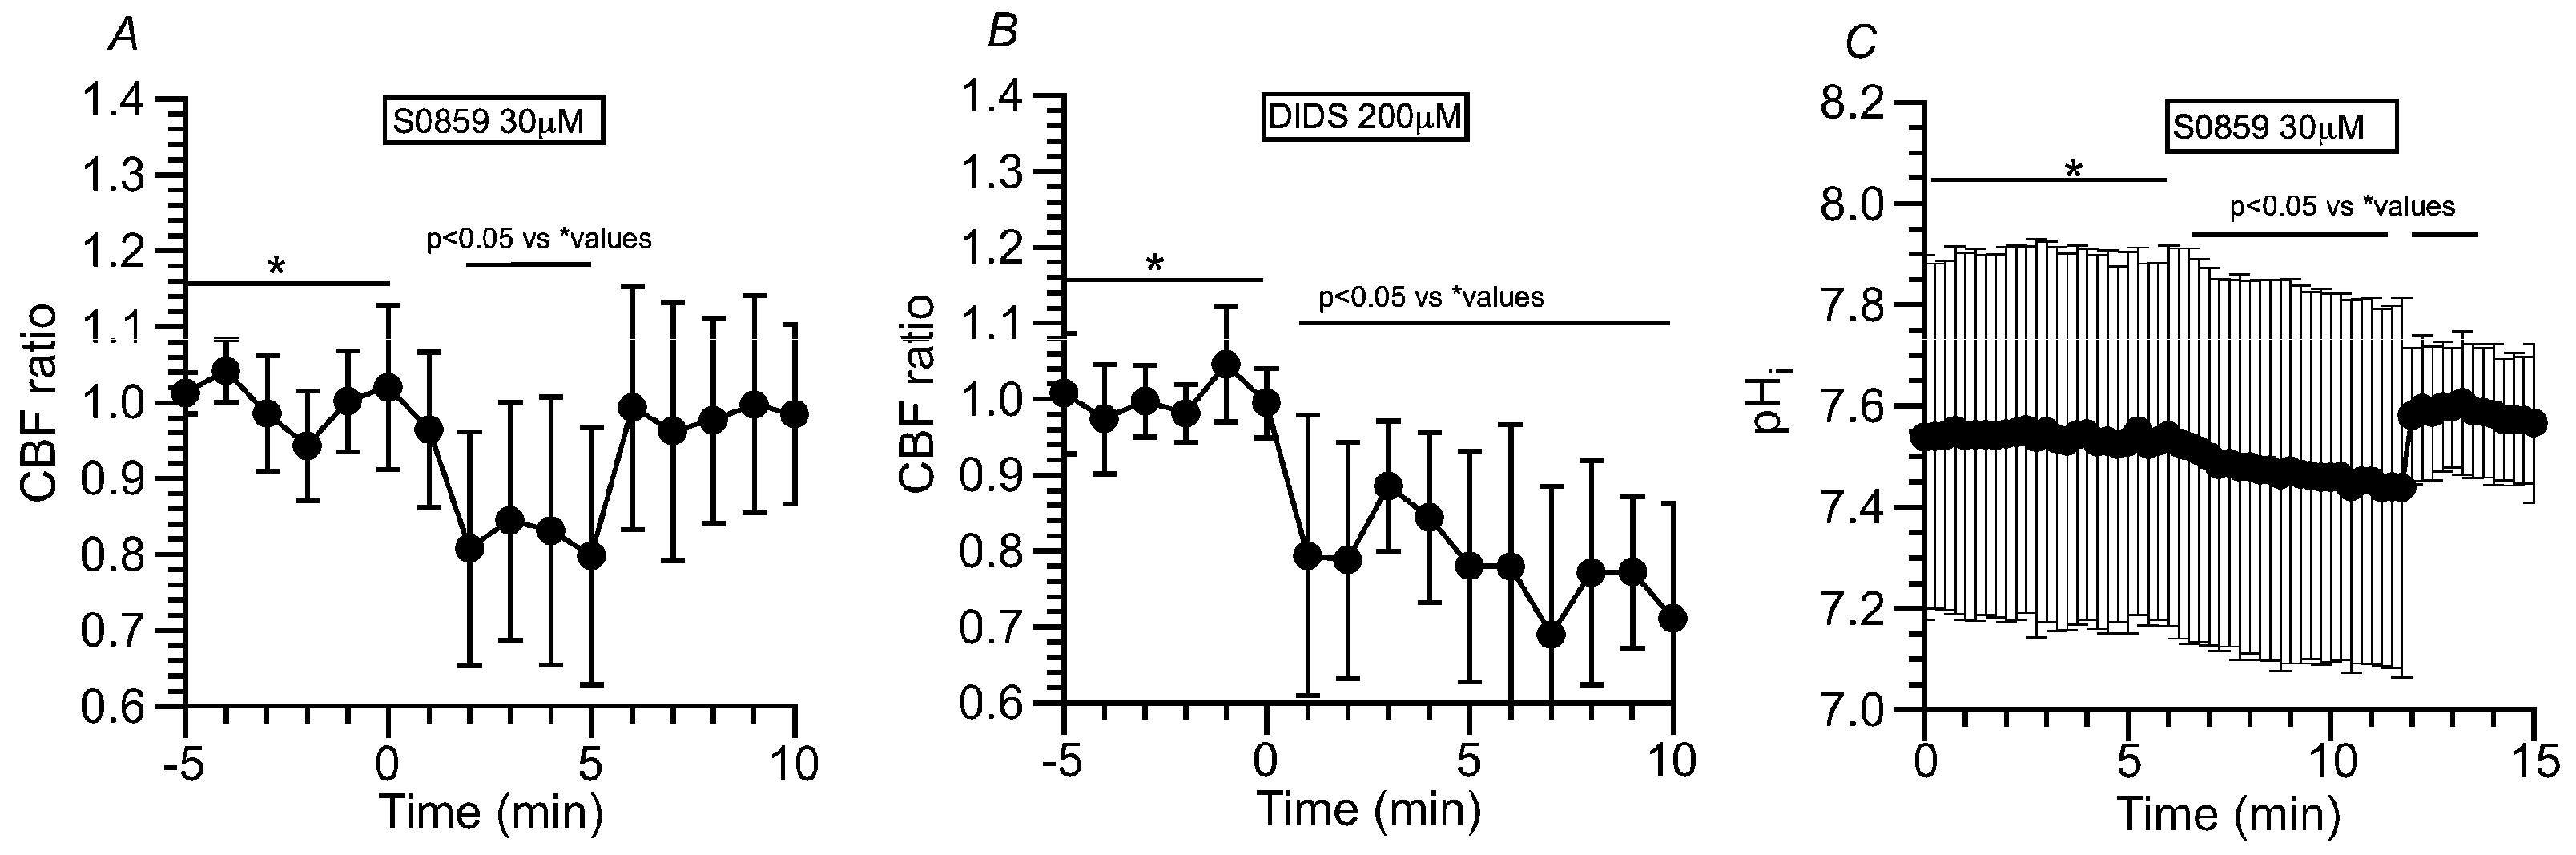
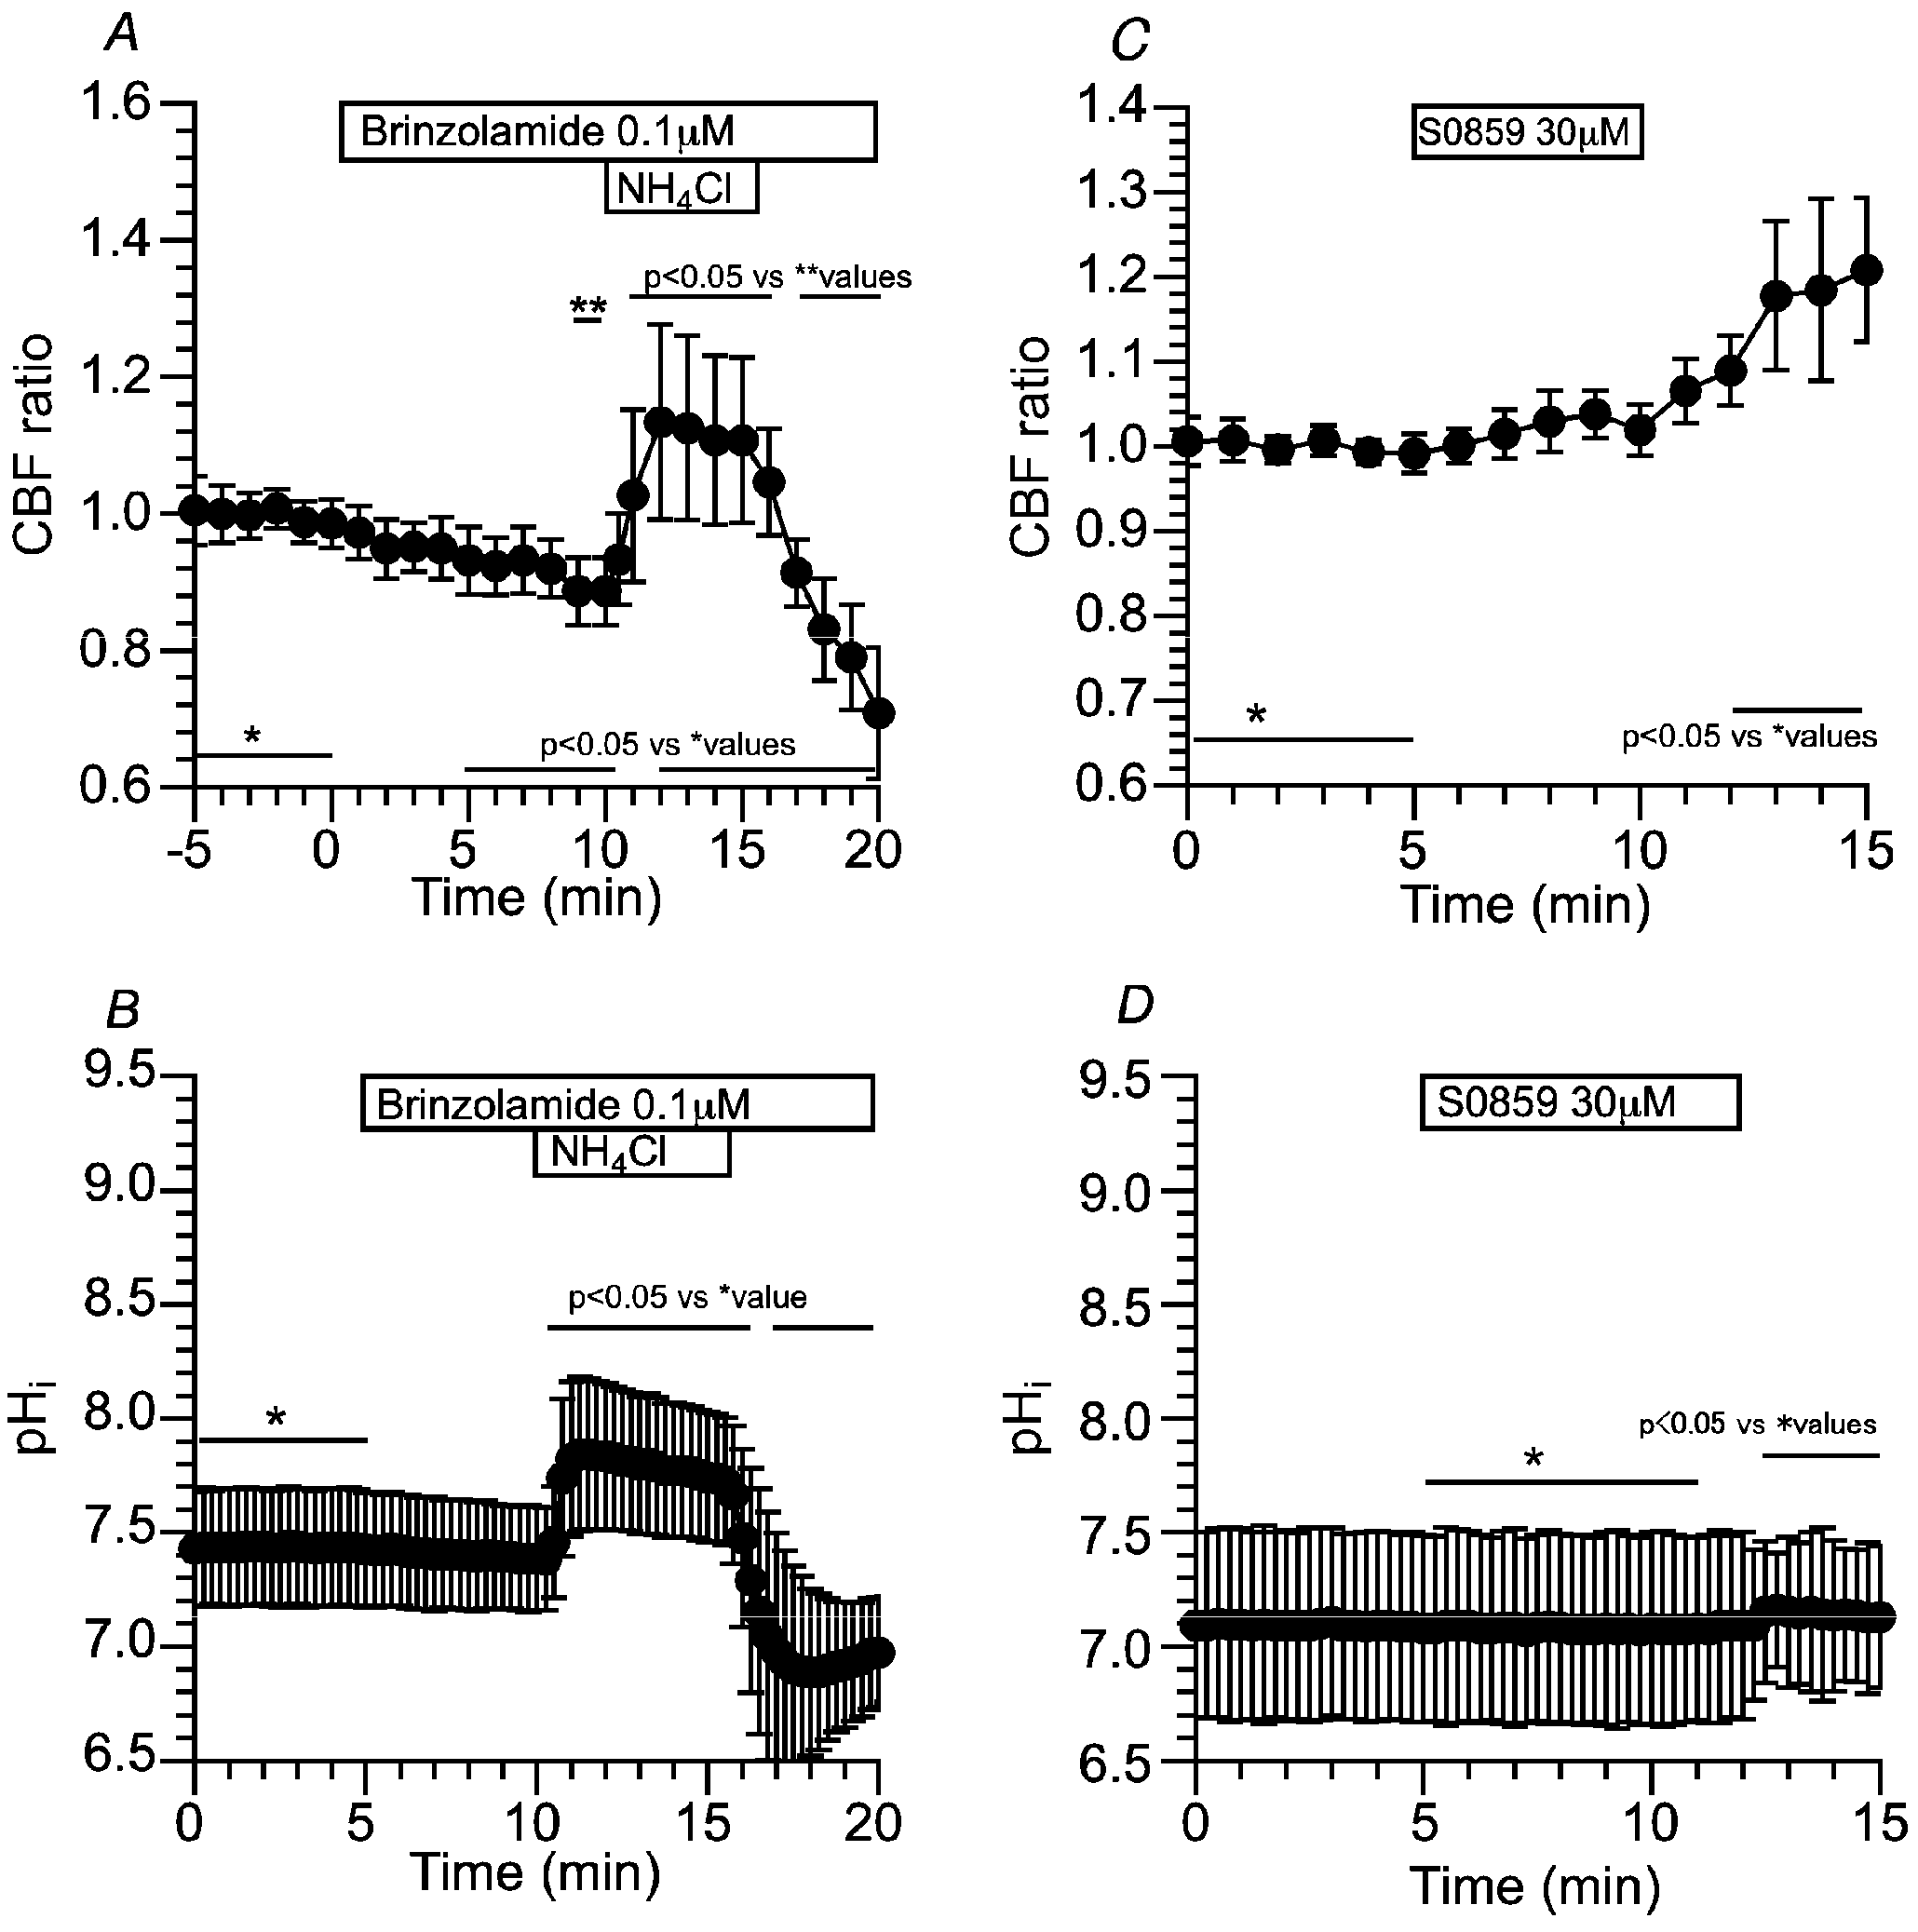
The high rate of HCO3− transport into cells is maintained in c-hNECs, leading to an extremely high pHi. RT-PCR analysis revealed that five NBC subtypes (NBC1, NBCe1, NBCe2, NBCn1 and NDCBE) and AE (SLC4A2 (AE2)) are expressed in both c-hNECs and c-hBECs. The present study demonstrated that NBC blockers (S0859 and DIDS) decrease CBF in c-hNECs, but they do not change CBF in c-hBECs. Thus, the activity of NBC is high in c-hNECs but not in c-hBECs. This indicates that the mechanism stimulating NBC activity exists in c-hNECs.
The contribution of AEs to the HCO
3− entry appears to be small, because there was no difference between CBFs decreased by S0859 and those decreased by DIDS in c-hNECs. In c-hNECs, the pH
i is high, except in some experimental conditions, such as the long-time exposure to Zero-CO
2 and the removal of the NH
4+ pulse. Under these experimental conditions, the Na
+/H
+ exchange (NHE) may extrude H
+ from c-hNECs. However, the NHE is unlikely to increase the pH
i to an extremely high level in c-hNECs during the ALI culture, because it has been shown to be inactive at pH
i levels higher than 7.4 [
18].
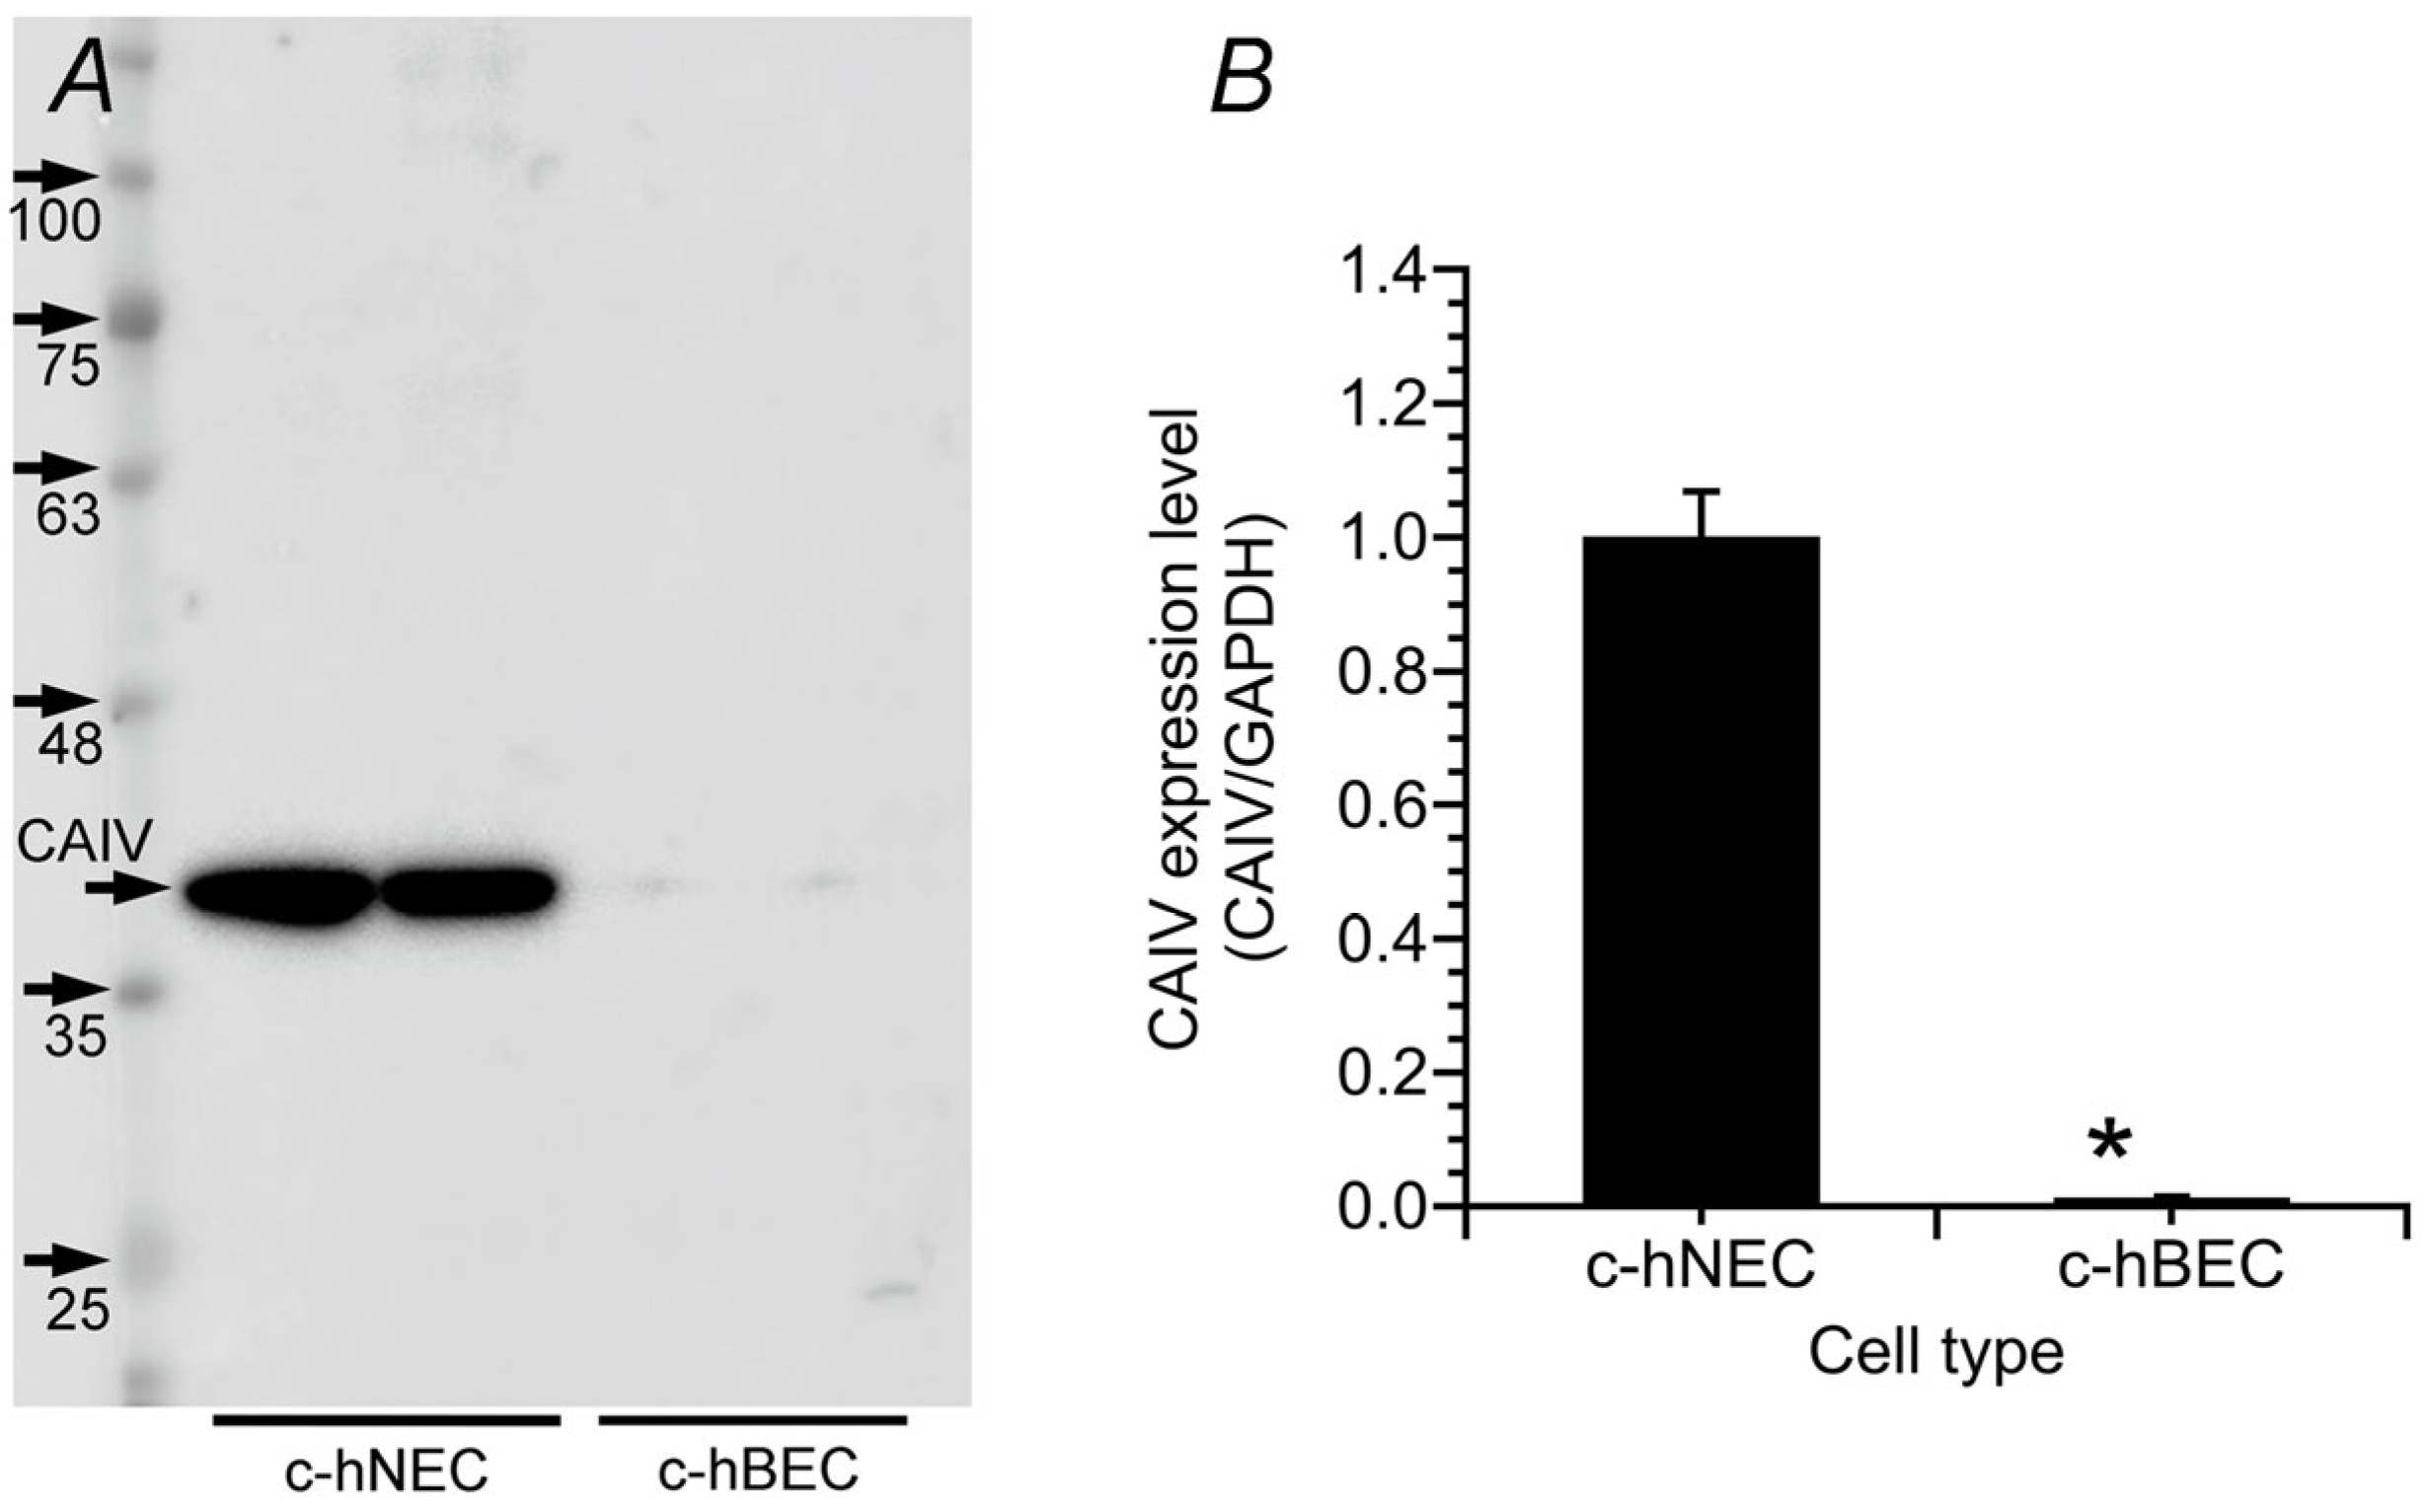
The present study demonstrated that CAIV is expressed in c-hNECs but not in c-hBECs. The expression of CAIV has already been shown in human nasal epithelia [
7]. A previous study demonstrated that the physical and functional interactions between CAIV and NBC maximize transmembrane HCO
3− transport in HEK239 cells transfected with NBC1b and CAIV [
8], renal proximal tubules [
9] and a retinal photoreceptor, which has been detected in an autosomal dominant form of retinitis pigmentosa (the R14W mutation of CAIV) [
10]. These findings suggest that CAIV interacts with NBC to increase the activity of the HCO
3− transporter in the c-hNECs. Ciliated hBECs express HCO
3− transporters but no CAIV. A previous report showed that the expression of CAIV was low in the trachea [
19]. The NBC blocker study showed that the activity of NBC is low in c-hBECs, as described above. Moreover, c-hBECs kept a low pH
i. These indicate that no expression of CAIV causes a low activity of NBC in c-hBECs. These results indicate that CAIV increases the NBC activity to maximize the rate of HCO
3− transport into cells in c-hNECs.
CAII has been shown to interact with NBC1 [
12,
20]. CAII and CAIV have similar structures, and the acid motif in the NBC1 C-terminal region interacts with the basic N-terminal region of CAII [
12,
20]. The HCO
3−s are produced by CAIV in the apical surface, entering the cell via the NBCs, and the HCO
3− entered is converted to CO
2 by CAII just below the apical membrane. The coupling of CAIV-NBC-CAII appears to potentiate transmembrane HCO
3− influxes in c-hNECs [
8,
12]. In this study, brinzolamide (CAII inhibitor) and dorzolamide (CAII and CAIV inhibitor) showed similar decreases in CBF and pH
i. These results suggest that the interactions of CAIV and CAII with NBC may potentiate the influx of HCO
3− in c-hNECs. The CAIV, NBC and CAII have been shown to compose the bicarbonate transport metabolon in renal proximal tubules [
7,
8,
9,
12]. The c-hNECs may also express the bicarbonate transport metabolon consisting of CAIV-NBC-CAII, which maximizes the rate of HCO
3− transport from the apical surface into the cell. However, we do not confirm that the metabolon consisted of CAIV-NBC-CAII in c-hNECs. Further experiments are needed.
A membrane-bound CA, CAIX, is expressed in c-hNECs and c-hBECs. The CAIX mRNA expression has been shown in the apical surface of nasal mucosa [
6]. CAIX has been shown to interact with AE2 in HEK293 cells, co-expressing the parietal cell AE2 and CAIX, and increases the activity of AE2 transport by 28% [
21]. However, the interactions between CAIX and NBC remain uncertain. The present study revealed that CAIX is also expressed in c-hBECs, the HCO
3− entry is not enhanced in c-hBECs and the HCO
3− entry via AE appears to be small in c-hNECs. Based on these observations, the CAIX is unlikely to enhance NBC in c-hNECs.
The present study does not provide the localization of NBC isoforms in the apical membrane of c-hNECs. However, it has been demonstrated that NBC1 and CAIV have a physical and functional relationship in HEK293 cells transfected with NBC1 and CAIV [
7,
8,
12]. Liu et al. also showed that NBC functionally exists in apical membranes of mice bronchioles [
17]. The present study suggests that NBC1 exists in the apical membrane of c-hNECs to form the bicarbonate transport metabolon.
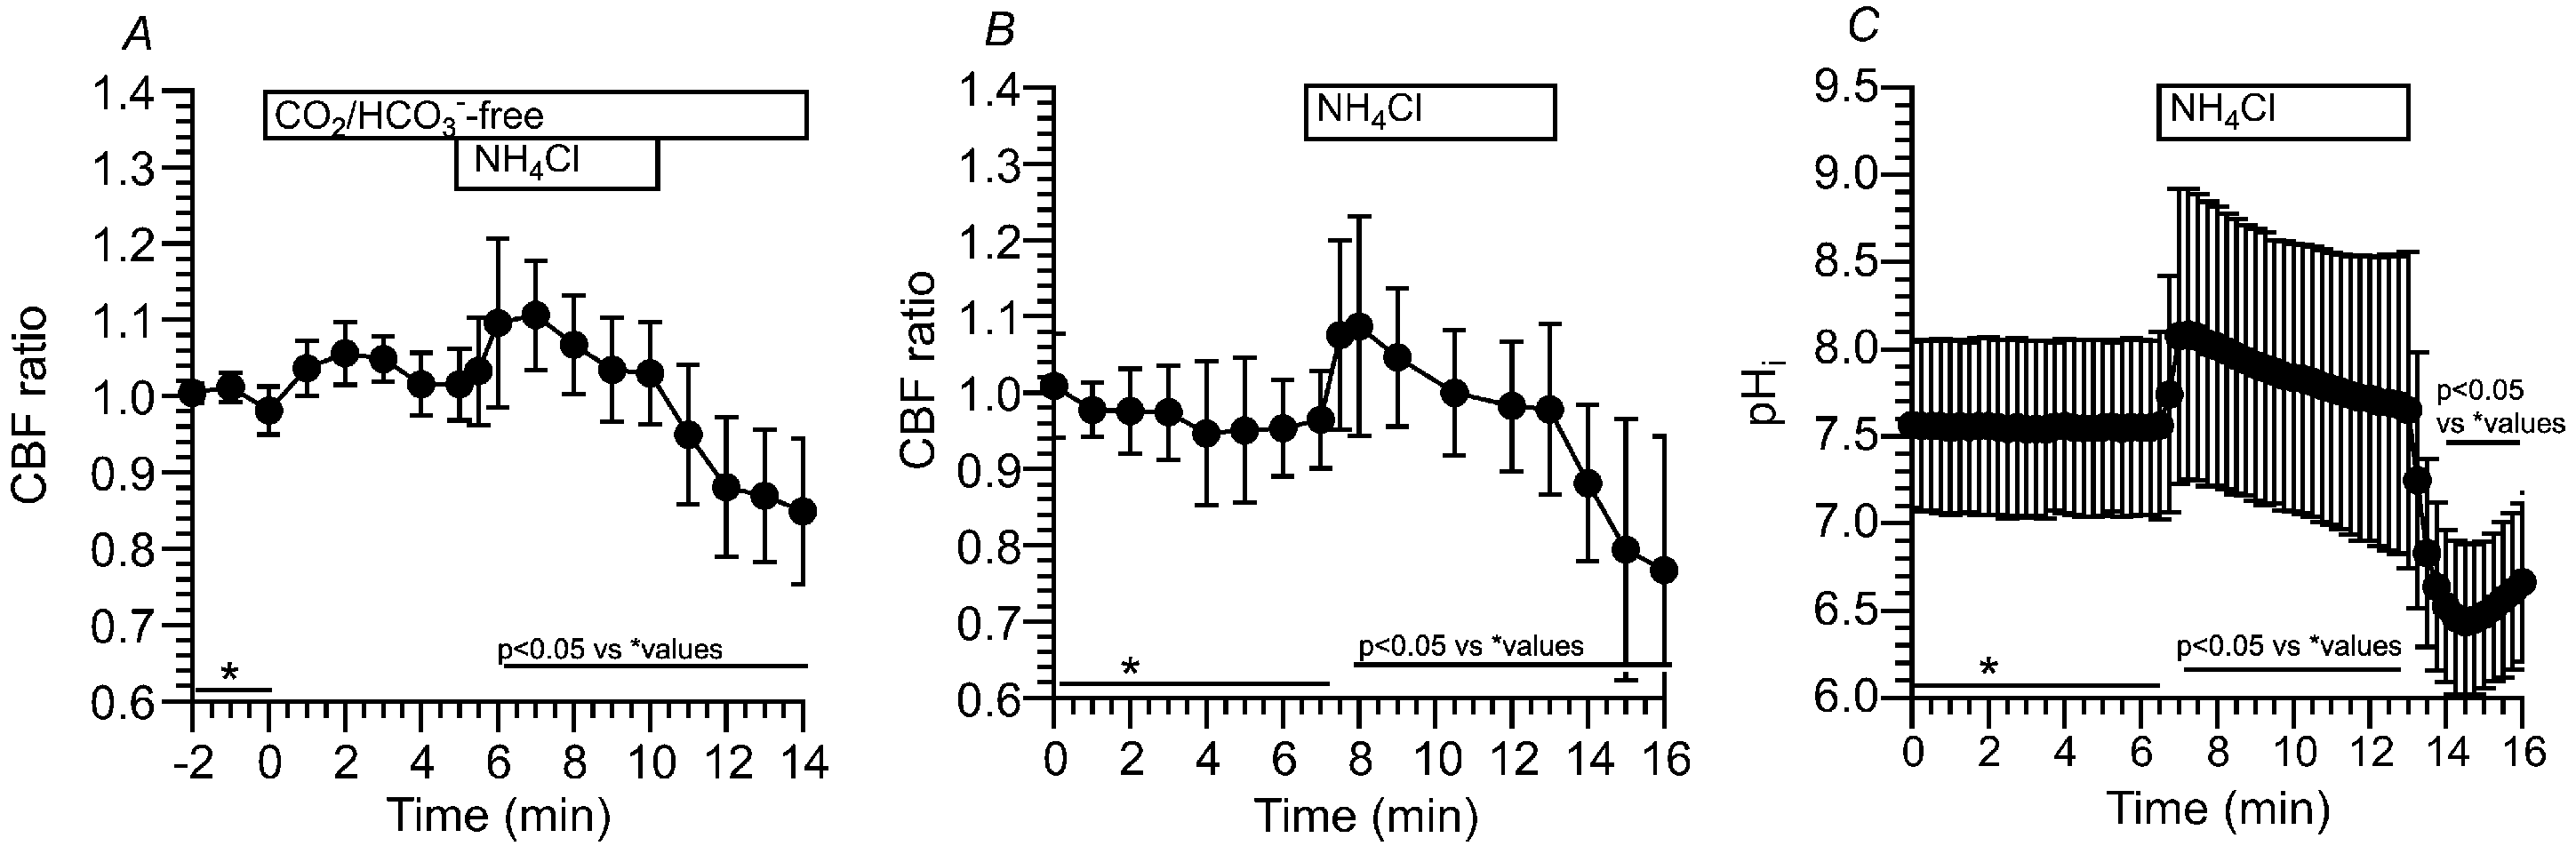
The application of Zero-CO
2 induced various responses in CBF and pH
i, a decrease (
Figure 5) or no change (
Figure 6A), although it never induced large increases as shown in c-hBECs (
Figure 10) or bronchial ciliated cells [
1]. The responses of c-hNECs were affected by cellular conditions. In this study, c-hNECs with a permeable support filter were kept in the control solution without any aeration at room temperature until the measurement of CBF or pH
i. This condition may decrease the HCO
3− entry and may induce a small decrease in the pH
i of c-hNECs, which decreases CBF.
The HCO3− entry appears to be affected by temperature-keeping cells and time-keeping cells until the start of the experiments, depending on the conditions keeping the cells until the experiments, such as time and temperature. After keeping c-hNECs at 4 °C for more than 3 h, the pHi decreased by approximately 0.1–0.15, and the application of Zero-CO2 induced no changes or small increases in CBF.
In this study, we used two nasal tissues (uncinate process and nasal polyp tissues resected from 16 patients who required surgery for CS). We measured CBF in c-hNECs differentiated from the two nasal tissues. The CBFs of c-hNECs obtained from the two nasal tissues were similar. Moreover, c-hNECs obtained from the two nasal tissues expressed the CAIV mRNA. Kim et al. demonstrated that the expression levels of eleven CA isozymes were decreased by 80–40% in the nasal polyp tissue [
6]. However, they examined mRNA expression using whole samples, and expression of CA isozymes in nasal polyp tissue was weak in the epithelial layer but weaker or absent in the submucosal glands and vascular endothelial cells. We used c-hNECs cultured by ALI, which contain no submucosal gland and no vascular endothelial cells. Based on these observations, CAII and CAIV, at least, express and function in c-hNECs obtained from nasal polyp samples, although the expression level may be lower than in normal nasal epithelia.
We used c-hBECs obtained by the ALI culture from NHBEs as a model of human tracheal epithelia. The NHBEs were bought from Lonza (Lot No. 20TL119094). The c-hBECs used appear to be a good model of tracheal ciliated epithelial cells.
Ciliated-hNECs were cultured in the ALI with 5% CO
2 for more than 4 weeks. The culture condition with 5% CO
2 is different from the asymmetrical gas condition of c-hNECs and c-hBECs in vivo; the apical surface is exposed to the air (0.04% CO
2) periodically, and the basolateral membranes are exposed to interstitial fluid saturated with 5% CO
2 (
Figure 12). The ALI culture with 5% CO
2 enhances the HCO
3− transport into c-hNECs. This unphysiological gas condition appears to increase pH
i to an extremely high level by maximizing the HCO
3− transport via the interactions of CAIV, NBC and CAII (
Figure 12A). In c-hBECs expressing no CAIV, CO
2 is converted to H
+ and HCO
3− by CAII. The H
+ produced stays in the c-hBECs to decrease pH
i, while HCO
3− is secreted to the lumen via CFTR and AE [
17]. Thus, the ALI culture condition may enhance HCO
3− entry, leading to a high pH
i in c-hNECs, but it may also enhance the conversion of CO
2 to H
+, leading to a low pH
i in c-hBECs.
In conclusion, we found novel interactions with CAIV, NBC and CAII, which regulate pH
i in c-hNECs. CAIV, NBC and CAII may consist of a bicarbonate transport metabolon in c-hNECs. In the physiological condition, CO
2 diffuses to the apical surface from the interstitial space according to the CO
2 gradient between the interstitial fluid (5%) and the nasal cavity (0.04–1%). The CO
2 leaked is converted to H
+ and HCO
3− by CAIV around the cilia. The HCO
3− enters cells via NBC, and the H
+ stays in the nasal surface mucous layer to keep a low pH. The low pH of the nasal mucous layer is essential for the protection from inhaled bacteria [
22,
23] (
Figure 12B). HCO
3− entered via NBC immediately coverts to CO
2 by CAII. The removal of HCO
3− by CAII enables the transportation of HCO
3− continuously into the cell by keeping the driving force for HCO
3− entry through NBC. Although we do not know the exact pCO
2 and [HCO
3−]
i of c-hNECs, the HCO
3− transport metabolon appears to be essential for maintaining the pH
i and the ciliary beating of c-hNECs at adequate levels in the nasal cavity with low CO
2 concentrations (0.04–1%). The novel mechanism accelerating bicarbonate transport via the HCO
3− transport metabolon (CAIV-NBC-CAII) appears to play essential roles in protecting nasal mucosa from inhaled small particles, such as bacteria, virus and chemicals, and maintaining healthy nasal mucosa. Further studies are required to understand this novel mechanism in nasal epithelia in vivo.
4. Materials and Methods
4.1. Ethical Approval
This study has been approved by the ethical committees of the Kyoto Prefectural University of Medicine (RBMR-C-1249-7) and Ritsumeikan University (BKC-HM-2020-090). All experiments were performed according to the ethical principles for medical research outlined in the Declaration of Helsinki (1964) and its subsequent revisions (
https://www.wma.net/, accessed on 1 April 2020). Informed consents were obtained from all patients before operation. Human nasal tissue samples (nasal polyp or uncinate process) were resected from patients who required surgery for chronic sinusitis (16 patients). Samples were immediately cooled and stored in the cooled control solution (4 °C) until cell isolation [
2].
4.2. Solution and Chemicals
The control solution contained (in mM) NaCl 121, KCl 4.5, NaHCO3 25, MgCl2 1, CaCl2 1.5, NaHEPES 5, HHEPES 5 and glucose 5. Its pH was adjusted to 7.4 by HCl (1 M), and the solution was aerated with 95% O2 and 5% CO2. The CO2/HCO3−-free control solution was prepared by replacing NaHCO3 in the control solution with NaCl and was aerated with 100% O2. To apply the NH4+ pulse, the NaCl (25 mM) of the solutions was replaced with NH4Cl (25 mM). DNase I, amphotericin B, DIDS (4,4-diisothiocyanatostilbene-2,2-disulfonic acid disodium salt hydrate) and S0859 (a selective NBC inhibitor, 2-chloro-N-((2′-(N-cyanosulfamoyl)-[1,1′-biphenyl]-4-yl)methyl)-N-(4-methylbenzyl) benzamide) were purchased from Sigma-Aldrich (St Louis, MO, USA). Dorzolamide and brinzolamide were purchased from Tokyo Chemical Industry Co., Ltd. (Tokyo, Japan). The Can Get Signal® Immunoreaction Enhancer Solution was purchased from TOYOBO (Osaka, Japan).
4.3. Cell Culture Media
The complete PneumaCultTM-Ex Plus medium contained PneumaCultTM-Ex Plus basal medium supplemented with PneumaCultTM-Ex Plus supplement (50×, 20 µL/mL), hydrocortisone stock solution (1 µL/mL) and penicillin and streptomycin solution (10 µL/mL). The complete PneumaCultTM-ALI medium contained PneumaCultTM-ALI basal medium supplemented with PneumaCultTM-ALI supplement (10×, 100 µL/mL), PneumaCultTM-ALI maintenance supplement (10 µL/mL), heparin solution (2 µL/mL), hydrocortisone stock solution (2.5 µL/mL) and penicillin/streptomycin solution (10 µL/mL). Solutions and supplements were purchased from STEMCELL Technologies, Inc. (Vancouver, BC, Canada). Elastase, bovine serum albumin (BSA) and dimethyl sulfoxide (DMSO) were purchased from FUJIFILM Wako Pure Chemical Corporation (Osaka, Japan). Penicillin/streptomycin mixed solution (penicillin 10,000 units/mL and streptomycin 10,000 µg/mL in 0.85% NaCl), trypsin, and the trypsin inhibitor were purchased from Nacalai Tesque, Inc. (Kyoto, Japan).
4.4. Antibodies
The anti-CAIV antibody (AF2186, polyclonal goat antibody) was purchased from R&D Systems (Minneapolis, MN, USA). The concentration of AF2186 used was 1 µg/mL. The antigen peptide (2186-CA, recombinant human CAIV) was also purchased from R&D systems. The anti-alpha-tubulin (acetyl K40) (AC-tubulin) antibody (ab179484) was purchased from Abcam plc (Cambridge, UK) and used at a 100-fold dilution. Alexa Fluor 488 goat anti-mouse IgG (H+L) secondary antibodies (A-11001) and Alexa Fluor 594 donkey anti-rabbit IgG (H+L) secondary antibodies (A-21207) were purchased from Thermo Fischer Scientific (Waltham, MA, USA).
4.5. Cell Preparation
We isolated c-hNECs from nasal operation samples as described previously [
2]. Briefly, resected samples were cut into small pieces and incubated for 40 min at 37 °C in a control solution containing elastase (0.02 mg/mL), DNase I (0.02 mg/mL) and BSA (3%). Then, the samples were minced in a control solution containing DNase I (0.02 mg/mL) and BSA (3%) using fine forceps. Isolated nasal cells were washed with a control solution containing BSA (3%) three times with centrifugation at 160×
g for 5 min and then sterilized for 15 min using amphotericin B (0.25 μg/mL) in Ham’s F-12 with L-glutamine. Isolated nasal epithelial cells were cultured in complete PneumaCult-Ex Plus medium in a collagen-coated flask (Corning, 25 cm
2, New York, NY 14831 USA) at 37 °C in a humidified 5% CO
2 atmosphere. The medium was changed every second day. Once the cells reached confluency, they were washed with PBS (5 mL) and harvested in Hank’s balanced salt solution (HBSS, 2 mL) containing 0.1 mM EGTA and 0.025% trypsin to remove cells from the flask. Then, a trypsin inhibitor was added into the cell suspension to stop further digestion. After washing with centrifugation, cells were resuspended in complete PneumaCultTM-Ex Plus medium (1–2 × 10
5 cells, 3 mL) and seeded on a filter of Transwell permeable supports insert (Coster 3470, 6.5 mm Transwell with 0.4 μm Pore Polyester Membrane Inserts, Corning) (3.0 ×10
4 cells/insert, 400 μL). The complete PneumaCultTM-Ex Plus medium was added into the upper and bottom chambers, and the cells were cultured until confluent. Then, the medium in the bottom chamber was replaced with the complete PneumaCultTM-ALI medium (500 μL), and the medium in the upper chamber was removed to expose cells to the air (ALI culture). The medium in the bottom chamber was changed thrice per week. Cells were cultured for 4 weeks under the ALI condition to allow differentiation into ciliated cells [
5].
NHBE cells were purchased from Lonza (LOT No. 20TL119094, Basel, Switzerland) and cultured in the flask, in which complete PneumaCultTM-Ex Plus medium was added at 37 °C in a humidified 5% CO
2 atmosphere. Once the cells had reached confluency, they were washed with PBS (5 mL) and harvested with HBSS (2 mL) containing 0.1 mM EGTA and 0.025% trypsin. Then, a trypsin inhibitor was added. After washing the cells with centrifugation, the cells were resuspended in complete PneumaCultTM-Ex Plus medium (3 mL). The cells were seeded onto the filter of the Transwell permeable supports inserts (3.0 × 10
4 cells/insert, 400 μL) and cultured into the complete PneumaCultTM-Ex Plus medium, which was also added to the upper and bottom chambers. Once the cells reached confluency, the medium in the bottom chamber was replaced with PneumaCultTM-ALI medium (500 μL), and the medium in the upper chamber was removed (ALI culture). The medium in the bottom chamber was changed thrice per week. Cells were cultured for 3 weeks under the ALI condition [
18]. There were no differences in the development of cilia between nasal epithelial and NHBE cells.
4.6. Measurements of CBF and CBD
The insert membrane filter, on which cells had grown, was cut into 4–6 pieces. A piece of membrane with cells was placed on a coverslip precoated with neutralized Cell-Tak (Becton Dickinson Labware, Bedford, MA, USA). The coverslip with cells was then set in a perfusion chamber (20 µL), which was mounted on an inverted microscope (T-2000, NIKON, Tokyo, Japan) connected to a high-speed camera (IDP-Express R2000, Photron Ltd., Tokyo, Japan) (high-speed video microscope) [
2,
24]. The cells were perfused at a constant rate (200 µL/min). Since CBF is sensitive to temperature, the experiments were carried out at 37 °C [
2,
4,
5,
24]. Video images were recorded for 2 s at 500 fps using a high-speed video microscope. Video images of c-NECs before and 5 min after applying the NH
4+ pulse are shown in
Videos S1 and S2, respectively. The methods to measure CBF and CBD (ciliary bend distance, an index of ciliary beating amplitude (CBA)) have been described in detail [
5,
6,
8,
9]. The ratios of CBF (CBF
t/CBF
0) and CBD (CBD
t/CBD
0) were calculated to make comparisons across the experiments. The subscripts ‘0’ and ‘t’ indicate the time from the start of the experiments. Cells with the cut filter were kept in the control solution at room temperature (2–3 h) until the start of the CBF and CBD measurements. The storage conditions, such as temperature and time, affected CBF responses upon Zero-CO
2 application with a decrease, no change or a small increase, as shown in
Figure 5 and
Figure 6.
4.7. Measurement of pHi
The insert membrane filter with cells was incubated with a Ca2+-free control solution containing 1 mM EGTA (pH 7.2) for 10 min at room temperature, and then the cell sheet was removed from the membrane filter using a fine forceps. Then, the cell sheet was incubated with 2 µM BCECF-AM (Dojindo Laboratories, Kumamoto, Japan) for 30 min at 37 °C. After BCECF loading, the cell sheet was cut into small pieces (4–6 pieces) and kept in the control solution at room temperature until pHi measurements. A piece of cell sheet was set in a perfusion chamber, and the fluorescence of BCECF was measured using an image analysis system (MetaFluor, Molecular Device, CA, USA). BCECF was excited at 440 nm and 490 nm, and the emission was recorded at 530 nm. The fluorescence ratio (F490/F440) was calculated and recorded by the image analysis system. The calibration curve for pHi was obtained using BCECF-loaded cells perfused with a calibration solution containing nigericin (15 µM, Sigma-Aldrich, St Louis, MO, USA). The pHs of the calibration solution were 6.5, 7.0, 7.5 and 8.0. The calibration solution contained (in mM) KCl 150.5, MgCl2 2, CaCl2 1, HEPES 10 and glucose 5.
4.8. RT-PCR
Total RNA samples from c-hNECs and c-hBECs were prepared using an RNeasy Minikit (QIAGEN, Tokyo, Japan). Total RNA was reverse transcribed to cDNA using an oligo d(T)6 primer and an Omniscript RT kit (QIAGEN). Then, cDNA samples were subjected to reverse transcription-polymerase chain reaction (RT-PCR) using KOD FX (TOYOBO). The gene-specific primers for human CA are listed in
Table 1, and those for human NBC and anion exchangers (AE) are in
Table 2. The amplified PCR products were confirmed using agarose gel.
Real-time PCR was performed in c-hNECs and c-hBECs using the cDNA and CAIV primers confirmed by RT-PCR, and the expression levels of CAIV mRNA were quantitatively evaluated. Quantitative analyses for CAIV mRNA expression and GAPDH mRNA expression were performed using the PowerUp SYBR Green Master Mix (Applied Biosystems, Waltham, MA, USA). The expression level of CAIV mRNA was normalized to that of GAPDH.
4.9. Western Blotting
Cells on the insert membrane filter were washed with PBS and removed from the filter. Then, cells were homogenized in a radioimmunoprecipitation assay buffer (50 mM Tris-HCl, 150 mM NaCl, 1% Nonidet-P40, 0.5% sodium deoxycholate and 0.1% SDS, pH 7.6) containing a protease inhibitor cocktail and incubated at 4 °C for 20 min. Cells were then centrifuged at 16,000× g for 20 min at 4 °C. The supernatant was used as a cell lysate. The lysate was incubated with PNGase F (a recombinant glycosidase, Roche, Basel, Switzerland) in PBS containing 15 mM EDTA, 1% Nonidet P-40, 0.2% SDS and 1% 2-mercaptoethanol at 37℃ overnight. Proteins were separated using Laemmli’s SDS-polyacrylamide gel electrophoresis (8–12.5%) and then transferred onto a polyvinylidene difluoride membrane. The membrane was blocked with milk (2.5%) in Tris-buffered saline (10 mM Tris-HCl and 150 mM NaCl, pH 8.5) containing 0.1% Tween 20 (TBST) for 1 h and then incubated with a primary antibody (MAB2186, R&D System) diluted in solution 1 (Can Get Signal Immunoreaction Enhancer Solution, TOYOBO) overnight at 4 °C. After washing with TBST, the membrane was incubated with a secondary antibody (AP124P, anti-mouse IgG) diluted in solution 2 (Can Get Signal Immunoreaction Enhancer Solution, TOYOBO) for 1 h at room temperature. After washing, antigen–antibody complexes on the membrane were visualized using a chemiluminescence system (ECL plus; GE Healthcare, Waukesha, WI, USA).
4.10. Immunofluorescence Examination
Immunofluorescence examinations were performed in c-hNECs and c-hBECs [
19]. The cells on the Transwell insert membrane filter were removed using a cell scraper and suspended in PBS (2 mL). The cell suspension (0.5 mL) was dropped and dried on the cover slip, to which the cells attached. Then, the cells were fixed in 4% paraformaldehyde for 30 min and washed three times with PBS containing 10 mM glycine. The cells were permeabilized with 0.1% Triton X-100 for 15 min at room temperature. After 60 min pre-incubation with PBS containing 3% BSA at room temperature, the cells were incubated with the anti-CAIV (AF2186) and anti-AC-tubulin (ab179484, Abcam) antibodies overnight at 4 °C. Then, the cells were washed with PBS containing 0.1% BSA to remove unbound antibodies. Afterwards, the cells were stained with Alexa Fluor 488 goat anti-mouse IgG (H+L) (A-11001, 1:100 dilution) and Alexa Fluor 594 donkey anti-rabbit IgG (H+L) (A-21207, 1:100 dilution) secondary antibodies for 60 min at room temperature. The samples on the coverslip were enclosed with a mounting medium with DAPI (Vector, Burlingame, CA, USA). The cells were observed using a confocal microscope (LSM900, ZEISS, Oberkochen, Germany) [
4,
5].
4.11. Statistical Analysis
Statistical significance was assessed using one-way analysis of variance or Student’s t-test (paired or unpaired), as appropriate. Differences were considered significant for p-values < 0.05. The results are expressed as the means ± SD.


 ,
, 


