
Cordycepin Triphosphate as a Potential Modulator of Cellular Plasticity in Cancer via cAMP-Dependent Pathways: An In Silico Approach


 , , , ,
  and
and
Abstract
1. Introduction
2. Results
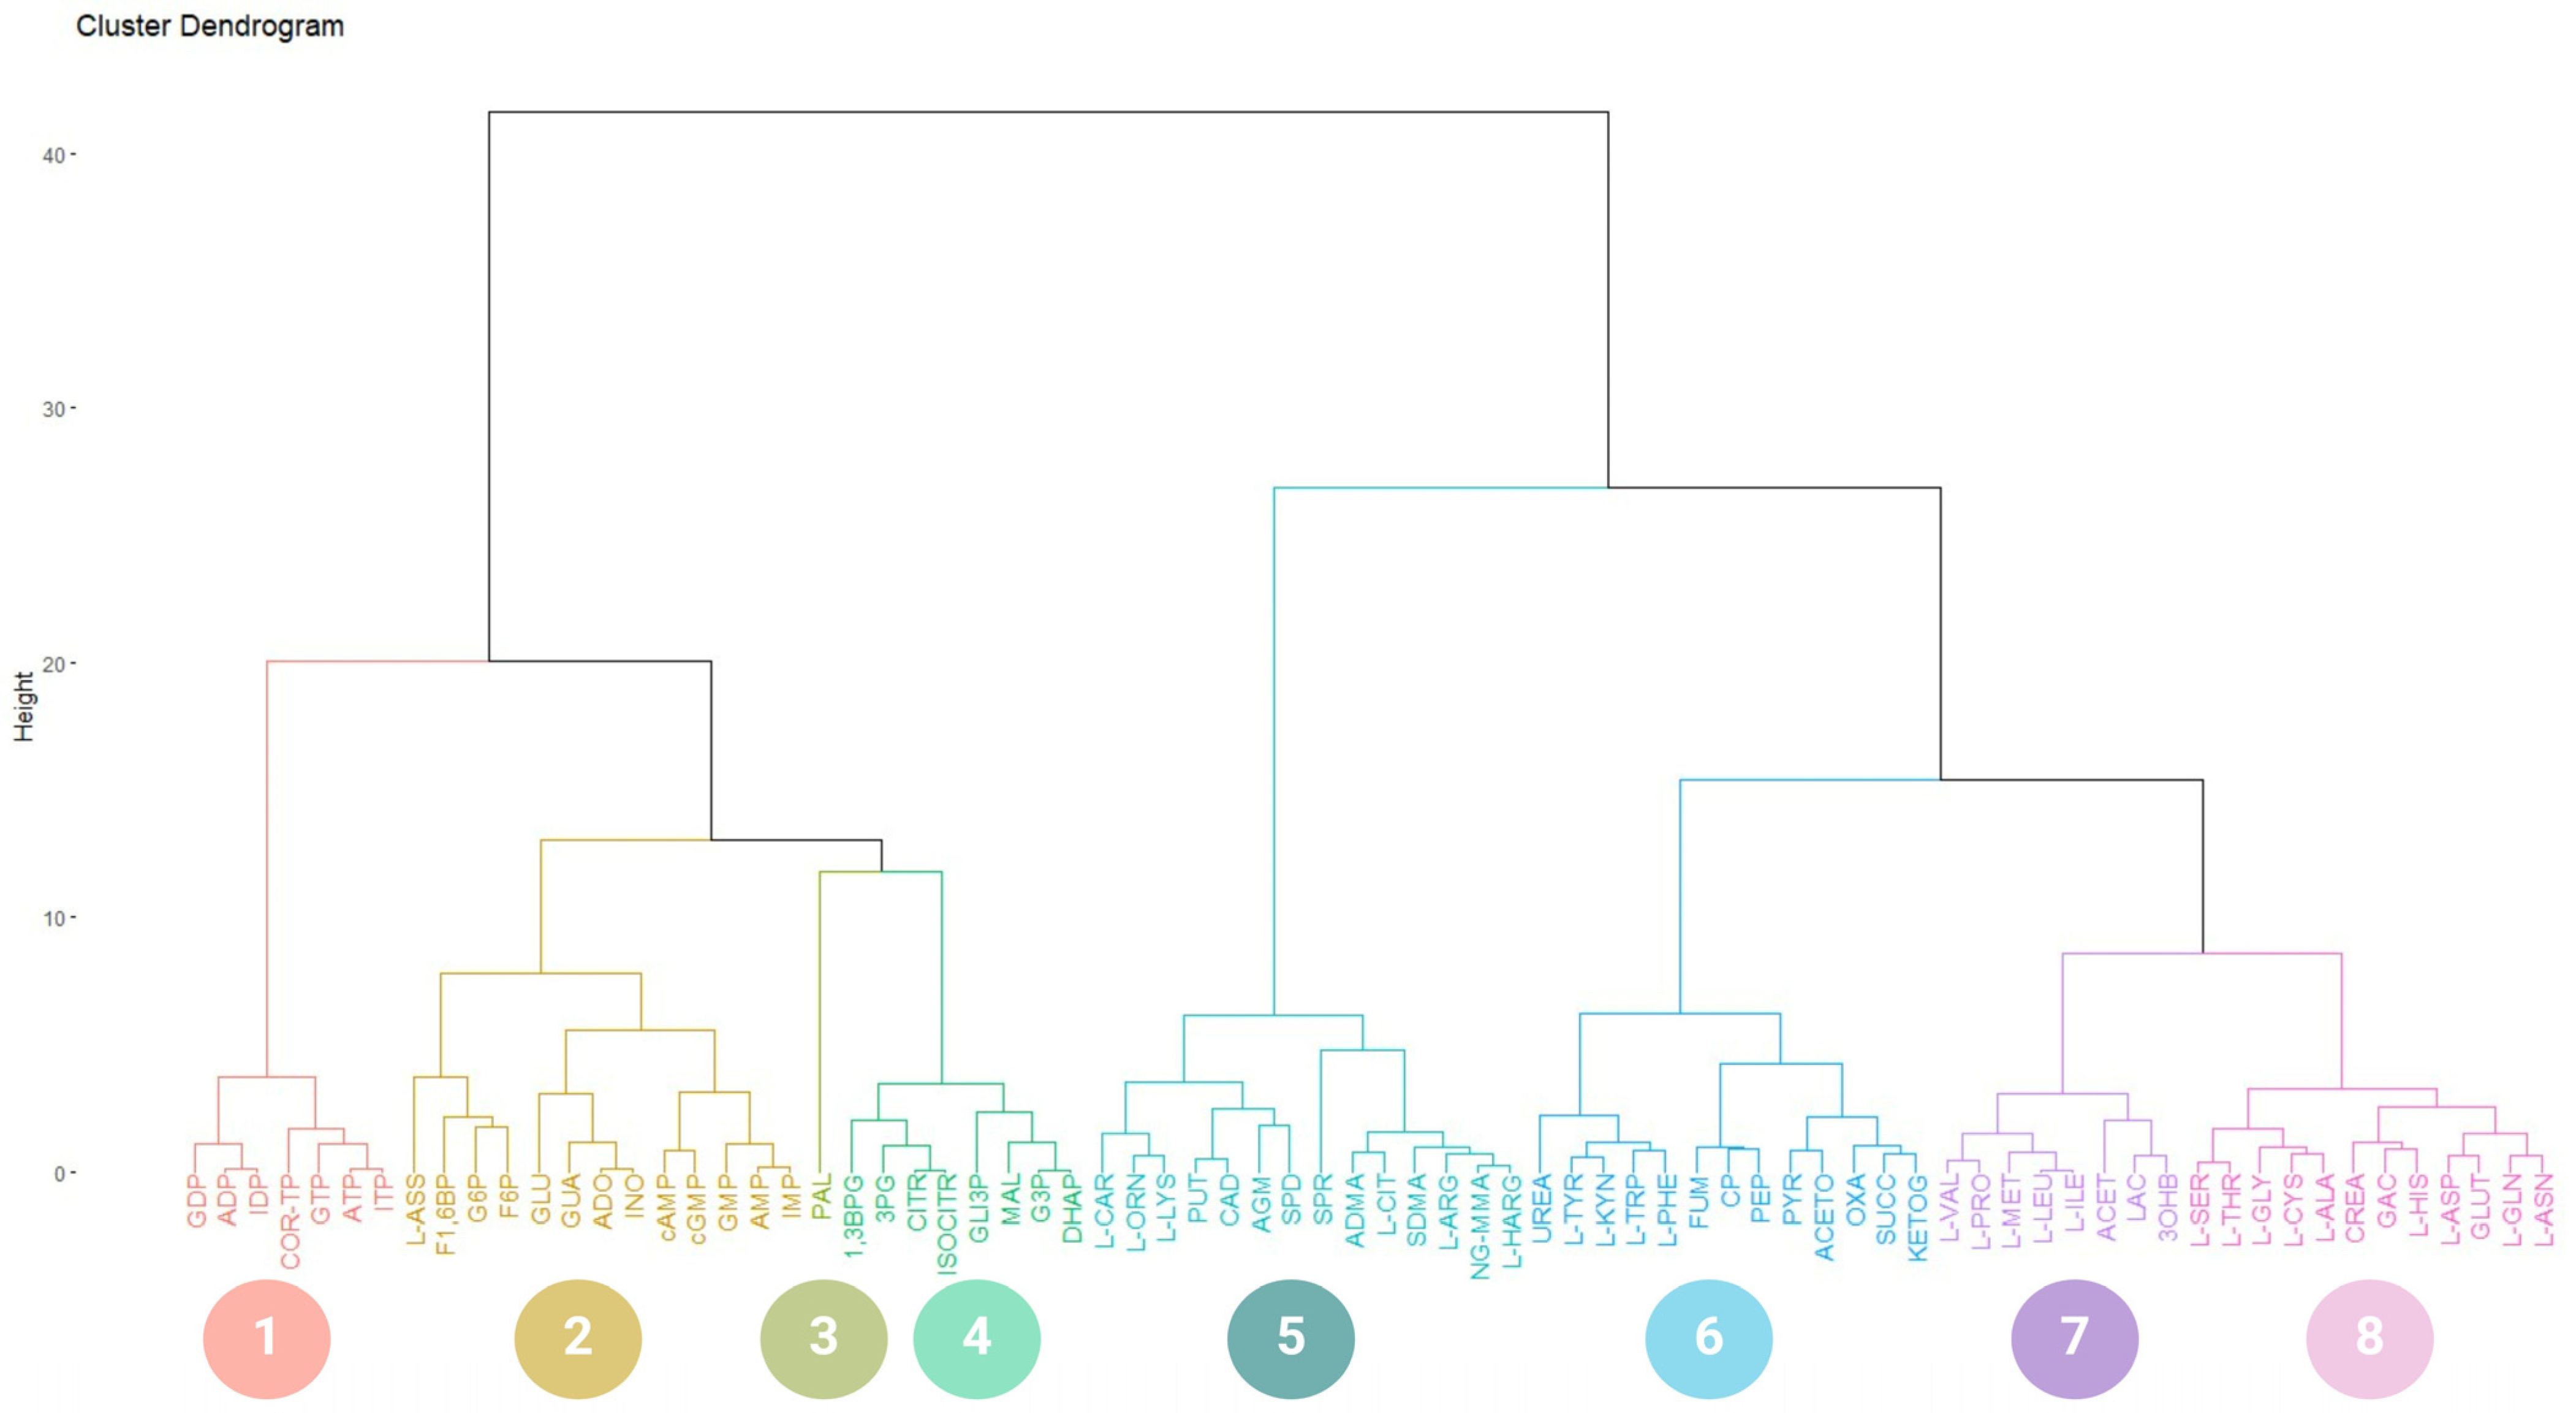
2.1. Database Creation
2.2. Structural Comparison of Cordycepin and Its Derivatives against Purine Derivatives
2.3. Physicochemical Comparison of Cordycepin and Its Derivatives against Purine Derivatives
2.4. Target Prediction According to Structural Characteristics of Cordycepin and Its Derivatives
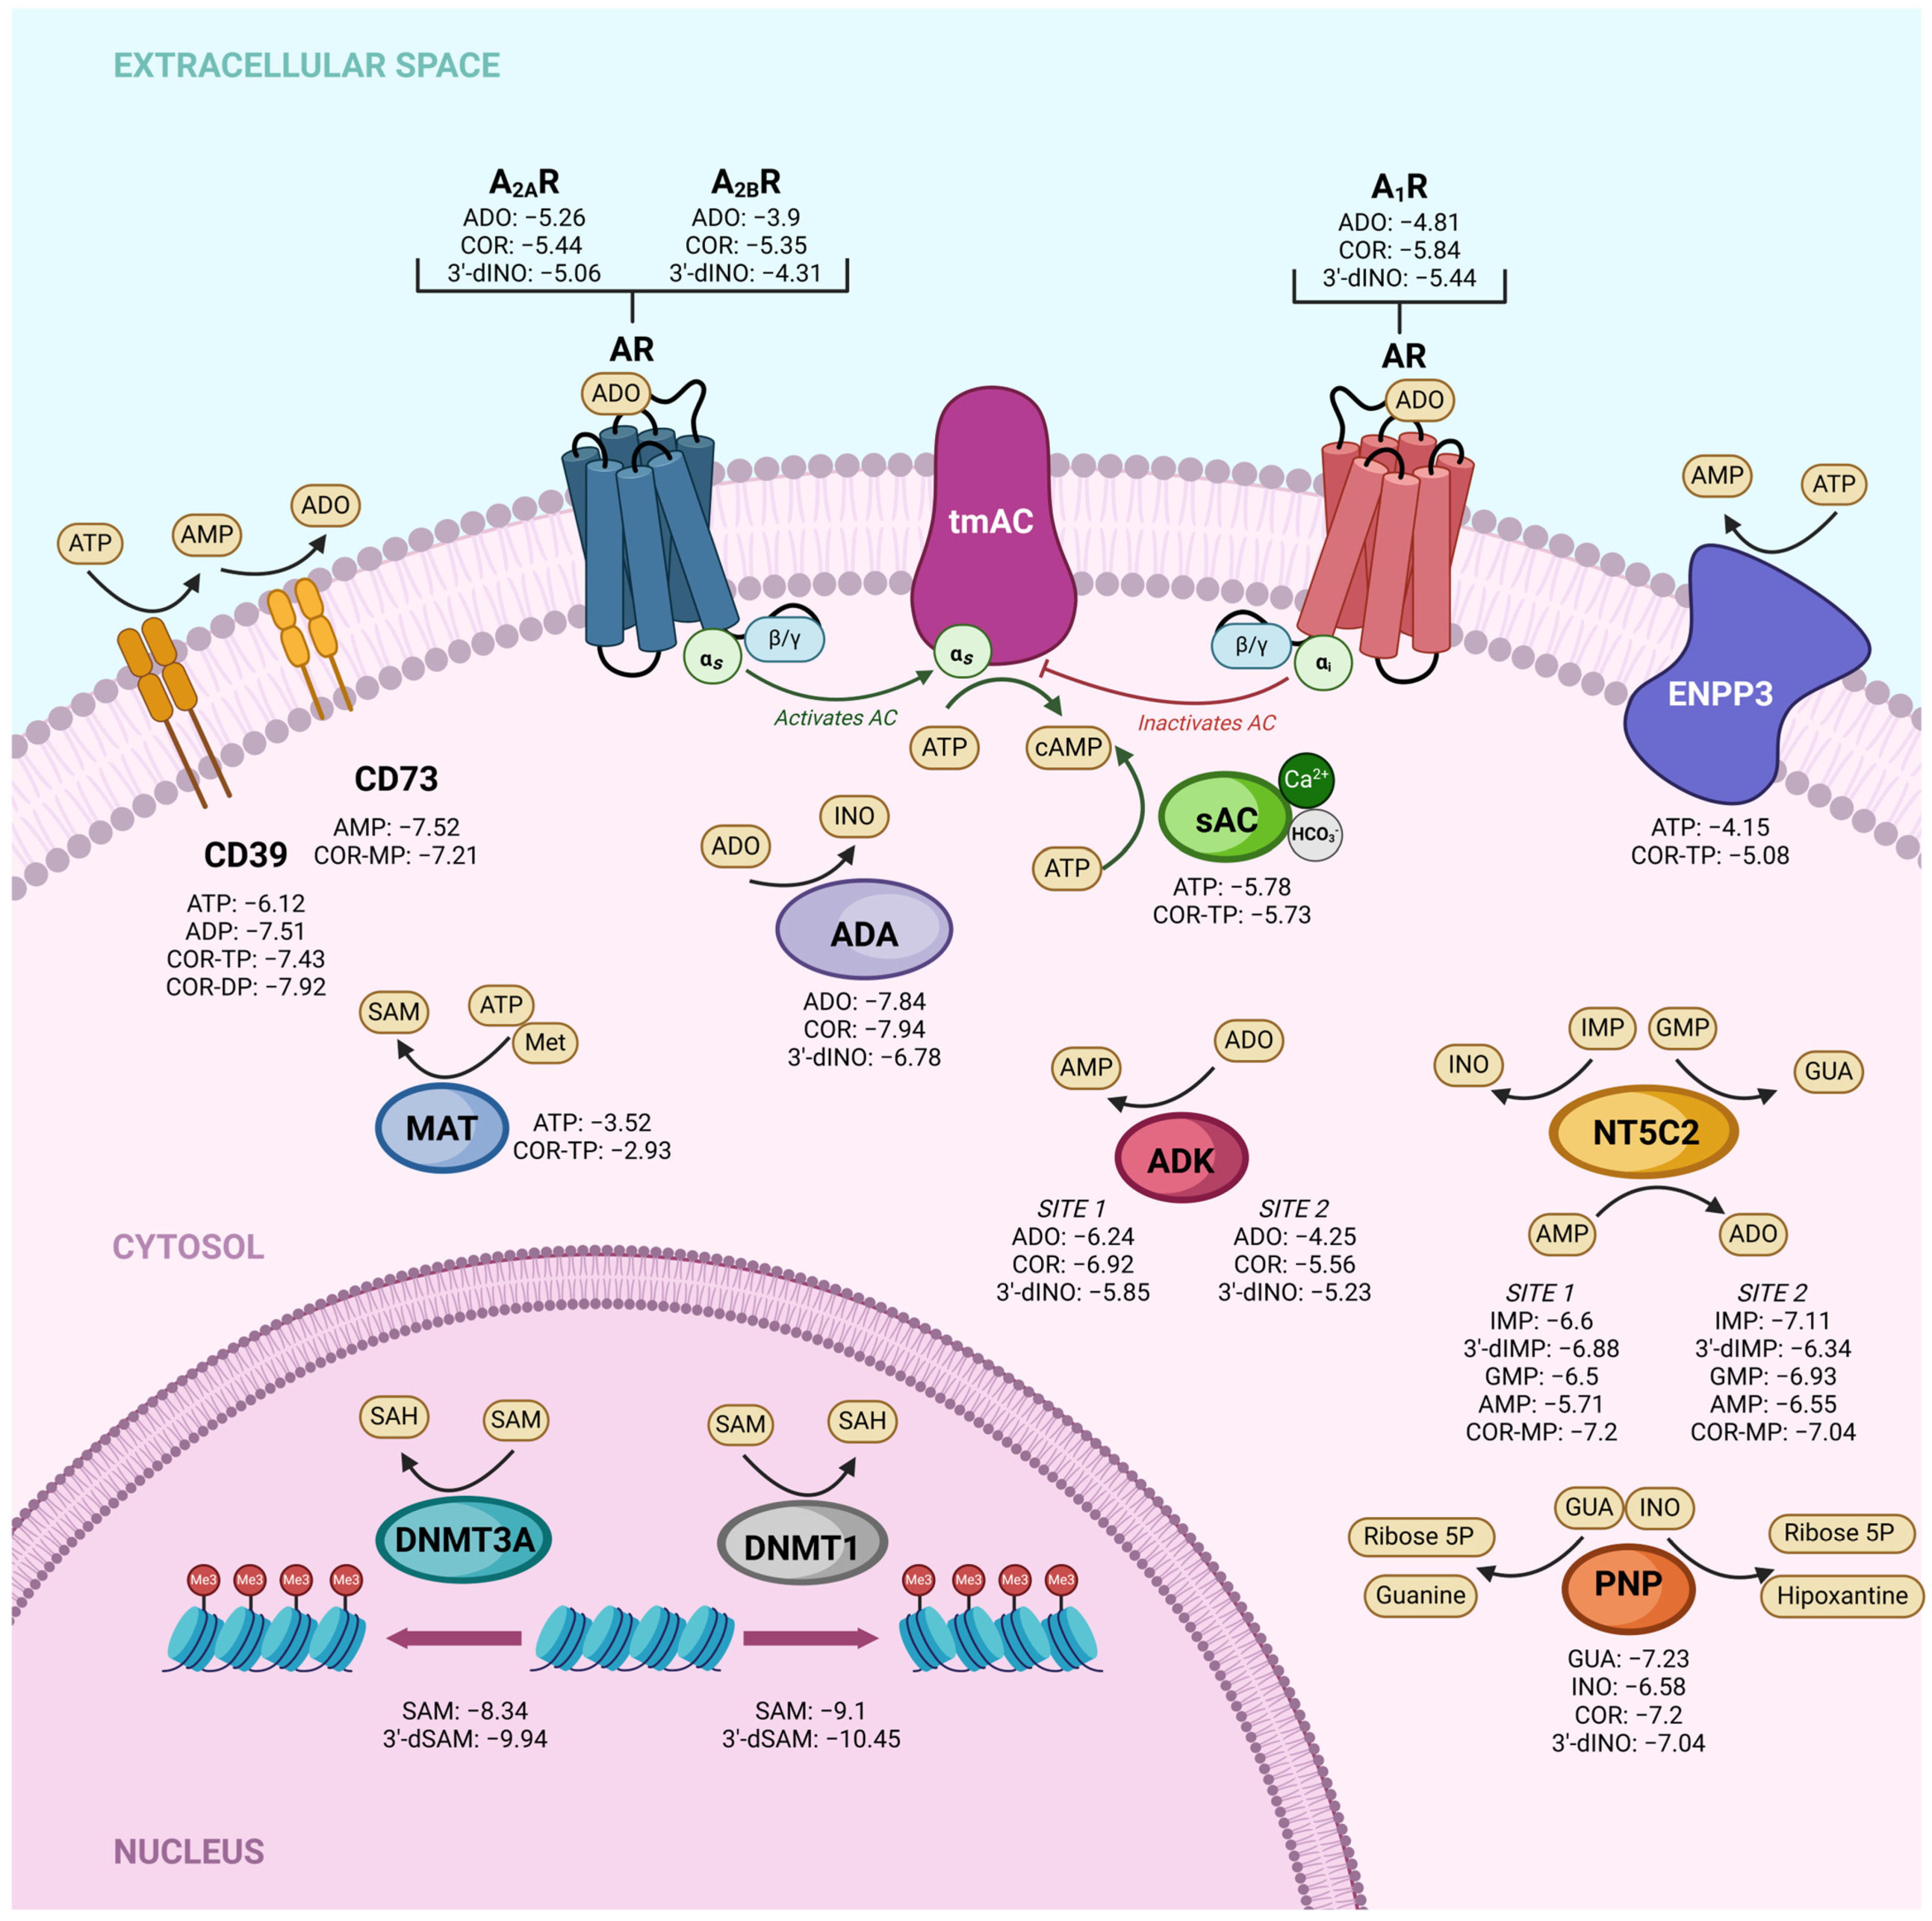
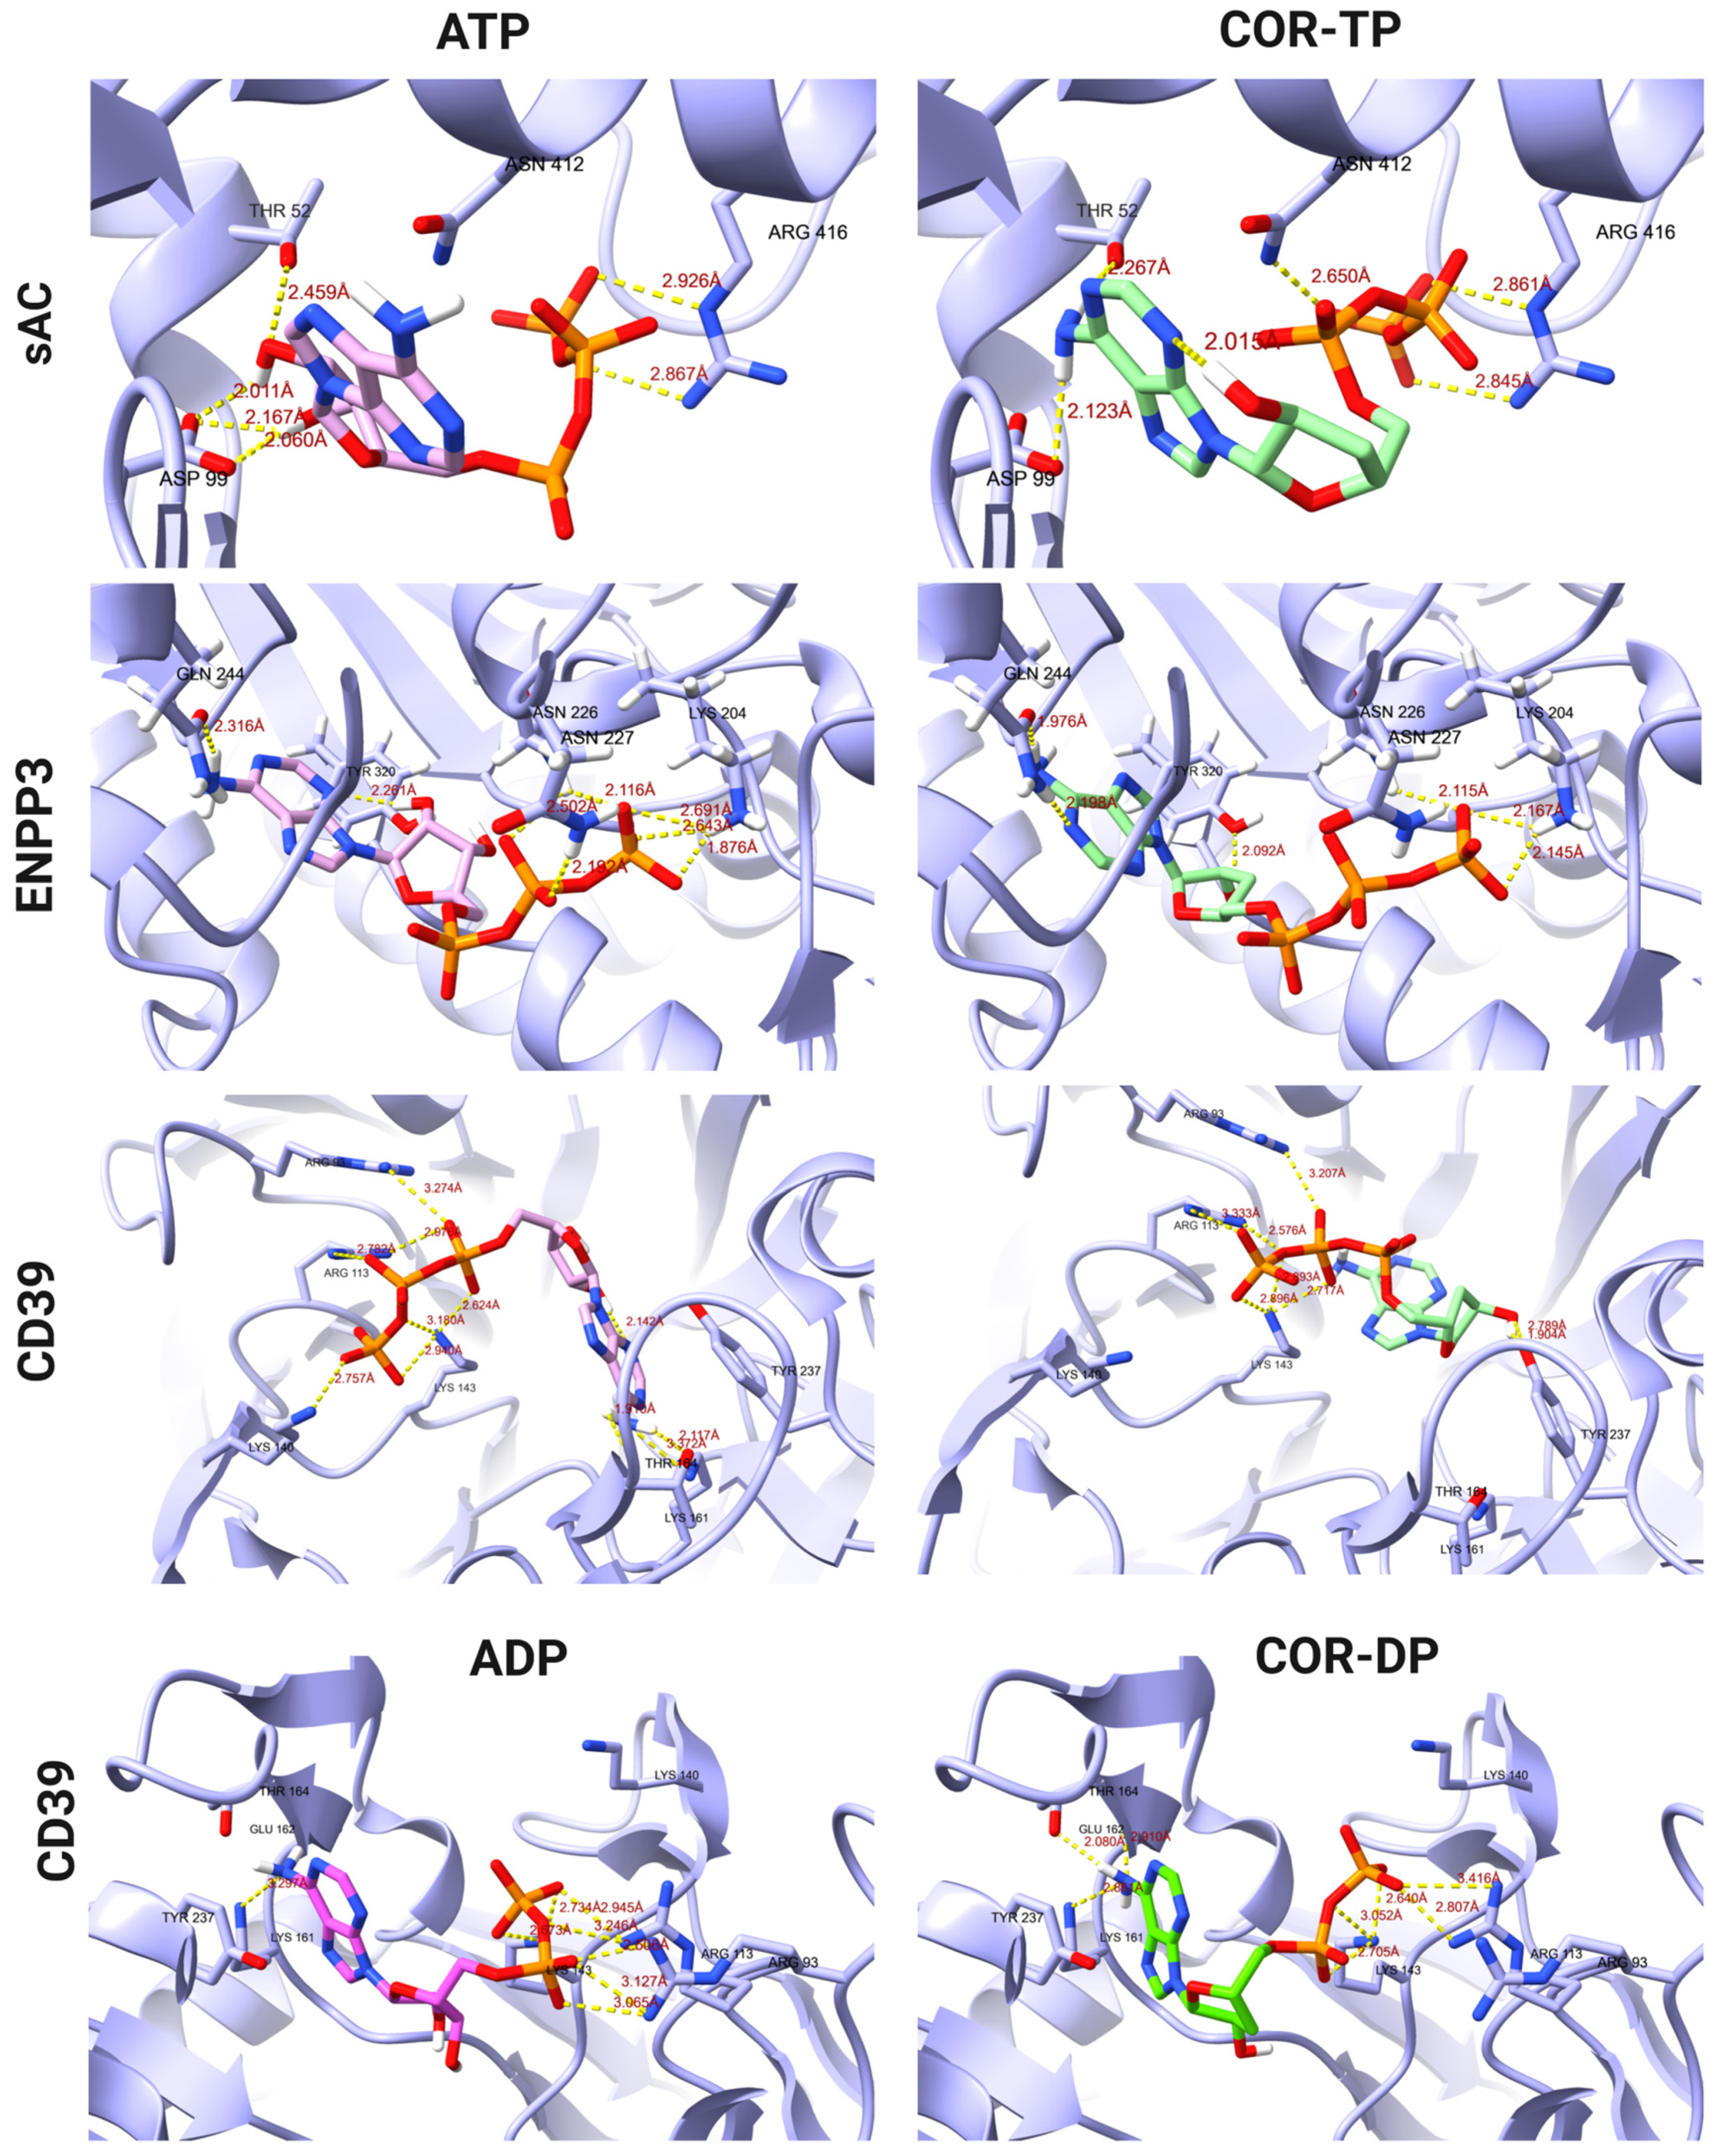
2.5. Comparative Analysis of Affinity and Binding Modes of Cordycepin and Its Derivatives with Endogenous Targets
2.6. Molecular Dynamics
2.6.1. Construction of Models by Homology
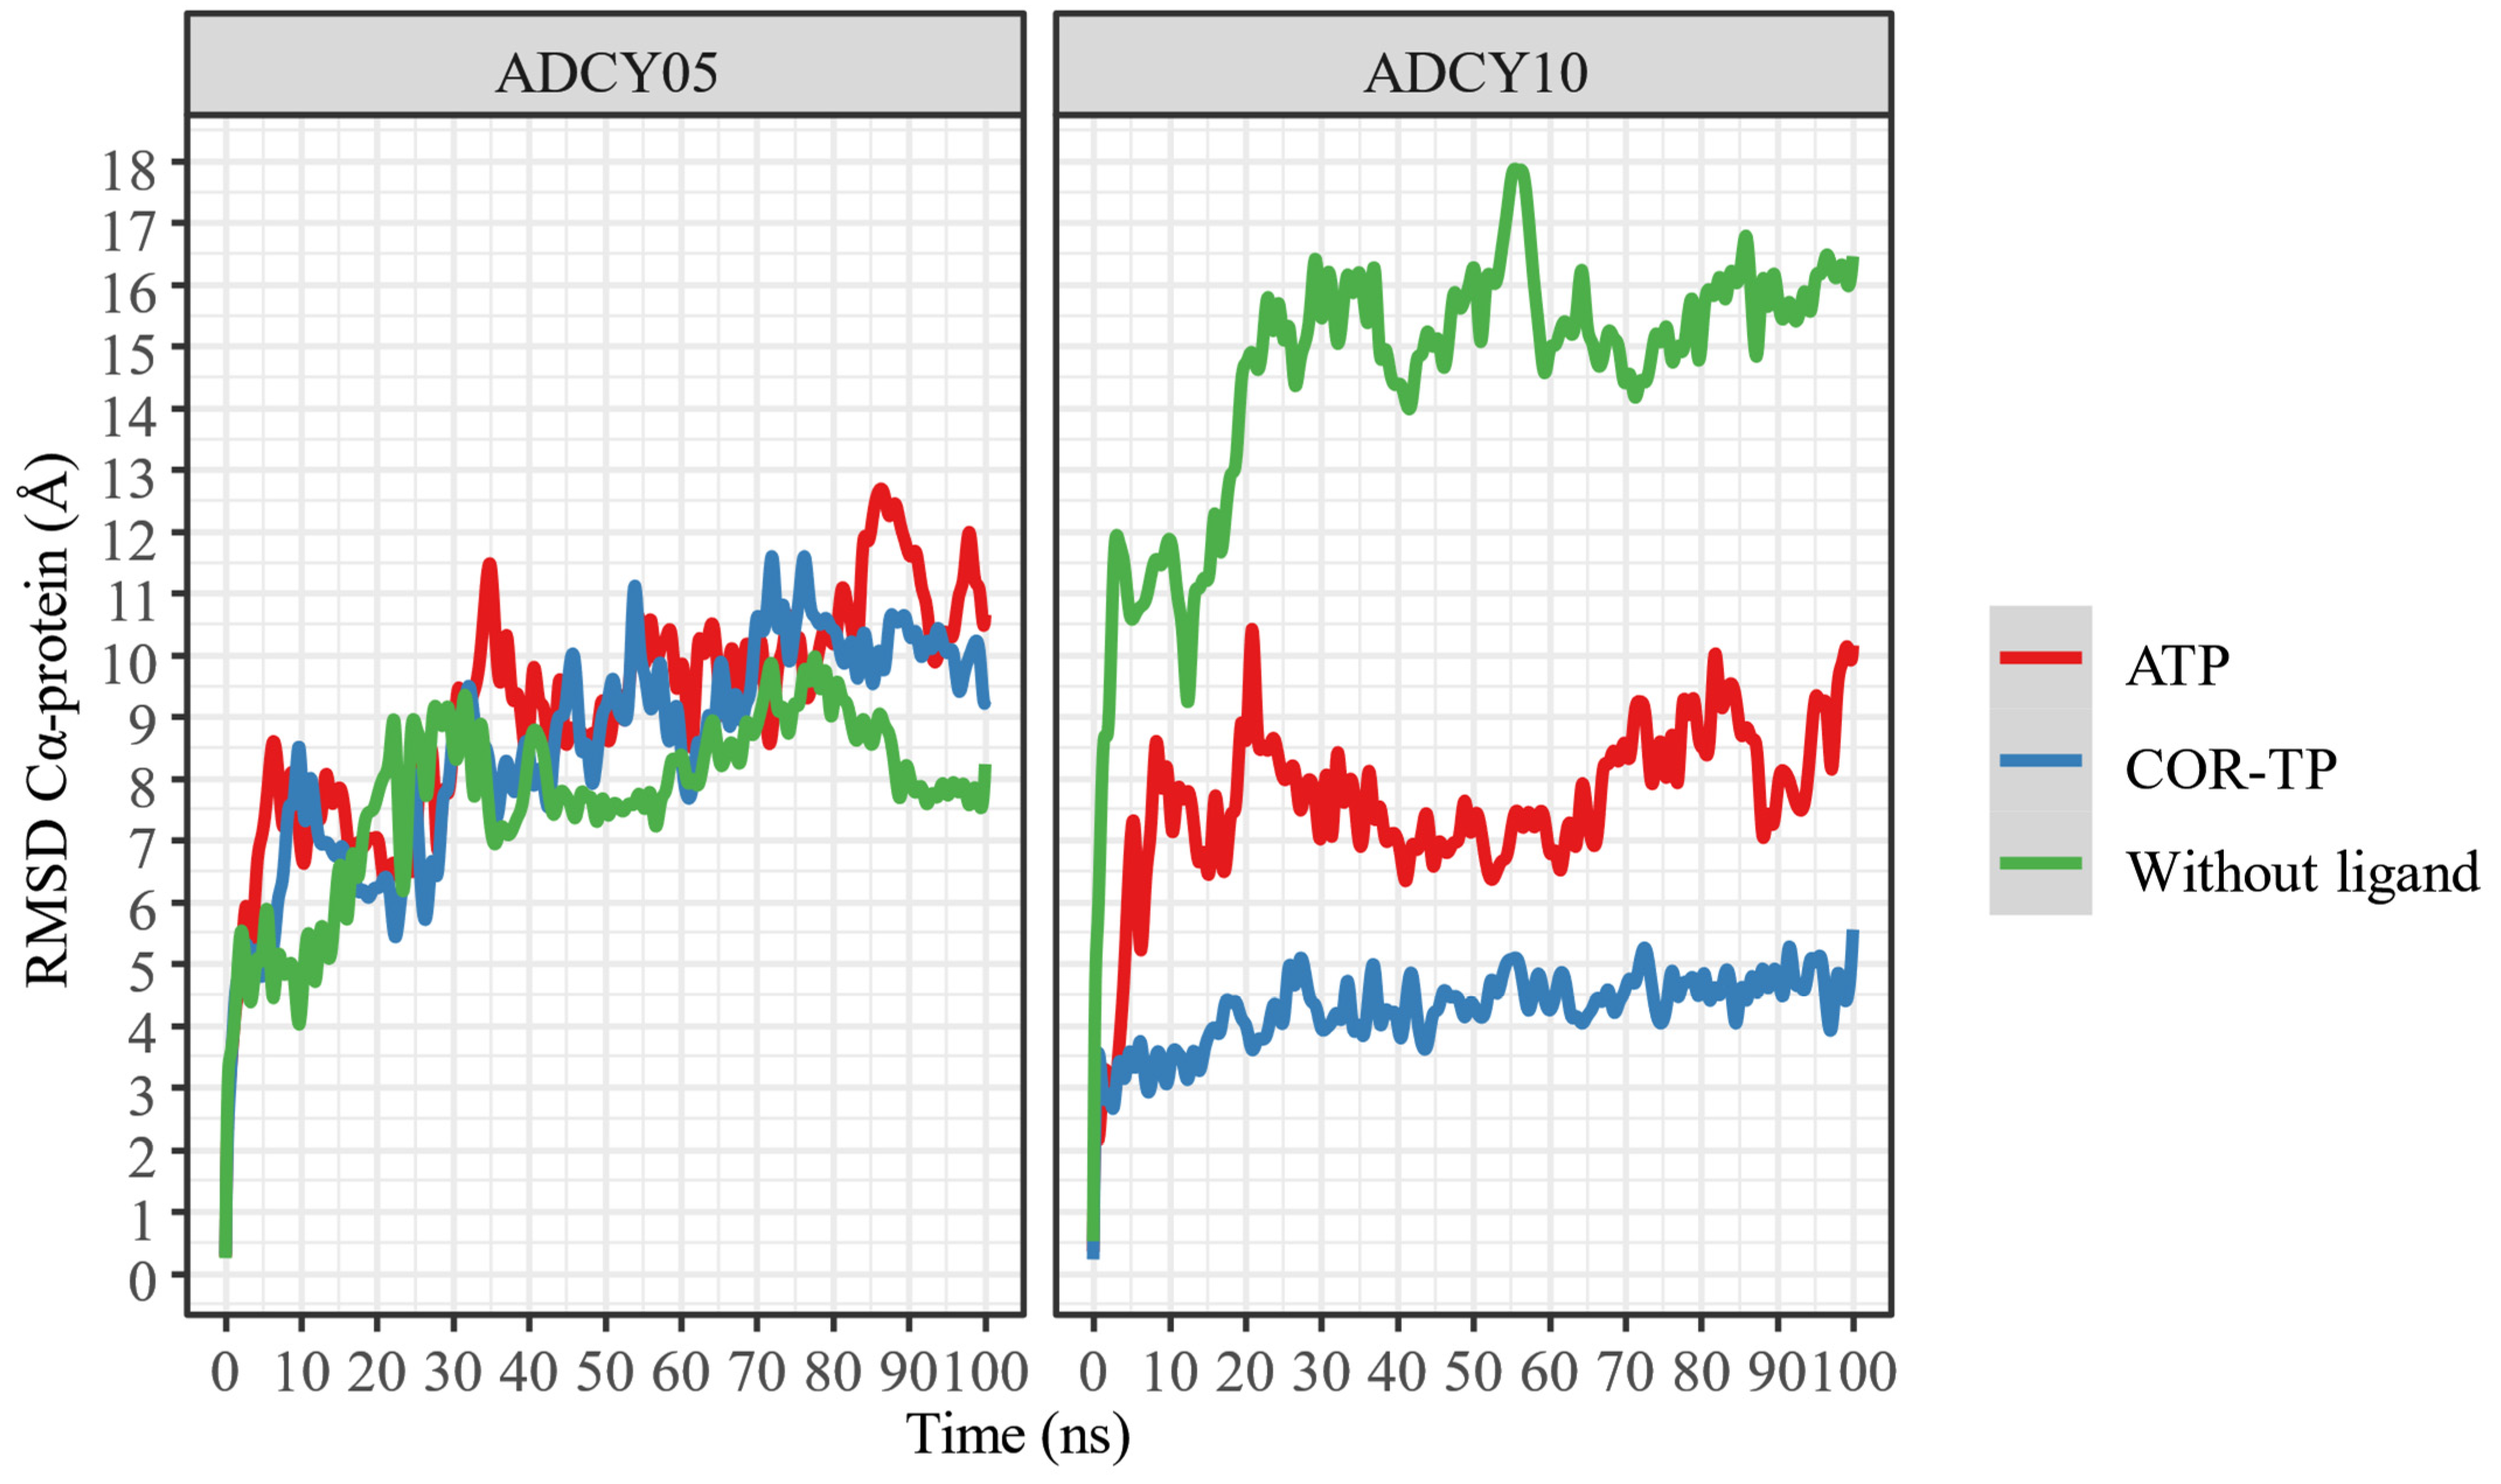
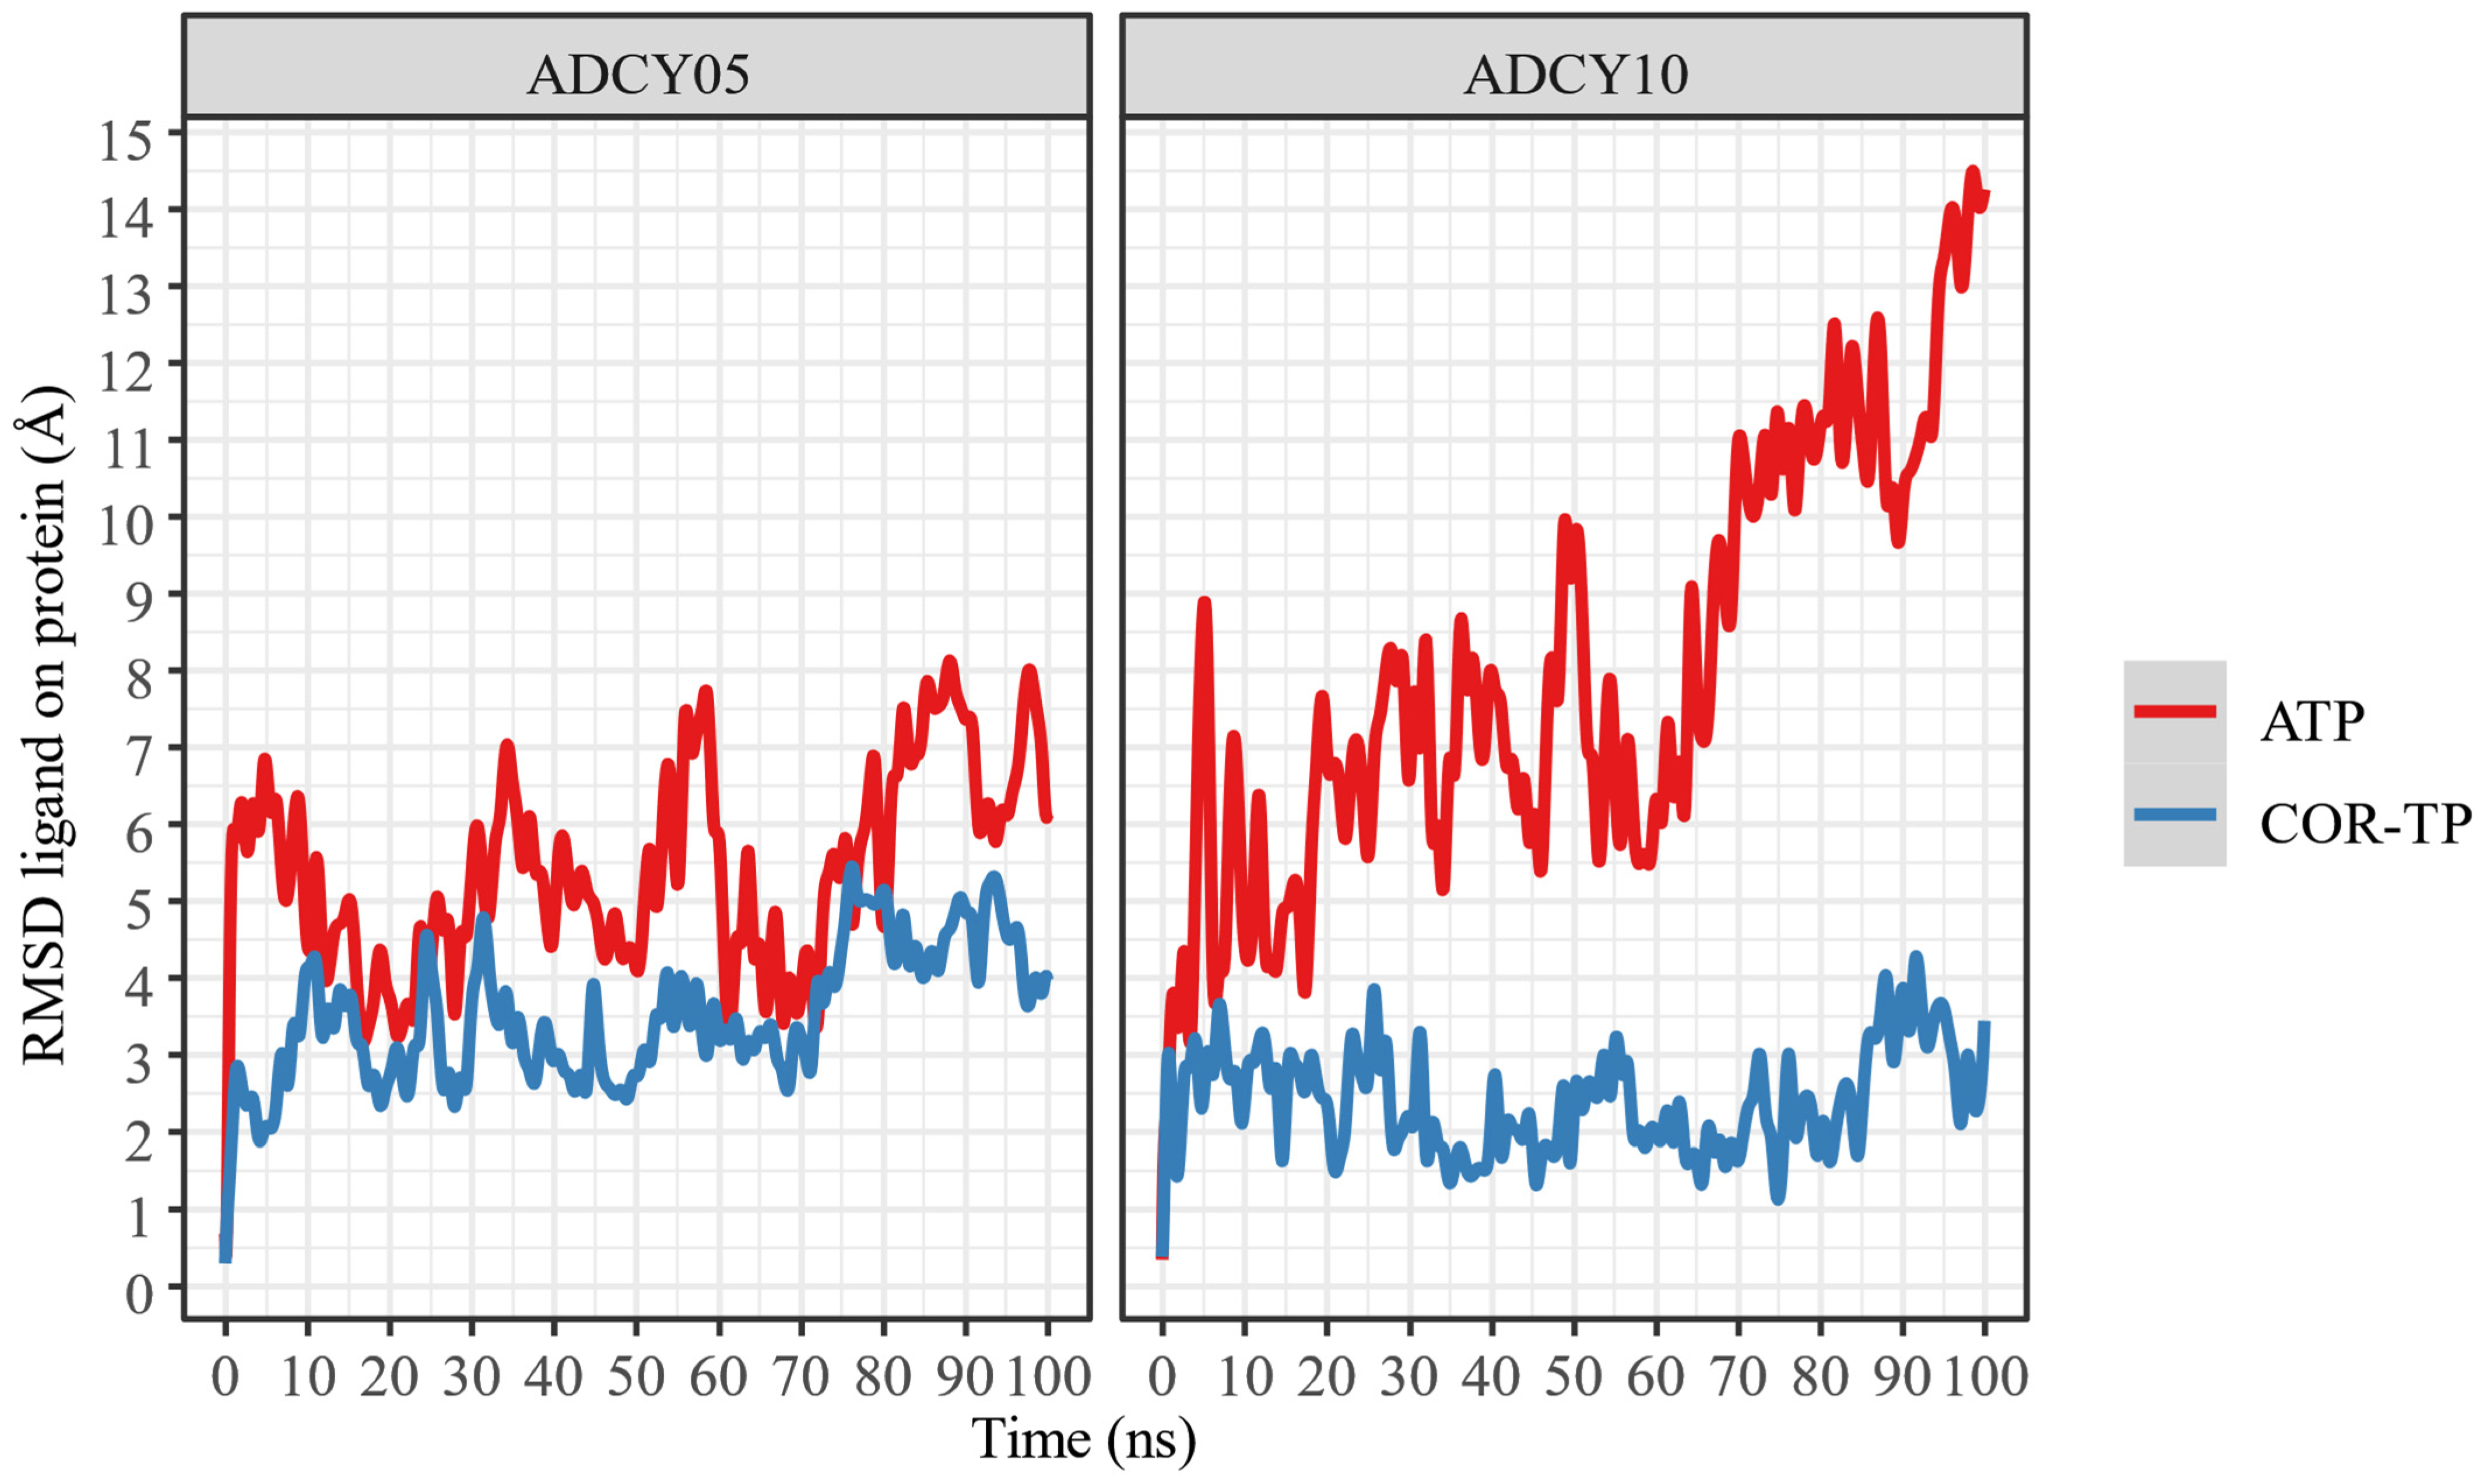
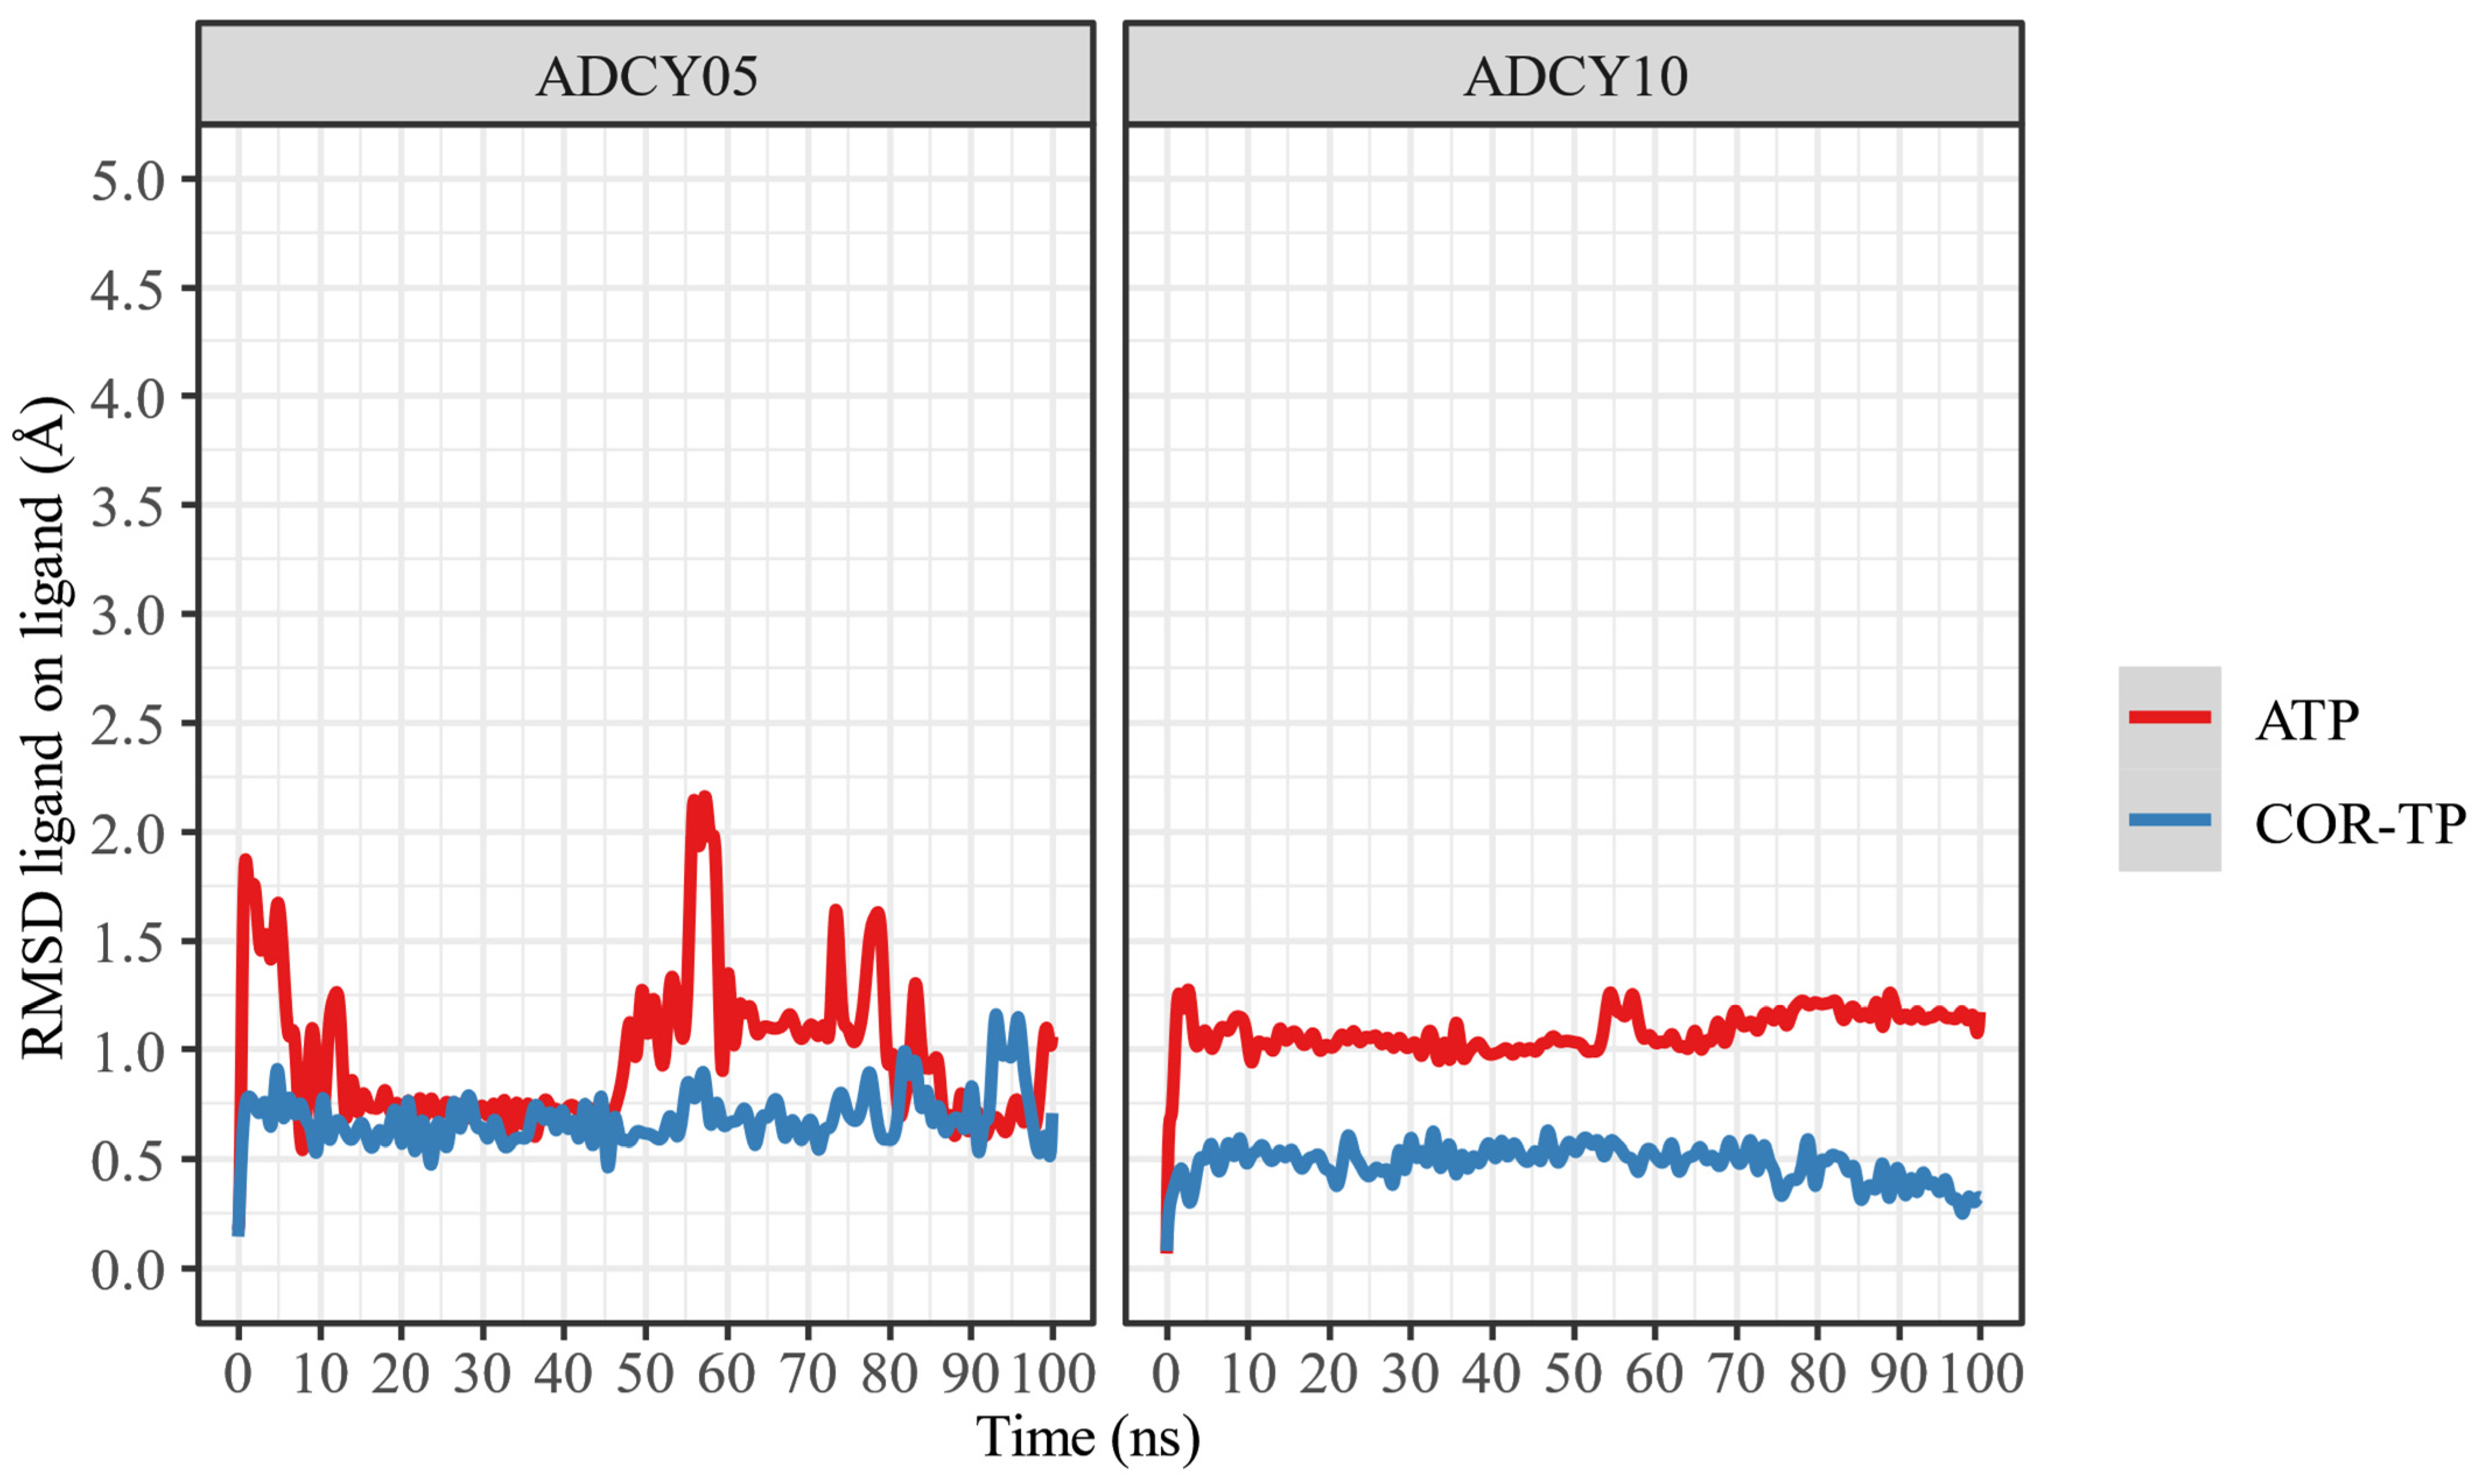
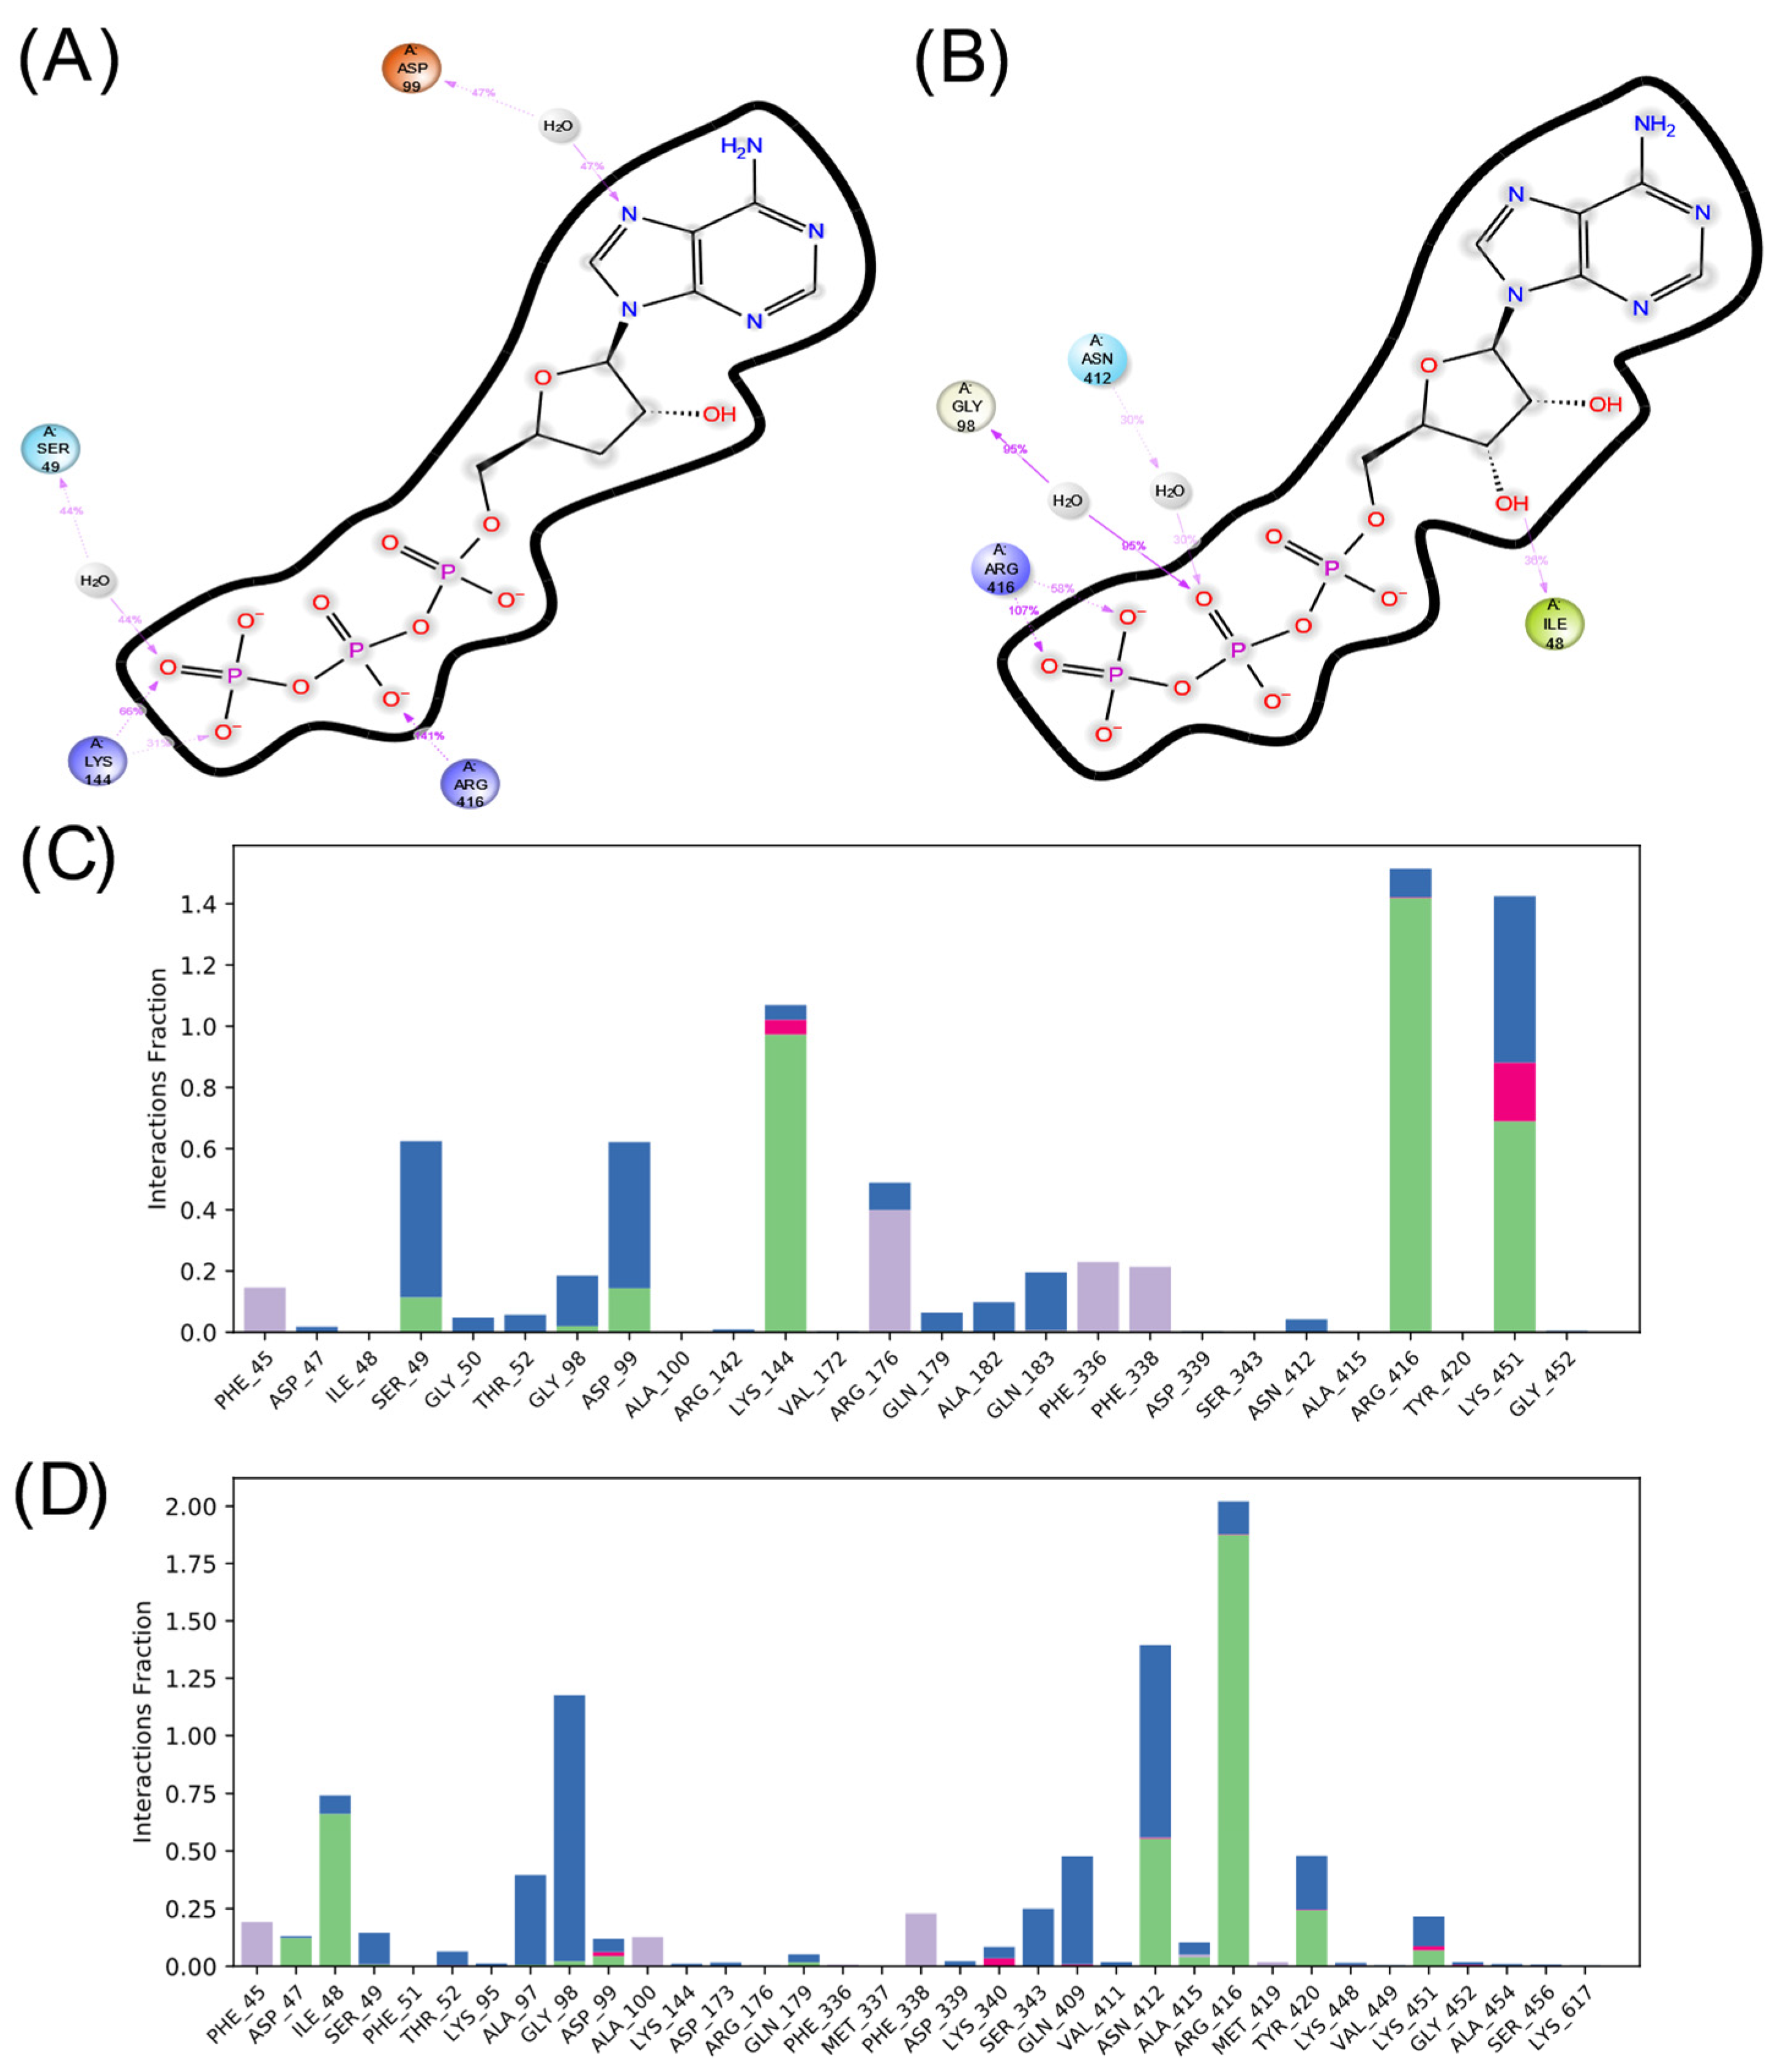
2.6.2. Relaxation of Complexes by Molecular Dynamics Simulations
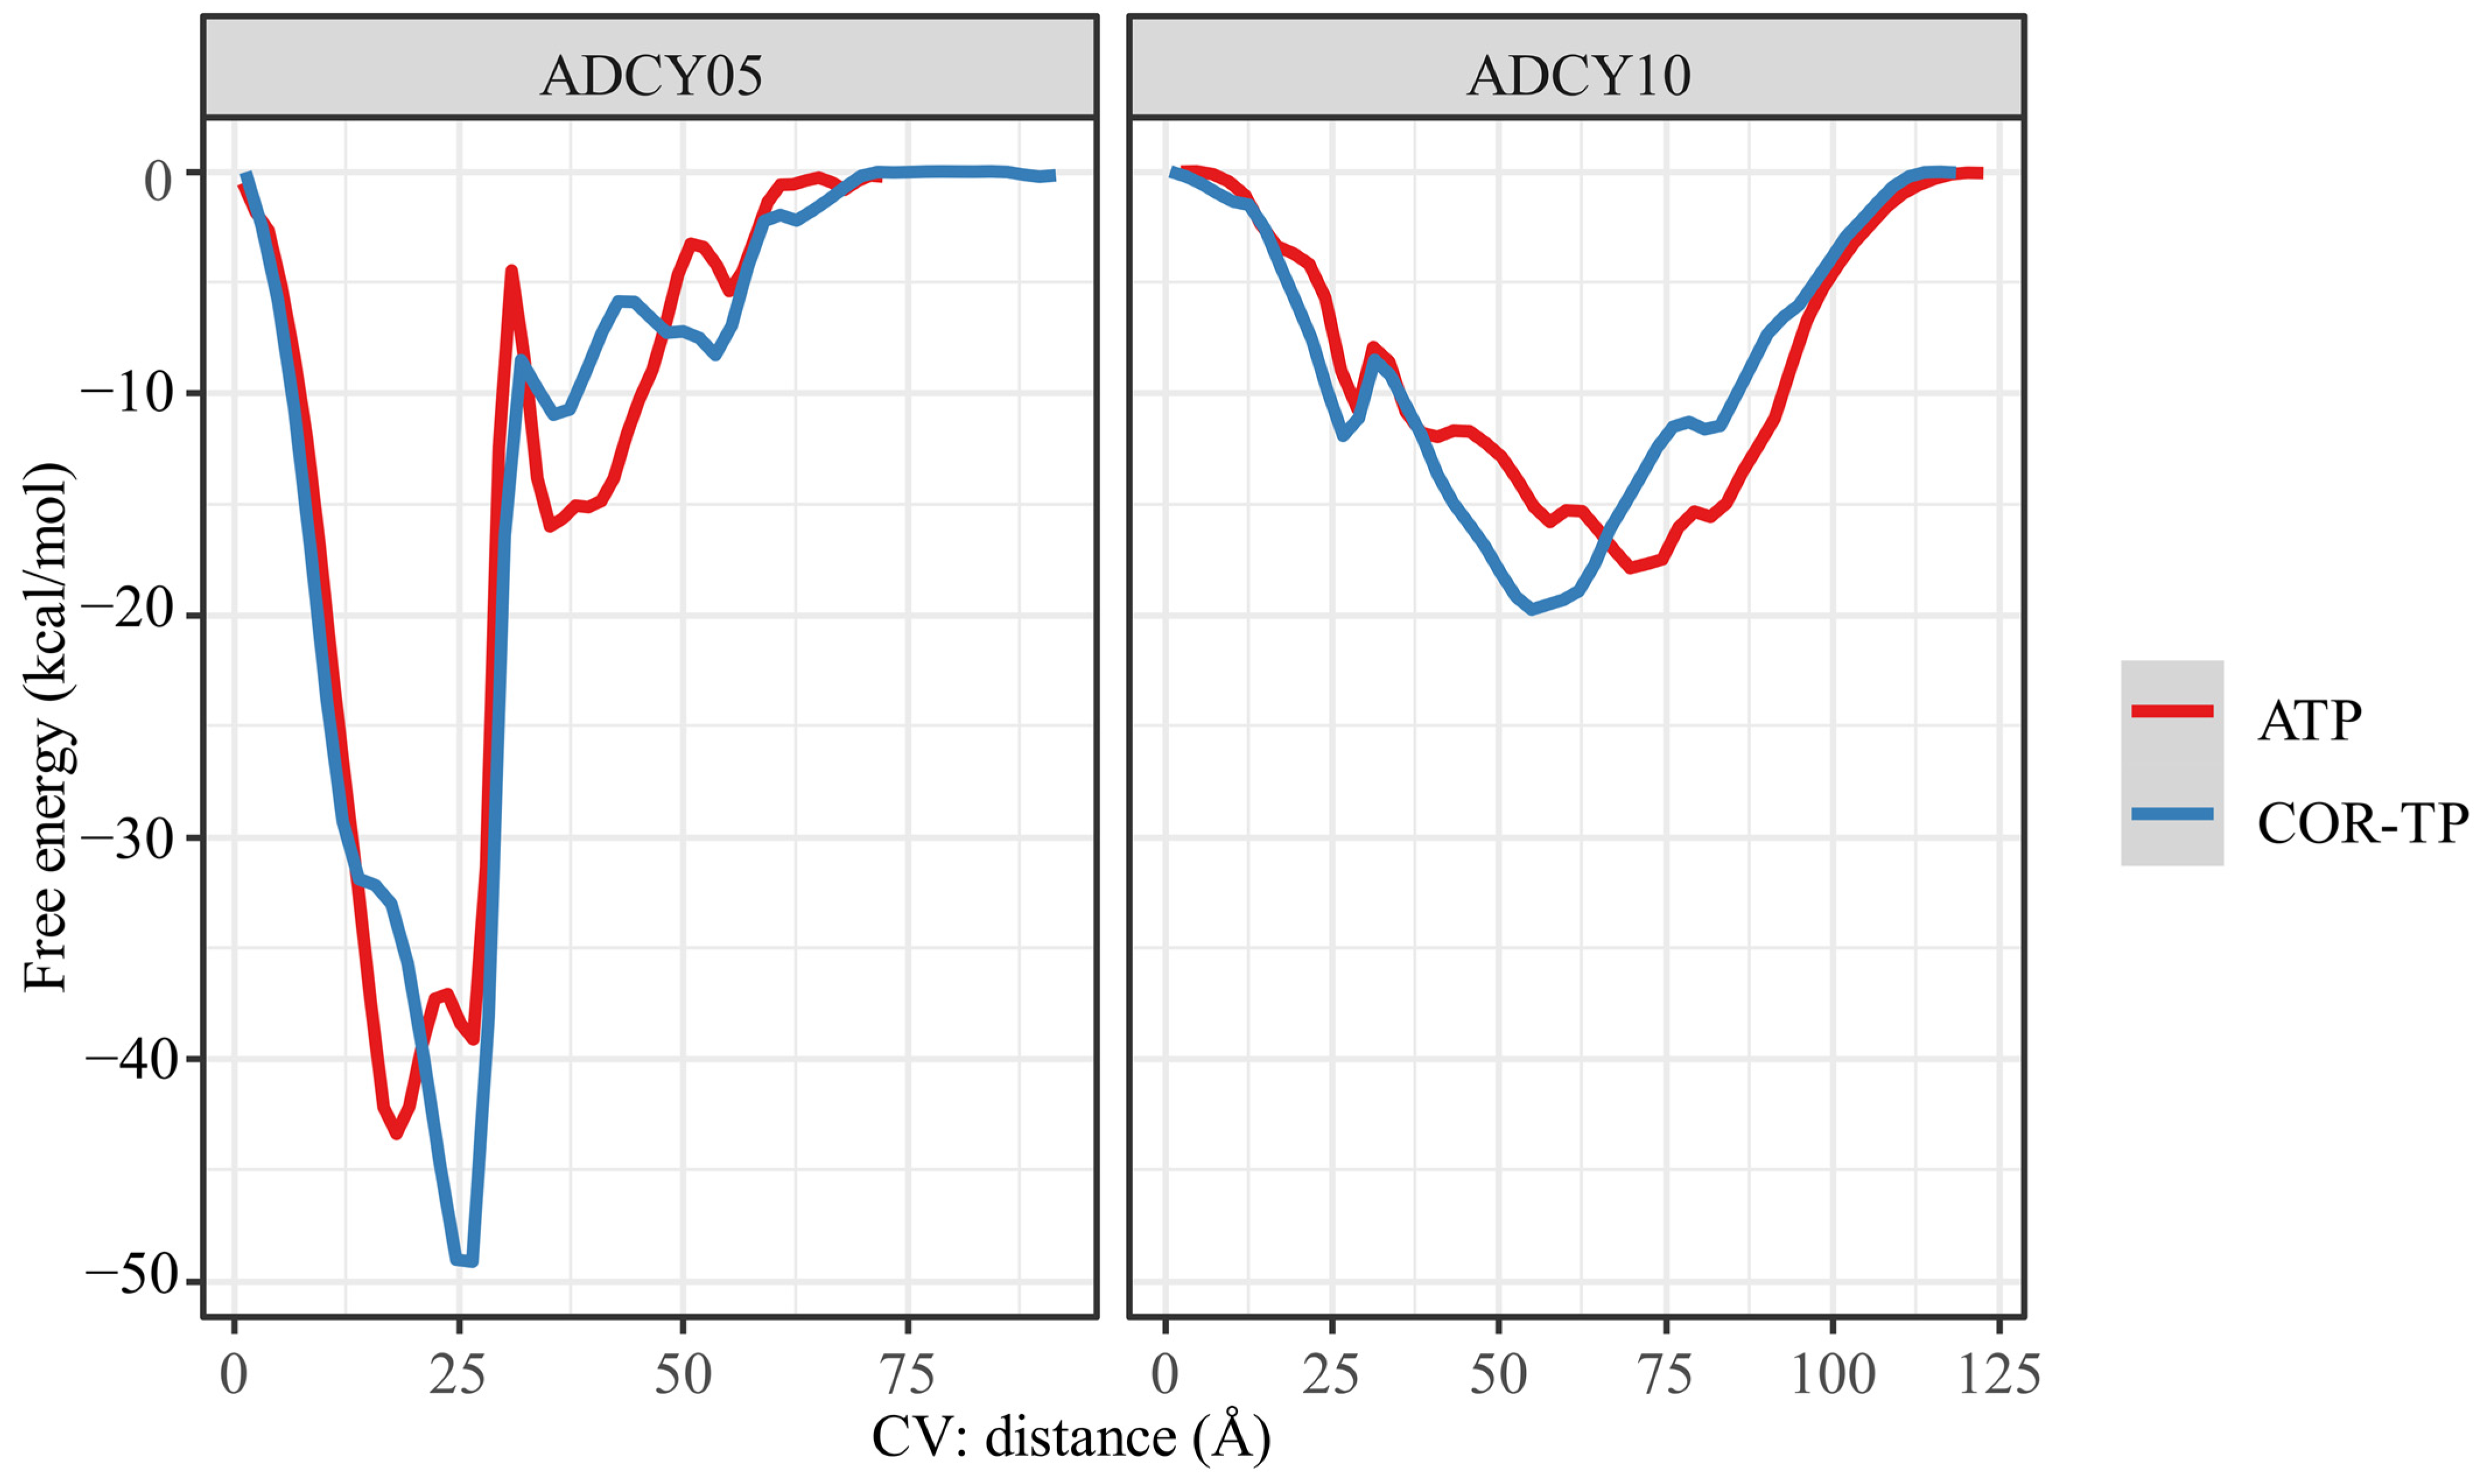
2.6.3. Well-Tempered Metadynamics Simulations
3. Discussion
4. Materials and Methods
4.1. Creation of Databases
4.2. Structural Comparison of Cordycepin and Its Derivatives against Purine Derivatives
4.3. Physicochemical Comparison of Cordycepin and Its Derivatives against Purine Derivatives
4.4. Target Prediction According to the Structural Characteristics of Cordycepin and Its Derivatives
4.5. Comparative Analysis of the Affinity and Binding Modes of Cordycepin and Its Derivatives with Endogenous Metabolite Targets
4.6. Molecular Dynamics
4.6.1. Construction of Models by Homology
Protein Structure
- ADCY05: Since section 1–195 is identified as a disordered region by UniProt, it is difficult to model and was removed from the prediction in Robetta.
- ADCY10: Due to the total size of the protein (>1600 aa), it could not be directly modeled, so three segments (1–900 aa, 600–1000 aa, and 700–1610 aa) were modeled in Robetta. Once the models were obtained, they were aligned in the Schrödinger-Maestro 2020-4 program [139] using the 600–1000 aa segment as the alignment standard to build the chimeric model.
Structure of Ligands
4.6.2. Molecular Dynamics Simulations
4.6.3. Well-Tempered Metadynamics
5. Conclusions
Supplementary Materials
Author Contributions
Funding
Institutional Review Board Statement
Informed Consent Statement
Data Availability Statement
Conflicts of Interest
References
- Chan, J.M.; Zaidi, S.; Love, J.R.; Zhao, J.L.; Setty, M.; Wadosky, K.M.; Gopalan, A.; Choo, Z.-N.; Persad, S.; Choi, J.; et al. Lineage Plasticity in Prostate Cancer Depends on JAK/STAT Inflammatory Signaling. Science 2022, 377, 1180–1191. [Google Scholar] [CrossRef] [PubMed]
- Hanahan, D. Hallmarks of Cancer: New Dimensions. Cancer Discov. 2022, 12, 31–46. [Google Scholar] [CrossRef] [PubMed]
- Nieto, M.A.; Huang, R.Y.; Jackson, R.A.; Thiery, J.P. EMT: 2016. Cell 2016, 166, 21–45. [Google Scholar] [CrossRef] [PubMed]
- Brabletz, T.; Kalluri, R.; Nieto, M.A.; Weinberg, R.A. EMT in Cancer. Nat. Rev. Cancer 2018, 18, 128–134. [Google Scholar] [CrossRef] [PubMed]
- Méndez-López, L.F. Revisiting Epithelial Carcinogenesis. Int. J. Mol. Sci. 2022, 23, 7437. [Google Scholar] [CrossRef] [PubMed]
- de Visser, K.E.; Joyce, J.A. The Evolving Tumor Microenvironment: From Cancer Initiation to Metastatic Outgrowth. Cancer Cell 2023, 41, 374–403. [Google Scholar] [CrossRef] [PubMed]
- Goenka, A.; Khan, F.; Verma, B.; Sinha, P.; Dmello, C.C.; Jogalekar, M.P.; Gangadaran, P.; Ahn, B. Tumor Microenvironment Signaling and Therapeutics in Cancer Progression. Cancer Commun. 2023, 43, 525–561. [Google Scholar] [CrossRef] [PubMed]
- Shi, Z.-D.; Pang, K.; Wu, Z.-X.; Dong, Y.; Hao, L.; Qin, J.-X.; Wang, W.; Chen, Z.-S.; Han, C.-H. Tumor Cell Plasticity in Targeted Therapy-Induced Resistance: Mechanisms and New Strategies. Signal Transduct. Target. Ther. 2023, 8, 113. [Google Scholar] [CrossRef]
- Lepski, G.; Jannes, C.E.; Nikkhah, G.; Bischofberger, J. CAMP Promotes the Differentiation of Neural Progenitor Cells in Vitro via Modulation of Voltage-Gated Calcium Channels. Front. Cell. Neurosci. 2013, 7, 155. [Google Scholar] [CrossRef]
- Zaccolo, M. Spatial Control of CAMP Signalling in Health and Disease. Curr. Opin. Pharmacol. 2011, 11, 649–655. [Google Scholar] [CrossRef]
- Tesmer, J.J.G.; Sprang, S.R. The Structure, Catalytic Mechanism and Regulation of Adenylyl Cyclase. Curr. Opin. Struct. Biol. 1998, 8, 713–719. [Google Scholar] [CrossRef] [PubMed]
- Thatcher, J.D. The CAMP Signal Transduction Pathway. Sci. Signal 2010, 3, tr2. [Google Scholar] [CrossRef] [PubMed]
- Saxena, S.; Rönn, R.E.; Guibentif, C.; Moraghebi, R.; Woods, N.-B. Cyclic AMP Signaling through Epac Axis Modulates Human Hemogenic Endothelium and Enhances Hematopoietic Cell Generation. Stem Cell Rep. 2016, 6, 692–703. [Google Scholar] [CrossRef]
- Challier, J.; Bruniquel, D.; Sewell, A.K.; Laugel, B. Adenosine and CAMP Signalling Skew Human Dendritic Cell Differentiation towards a Tolerogenic Phenotype with Defective CD8+ T-cell Priming Capacity. Immunology 2013, 138, 402–410. [Google Scholar] [CrossRef] [PubMed]
- Sastry, K.S.R.; Karpova, Y.; Prokopovich, S.; Smith, A.J.; Essau, B.; Gersappe, A.; Carson, J.P.; Weber, M.J.; Register, T.C.; Chen, Y.Q.; et al. Epinephrine Protects Cancer Cells from Apoptosis via Activation of CAMP-Dependent Protein Kinase and BAD Phosphorylation. J. Biol. Chem. 2007, 282, 14094–14100. [Google Scholar] [CrossRef] [PubMed]
- Díaz-Muñoz, M.D.; Osma-García, I.C.; Fresno, M.; Iñiguez, M.A. Involvement of PGE2 and the CAMP Signalling Pathway in the Up-Regulation of COX-2 and MPGES-1 Expression in LPS-Activated Macrophages. Biochem. J. 2012, 443, 451–461. [Google Scholar] [CrossRef] [PubMed]
- Ishii, S.; Kihara, Y.; Shimizu, T. Identification of T Cell Death-Associated Gene 8 (TDAG8) as a Novel Acid Sensing G-Protein-Coupled Receptor. J. Biol. Chem. 2005, 280, 9083–9087. [Google Scholar] [CrossRef] [PubMed]
- Allard, B.; Allard, D.; Buisseret, L.; Stagg, J. The Adenosine Pathway in Immuno-Oncology. Nat. Rev. Clin. Oncol. 2020, 17, 611–629. [Google Scholar] [CrossRef]
- Cole, S.W.; Sood, A.K. Molecular Pathways: Beta-Adrenergic Signaling in Cancer. Clin. Cancer Res. 2012, 18, 1201–1206. [Google Scholar] [CrossRef]
- Finetti, F.; Travelli, C.; Ercoli, J.; Colombo, G.; Buoso, E.; Trabalzini, L. Prostaglandin E2 and Cancer: Insight into Tumor Progression and Immunity. Biology 2020, 9, 434. [Google Scholar] [CrossRef]
- Klatt, W.; Wallner, S.; Brochhausen, C.; Stolwijk, J.A.; Schreml, S. Expression Profiles of Proton-Sensing G-Protein Coupled Receptors in Common Skin Tumors. Sci. Rep. 2020, 10, 15327. [Google Scholar] [CrossRef] [PubMed]
- Rains, S.L.; Amaya, C.N.; Bryan, B.A. Beta-Adrenergic Receptors Are Expressed across Diverse Cancers. Oncoscience 2017, 4, 95–105. [Google Scholar] [CrossRef] [PubMed]
- Wei, J.; Zhang, J.; Wang, D.; Cen, B.; Lang, J.D.; DuBois, R.N. The COX-2–PGE2 Pathway Promotes Tumor Evasion in Colorectal Adenomas. Cancer Prev. Res. 2022, 15, 285–296. [Google Scholar] [CrossRef] [PubMed]
- Sweed, D.; Taha, M.; Abd Elhamed, S.; El Dein Mohamed, A. The Prognostic Role of CD73/A2AR Expression and Tumor Immune Response in Periampullary Carcinoma Subtypes. Asian Pac. J. Cancer Prev. 2022, 23, 1239–1246. [Google Scholar] [CrossRef] [PubMed]
- Gao, Y.; Kitagawa, K.; Hiramatsu, Y.; Kikuchi, H.; Isobe, T.; Shimada, M.; Uchida, C.; Hattori, T.; Oda, T.; Nakayama, K.; et al. Up-Regulation of GPR48 Induced by Down-Regulation of P27 Kip1 Enhances Carcinoma Cell Invasiveness and Metastasis. Cancer Res. 2006, 66, 11623–11631. [Google Scholar] [CrossRef] [PubMed]
- Veltman, J.D.; Lambers, M.E.; van Nimwegen, M.; Hendriks, R.W.; Hoogsteden, H.C.; Aerts, J.G.; Hegmans, J.P. COX-2 Inhibition Improves Immunotherapy and Is Associated with Decreased Numbers of Myeloid-Derived Suppressor Cells in Mesothelioma. Celecoxib Influences MDSC Function. BMC Cancer 2010, 10, 464. [Google Scholar] [CrossRef]
- Kellner, M.; von Neubeck, B.; Czogalla, B.; Feederle, R.; Vick, B.; Jeremias, I.; Zeidler, R. A Novel Anti-CD73 Antibody That Selectively Inhibits Membrane CD73 Shows Antitumor Activity and Induces Tumor Immune Escape. Biomedicines 2022, 10, 825. [Google Scholar] [CrossRef]
- Francica, B.J.; Holtz, A.; Lopez, J.; Freund, D.; Chen, A.; Wang, D.; Powell, D.; Kipper, F.; Panigrahy, D.; Dubois, R.N.; et al. Dual Blockade of EP2 and EP4 Signaling Is Required for Optimal Immune Activation and Antitumor Activity Against Prostaglandin-Expressing Tumors. Cancer Res. Commun. 2023, 3, 1486–1500. [Google Scholar] [CrossRef] [PubMed]
- Johann, K.; Bohn, T.; Shahneh, F.; Luther, N.; Birke, A.; Jaurich, H.; Helm, M.; Klein, M.; Raker, V.K.; Bopp, T.; et al. Therapeutic Melanoma Inhibition by Local Micelle-Mediated Cyclic Nucleotide Repression. Nat. Commun. 2021, 12, 5981. [Google Scholar] [CrossRef]
- Chelakkot, V.S.; Thomas, K.; Romigh, T.; Fong, A.; Li, L.; Ronen, S.; Chen, S.; Funchain, P.; Ni, Y.; Arbesman, J. MC1R Signaling through the CAMP-CREB/ATF-1 and ERK-NFκB Pathways Accelerates G1/S Transition Promoting Breast Cancer Progression. NPJ Precis. Oncol. 2023, 7, 85. [Google Scholar] [CrossRef]
- Pon, C.K.; Lane, J.R.; Sloan, E.K.; Halls, M.L. The β 2-adrenoceptor Activates a Positive CAMP-calcium Feedforward Loop to Drive Breast Cancer Cell Invasion. FASEB J. 2016, 30, 1144–1154. [Google Scholar] [CrossRef]
- Fujishita, T.; Kojima, Y.; Kajino-Sakamoto, R.; Mishiro-Sato, E.; Shimizu, Y.; Hosoda, W.; Yamaguchi, R.; Taketo, M.M.; Aoki, M. The CAMP/PKA/CREB and TGFβ/SMAD4 Pathways Regulate Stemness and Metastatic Potential in Colorectal Cancer Cells. Cancer Res. 2022, 82, 4179–4190. [Google Scholar] [CrossRef] [PubMed]
- Vetter, I.R.; Linnemann, T.; Wohlgemuth, S.; Geyer, M.; Kalbitzer, H.R.; Herrmann, C.; Wittinghofer, A. Structural and Biochemical Analysis of Ras-effector Signaling via RalGDS. FEBS Lett. 1999, 451, 175–180. [Google Scholar] [CrossRef] [PubMed]
- Wei, C.; Khan, M.A.; Du, J.; Cheng, J.; Tania, M.; Leung, E.L.-H.; Fu, J. Cordycepin Inhibits Triple-Negative Breast Cancer Cell Migration and Invasion by Regulating EMT-TFs SLUG, TWIST1, SNAIL1, and ZEB1. Front. Oncol. 2022, 12, 898583. [Google Scholar] [CrossRef]
- Wilson, M.M.; Weinberg, R.A.; Lees, J.A.; Guen, V.J. Emerging Mechanisms by Which EMT Programs Control Stemness. Trends Cancer 2020, 6, 775–780. [Google Scholar] [CrossRef]
- Pradella, D.; Naro, C.; Sette, C.; Ghigna, C. EMT and Stemness: Flexible Processes Tuned by Alternative Splicing in Development and Cancer Progression. Mol. Cancer 2017, 16, 8. [Google Scholar] [CrossRef]
- Wellner, U.; Schubert, J.; Burk, U.C.; Schmalhofer, O.; Zhu, F.; Sonntag, A.; Waldvogel, B.; Vannier, C.; Darling, D.; Hausen, A.Z.; et al. The EMT-Activator ZEB1 Promotes Tumorigenicity by Repressing Stemness-Inhibiting MicroRNAs. Nat. Cell Biol. 2009, 11, 1487–1495. [Google Scholar] [CrossRef] [PubMed]
- Razmi, M.; Ghods, R.; Vafaei, S.; Sahlolbei, M.; Saeednejad Zanjani, L.; Madjd, Z. Clinical and Prognostic Significances of Cancer Stem Cell Markers in Gastric Cancer Patients: A Systematic Review and Meta-Analysis. Cancer Cell Int. 2021, 21, 139. [Google Scholar] [CrossRef]
- Sousa, L.P.; Carmo, A.F.; Rezende, B.M.; Lopes, F.; Silva, D.M.; Alessandri, A.L.; Bonjardim, C.A.; Rossi, A.G.; Teixeira, M.M.; Pinho, V. Cyclic AMP Enhances Resolution of Allergic Pleurisy by Promoting Inflammatory Cell Apoptosis via Inhibition of PI3K/Akt and NF-ΚB. Biochem. Pharmacol. 2009, 78, 396–405. [Google Scholar] [CrossRef]
- Takahashi, N.; Tetsuka, T.; Uranishi, H.; Okamoto, T. Inhibition of the NF-κB Transcriptional Activity by Protein Kinase A. Eur. J. Biochem. 2002, 269, 4559–4565. [Google Scholar] [CrossRef]
- Haskó, G.; Pacher, P. Regulation of Macrophage Function by Adenosine. Arterioscler. Thromb. Vasc. Biol. 2012, 32, 865–869. [Google Scholar] [CrossRef] [PubMed]
- Xia, Y.; Wei, Y.; Li, Z.-Y.; Cai, X.-Y.; Zhang, L.-L.; Dong, X.-R.; Zhang, S.; Zhang, R.-G.; Meng, R.; Zhu, F.; et al. Catecholamines Contribute to the Neovascularization of Lung Cancer via Tumor-Associated Macrophages. Brain Behav. Immun. 2019, 81, 111–121. [Google Scholar] [CrossRef] [PubMed]
- Wu, V.H.; Yung, B.S.; Faraji, F.; Saddawi-Konefka, R.; Wang, Z.; Wenzel, A.T.; Song, M.J.; Pagadala, M.S.; Clubb, L.M.; Chiou, J.; et al. The GPCR–Gαs–PKA Signaling Axis Promotes T Cell Dysfunction and Cancer Immunotherapy Failure. Nat. Immunol. 2023, 24, 1318–1330. [Google Scholar] [CrossRef] [PubMed]
- Tavares, L.P.; Negreiros-Lima, G.L.; Lima, K.M.; E Silva, P.M.R.; Pinho, V.; Teixeira, M.M.; Sousa, L.P. Blame the Signaling: Role of CAMP for the Resolution of Inflammation. Pharmacol. Res. 2020, 159, 105030. [Google Scholar] [CrossRef] [PubMed]
- Yu, T.; Yang, G.; Hou, Y.; Tang, X.; Wu, C.; Wu, X.; Guo, L.; Zhu, Q.; Luo, H.; Du, Y.; et al. Cytoplasmic GPER Translocation in Cancer-Associated Fibroblasts Mediates CAMP/PKA/CREB/Glycolytic Axis to Confer Tumor Cells with Multidrug Resistance. Oncogene 2017, 36, 2131–2145. [Google Scholar] [CrossRef] [PubMed]
- Becker, W.R.; Nevins, S.A.; Chen, D.C.; Chiu, R.; Horning, A.M.; Guha, T.K.; Laquindanum, R.; Mills, M.; Chaib, H.; Ladabaum, U.; et al. Single-Cell Analyses Define a Continuum of Cell State and Composition Changes in the Malignant Transformation of Polyps to Colorectal Cancer. Nat. Genet. 2022, 54, 985–995. [Google Scholar] [CrossRef] [PubMed]
- Guo, Z.; Zhang, H.; Fu, Y.; Kuang, J.; Zhao, B.; Zhang, L.; Lin, J.; Lin, S.; Wu, D.; Xie, G. Cancer-Associated Fibroblasts Induce Growth and Radioresistance of Breast Cancer Cells through Paracrine IL-6. Cell Death Discov. 2023, 9, 6. [Google Scholar] [CrossRef] [PubMed]
- Deng, L.; Zhang, X.; Xiang, X.; Xiong, R.; Xiao, D.; Chen, Z.; Liu, K.; Feng, G. NANOG Promotes Cell Proliferation, Invasion, and Stemness via IL-6/STAT3 Signaling in Esophageal Squamous Carcinoma. Technol. Cancer Res. Treat. 2021, 20, 153303382110384. [Google Scholar] [CrossRef] [PubMed]
- Oh, K.; Lee, O.-Y.; Park, Y.; Seo, M.W.; Lee, D.-S. IL-1β Induces IL-6 Production and Increases Invasiveness and Estrogen-Independent Growth in a TG2-Dependent Manner in Human Breast Cancer Cells. BMC Cancer 2016, 16, 724. [Google Scholar] [CrossRef]
- Wu, X.; Tao, P.; Zhou, Q.; Li, J.; Yu, Z.; Wang, X.; Li, J.; Li, C.; Yan, M.; Zhu, Z.; et al. IL-6 Secreted by Cancer-Associated Fibroblasts Promotes Epithelial-Mesenchymal Transition and Metastasis of Gastric Cancer via JAK2/STAT3 Signaling Pathway. Oncotarget 2017, 8, 20741–20750. [Google Scholar] [CrossRef]
- Rogers, S.; Zhang, C.; Anagnostidis, V.; Liddle, C.; Fishel, M.L.; Gielen, F.; Scholpp, S. Cancer-Associated Fibroblasts Influence Wnt/PCP Signaling in Gastric Cancer Cells by Cytoneme-Based Dissemination of ROR2. Proc. Natl. Acad. Sci. USA 2023, 120, e2217612120. [Google Scholar] [CrossRef] [PubMed]
- Hulsurkar, M.; Li, Z.; Zhang, Y.; Li, X.; Zheng, D.; Li, W. Beta-Adrenergic Signaling Promotes Tumor Angiogenesis and Prostate Cancer Progression through HDAC2-Mediated Suppression of Thrombospondin-1. Oncogene 2017, 36, 1525–1536. [Google Scholar] [CrossRef] [PubMed]
- Radhi, M.; Ashraf, S.; Lawrence, S.; Tranholm, A.A.; Wellham, P.A.D.; Hafeez, A.; Khamis, A.S.; Thomas, R.; McWilliams, D.; de Moor, C.H. A Systematic Review of the Biological Effects of Cordycepin. Molecules 2021, 26, 5886. [Google Scholar] [CrossRef] [PubMed]
- Lee, J.B.; Radhi, M.; Cipolla, E.; Gandhi, R.D.; Sarmad, S.; Zgair, A.; Kim, T.H.; Feng, W.; Qin, C.; Adrower, C.; et al. A Novel Nucleoside Rescue Metabolic Pathway May Be Responsible for Therapeutic Effect of Orally Administered Cordycepin. Sci. Rep. 2019, 9, 15760. [Google Scholar] [CrossRef] [PubMed]
- Klenow, H. Formation of the Mono, Di, and Triphosphate of Cordycepin in Ehrlich Ascites-Tumor Cells In Vitro. Biochim. Biophys. Acta (BBA) Spec. Sect. Nucleic Acids Relat. Subj. 1963, 76, 347–353. [Google Scholar] [CrossRef]
- Hawley, S.A.; Ross, F.A.; Russell, F.M.; Atrih, A.; Lamont, D.J.; Hardie, D.G. Mechanism of Activation of AMPK by Cordycepin. Cell Chem. Biol. 2020, 27, 214–222.e4. [Google Scholar] [CrossRef] [PubMed]
- Kredich, N.M. Inhibition of Nucleic Acid Methylation by Cordycepin. In Vivo Synthesis of S-3’-DEOXYADENOSYLMETHIONINE BY WI-L2 Human Lymphoblasts. J. Biol. Chem. 1980, 255, 7380–7385. [Google Scholar] [CrossRef]
- Wataya, Y.; Hiraoka, O. 3′-Deoxyinosine as an Anti-Leishmanial Agent: The Metabolism and Cytotoxic Effects of 3′-Deoxyinosine in Leishmaniatropica Promastigotes. Biochem. Biophys. Res. Commun. 1984, 123, 677–683. [Google Scholar] [CrossRef]
- Wataya, Y.; Hiraoka, O.; Sonobe, Y.; Yoshioka, A.; Matsuda, A.; Miyasaka, T.; Saneyoshi, M.; Ueda, T. Anti-Parasite Activity of Nucleoside Analogues in Leishmania Tropica Promastigotes. Nucleic Acids Symp. Ser. 1984, 15, 69–71. [Google Scholar]
- Daina, A.; Michielin, O.; Zoete, V. SwissADME: A Free Web Tool to Evaluate Pharmacokinetics, Drug-Likeness and Medicinal Chemistry Friendliness of Small Molecules. Sci. Rep. 2017, 7, 42717. [Google Scholar] [CrossRef]
- Daina, A.; Michielin, O.; Zoete, V. SwissTargetPrediction: Updated Data and New Features for Efficient Prediction of Protein Targets of Small Molecules. Nucleic Acids Res. 2019, 47, W357–W364. [Google Scholar] [CrossRef] [PubMed]
- Mortier, J.; Rakers, C.; Bermudez, M.; Murgueitio, M.S.; Riniker, S.; Wolber, G. The Impact of Molecular Dynamics on Drug Design: Applications for the Characterization of Ligand–Macromolecule Complexes. Drug Discov. Today 2015, 20, 686–702. [Google Scholar] [CrossRef] [PubMed]
- De Vivo, M.; Masetti, M.; Bottegoni, G.; Cavalli, A. Role of Molecular Dynamics and Related Methods in Drug Discovery. J. Med. Chem. 2016, 59, 4035–4061. [Google Scholar] [CrossRef] [PubMed]
- Pandi, S.; Kulanthaivel, L.; Subbaraj, G.K.; Rajaram, S.; Subramanian, S. Screening of Potential Breast Cancer Inhibitors through Molecular Docking and Molecular Dynamics Simulation. Biomed. Res. Int. 2022, 2022, 3338549. [Google Scholar] [CrossRef] [PubMed]
- Kim, S. Exploring Chemical Information in PubChem. Curr. Protoc. 2021, 1, e217. [Google Scholar] [CrossRef] [PubMed]
- Chen, V.B.; Arendall, W.B.; Headd, J.J.; Keedy, D.A.; Immormino, R.M.; Kapral, G.J.; Murray, L.W.; Richardson, J.S.; Richardson, D.C. MolProbity: All-Atom Structure Validation for Macromolecular Crystallography. Acta Crystallogr. D Biol. Crystallogr. 2010, 66, 12–21. [Google Scholar] [CrossRef] [PubMed]
- Sobolev, O.V.; Afonine, P.V.; Moriarty, N.W.; Hekkelman, M.L.; Joosten, R.P.; Perrakis, A.; Adams, P.D. A Global Ramachandran Score Identifies Protein Structures with Unlikely Stereochemistry. Structure 2020, 28, 1249–1258.e2. [Google Scholar] [CrossRef] [PubMed]
- Haslam, R.J.; Davidson, M.M.L.; Desjardins, J. V Inhibition of Adenylate Cyclase by Adenosine Analogues in Preparations of Broken and Intact Human Platelets. Evidence for the Unidirectional Control of Platelet Function by Cyclic AMP. Biochem. J. 1978, 176, 83–95. [Google Scholar] [CrossRef] [PubMed]
- Montreau, N.; Vaur, S.; Dautry, F.; Andéol, Y. Injection of Exogenous RNA in Amphibian Oocytes Leads to RNA Level Fluctuations Which Are Sensitive to Cordycepin, an RNA Chain Elongation Terminator. C. R. Biol. 2003, 326, 1135–1147. [Google Scholar] [CrossRef]
- Desrosiers, R.C.; Rottman, F.M.; Boezi, J.A.; Towle, H.C. The Sensitivity of RNA Polymerases I and II from Novikoff Hepatoma (N1S1) Cells to 3’-Deoxyadenosine 5’-Triphosphate. Nucleic Acids Res. 1976, 3, 325–342. [Google Scholar] [CrossRef]
- Bard, J.; Zhelkovsky, A.M.; Helmling, S.; Earnest, T.N.; Moore, C.L.; Bohm, A. Structure of Yeast Poly(A) Polymerase Alone and in Complex with 3’-DATP. Science 2000, 289, 1346–1349. [Google Scholar] [CrossRef] [PubMed]
- ROSE, K.M.; BELL, L.E.; JACOB, S.T. Specific Inhibition of Chromatin-Associated Poly(A) Synthesis in Vitro by Cordycepin 5′-Triphosphate. Nature 1977, 267, 178–180. [Google Scholar] [CrossRef] [PubMed]
- Lingner, J.; Keller, W. 3′-End Labeling of RNA with Recombinant Yeast Poly(A) Polymerase. Nucleic Acids Res. 1993, 21, 2917–2920. [Google Scholar] [CrossRef] [PubMed]
- Levenson, R.; Kernen, J.; Housman, D. Synchronization of MEL Cell Commitment with Cordycepin. Cell 1979, 18, 1073–1078. [Google Scholar] [CrossRef] [PubMed]
- Izuta, S.; Kohsaka-Ichikawa, M.; Yamaguchi, T.; Saneyosh, M. 3’-Deoxyribonucleotides Inhibit Eukaryotic DNA Primase. J. Biochem. 1996, 119, 1038–1044. [Google Scholar] [CrossRef] [PubMed]
- Di Rienzo, L.; Milanetti, E.; Alba, J.; D’Abramo, M. Quantitative Characterization of Binding Pockets and Binding Complementarity by Means of Zernike Descriptors. J. Chem. Inf. Model. 2020, 60, 1390–1398. [Google Scholar] [CrossRef] [PubMed]
- Espinosa-Rodriguez, B.A.; Treviño-Almaguer, D.; Carranza-Rosales, P.; Ramirez-Cabrera, M.A.; Ramirez-Estrada, K.; Arredondo-Espinoza, E.U.; Mendez-Lopez, L.F.; Balderas-Renteria, I. Metformin May Alter the Metabolic Reprogramming in Cancer Cells by Disrupting the L-Arginine Metabolism: A Preliminary Computational Study. Int. J. Mol. Sci. 2023, 24, 5316. [Google Scholar] [CrossRef] [PubMed]
- Wang, Z.; Wang, X.; Qu, K.; Zhu, P.; Guo, N.; Zhang, R.; Abliz, Z.; Yu, H.; Zhu, H. Research Article: Binding of Cordycepin Monophosphate to AMP-Activated Protein Kinase and Its Effect on AMP-Activated Protein Kinase Activation. Chem. Biol. Drug Des. 2010, 76, 340–344. [Google Scholar] [CrossRef]
- Niramitranon, J.; Pongprayoon, P. Exploring the Binding Modes of Cordycepin to Human Adenosine Deaminase 1 (ADA1) Compared to Adenosine and 2’-Deoxyadenosine. J. Mol. Model. 2020, 26, 29. [Google Scholar] [CrossRef]
- Pearce, E.L.; Poffenberger, M.C.; Chang, C.-H.; Jones, R.G. Fueling Immunity: Insights into Metabolism and Lymphocyte Function. Science 2013, 342, 1242454. [Google Scholar] [CrossRef]
- Ito, K.; Suda, T. Metabolic Requirements for the Maintenance of Self-Renewing Stem Cells. Nat. Rev. Mol. Cell Biol. 2014, 15, 243–256. [Google Scholar] [CrossRef] [PubMed]
- DeBerardinis, R.J.; Chandel, N.S. Fundamentals of Cancer Metabolism. Sci. Adv. 2016, 2, e1600200. [Google Scholar] [CrossRef]
- Kang, C.; Liu, L.; Wu, C.; Li, L.; Jia, X.; Xie, W.; Chen, S.; Wu, X.; Zheng, H.; Liu, J.; et al. The Adenosinergic Machinery in Cancer: In-Tandem Insights from Basic Mechanisms to Therapy. Front. Immunol. 2023, 14, 1111369. [Google Scholar] [CrossRef]
- Khan, M.A.; Tania, M. Cordycepin and Kinase Inhibition in Cancer. Drug Discov. Today 2023, 28, 103481. [Google Scholar] [CrossRef]
- Zhang, J.-L.; Xu, Y.; Shen, J. Cordycepin Inhibits Lipopolysaccharide (LPS)-Induced Tumor Necrosis Factor (TNF)-α Production via Activating AMP-Activated Protein Kinase (AMPK) Signaling. Int. J. Mol. Sci. 2014, 15, 12119–12134. [Google Scholar] [CrossRef]
- Vasiukov, G.; Novitskaya, T.; Zijlstra, A.; Owens, P.; Ye, F.; Zhao, Z.; Moses, H.L.; Blackwell, T.; Feoktistov, I.; Novitskiy, S.V. Myeloid Cell–Derived TGFβ Signaling Regulates ECM Deposition in Mammary Carcinoma via Adenosine-Dependent Mechanisms. Cancer Res. 2020, 80, 2628–2638. [Google Scholar] [CrossRef]
- Vasiukov, G.; Menshikh, A.; Owens, P.; Novitskaya, T.; Hurley, P.; Blackwell, T.; Feoktistov, I.; Novitskiy, S.V. Adenosine/TGFβ Axis in Regulation of Mammary Fibroblast Functions. PLoS ONE 2021, 16, e0252424. [Google Scholar] [CrossRef] [PubMed]
- Welihinda, A.A.; Kaur, M.; Greene, K.; Zhai, Y.; Amento, E.P. The Adenosine Metabolite Inosine Is a Functional Agonist of the Adenosine A2A Receptor with a Unique Signaling Bias. Cell Signal. 2016, 28, 552–560. [Google Scholar] [CrossRef] [PubMed]
- Haskó, G.; Kuhel, D.G.; Németh, Z.H.; Mabley, J.G.; Stachlewitz, R.F.; Virág, L.; Lohinai, Z.; Southan, G.J.; Salzman, A.L.; Szabó, C. Inosine Inhibits Inflammatory Cytokine Production by a Posttranscriptional Mechanism and Protects Against Endotoxin-Induced Shock. J. Immunol. 2000, 164, 1013–1019. [Google Scholar] [CrossRef]
- Deng, Q.; Li, X.; Fang, C.; Li, X.; Zhang, J.; Xi, Q.; Li, Y.; Zhang, R. Cordycepin Enhances Anti-Tumor Immunity in Colon Cancer by Inhibiting Phagocytosis Immune Checkpoint CD47 Expression. Int. Immunopharmacol. 2022, 107, 108695. [Google Scholar] [CrossRef]
- Chaicharoenaudomrung, N.; Kunhorm, P.; Noisa, P. Cordycepin Enhances the Cytotoxicity of Human Natural Killer Cells against Cancerous Cells. Biol. Pharm. Bull. 2023, 46, b23-00221. [Google Scholar] [CrossRef] [PubMed]
- Feng, C.; Chen, R.; Fang, W.; Gao, X.; Ying, H.; Zheng, X.; Chen, L.; Jiang, J. Synergistic Effect of CD47 Blockade in Combination with Cordycepin Treatment against Cancer. Front. Pharmacol. 2023, 14, 1144330. [Google Scholar] [CrossRef] [PubMed]
- Chen, R.; Feng, C.; Chen, L.; Zheng, X.; Fang, W.; Wu, S.; Gao, X.; Chen, C.; Yang, J.; Wu, Y.; et al. Single-Cell RNA Sequencing Indicates Cordycepin Remodels the Tumor Immune Microenvironment to Enhance TIGIT Blockade’s Anti-Tumor Effect in Colon Cancer. Int. Immunopharmacol. 2024, 126, 111268. [Google Scholar] [CrossRef] [PubMed]
- Bi, J. CD226: A Potent Driver of Antitumor Immunity That Needs to Be Maintained. Cell. Mol. Immunol. 2021, 19, 969–970. [Google Scholar] [CrossRef]
- Chen, L.; Zheng, X.; Huang, H.; Feng, C.; Wu, S.; Chen, R.; Jiang, H.; Yuan, M.; Fu, Y.; Ying, H.; et al. Cordycepin Synergizes with CTLA-4 Blockade to Remodel the Tumor Microenvironment for Enhanced Cancer Immunotherapy. Int. Immunopharmacol. 2023, 124, 110786. [Google Scholar] [CrossRef] [PubMed]
- Chen, X.; Liao, B.; Ren, T.; Liao, Z.; Huang, Z.; Lin, Y.; Zhong, S.; Li, J.; Wen, S.; Li, Y.; et al. Adjuvant Activity of Cordycepin, a Natural Derivative of Adenosine from Cordyceps Militaris, on an Inactivated Rabies Vaccine in an Animal Model. Heliyon 2024, 10, e24612. [Google Scholar] [CrossRef] [PubMed]
- Normanno, N.; Campiglio, M.; Maiello, M.R.; De Luca, A.; Mancino, M.; Gallo, M.; D’Alessio, A.; Menard, S. Breast Cancer Cells with Acquired Resistance to the EGFR Tyrosine Kinase Inhibitor Gefitinib Show Persistent Activation of MAPK Signaling. Breast Cancer Res. Treat. 2008, 112, 25–33. [Google Scholar] [CrossRef] [PubMed]
- Wang, Z.; Wu, X.; Liang, Y.-N.; Wang, L.; Song, Z.-X.; Liu, J.-L.; Tang, Z.-S. Cordycepin Induces Apoptosis and Inhibits Proliferation of Human Lung Cancer Cell Line H1975 via Inhibiting the Phosphorylation of EGFR. Molecules 2016, 21, 1267. [Google Scholar] [CrossRef] [PubMed]
- Hsu, P.-Y.; Lin, Y.-H.; Yeh, E.-L.; Lo, H.-C.; Hsu, T.-H.; Su, C.-C. Cordycepin and a Preparation from Cordyceps Militaris Inhibit Malignant Transformation and Proliferation by Decreasing EGFR and IL-17RA Signaling in a Murine Oral Cancer Model. Oncotarget 2017, 8, 93712–93728. [Google Scholar] [CrossRef]
- Bos, J.L. All in the Family? New Insights and Questions Regarding Interconnectivity of Ras, Rap1 and Ral. EMBO J. 1998, 17, 6776–6782. [Google Scholar] [CrossRef]
- Ohtsuka, T.; Shimizu, K.; Yamamori, B.; Kuroda, S.; Takai, Y. Activation of Brain B-Raf Protein Kinase by Rap1B Small GTP-Binding Protein. J. Biol. Chem. 1996, 271, 1258–1261. [Google Scholar] [CrossRef] [PubMed]
- Rangarajan, S.; Enserink, J.M.; Kuiperij, H.B.; de Rooij, J.; Price, L.S.; Schwede, F.; Bos, J.L. Cyclic AMP Induces Integrin-Mediated Cell Adhesion through Epac and Rap1 upon Stimulation of the Β2-Adrenergic Receptor. J. Cell Biol. 2003, 160, 487–493. [Google Scholar] [CrossRef] [PubMed]
- Gao, L.; Feng, Y.; Bowers, R.; Becker-Hapak, M.; Gardner, J.; Council, L.; Linette, G.; Zhao, H.; Cornelius, L.A. Ras-Associated Protein-1 Regulates Extracellular Signal-Regulated Kinase Activation and Migration in Melanoma Cells: Two Processes Important to Melanoma Tumorigenesis and Metastasis. Cancer Res. 2006, 66, 7880–7888. [Google Scholar] [CrossRef] [PubMed]
- Bailey, C.L.; Kelly, P.; Casey, P.J. Activation of Rap1 Promotes Prostate Cancer Metastasis. Cancer Res. 2009, 69, 4962–4968. [Google Scholar] [CrossRef] [PubMed]
- McSherry, E.A.; Brennan, K.; Hudson, L.; Hill, A.D.; Hopkins, A.M. Breast Cancer Cell Migration Is Regulated through Junctional Adhesion Molecule-A-Mediated Activation of Rap1 GTPase. Breast Cancer Res. 2011, 13, R31. [Google Scholar] [CrossRef] [PubMed]
- Yang, Y.; Zhang, J.; Yan, Y.; Cai, H.; Li, M.; Sun, K.; Wang, J.; Liu, X.; Wang, J.; Duan, X. Low Expression of Rap1GAP Is Associated with Epithelial-Mesenchymal Transition (EMT) and Poor Prognosis in Gastric Cancer. Oncotarget 2017, 8, 8057–8068. [Google Scholar] [CrossRef] [PubMed]
- Che, Y.-L.; Luo, S.-J.; Li, G.; Cheng, M.; Gao, Y.-M.; Li, X.-M.; Dai, J.-M.; He, H.; Wang, J.; Peng, H.-J.; et al. The C3G/Rap1 Pathway Promotes Secretion of MMP-2 and MMP-9 and Is Involved in Serous Ovarian Cancer Metastasis. Cancer Lett. 2015, 359, 241–249. [Google Scholar] [CrossRef] [PubMed]
- Gao, W.; Ye, G.; Liu, L.; Wei, L. The Downregulation of Rap1 GTPase-Activating Protein Is Associated with a Poor Prognosis in Colorectal Cancer and May Impact on Tumor Progression. Oncol. Lett. 2018, 15, 7661–7668. [Google Scholar] [CrossRef] [PubMed]
- Shah, S.; Brock, E.J.; Jackson, R.M.; Ji, K.; Boerner, J.L.; Sloane, B.F.; Mattingly, R.R. Downregulation of Rap1Gap: A Switch from DCIS to Invasive Breast Carcinoma via ERK/MAPK Activation. Neoplasia 2018, 20, 951–963. [Google Scholar] [CrossRef] [PubMed]
- Jiang, Y.; Zhan, H. Communication between EMT and PD-L1 Signaling: New Insights into Tumor Immune Evasion. Cancer Lett. 2020, 468, 72–81. [Google Scholar] [CrossRef]
- Kumar, S.; Davra, V.; Obr, A.E.; Geng, K.; Wood, T.L.; De Lorenzo, M.S.; Birge, R.B. Crk Adaptor Protein Promotes PD-L1 Expression, EMT and Immune Evasion in a Murine Model of Triple-Negative Breast Cancer. Oncoimmunology 2018, 7, e1376155. [Google Scholar] [CrossRef]
- Liang, S.-M.; Lu, Y.-J.; Ko, B.-S.; Jan, Y.-J.; Shyue, S.-K.; Yet, S.-F.; Liou, J.-Y. Cordycepin Disrupts Leukemia Association with Mesenchymal Stromal Cells and Eliminates Leukemia Stem Cell Activity. Sci. Rep. 2017, 7, 43930. [Google Scholar] [CrossRef] [PubMed]
- Wang, C.-W.; Lee, B.-H.; Tai, C.-J. The Inhibition of Cordycepin on Cancer Stemness in TGF-Beta Induced Chemo-Resistant Ovarian Cancer Cell. Oncotarget 2017, 8, 111912–111921. [Google Scholar] [CrossRef]
- Zhang, P.; Huang, C.; Fu, C.; Tian, Y.; Hu, Y.; Wang, B.; Strasner, A.; Song, Y.; Song, E. Cordycepin (3′-Deoxyadenosine) Suppressed HMGA2, Twist1 and ZEB1-Dependent Melanoma Invasion and Metastasis by Targeting MiR-33b. Oncotarget 2015, 6, 9834–9853. [Google Scholar] [CrossRef]
- Noh, E.M.; Jung, S.H.; Han, J.H.; Chung, E.Y.; Jung, J.Y.; Kim, B.S.; Lee, S.H.; Lee, Y.R.; Kim, J.S. Cordycepin Inhibits TPA-Induced Matrix Metalloproteinase-9 Expression by Suppressing the MAPK/AP-1 Pathway in MCF-7 Human Breast Cancer Cells. Int. J. Mol. Med. 2009, 25, 255–260. [Google Scholar] [CrossRef]
- Lee, E.; Kim, W.; Moon, S. Cordycepin Suppresses TNF-alpha-induced Invasion, Migration and Matrix Metalloproteinase-9 Expression in Human Bladder Cancer Cells. Phytother. Res. 2010, 24, 1755–1761. [Google Scholar] [CrossRef]
- Wu, S.; Fang, W.; Chen, L.; Feng, C.; Chen, R.; Ying, H.; Zheng, X.; Jiang, J. Cordycepin Remodels the Tumor Microenvironment of Colorectal Cancer by Down-Regulating the Expression of PD-L1. J. Cancer Res. Clin. Oncol. 2023, 149, 17567–17579. [Google Scholar] [CrossRef]
- Wang, X.; Luo, C.; Cheng, X.; Lu, M. Lithium and an EPAC-Specific Inhibitor ESI-09 Synergistically Suppress Pancreatic Cancer Cell Proliferation and Survival. Acta Biochim. Biophys. Sin. 2017, 49, 573–580. [Google Scholar] [CrossRef] [PubMed]
- Korlepara, D.B.; Vasavi, C.S.; Jeurkar, S.; Pal, P.K.; Roy, S.; Mehta, S.; Sharma, S.; Kumar, V.; Muvva, C.; Sridharan, B.; et al. PLAS-5k: Dataset of Protein-Ligand Affinities from Molecular Dynamics for Machine Learning Applications. Sci. Data 2022, 9, 548. [Google Scholar] [CrossRef]
- Dicitore, A.; Grassi, E.S.; Caraglia, M.; Borghi, M.O.; Gaudenzi, G.; Hofland, L.J.; Persani, L.; Vitale, G. The CAMP Analogs Have Potent Anti-Proliferative Effects on Medullary Thyroid Cancer Cell Lines. Endocrine 2016, 51, 101–112. [Google Scholar] [CrossRef]
- Salzillo, A.; Ragone, A.; Spina, A.; Naviglio, S.; Sapio, L. Forskolin Affects Proliferation, Migration and Paclitaxel-Mediated Cytotoxicity in Non-Small-Cell Lung Cancer Cell Lines via Adenylyl Cyclase/CAMP Axis. Eur. J. Cell Biol. 2023, 102, 151292. [Google Scholar] [CrossRef] [PubMed]
- Hanwell, M.D.; Curtis, D.E.; Lonie, D.C.; Vandermeersch, T.; Zurek, E.; Hutchison, G.R. Avogadro: An Advanced Semantic Chemical Editor, Visualization, and Analysis Platform. J. Cheminform. 2012, 4, 17. [Google Scholar] [CrossRef] [PubMed]
- Bolton, E.E.; Chen, J.; Kim, S.; Han, L.; He, S.; Shi, W.; Simonyan, V.; Sun, Y.; Thiessen, P.A.; Wang, J.; et al. PubChem3D: A New Resource for Scientists. J. Cheminform. 2011, 3, 32. [Google Scholar] [CrossRef] [PubMed]
- Wickham, H.; Hester, J.; Bryan, J. readr: Read Rectangular Text Data. Available online: https://cran.r-project.org/package=readr (accessed on 23 January 2024).
- Kassambara, A. ggcorrplot: Visualization of a Correlation Matrix Using ggplot2. Available online: https://cran.r-project.org/package=ggcorrplot (accessed on 23 January 2024).
- Wickham, H. Ggplot2; Springer International Publishing: Cham, Switzerland, 2016; ISBN 978-3-319-24275-0. [Google Scholar]
- Kassambara, A.; Mundt, F. factoextra: Extract and Visualize the Results of Multivariate Data Analyses. Available online: https://cran.r-project.org/package=factoextra (accessed on 23 January 2024).
- Wickham, H.; Averick, M.; Bryan, J.; Chang, W.; McGowan, L.; François, R.; Grolemund, G.; Hayes, A.; Henry, L.; Hester, J.; et al. Welcome to the Tidyverse. J. Open Source Softw. 2019, 4, 1686. [Google Scholar] [CrossRef]
- Allaire, J.J. RStudio: Integrated Development Environment for R. Available online: https://www.r-project.org/conferences/useR-2011/abstracts/180111-allairejj.pdf (accessed on 23 January 2024).
- R Core Team. R: A Language and Environment for Statistical Computing; MSOR Connections; R Core Team: Vienna, Austria, 2014; Volume 1. [Google Scholar]
- Berman, H.M. The Protein Data Bank. Nucleic Acids Res. 2000, 28, 235–242. [Google Scholar] [CrossRef] [PubMed]
- Pettersen, E.F.; Goddard, T.D.; Huang, C.C.; Couch, G.S.; Greenblatt, D.M.; Meng, E.C.; Ferrin, T.E. UCSF Chimera—A Visualization System for Exploratory Research and Analysis. J. Comput. Chem. 2004, 25, 1605–1612. [Google Scholar] [CrossRef] [PubMed]
- Morris, G.M.; Huey, R.; Lindstrom, W.; Sanner, M.F.; Belew, R.K.; Goodsell, D.S.; Olson, A.J. AutoDock4 and AutoDockTools4: Automated Docking with Selective Receptor Flexibility. J. Comput. Chem. 2009, 30, 2785–2791. [Google Scholar] [CrossRef] [PubMed]
- Volkamer, A.; Kuhn, D.; Grombacher, T.; Rippmann, F.; Rarey, M. Combining Global and Local Measures for Structure-Based Druggability Predictions. J. Chem. Inf. Model. 2012, 52, 360–372. [Google Scholar] [CrossRef]
- UniProt Consortium. UniProt: A Hub for Protein Information. Nucleic Acids Res. 2015, 43, D204–D212. [Google Scholar] [CrossRef]
- Pettersen, E.F.; Goddard, T.D.; Huang, C.C.; Meng, E.C.; Couch, G.S.; Croll, T.I.; Morris, J.H.; Ferrin, T.E. UCSF ChimeraX: Structure Visualization for Researchers, Educators, and Developers. Protein Sci. 2021, 30, 70–82. [Google Scholar] [CrossRef]
- Baek, M.; DiMaio, F.; Anishchenko, I.; Dauparas, J.; Ovchinnikov, S.; Lee, G.R.; Wang, J.; Cong, Q.; Kinch, L.N.; Schaeffer, R.D.; et al. Accurate Prediction of Protein Structures and Interactions Using a Three-Track Neural Network. Science 2021, 373, 871–876. [Google Scholar] [CrossRef] [PubMed]
- Kim, D.E.; Chivian, D.; Baker, D. Protein Structure Prediction and Analysis Using the Robetta Server. Nucleic Acids Res. 2004, 32, W526–W531. [Google Scholar] [CrossRef]
- Schrödinger Release 2020-4; Maestro, Schrödinger, LLC: New York, NY, USA, 2020.
- Qi, C.; Sorrentino, S.; Medalia, O.; Korkhov, V.M. The Structure of a Membrane Adenylyl Cyclase Bound to an Activated Stimulatory G Protein. Science 2019, 364, 389–394. [Google Scholar] [CrossRef] [PubMed]
- Chretien, A.; Nagel, M.F.; Botha, S.; de Wijn, R.; Brings, L.; Dörner, K.; Han, H.; Koliyadu, J.C.P.; Letrun, R.; Round, A.; et al. Light-Induced Trpin/Metout Switching During BLUF Domain Activation in ATP-Bound Photoactivatable Adenylate Cyclase OaPAC. J. Mol. Biol. 2024, 436, 168439. [Google Scholar] [CrossRef] [PubMed]
- Bowers, K.J.; Chow, E.; Xu, H.; Dror, R.O.; Eastwood, M.P.; Gregersen, B.A.; Klepeis, J.L.; Kolossváry, I.; Moraes, M.A.; Sacerdoti, F.D.; et al. Scalable Algorithms for Molecular Dynamics Simulations on Commodity Clusters. In Proceedings of the ACM/IEEE SC 2006 Conference (SC’06), Tampa, FL, USA, 11–17 November 2006; p. 43. [Google Scholar]
- Nosé, S. A Unified Formulation of the Constant Temperature Molecular Dynamics Methods. J. Chem. Phys. 1984, 81, 511–519. [Google Scholar] [CrossRef]
- Martyna, G.J.; Tobias, D.J.; Klein, M.L. Constant Pressure Molecular Dynamics Algorithms. J. Chem. Phys. 1994, 101, 4177–4189. [Google Scholar] [CrossRef]
- Almahariq, M.; Tsalkova, T.; Mei, F.C.; Chen, H.; Zhou, J.; Sastry, S.K.; Schwede, F.; Cheng, X. A Novel EPAC-Specific Inhibitor Suppresses Pancreatic Cancer Cell Migration and Invasion. Mol. Pharmacol. 2013, 83, 122–128. [Google Scholar] [CrossRef] [PubMed]
- Giuffrida, L.; Sek, K.; Henderson, M.A.; Lai, J.; Chen, A.X.Y.; Meyran, D.; Todd, K.L.; Petley, E.V.; Mardiana, S.; Mølck, C.; et al. CRISPR/Cas9 Mediated Deletion of the Adenosine A2A Receptor Enhances CAR T Cell Efficacy. Nat. Commun. 2021, 12, 3236. [Google Scholar] [CrossRef] [PubMed]
- Qureshi, U.; Khan, M.I.; Ashraf, S.; Hameed, A.; Hafizur, R.M.; Rafique, R.; Khan, K.M.; Ul-Haq, Z. Identification of Novel Epac2 Antagonists through in Silico and in Vitro Analyses. Eur. J. Pharm. Sci. 2020, 153, 105492. [Google Scholar] [CrossRef]
- Chung, J.H.; Choi, H.J.; Kang, Y.J.; Kim, Y.S.; Lee, S.-Y.; Kwon, R.J.; Jeong, H.-S.; Park, S.-J.; Jeong, Y.; Kang, D.; et al. MHY4571, a Novel Diarylcyclohexanone Derivative, Exerts Anti-Cancer Activity by Regulating the PKA-CAMP-Response Element-Binding Protein Pathway in Squamous Cell Lung Cancer. Exp. Hematol. Oncol. 2022, 11, 68. [Google Scholar] [CrossRef]
- Galski, H.; Sivan, H.; Lazarovici, P.; Nagler, A. In Vitro and in Vivo Reversal of MDR1-Mediated Multidrug Resistance by KT-5720: Implications on Hematological Malignancies. Leuk Res. 2006, 30, 1151–1158. [Google Scholar] [CrossRef] [PubMed]
- Na, Y.R.; Kwon, J.W.; Kim, D.Y.; Chung, H.; Song, J.; Jung, D.; Quan, H.; Kim, D.; Kim, J.-S.; Ju, Y.W.; et al. Protein Kinase A Catalytic Subunit Is a Molecular Switch That Promotes the Pro-Tumoral Function of Macrophages. Cell Rep. 2020, 31, 107643. [Google Scholar] [CrossRef] [PubMed]
- Luo, W.; Xu, C.; Ayello, J.; Dela Cruz, F.; Rosenblum, J.M.; Lessnick, S.L.; Cairo, M.S. Protein Phosphatase 1 Regulatory Subunit 1A in Ewing Sarcoma Tumorigenesis and Metastasis. Oncogene 2018, 37, 798–809. [Google Scholar] [CrossRef] [PubMed]
- Xia, Y.; Zhan, C.; Feng, M.; Leblanc, M.; Ke, E.; Yeddula, N.; Verma, I.M. Targeting CREB Pathway Suppresses Small Cell Lung Cancer. Mol. Cancer Res. 2018, 16, 825–832. [Google Scholar] [CrossRef] [PubMed]
- Jakobsen, E.; Lange, S.C.; Andersen, J.V.; Desler, C.; Kihl, H.F.; Hohnholt, M.C.; Stridh, M.H.; Rasmussen, L.J.; Waagepetersen, H.S.; Bak, L.K. The Inhibitors of Soluble Adenylate Cyclase 2-OHE, KH7, and Bithionol Compromise Mitochondrial ATP Production by Distinct Mechanisms. Biochem. Pharmacol. 2018, 155, 92–101. [Google Scholar] [CrossRef] [PubMed]
- Coles, G.L.; Cristea, S.; Webber, J.T.; Levin, R.S.; Moss, S.M.; He, A.; Sangodkar, J.; Hwang, Y.C.; Arand, J.; Drainas, A.P.; et al. Unbiased Proteomic Profiling Uncovers a Targetable GNAS/PKA/PP2A Axis in Small Cell Lung Cancer Stem Cells. Cancer Cell 2020, 38, 129–143.e7. [Google Scholar] [CrossRef]
- He, B.; Gao, R.; Lv, S.; Chen, A.; Huang, J.; Wang, L.; Feng, Y.; Feng, J.; Liu, B.; Lei, J.; et al. Cancer Cell Employs a Microenvironmental Neural Signal Trans-Activating Nucleus-Mitochondria Coordination to Acquire Stemness. Signal Transduct Target Ther. 2023, 8, 275. [Google Scholar] [CrossRef] [PubMed]
- Kim, T.-H.; Gill, N.K.; Nyberg, K.D.; Nguyen, A.V.; Hohlbauch, S.V.; Geisse, N.A.; Nowell, C.J.; Sloan, E.K.; Rowat, A.C. Cancer Cells Become Less Deformable and More Invasive with Activation of β-Adrenergic Signaling. J. Cell Sci. 2016, 129, 4563–4575. [Google Scholar] [CrossRef] [PubMed]
- Daniele, S.; Zappelli, E.; Natali, L.; Martini, C.; Trincavelli, M.L. Modulation of A1 and A2B Adenosine Receptor Activity: A New Strategy to Sensitise Glioblastoma Stem Cells to Chemotherapy. Cell Death Dis. 2014, 5, e1539. [Google Scholar] [CrossRef]
- Liu, G.; Yang, S.; Liu, Y.; Xu, Y.; Qiu, H.; Sun, J.; Song, J.; Shi, L. The Adenosine-A2a Receptor Regulates the Radioresistance of Gastric Cancer via PI3K-AKT-MTOR Pathway. Int. J. Clin. Oncol. 2022, 27, 911–920. [Google Scholar] [CrossRef]
- Misra, U.K.; Pizzo, S.V. Epac1-induced Cellular Proliferation in Prostate Cancer Cells Is Mediated by B-Raf/ERK and MTOR Signaling Cascades. J. Cell. Biochem. 2009, 108, 998–1011. [Google Scholar] [CrossRef] [PubMed]
- Menon, J.; Doebele, R.C.; Gomes, S.; Bevilacqua, E.; Reindl, K.M.; Rosner, M.R. A Novel Interplay between Rap1 and PKA Regulates Induction of Angiogenesis in Prostate Cancer. PLoS ONE 2012, 7, e49893. [Google Scholar] [CrossRef] [PubMed]
- Misra, U.K.; Pizzo, S.V. Evidence for a Pro-Proliferative Feedback Loop in Prostate Cancer: The Role of Epac1 and COX-2-Dependent Pathways. PLoS ONE 2013, 8, e63150. [Google Scholar] [CrossRef] [PubMed]
- Faam, B.; Ghadiri, A.A.; Ghaffari, M.A.; Totonchi, M.; Amouzegar, A.; Azizi, F.; Shahbazian, H.; Hashemitabar, M.; Fanaei, S.A.; Khorsandi, L. CpG Island Methylation of the Rap1Gap Gene in Medullary Thyroid Cancer. Arch. Iran Med. 2022, 25, 171–177. [Google Scholar] [CrossRef] [PubMed]
- Dehghanian, M.; Yarahmadi, G.; Sandoghsaz, R.; Khodadadian, A.; Shamsi, F.; Vahidi Mehrjardi, M. Evaluation of Rap1GAP and EPAC1 Gene Expression in Endometriosis Disease. Adv. Biomed. Res. 2023, 12, 101. [Google Scholar] [CrossRef] [PubMed]
- Zheng, H.; Gao, L.; Feng, Y.; Yuan, L.; Zhao, H.; Cornelius, L.A. Down-Regulation of Rap1GAP via Promoter Hypermethylation Promotes Melanoma Cell Proliferation, Survival, and Migration. Cancer Res. 2009, 69, 449–457. [Google Scholar] [CrossRef] [PubMed]
- Tamate, M.; Tanaka, R.; Osogami, H.; Matsuura, M.; Satohisa, S.; Iwasaki, M.; Saito, T. Rap1GAP Inhibits Tumor Progression in Endometrial Cancer. Biochem. Biophys. Res. Commun. 2017, 485, 476–483. [Google Scholar] [CrossRef]
- Zhang, Z.; Mitra, R.S.; Henson, B.S.; Datta, N.S.; McCauley, L.K.; Kumar, P.; Lee, J.S.-J.; Carey, T.E.; D’Silva, N.J. Rap1GAP Inhibits Tumor Growth in Oropharyngeal Squamous Cell Carcinoma. Am. J. Pathol. 2006, 168, 585–596. [Google Scholar] [CrossRef]


| Adenosine Derivatives | Reported Cordycepin Derivatives |
|---|---|
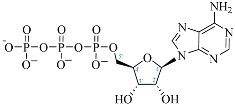 ATP | 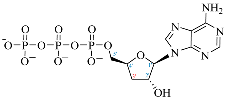 COR-TP |
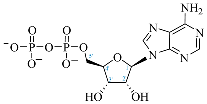 ADP | 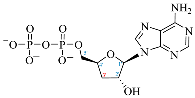 COR-DP |
 AMP | 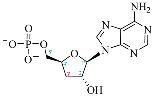 COR-MP |
 ADO | 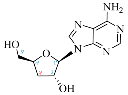 COR |
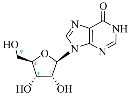 INO | 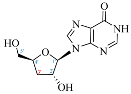 3′-dINO |
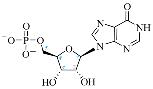 IMP |  3′-dIMP |
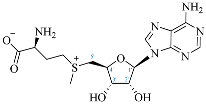 SAM | 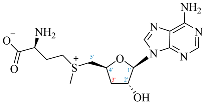 3′-dSAM |
| COR-TP | COR-DP | COR-MP | ||||||||||
|---|---|---|---|---|---|---|---|---|---|---|---|---|
| TC | ST | CT | ComT | TC | ST | CT | ComT | TC | ST | CT | ComT | |
| ATP | 99 | 86 | 43 | 129 | 98 | 86 | 47 | 133 | 97 | 77 | 55 | 132 |
| ADP | 98 | 82 | 44 | 126 | 99 | 77 | 55 | 132 | 97 | 88 | 56 | 144 |
| AMP | 97 | 72 | 44 | 116 | 97 | 82 | 47 | 129 | 99 | 91 | 65 | 156 |
| ADO | 93 | 62 | 38 | 100 | 93 | 75 | 51 | 126 | 95 | 87 | 52 | 139 |
| INO | 73 | 59 | 14 | 73 | 73 | 69 | 23 | 92 | 74 | 87 | 29 | 116 |
| COR | 3′-dINO | ADO | ||||||||||
| TC | ST | CT | ComT | TC | ST | CT | ComT | TC | ST | CT | ComT | |
| ATP | 92 | 66 | 45 | 111 | 73 | 60 | 19 | 79 | 93 | 67 | 56 | 123 |
| ADP | 93 | 75 | 50 | 125 | 73 | 75 | 29 | 104 | 94 | 73 | 60 | 133 |
| AMP | 94 | 85 | 58 | 143 | 74 | 82 | 25 | 107 | 95 | 88 | 67 | 155 |
| ADO | 98 | 98 | 85 | 183 | 77 | 98 | 52 | 150 | 100 | 100 | 100 | 200 |
| INO | 77 | 98 | 52 | 150 | 99 | 94 | 63 | 157 | 78 | 89 | 34 | 123 |
| System | Adenylate Cyclase Type 05 (tmAC) | Adenylate Cyclase Type 10 (sAC) |
|---|---|---|
| Model | 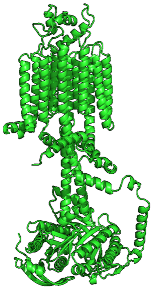 | 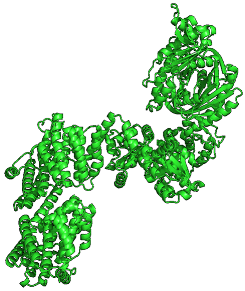 |
| Favored Rotamers | 99.24% | 99.45% |
| Ramachandran Plot | 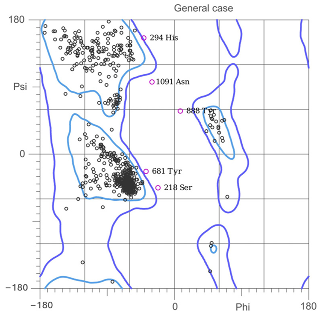 | 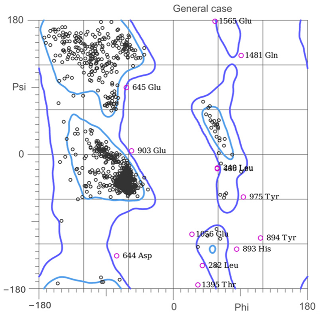 |
| Ramachandran not allowed | 0.75% | 1.06% |
| Ramachandran, favored | 96.23% | 96.39% |
| Z-score | 0.95 ± 0.25 | 0.14 ± 0.20 |
| Protein | Ligand | Clusters | Histogram Frequency | C1 Timeframe (ns) |
|---|---|---|---|---|
| ADCY5 | COR-TP | 21 | 21, 16, 14, 14, 12, 12, 11, 10, 10, 10, 9, 9, 8, 8, 7, 6, 6, 5, 5, 4, 3 | 92.5 |
| ATP | 22 | 15, 14, 14, 13, 13, 12, 12, 11, 11, 11, 9, 9, 9, 9, 8, 6, 6, 5, 4, 3, 3, 3 | 84.0 | |
| ADCY10 | COR-TP | 21 | 18, 14, 12, 12, 11, 11, 11, 10, 10, 10, 10, 10, 9, 8, 8, 8, 7, 7, 6, 4, 4 | 72.0 |
| ATP | 21 | 19, 19, 18, 16, 12, 12, 11, 11, 9, 9, 8, 8, 7, 7, 7, 7, 6, 4, 4, 4, 2 | 52.0 |
| Ligand | COR-TP | ATP | |
|---|---|---|---|
| Protein | |||
| ADCY05 | −51.92 | −44.39 | |
| ADCY10 | −20.38 | −19.41 | |
Disclaimer/Publisher’s Note: The statements, opinions and data contained in all publications are solely those of the individual author(s) and contributor(s) and not of MDPI and/or the editor(s). MDPI and/or the editor(s) disclaim responsibility for any injury to people or property resulting from any ideas, methods, instructions or products referred to in the content. |
© 2024 by the authors. Licensee MDPI, Basel, Switzerland. This article is an open access article distributed under the terms and conditions of the Creative Commons Attribution (CC BY) license (https://creativecommons.org/licenses/by/4.0/).
Share and Cite
Gonzalez-Llerena, J.L.; Espinosa-Rodriguez, B.A.; Treviño-Almaguer, D.; Mendez-Lopez, L.F.; Carranza-Rosales, P.; Gonzalez-Barranco, P.; Guzman-Delgado, N.E.; Romo-Mancillas, A.; Balderas-Renteria, I. Cordycepin Triphosphate as a Potential Modulator of Cellular Plasticity in Cancer via cAMP-Dependent Pathways: An In Silico Approach. Int. J. Mol. Sci. 2024, 25, 5692. https://doi.org/10.3390/ijms25115692
Gonzalez-Llerena JL, Espinosa-Rodriguez BA, Treviño-Almaguer D, Mendez-Lopez LF, Carranza-Rosales P, Gonzalez-Barranco P, Guzman-Delgado NE, Romo-Mancillas A, Balderas-Renteria I. Cordycepin Triphosphate as a Potential Modulator of Cellular Plasticity in Cancer via cAMP-Dependent Pathways: An In Silico Approach. International Journal of Molecular Sciences. 2024; 25(11):5692. https://doi.org/10.3390/ijms25115692
Chicago/Turabian StyleGonzalez-Llerena, Jose Luis, Bryan Alejandro Espinosa-Rodriguez, Daniela Treviño-Almaguer, Luis Fernando Mendez-Lopez, Pilar Carranza-Rosales, Patricia Gonzalez-Barranco, Nancy Elena Guzman-Delgado, Antonio Romo-Mancillas, and Isaias Balderas-Renteria. 2024. "Cordycepin Triphosphate as a Potential Modulator of Cellular Plasticity in Cancer via cAMP-Dependent Pathways: An In Silico Approach" International Journal of Molecular Sciences 25, no. 11: 5692. https://doi.org/10.3390/ijms25115692
APA StyleGonzalez-Llerena, J. L., Espinosa-Rodriguez, B. A., Treviño-Almaguer, D., Mendez-Lopez, L. F., Carranza-Rosales, P., Gonzalez-Barranco, P., Guzman-Delgado, N. E., Romo-Mancillas, A., & Balderas-Renteria, I. (2024). Cordycepin Triphosphate as a Potential Modulator of Cellular Plasticity in Cancer via cAMP-Dependent Pathways: An In Silico Approach. International Journal of Molecular Sciences, 25(11), 5692. https://doi.org/10.3390/ijms25115692