
An Atlas of Promoter Chromatin Modifications and HiChIP Regulatory Interactions in Human Subcutaneous Adipose-Derived Stem Cells

 , , , and
Abstract
:1. Introduction
2. Results
2.1. Transcriptomic Signatures of ABD and GF-Adipose-Derived Stem Cells
2.2. Selective Epigenetic Hallmarks of Depot-Selective Transcription
2.3. Alteration of Active and Repressive Epigenetic Marks Associated with Depot-Selective Gene Expression
2.4. HiChIP Regulatory Interactions in ABD and GF-ADSCs
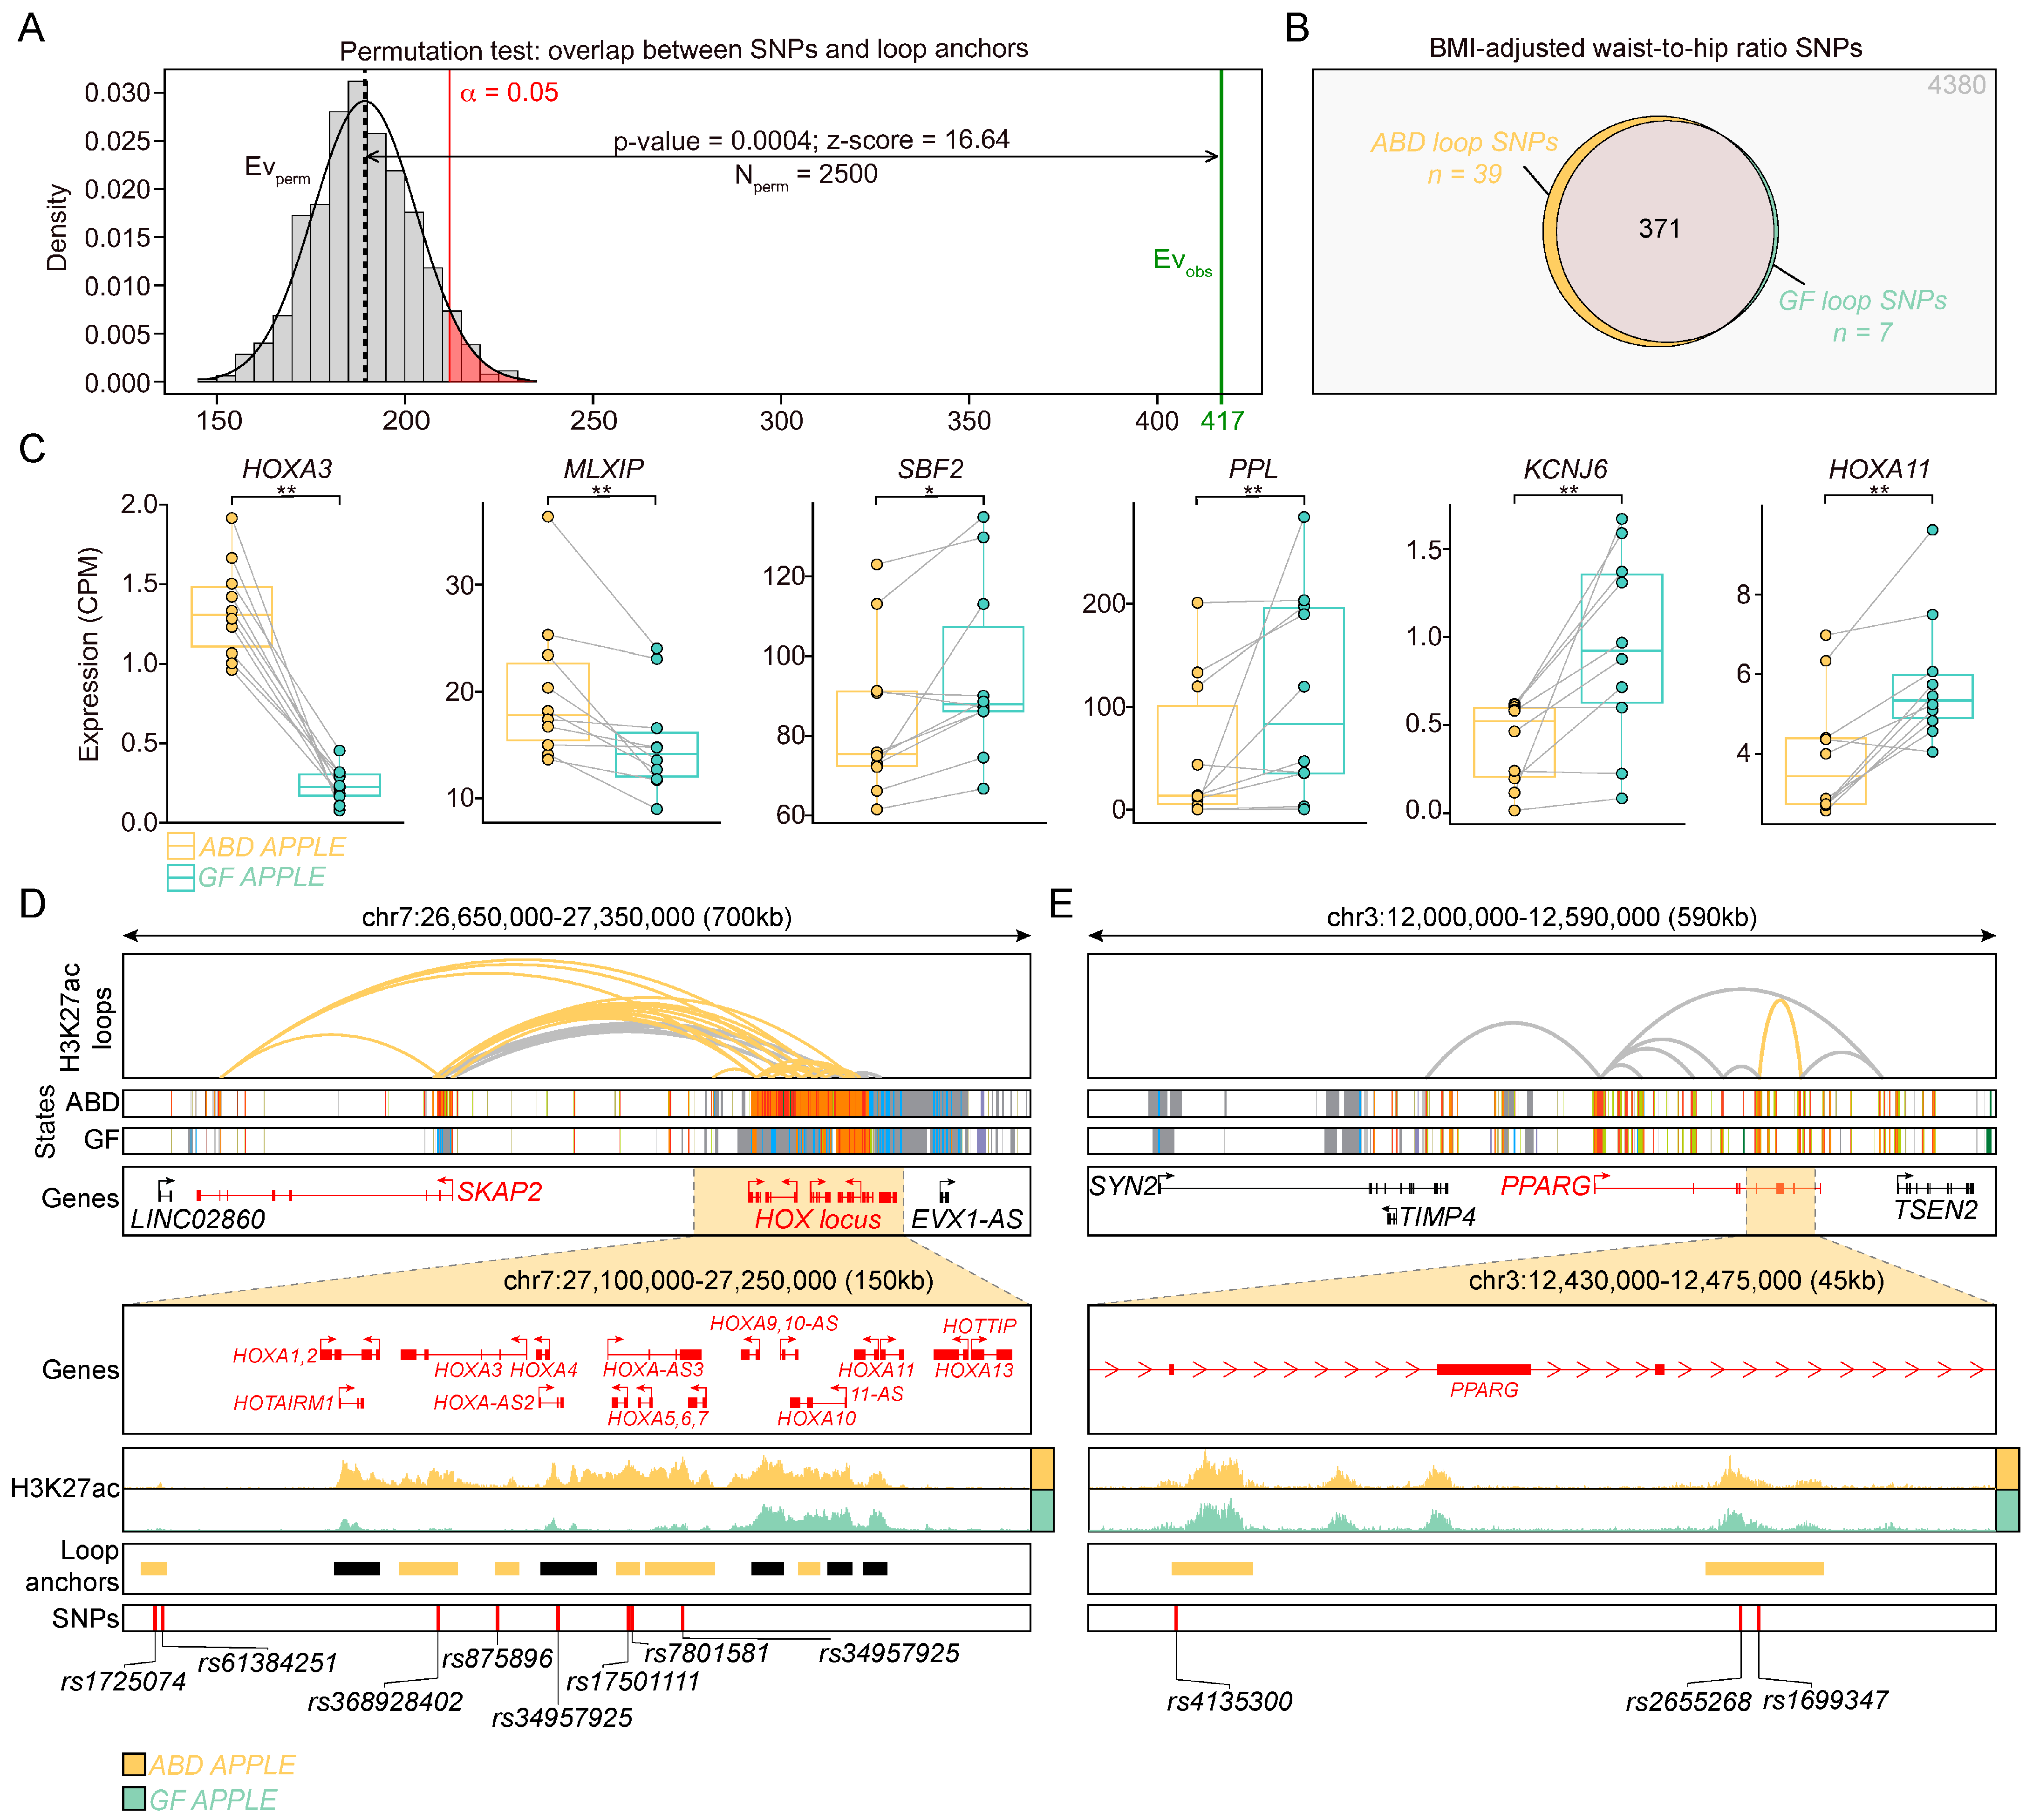
2.5. Loop Anchors Harbor DEGs and SNPs That Are Associated with Waist–Hip Ratio in Humans
3. Discussion
4. Materials and Methods
4.1. Participants, Tissue Collection, and Isolation of Human Adipose-Derived Stem Cells
4.2. Chromatin Immunoprecipitations
4.3. Assay for Transposase-Accessible Chromatin (ATAC)
4.4. HiChIP Assay
4.5. HiChIP Data Processing
4.6. Sequencing Library Preparation
4.7. RNA Sequencing and Analysis
4.8. ChIP-seq and ATAC-seq Analysis
4.9. Gene Set Enrichment and Visualization
4.10. Chromatin State Discovery with ChromHMM
Supplementary Materials
Author Contributions
Funding
Institutional Review Board Statement
Informed Consent Statement
Data Availability Statement
Acknowledgments
Conflicts of Interest
References
- Canoy, D.; Boekholdt, S.M.; Wareham, N.; Luben, R.; Welch, A.; Bingham, S.; Buchan, I.; Day, N.; Khaw, K.T. Body fat distribution and risk of coronary heart disease in men and women in the European Prospective Investigation Into Cancer and Nutrition in Norfolk cohort: A population-based prospective study. Circulation 2007, 116, 2933–2943. [Google Scholar] [CrossRef] [PubMed]
- Santosa, S.; Jensen, M.D. Why are we shaped differently, and why does it matter? Am. J. Physiol. Endocrinol. Metab. 2008, 295, E531–E535. [Google Scholar] [CrossRef]
- Karpe, F.; Pinnick, K.E. Biology of upper-body and lower-body adipose tissue—Link to whole-body phenotypes. Nat. Rev. Endocrinol. 2015, 11, 90–100. [Google Scholar] [CrossRef] [PubMed]
- Rask-Andersen, M.; Karlsson, T.; Ek, W.E.; Johansson, Å. Genome-wide association study of body fat distribution identifies adiposity loci and sex-specific genetic effects. Nat. Commun. 2019, 10, 339. [Google Scholar] [CrossRef] [PubMed]
- Jia, Q.; Morgan-Bathke, M.E.; Jensen, M.D. Adipose tissue macrophage burden, systemic inflammation, and insulin resistance. Am. J. Physiol. Endocrinol. Metab. 2020, 319, E254–E264. [Google Scholar] [CrossRef] [PubMed]
- Patel, P.; Abate, N. Body fat distribution and insulin resistance. Nutrients 2013, 5, 2019–2027. [Google Scholar] [CrossRef] [PubMed]
- Karastergiou, K.; Bredella, M.A.; Lee, M.J.; Smith, S.R.; Fried, S.K.; Miller, K.K. Growth hormone receptor expression in human gluteal versus abdominal subcutaneous adipose tissue: Association with body shape. Obesity 2016, 24, 1090–1096. [Google Scholar] [CrossRef] [PubMed]
- Lee, M.J.; Pramyothin, P.; Karastergiou, K.; Fried, S.K. Deconstructing the roles of glucocorticoids in adipose tissue biology and the development of central obesity. Biochim. Biophys. Acta 2014, 1842, 473–481. [Google Scholar] [CrossRef]
- Newell-Fugate, A.E. The role of sex steroids in white adipose tissue adipocyte function. Reproduction 2017, 153, R133–R149. [Google Scholar] [CrossRef]
- Kuo, F.C.; Neville, M.J.; Sabaratnam, R.; Wesolowska-Andersen, A.; Phillips, D.; Wittemans, L.B.L.; van Dam, A.D.; Loh, N.Y.; Todorčević, M.; Denton, N.; et al. HOTAIR interacts with PRC2 complex regulating the regional preadipocyte transcriptome and human fat distribution. Cell Rep. 2022, 40, 111136. [Google Scholar] [CrossRef]
- Denton, N.; Pinnick, K.E.; Karpe, F. Cartilage oligomeric matrix protein is differentially expressed in human subcutaneous adipose tissue and regulates adipogenesis. Mol. Metab. 2018, 16, 172–179. [Google Scholar] [CrossRef] [PubMed]
- Loh, N.Y.; Minchin, J.E.N.; Pinnick, K.E.; Verma, M.; Todorčević, M.; Denton, N.; Moustafa, J.E.; Kemp, J.P.; Gregson, C.L.; Evans, D.M.; et al. RSPO3 impacts body fat distribution and regulates adipose cell biology in vitro. Nat. Commun. 2020, 11, 2797. [Google Scholar] [CrossRef] [PubMed]
- Pinnick, K.E.; Nicholson, G.; Manolopoulos, K.N.; McQuaid, S.E.; Valet, P.; Frayn, K.N.; Denton, N.; Min, J.L.; Zondervan, K.T.; Fleckner, J.; et al. Distinct developmental profile of lower-body adipose tissue defines resistance against obesity-associated metabolic complications. Diabetes 2014, 63, 3785–3797. [Google Scholar] [CrossRef] [PubMed]
- Divoux, A.; Eroshkin, A.; Erdos, E.; Sandor, K.; Osborne, T.F.; Smith, S.R. DNA Methylation as a Marker of Body Shape in Premenopausal Women. Front. Genet. 2021, 12, 709342. [Google Scholar] [CrossRef] [PubMed]
- Divoux, A.; Sandor, K.; Bojcsuk, D.; Talukder, A.; Li, X.; Balint, B.L.; Osborne, T.F.; Smith, S.R. Differential open chromatin profile and transcriptomic signature define depot-specific human subcutaneous preadipocytes: Primary outcomes. Clin. Epigenetics 2018, 10, 148. [Google Scholar] [CrossRef] [PubMed]
- Bonev, B.; Cavalli, G. Organization and function of the 3D genome. Nat. Rev. Genet. 2016, 17, 661–678. [Google Scholar] [CrossRef] [PubMed]
- Su, J.H.; Zheng, P.; Kinrot, S.S.; Bintu, B.; Zhuang, X. Genome-Scale Imaging of the 3D Organization and Transcriptional Activity of Chromatin. Cell 2020, 182, 1641–1659.e26. [Google Scholar] [CrossRef]
- Belton, J.M.; McCord, R.P.; Gibcus, J.H.; Naumova, N.; Zhan, Y.; Dekker, J. Hi-C: A comprehensive technique to capture the conformation of genomes. Methods 2012, 58, 268–276. [Google Scholar] [CrossRef]
- Eagen, K.P. Principles of Chromosome Architecture Revealed by Hi-C. Trends Biochem. Sci. 2018, 43, 469–478. [Google Scholar] [CrossRef]
- Lafontaine, D.L.; Yang, L.; Dekker, J.; Gibcus, J.H. Hi-C 3.0: Improved Protocol for Genome-Wide Chromosome Conformation Capture. Curr. Protoc. 2021, 1, e198. [Google Scholar] [CrossRef]
- Mumbach, M.R.; Rubin, A.J.; Flynn, R.A.; Dai, C.; Khavari, P.A.; Greenleaf, W.J.; Chang, H.Y. HiChIP: Efficient and sensitive analysis of protein-directed genome architecture. Nat. Methods 2016, 13, 919–922. [Google Scholar] [CrossRef]
- Cordero, A.D.; Callihan, E.C.; Said, R.; Alowais, Y.; Paffhausen, E.S.; Bracht, J.R. Epigenetic Regulation of Neuregulin-1 Tunes White Adipose Stem Cell Differentiation. Cells 2020, 9, 1148. [Google Scholar] [CrossRef]
- Bagchi, D.P.; MacDougald, O.A. Wnt Signaling: From Mesenchymal Cell Fate to Lipogenesis and Other Mature Adipocyte Functions. Diabetes 2021, 70, 1419–1430. [Google Scholar] [CrossRef] [PubMed]
- Yang Loureiro, Z.; Joyce, S.; DeSouza, T.; Solivan-Rivera, J.; Desai, A.; Skritakis, P.; Yang, Q.; Ziegler, R.; Zhong, D.; Nguyen, T.T.; et al. Wnt signaling preserves progenitor cell multipotency during adipose tissue development. Nat. Metab. 2023, 5, 1014–1028. [Google Scholar] [CrossRef] [PubMed]
- Khan, T.; Muise, E.S.; Iyengar, P.; Wang, Z.V.; Chandalia, M.; Abate, N.; Zhang, B.B.; Bonaldo, P.; Chua, S.; Scherer, P.E. Metabolic dysregulation and adipose tissue fibrosis: Role of collagen VI. Mol. Cell. Biol. 2009, 29, 1575–1591. [Google Scholar] [CrossRef] [PubMed]
- Spencer, M.; Unal, R.; Zhu, B.; Rasouli, N.; McGehee, R.E., Jr.; Peterson, C.A.; Kern, P.A. Adipose tissue extracellular matrix and vascular abnormalities in obesity and insulin resistance. J. Clin. Endocrinol. Metab. 2011, 96, E1990–E1998. [Google Scholar] [CrossRef] [PubMed]
- Karastergiou, K.; Fried, S.K.; Xie, H.; Lee, M.J.; Divoux, A.; Rosencrantz, M.A.; Chang, R.J.; Smith, S.R. Distinct developmental signatures of human abdominal and gluteal subcutaneous adipose tissue depots. J. Clin. Endocrinol. Metab. 2013, 98, 362–371. [Google Scholar] [CrossRef] [PubMed]
- Dutta, A.B.; Lank, D.S.; Przanowska, R.K.; Przanowski, P.; Wang, L.; Nguyen, B.; Walavalkar, N.M.; Duarte, F.M.; Guertin, M.J. Kinetic networks identify TWIST2 as a key regulatory node in adipogenesis. Genome Res. 2023, 33, 314–331. [Google Scholar] [CrossRef]
- Fisk, H.L.; Childs, C.E.; Miles, E.A.; Ayres, R.; Noakes, P.S.; Paras-Chavez, C.; Antoun, E.; Lillycrop, K.A.; Calder, P.C. Dysregulation of Subcutaneous White Adipose Tissue Inflammatory Environment Modelling in Non-Insulin Resistant Obesity and Responses to Omega-3 Fatty Acids—A Double Blind, Randomised Clinical Trial. Front. Immunol. 2022, 13, 922654. [Google Scholar] [CrossRef]
- Frances, L.; Tavernier, G.; Viguerie, N. Adipose-Derived Lipid-Binding Proteins: The Good, the Bad and the Metabolic Diseases. Int. J. Mol. Sci. 2021, 22, 10460. [Google Scholar] [CrossRef]
- Perugini, J.; Bordoni, L.; Venema, W.; Acciarini, S.; Cinti, S.; Gabbianelli, R.; Giordano, A. Zic1 mRNA is transiently upregulated in subcutaneous fat of acutely cold-exposed mice. J. Cell. Physiol. 2019, 234, 2031–2036. [Google Scholar] [CrossRef] [PubMed]
- Gallini, R.; Lindblom, P.; Bondjers, C.; Betsholtz, C.; Andrae, J. PDGF-A and PDGF-B induces cardiac fibrosis in transgenic mice. Exp. Cell Res. 2016, 349, 282–290. [Google Scholar] [CrossRef] [PubMed]
- Ostendorf, T.; Boor, P.; van Roeyen, C.R.; Floege, J. Platelet-derived growth factors (PDGFs) in glomerular and tubulointerstitial fibrosis. Kidney Int. Suppl. 2014, 4, 65–69. [Google Scholar] [CrossRef] [PubMed]
- Chen, X.; Zhao, C.; Xu, Y.; Huang, K.; Wang, Y.; Wang, X.; Zhou, X.; Pang, W.; Yang, G.; Yu, T. Adipose-specific BMP and activin membrane-bound inhibitor (BAMBI) deletion promotes adipogenesis by accelerating ROS production. J. Biol. Chem. 2021, 296, 100037. [Google Scholar] [CrossRef] [PubMed]
- Araujo, N.; Sledziona, J.; Noothi, S.K.; Burikhanov, R.; Hebbar, N.; Ganguly, S.; Shrestha-Bhattarai, T.; Zhu, B.; Katz, W.S.; Zhang, Y.; et al. Tumor Suppressor Par-4 Regulates Complement Factor C3 and Obesity. Front. Oncol. 2022, 12, 860446. [Google Scholar] [CrossRef] [PubMed]
- Shi, X.; Shao, X.; Liu, B.; Lv, M.; Pandey, P.; Guo, C.; Zhang, R.; Zhang, Y. Genome-wide screening of functional long noncoding RNAs in the epicardial adipose tissues of atrial fibrillation. Biochim. Biophys. Acta Mol. Basis Dis. 2020, 1866, 165757. [Google Scholar] [CrossRef] [PubMed]
- Passaro, A.; Miselli, M.A.; Sanz, J.M.; Dalla Nora, E.; Morieri, M.L.; Colonna, R.; Pišot, R.; Zuliani, G. Gene expression regional differences in human subcutaneous adipose tissue. BMC Genom. 2017, 18, 202. [Google Scholar] [CrossRef]
- Guo, T.; Gupta, A.; Yu, J.; Granados, J.Z.; Gandhi, A.Y.; Evers, B.M.; Iyengar, P.; Infante, R.E. LIFR-α-dependent adipocyte signaling in obesity limits adipose expansion contributing to fatty liver disease. iScience 2021, 24, 102227. [Google Scholar] [CrossRef]
- Jo, D.; Son, Y.; Yoon, G.; Song, J.; Kim, O.Y. Role of Adiponectin and Brain Derived Neurotrophic Factor in Metabolic Regulation Involved in Adiposity and Body Fat Browning. J. Clin. Med. 2020, 10, 56. [Google Scholar] [CrossRef]
- Svensson, P.A.; Wahlstrand, B.; Olsson, M.; Froguel, P.; Falchi, M.; Bergman, R.N.; McTernan, P.G.; Hedner, T.; Carlsson, L.M.; Jacobson, P. CDKN2B expression and subcutaneous adipose tissue expandability: Possible influence of the 9p21 atherosclerosis locus. Biochem. Biophys. Res. Commun. 2014, 446, 1126–1131. [Google Scholar] [CrossRef]
- Zaragosi, L.E.; Wdziekonski, B.; Villageois, P.; Keophiphath, M.; Maumus, M.; Tchkonia, T.; Bourlier, V.; Mohsen-Kanson, T.; Ladoux, A.; Elabd, C.; et al. Activin a plays a critical role in proliferation and differentiation of human adipose progenitors. Diabetes 2010, 59, 2513–2521. [Google Scholar] [CrossRef] [PubMed]
- Anatskaya, O.V.; Runov, A.L.; Ponomartsev, S.V.; Vonsky, M.S.; Elmuratov, A.U.; Vinogradov, A.E. Long-Term Transcriptomic Changes and Cardiomyocyte Hyperpolyploidy after Lactose Intolerance in Neonatal Rats. Int. J. Mol. Sci. 2023, 24, 7063. [Google Scholar] [CrossRef]
- Ernst, J.; Kellis, M. Chromatin-state discovery and genome annotation with ChromHMM. Nat. Protoc. 2017, 12, 2478–2492. [Google Scholar] [CrossRef] [PubMed]
- Gozzi, G.; Chelbi, S.T.; Manni, P.; Alberti, L.; Fonda, S.; Saponaro, S.; Fabbiani, L.; Rivasi, F.; Benhattar, J.; Losi, L. Promoter methylation and downregulated expression of the TBX15 gene in ovarian carcinoma. Oncol. Lett. 2016, 12, 2811–2819. [Google Scholar] [CrossRef]
- Paço, A.; de Bessa Garcia, S.A.; Freitas, R. Methylation in HOX Clusters and Its Applications in Cancer Therapy. Cells 2020, 9, 1613. [Google Scholar] [CrossRef] [PubMed]
- Divoux, A.; Sandor, K.; Bojcsuk, D.; Yi, F.; Hopf, M.E.; Smith, J.S.; Balint, B.L.; Osborne, T.F.; Smith, S.R. Fat Distribution in Women Is Associated With Depot-Specific Transcriptomic Signatures and Chromatin Structure. J. Endocr. Soc. 2020, 4, bvaa042. [Google Scholar] [CrossRef] [PubMed]
- Pan, D.Z.; Miao, Z.; Comenho, C.; Rajkumar, S.; Koka, A.; Lee, S.H.T.; Alvarez, M.; Kaminska, D.; Ko, A.; Sinsheimer, J.S.; et al. Identification of TBX15 as an adipose master trans regulator of abdominal obesity genes. Genome Med. 2021, 13, 123. [Google Scholar] [CrossRef]
- Huang, L.O.; Rauch, A.; Mazzaferro, E.; Preuss, M.; Carobbio, S.; Bayrak, C.S.; Chami, N.; Wang, Z.; Schick, U.M.; Yang, N.; et al. Genome-wide discovery of genetic loci that uncouple excess adiposity from its comorbidities. Nat. Metab. 2021, 3, 228–243. [Google Scholar] [CrossRef]
- Ahn, B.; Wan, S.; Jaiswal, N.; Vega, R.B.; Ayer, D.E.; Titchenell, P.M.; Han, X.; Won, K.J.; Kelly, D.P. MondoA drives muscle lipid accumulation and insulin resistance. JCI Insight 2019, 5, e129119. [Google Scholar] [CrossRef]
- Ahn, B. The Function of MondoA and ChREBP Nutrient-Sensing Factors in Metabolic Disease. Int. J. Mol. Sci. 2023, 24, 8811. [Google Scholar] [CrossRef]
- Ke, H.; Luan, Y.; Wu, S.; Zhu, Y.; Tong, X. The Role of Mondo Family Transcription Factors in Nutrient-Sensing and Obesity. Front. Endocrinol. 2021, 12, 653972. [Google Scholar] [CrossRef] [PubMed]
- Bäckdahl, J.; Franzén, L.; Massier, L.; Li, Q.; Jalkanen, J.; Gao, H.; Andersson, A.; Bhalla, N.; Thorell, A.; Rydén, M.; et al. Spatial mapping reveals human adipocyte subpopulations with distinct sensitivities to insulin. Cell Metab. 2021, 33, 1869–1882.e6. [Google Scholar] [CrossRef] [PubMed]
- Tontonoz, P.; Spiegelman, B.M. Fat and beyond: The diverse biology of PPARgamma. Annu. Rev. Biochem. 2008, 77, 289–312. [Google Scholar] [CrossRef] [PubMed]
- Lin, N.Y.; Lin, T.Y.; Yang, W.H.; Wang, S.C.; Wang, K.T.; Su, Y.L.; Jiang, Y.W.; Chang, G.D.; Chang, C.J. Differential expression and functional analysis of the tristetraprolin family during early differentiation of 3T3-L1 preadipocytes. Int. J. Biol. Sci. 2012, 8, 761–777. [Google Scholar] [CrossRef] [PubMed]
- Tseng, K.Y.; Chen, Y.H.; Lin, S. Zinc finger protein ZFP36L1 promotes osteoblastic differentiation but represses adipogenic differentiation of mouse multipotent cells. Oncotarget 2017, 8, 20588–20601. [Google Scholar] [CrossRef] [PubMed]
- Bradfield, J.P.; Vogelezang, S.; Felix, J.F.; Chesi, A.; Helgeland, Ø.; Horikoshi, M.; Karhunen, V.; Lowry, E.; Cousminer, D.L.; Ahluwalia, T.S.; et al. A trans-ancestral meta-analysis of genome-wide association studies reveals loci associated with childhood obesity. Hum. Mol. Genet. 2019, 28, 3327–3338. [Google Scholar] [CrossRef] [PubMed]
- Zhang, P.; Wu, W.; Ma, C.; Du, C.; Huang, Y.; Xu, H.; Li, C.; Cheng, X.; Hao, R.; Xu, Y. RNA-Binding Proteins in the Regulation of Adipogenesis and Adipose Function. Cells 2022, 11, 2357. [Google Scholar] [CrossRef]
- Henikoff, S.; Shilatifard, A. Histone modification: Cause or cog? Trends Genet. TIG 2011, 27, 389–396. [Google Scholar] [CrossRef]
- Daniel, B.; Balint, B.L.; Nagy, Z.S.; Nagy, L. Mapping the genomic binding sites of the activated retinoid X receptor in murine bone marrow-derived macrophages using chromatin immunoprecipitation sequencing. Methods Mol. Biol. 2014, 1204, 15–24. [Google Scholar] [CrossRef]
- Langmead, B.; Salzberg, S.L. Fast gapped-read alignment with Bowtie 2. Nat. Methods 2012, 9, 357–359. [Google Scholar] [CrossRef]
- Servant, N.; Varoquaux, N.; Lajoie, B.R.; Viara, E.; Chen, C.J.; Vert, J.P.; Heard, E.; Dekker, J.; Barillot, E. HiC-Pro: An optimized and flexible pipeline for Hi-C data processing. Genome Biol. 2015, 16, 259. [Google Scholar] [CrossRef] [PubMed]
- van der Weide, R.H.; van den Brand, T.; Haarhuis, J.H.I.; Teunissen, H.; Rowland, B.D.; de Wit, E. Hi-C analyses with GENOVA: A case study with cohesin variants. NAR Genom. Bioinform. 2021, 3, lqab040. [Google Scholar] [CrossRef] [PubMed]
- Cao, Y.; Liu, S.; Ren, G.; Tang, Q.; Zhao, K. cLoops2: A full-stack comprehensive analytical tool for chromatin interactions. Nucleic Acids Res. 2022, 50, 57–71. [Google Scholar] [CrossRef] [PubMed]
- Lareau, C.A.; Aryee, M.J. hichipper: A preprocessing pipeline for calling DNA loops from HiChIP data. Nat. Methods 2018, 15, 155–156. [Google Scholar] [CrossRef] [PubMed]
- Lareau, C.A.; Aryee, M.J. diffloop: A computational framework for identifying and analyzing differential DNA loops from sequencing data. Bioinformatics 2018, 34, 672–674. [Google Scholar] [CrossRef] [PubMed]
- Gel, B.; Díez-Villanueva, A.; Serra, E.; Buschbeck, M.; Peinado, M.A.; Malinverni, R. regioneR: An R/Bioconductor package for the association analysis of genomic regions based on permutation tests. Bioinformatics 2016, 32, 289–291. [Google Scholar] [CrossRef]
- Dobin, A.; Davis, C.A.; Schlesinger, F.; Drenkow, J.; Zaleski, C.; Jha, S.; Batut, P.; Chaisson, M.; Gingeras, T.R. STAR: Ultrafast universal RNA-seq aligner. Bioinformatics 2013, 29, 15–21. [Google Scholar] [CrossRef]
- Liao, Y.; Smyth, G.K.; Shi, W. The R package Rsubread is easier, faster, cheaper and better for alignment and quantification of RNA sequencing reads. Nucleic Acids Res. 2019, 47, e47. [Google Scholar] [CrossRef]
- Li, H.; Durbin, R. Fast and accurate long-read alignment with Burrows-Wheeler transform. Bioinformatics 2010, 26, 589–595. [Google Scholar] [CrossRef]
- Amemiya, H.M.; Kundaje, A.; Boyle, A.P. The ENCODE Blacklist: Identification of Problematic Regions of the Genome. Sci. Rep. 2019, 9, 9354. [Google Scholar] [CrossRef]
- Quinlan, A.R.; Hall, I.M. BEDTools: A flexible suite of utilities for comparing genomic features. Bioinformatics 2010, 26, 841–842. [Google Scholar] [CrossRef] [PubMed]
- Li, H.; Handsaker, B.; Wysoker, A.; Fennell, T.; Ruan, J.; Homer, N.; Marth, G.; Abecasis, G.; Durbin, R. The Sequence Alignment/Map format and SAMtools. Bioinformatics 2009, 25, 2078–2079. [Google Scholar] [CrossRef] [PubMed]
- Ramírez, F.; Ryan, D.P.; Grüning, B.; Bhardwaj, V.; Kilpert, F.; Richter, A.S.; Heyne, S.; Dündar, F.; Manke, T. deepTools2: A next generation web server for deep-sequencing data analysis. Nucleic Acids Res. 2016, 44, W160–W165. [Google Scholar] [CrossRef] [PubMed]
- Chen, E.Y.; Tan, C.M.; Kou, Y.; Duan, Q.; Wang, Z.; Meirelles, G.V.; Clark, N.R.; Ma’ayan, A. Enrichr: Interactive and collaborative HTML5 gene list enrichment analysis tool. BMC Bioinform. 2013, 14, 128. [Google Scholar] [CrossRef]
- Ernst, J.; Kellis, M. ChromHMM: Automating chromatin-state discovery and characterization. Nat. Methods 2012, 9, 215–216. [Google Scholar] [CrossRef]

| DEG | LOOP | ANCHOR1 | ANCHOR2 | |||||||||||||
|---|---|---|---|---|---|---|---|---|---|---|---|---|---|---|---|---|
| DEG | Cluster | ID | Overlap | Width | Type | Sig | Annotation | Dist. from TSS | ENS_ID | Gene Name | Gene Type | Annotation | Dist. from TSS | ENS_ID | Gene Name | Gene Type |
| HOXA11 | 3 | 19124 | anchor1 | 8628 | e-p | down | promoter-TSS (NM_019102) | −94 | ENSG00000106004 | HOXA5 | protein-coding | non-coding (NR_038832, exon 3 of 3) | 4272 | ENSG00000122592 | HOXA7 | protein-coding |
| HOXA11 | 3 | 19125 | anchor1 | 23,154 | e-p | down | promoter-TSS (NM_019102) | −94 | ENSG00000106004 | HOXA5 | protein-coding | intron (NR_037940, intron 1 of 2) | −1392 | ENSG00000078399 | HOXA9 | protein-coding |
| HOXA11 | 3 | 19127 | anchor1 | 35,064 | e-p | down | promoter-TSS (NM_019102) | −94 | ENSG00000106004 | HOXA5 | protein-coding | intron (NR_037939, intron 1 of 1) | 1021 | ENSG00000253293 | HOXA10 | protein-coding |
| HOXA11 | 3 | 19126 | anchor1 | 30,023 | e-p | down | promoter-TSS (NM_019102) | −94 | ENSG00000106004 | HOXA5 | protein-coding | exon (NM_018951, exon 1 of 2) | 522 | ENSG00000253293 | HOXA10 | protein-coding |
| GALNT16 | 3 | 35883 | anchor1 | 12,524 | e-p | ns | promoter-TSS (NM_004926) | −870 | ENSG00000185650 | ZFP36L1 | protein-coding | Intergenic | −11,065 | ENSG00000185650 | ZFP36L1 | protein-coding |
| GALNT16 | 3 | 35884 | anchor1 | 20,626 | e-p | ns | promoter-TSS (NM_004926) | −870 | ENSG00000185650 | ZFP36L1 | protein-coding | Intergenic | −19,168 | ENSG00000185650 | ZFP36L1 | protein-coding |
| GALNT16 | 3 | 35885 | anchor1 | 47,834 | e-p | ns | promoter-TSS (NM_004926) | −870 | ENSG00000185650 | ZFP36L1 | protein-coding | Intergenic | −46,375 | ENSG00000185650 | ZFP36L1 | protein-coding |
| ABHD14A-ACY1 | 3 | 10292 | anchor1 | 12,344 | e-p | ns | promoter-TSS (NM_004704) | 150 | ENSG00000041880 | PARP3 | protein-coding | promoter-TSS (NM_080865) | −523 | ENSG00000180929 | GPR62 | protein-coding |
| ABHD14A-ACY1 | 3 | 10293 | anchor1 | 24,976 | e-p | ns | promoter-TSS (NM_004704) | 150 | ENSG00000041880 | PARP3 | protein-coding | promoter-TSS (NM_020418) | −24 | ENSG00000090097 | PCBP4 | protein-coding |
| ABHD14A-ACY1 | 3 | 10294 | anchor1 | 32,056 | e-p | ns | promoter-TSS (NM_004704) | 150 | ENSG00000041880 | PARP3 | protein-coding | promoter-TSS (NM_032750) | 61 | ENSG00000114779 | ABHD14B | protein-coding |
| ABHD14A-ACY1 | 3 | 10295 | anchor1 | 42,148 | e-p | ns | promoter-TSS (NM_004704) | 150 | ENSG00000041880 | PARP3 | protein-coding | intron (NM_001198898, intron 2 of 13) | 1127 | ENSG00000243989 | ACY1 | protein-coding |
| ABHD14A-ACY1 | 3 | 10296 | anchor1 | 53,012 | e-p | ns | promoter-TSS (NM_004704) | 150 | ENSG00000041880 | PARP3 | protein-coding | intron (NM_000992, intron 1 of 3) | 369 | ENSG00000162244 | RPL29 | protein-coding |
| ABHD14A-ACY1 | 3 | 10297 | anchor1 | 112,696 | e-p | ns | promoter-TSS (NM_004704) | 150 | ENSG00000041880 | PARP3 | protein-coding | intron (NM_001947, intron 1 of 2) | 1362 | ENSG00000164086 | DUSP7 | protein-coding |
| ABHD14A-ACY1 | 3 | 10298 | anchor1 | 146,827 | e-p | ns | promoter-TSS (NM_004704) | 150 | ENSG00000041880 | PARP3 | protein-coding | intron (NM_001161580, intron 9 of 9) | −24,228 | NA | LINC00696 | ncRNA |
| CFD | 2 | 45670 | anchor1 | 123,402 | e-p | ns | intron (NM_001317335, intron 1 of 4) | 760 | ENSG00000197766 | CFD | protein-coding | promoter-TSS (NM_024100) | −501 | ENSG00000065268 | WDR18 | protein-coding |
| RIN1 | 2 | 29943 | anchor1 | 70,293 | e-p | ns | exon (NM_003793, exon 1 of 13) | 193 | ENSG00000174080 | CTSF | protein-coding | promoter-TSS (NM_001198843) | 4 | ENSG00000173933 | RBM4 | protein-coding |
| PLEKHA4 | 2 | 48434 | anchor1 | 26,441 | e-p | ns | promoter-TSS (NR_130317) | −39 | ENSG00000105467 | SYNGR4 | protein-coding | intron (NM_006801, intron 1 of 4) | 782 | ENSG00000105438 | KDELR1 | protein-coding |
| GORAB-AS1 | 2 | 3998 | anchor1 | 99,172 | e-p | ns | Intergenic | −31,865 | NA | GORAB-AS1 | ncRNA | promoter-TSS (NM_022716) | −485 | ENSG00000116132 | PRRX1 | protein-coding |
| RAI14 | 5 | 13716 | anchor1 | 28,634 | e-p | ns | intron (NM_001145520, intron 1 of 17) | 1670 | ENSG00000039560 | RAI14 | protein-coding | promoter-TSS (NM_001145523) | −764 | ENSG00000039560 | RAI14 | protein-coding |
| RAI14 | 5 | 13724 | anchor1 | 257,285 | e-p | ns | intron (NM_001145520, intron 1 of 17) | 1670 | ENSG00000039560 | RAI14 | protein-coding | promoter-TSS (NM_002853) | 58 | ENSG00000113456 | RAD1 | protein-coding |
| BDNF | 5 | 28813 | anchor1 | 409,349 | e-p | ns | promoter-TSS (NM_170734) | −18 | ENSG00000176697 | BDNF | protein-coding | promoter-TSS (NM_031217) | 646 | ENSG00000169519 | METTL15 | protein-coding |
| HOXA9 | 5 | 19120 | anchor1 | 9859 | e-p | down | Intergenic | −3159 | ENSG00000197576 | HOXA4 | protein-coding | promoter-TSS (NM_019102) | −94 | ENSG00000106004 | HOXA5 | protein-coding |
| IL33 | 4 | 22820 | anchor1 | 15,077 | e-p | ns | promoter-TSS (NM_001314046) | 29 | ENSG00000137033 | IL33 | protein-coding | intron (NM_001199640, intron 1 of 6) | −6168 | ENSG00000137033 | IL33 | protein-coding |
| CHMP1B-AS1 | 4 | 45102 | anchor1 | 7276 | e-p | ns | promoter-TSS (NM_020412) | −40 | ENSG00000255112 | CHMP1B | protein-coding | intron (NM_001261444, intron 1 of 7) | 896 | ENSG00000141404 | GNAL | protein-coding |
| CHMP1B-AS1 | 4 | 45103 | anchor1 | 96,022 | e-p | ns | promoter-TSS (NM_020412) | −40 | ENSG00000255112 | CHMP1B | protein-coding | Intergenic | −34,112 | ENSG00000141401 | IMPA2 | protein-coding |
| MIR210HG | 4 | 28219 | anchor1 | 7749 | e-p | ns | promoter-TSS (NR_038262) | −231 | ENSG00000247095 | MIR210HG | ncRNA | promoter-TSS (NM_001286583) | −33 | ENSG00000070047 | PHRF1 | protein-coding |
| HSD17B6 | 4 | 32706 | anchor1 | 89,094 | e-p | ns | promoter-TSS (NM_005419) | −96 | ENSG00000170581 | STAT2 | protein-coding | TTS (NM_012064) | 129 | ENSG00000111602 | TIMELESS | protein-coding |
| HSD17B6 | 4 | 32707 | anchor1 | 102,550 | e-p | ns | promoter-TSS (NM_005419) | −96 | ENSG00000170581 | STAT2 | protein-coding | Intergenic | −5825 | ENSG00000176422 | SPRYD4 | protein-coding |
| HSD17B6 | 4 | 32708 | anchor1 | 108,572 | e-p | ns | promoter-TSS (NM_005419) | −96 | ENSG00000170581 | STAT2 | protein-coding | intron (NM_207344, intron 1 of 1) | 197 | ENSG00000176422 | SPRYD4 | protein-coding |
| COL7A1 | 6 | 10135 | anchor1 | 6365 | e-p | ns | promoter-TSS (NM_001317138) | −734 | ENSG00000114268 | PFKFB4 | protein-coding | promoter-TSS (NM_033199) | −121 | ENSG00000145040 | UCN2 | protein-coding |
| COL7A1 | 6 | 10136 | anchor1 | 39,463 | e-p | ns | promoter-TSS (NM_001317138) | −734 | ENSG00000114268 | PFKFB4 | protein-coding | Intergenic | −1840 | ENSG00000114270 | COL7A1 | protein-coding |
| COL7A1 | 6 | 10137 | anchor1 | 77,961 | e-p | ns | promoter-TSS (NM_001317138) | −734 | ENSG00000114268 | PFKFB4 | protein-coding | promoter-TSS (NM_022911) | −37 | ENSG00000225697 | SLC26A6 | protein-coding |
| PODNL1 | 6 | 47001 | anchor1 | 21,746 | e-p | ns | non-coding (NR_036515, exon 1 of 1) | 2808 | NA | LOC284454 | ncRNA | promoter-TSS (NR_146095) | −180 | ENSG00000187556 | NANOS3 | protein-coding |
| CPNE7 | 6 | 40745 | anchor1 | 52,925 | e-p | ns | Intergenic | −1189 | ENSG00000197912 | SPG7 | protein-coding | promoter-TSS (NM_000977) | −533 | ENSG00000167526 | RPL13 | protein-coding |
| HSD17B14 | 6 | 48432 | anchor1 | 111,879 | e-p | ns | non-coding (NR_130317, exon 6 of 6) | 7398 | ENSG00000142227 | EMP3 | protein-coding | promoter-TSS (NM_031485) | −706 | ENSG00000105447 | GRWD1 | protein-coding |
| HSD17B14 | 6 | 48433 | anchor1 | 135,056 | e-p | ns | non-coding (NR_130317, exon 6 of 6) | 7398 | ENSG00000142227 | EMP3 | protein-coding | promoter-TSS (NM_004228) | −754 | ENSG00000105443 | CYTH2 | protein-coding |
| HOXA11 | 3 | 19120 | anchor2 | 9859 | e-p | down | Intergenic | −3159 | ENSG00000197576 | HOXA4 | protein-coding | promoter-TSS (NM_019102) | −94 | ENSG00000106004 | HOXA5 | protein-coding |
| HOXA11 | 3 | 19110 | anchor2 | 44,790 | e-p | down | intron (NR_038367, intron 1 of 1) | 2891 | ENSG00000233429 | HOTAIRM1 | ncRNA | promoter-TSS (NM_019102) | −94 | ENSG00000106004 | HOXA5 | protein-coding |
| HOXA11 | 3 | 19115 | anchor2 | 32,933 | e-p | down | intron (NM_153631, intron 2 of 3) | −8159 | ENSG00000105996 | HOXA2 | protein-coding | promoter-TSS (NM_019102) | −94 | ENSG00000106004 | HOXA5 | protein-coding |
| HOXA11 | 3 | 19099 | anchor2 | 287,607 | e-p | down | intron (NM_003930, intron 1 of 12) | 1555 | ENSG00000005020 | SKAP2 | protein-coding | promoter-TSS (NM_019102) | −94 | ENSG00000106004 | HOXA5 | protein-coding |
| HOXA11 | 3 | 19092 | anchor2 | 293,364 | e-p | down | intron (NM_001303468, intron 3 of 12) | 7312 | ENSG00000005020 | SKAP2 | protein-coding | promoter-TSS (NM_019102) | −94 | ENSG00000106004 | HOXA5 | protein-coding |
| GALNT16 | 3 | 35722 | anchor2 | 852,295 | e-p | ns | intron (NM_001321817, intron 8 of 11) | 118,897 | ENSG00000182185 | RAD51B | protein-coding | promoter-TSS (NM_004926) | −870 | ENSG00000185650 | ZFP36L1 | protein-coding |
| GALNT16 | 3 | 35737 | anchor2 | 653,186 | e-p | ns | intron (NM_001321817, intron 8 of 11) | 318,006 | ENSG00000182185 | RAD51B | protein-coding | promoter-TSS (NM_004926) | −870 | ENSG00000185650 | ZFP36L1 | protein-coding |
| GALNT16 | 3 | 35749 | anchor2 | 546,374 | e-p | ns | intron (NM_001321817, intron 8 of 11) | 380,377 | NA | LOC100996664 | ncRNA | promoter-TSS (NM_004926) | −870 | ENSG00000185650 | ZFP36L1 | protein-coding |
| GALNT16 | 3 | 35779 | anchor2 | 329,101 | e-p | ns | intron (NM_001321817, intron 10 of 11) | 163,104 | NA | LOC100996664 | ncRNA | promoter-TSS (NM_004926) | −870 | ENSG00000185650 | ZFP36L1 | protein-coding |
| GALNT16 | 3 | 35797 | anchor2 | 285,117 | e-p | ns | intron (NM_001321818, intron 10 of 10) | 119,120 | NA | LOC100996664 | ncRNA | promoter-TSS (NM_004926) | −870 | ENSG00000185650 | ZFP36L1 | protein-coding |
| GALNT16 | 3 | 35821 | anchor2 | 248,544 | e-p | ns | intron (NM_001321818, intron 10 of 10) | 82,547 | NA | LOC100996664 | ncRNA | promoter-TSS (NM_004926) | −870 | ENSG00000185650 | ZFP36L1 | protein-coding |
| GALNT16 | 3 | 35841 | anchor2 | 156,840 | e-p | ns | intron (NM_001321818, intron 10 of 10) | −9157 | NA | LOC100996664 | ncRNA | promoter-TSS (NM_004926) | −870 | ENSG00000185650 | ZFP36L1 | protein-coding |
| GALNT16 | 3 | 35850 | anchor2 | 125,930 | e-p | ns | intron (NM_001321818, intron 10 of 10) | −40,067 | NA | LOC100996664 | ncRNA | promoter-TSS (NM_004926) | −870 | ENSG00000185650 | ZFP36L1 | protein-coding |
| GALNT16 | 3 | 35855 | anchor2 | 111,357 | e-p | ns | TTS (NM_001321818) | −54,640 | NA | LOC100996664 | ncRNA | promoter-TSS (NM_004926) | −870 | ENSG00000185650 | ZFP36L1 | protein-coding |
| GALNT16 | 3 | 35861 | anchor2 | 99,498 | e-p | ns | Intergenic | −66,499 | NA | LOC100996664 | ncRNA | promoter-TSS (NM_004926) | −870 | ENSG00000185650 | ZFP36L1 | protein-coding |
| GALNT16 | 3 | 35868 | anchor2 | 90,796 | e-p | ns | Intergenic | −75,201 | NA | LOC100996664 | ncRNA | promoter-TSS (NM_004926) | −870 | ENSG00000185650 | ZFP36L1 | protein-coding |
| GALNT16 | 3 | 35874 | anchor2 | 77,461 | e-p | ns | Intergenic | 76,591 | ENSG00000185650 | ZFP36L1 | protein-coding | promoter-TSS (NM_004926) | −870 | ENSG00000185650 | ZFP36L1 | protein-coding |
| GALNT16 | 3 | 35878 | anchor2 | 39,487 | e-p | ns | Intergenic | 38,617 | ENSG00000185650 | ZFP36L1 | protein-coding | promoter-TSS (NM_004926) | −870 | ENSG00000185650 | ZFP36L1 | protein-coding |
| GALNT16 | 3 | 35881 | anchor2 | 8795 | e-p | ns | Intergenic | 7925 | ENSG00000185650 | ZFP36L1 | protein-coding | promoter-TSS (NM_004926) | −870 | ENSG00000185650 | ZFP36L1 | protein-coding |
| EGFL8 | 3 | 16744 | anchor2 | 82,077 | e-p | ns | Intergenic | −4749 | ENSG00000168477 | TNXB | protein-coding | promoter-TSS (NM_022107).6 | −641 | ENSG00000213654 | GPSM3 | protein-coding |
| EGFL8 | 3 | 16752 | anchor2 | 67,171 | e-p | ns | promoter-TSS (NM_001136153).2 | −747 | ENSG00000213676 | ATF6B | protein-coding | promoter-TSS (NM_022107).6 | −641 | ENSG00000213654 | GPSM3 | protein-coding |
| EGFL8 | 3 | 16756 | anchor2 | 43,230 | e-p | ns | promoter-TSS (NM_030651) | 149 | ENSG00000204314 | PRRT1 | protein-coding | promoter-TSS (NM_022107).6 | −641 | ENSG00000213654 | GPSM3 | protein-coding |
| EGFL8 | 3 | 16759 | anchor2 | 18,816 | e-p | ns | promoter-TSS (NM_001371437) | −2 | NA | NA | NA | promoter-TSS (NM_022107).6 | −641 | ENSG00000213654 | GPSM3 | protein-coding |
| EGFL8 | 3 | 16760 | anchor2 | 6385 | e-p | ns | TTS (NM_022107).6 | 423 | ENSG00000204304 | PBX2 | protein-coding | promoter-TSS (NM_022107).6 | −641 | ENSG00000213654 | GPSM3 | protein-coding |
| SELENBP1 | 3 | 3317 | anchor2 | 72,559 | e-p | ns | promoter-TSS (NM_001330721) | −25 | ENSG00000143393 | PI4KB | protein-coding | exon (NM_002796, exon 2 of 7) | 427 | ENSG00000159377 | PSMB4 | protein-coding |
| RAP1GAP | 2 | 960 | anchor2 | 63,962 | e-p | ns | promoter-TSS (NM_001113347) | −389 | ENSG00000117298 | ECE1 | protein-coding | intron (NM_001113348, intron 1 of 18) | 1538 | ENSG00000117298 | ECE1 | protein-coding |
| EPHX2 | 2 | 21394 | anchor2 | 21,110 | e-p | ns | promoter-TSS (NM_001831) | −968 | ENSG00000120885 | CLU | protein-coding | intron (NM_182826, intron 1 of 5) | 2718 | ENSG00000168077 | SCARA3 | protein-coding |
| PLEKHG4 | 2 | 39878 | anchor2 | 83,771 | e-p | ns | promoter-TSS (NM_003789) | 297 | ENSG00000135722 | FBXL8 | protein-coding | intron (NM_001318202, intron 1 of 23) | 3455 | ENSG00000135723 | FHOD1 | protein-coding |
| TBXA2R | 2 | 46172 | anchor2 | 33,942 | e-p | ns | intron (NM_006339, intron 1 of 9) | 159 | ENSG00000064961 | HMG20B | protein-coding | promoter-TSS (NR_038865) | −171 | ENSG00000006638 | TBXA2R | protein-coding |
| TBXA2R | 2 | 46175 | anchor2 | 27,033 | e-p | ns | TTS (NM_006339) | −5466 | ENSG00000179855 | GIPC3 | protein-coding | promoter-TSS (NR_038865) | −171 | ENSG00000006638 | TBXA2R | protein-coding |
| SULT1A3 | 2 | 39468 | anchor2 | 64,396 | e-p | ns | promoter-TSS (NM_001040056) | 7 | ENSG00000102882 | MAPK3 | protein-coding | intron (NM_001193333, intron 7 of 11) | −1075 | NA | LOC606724 | pseudo |
| CA12 | 2 | 37448 | anchor2 | 39,130 | e-e | ns | promoter-TSS (NR_147233) | −956 | NA | TPM1-AS | ncRNA | Intergenic | −32,387 | ENSG00000103642 | LACTB | protein-coding |
| GORAB-AS1 | 2 | 3978 | anchor2 | 32,309 | e-p | ns | promoter-TSS (NM_001320252) | −1 | ENSG00000120370 | GORAB | protein-coding | Intergenic | −31,865 | NA | GORAB-AS1 | ncRNA |
| TES | 4 | 20235 | anchor2 | 44,811 | e-p | ns | promoter-TSS (NM_001172897) | −615 | ENSG00000105974 | CAV1 | protein-coding | intron (NR_120506, intron 4 of 4) | 44,196 | ENSG00000105974 | CAV1 | protein-coding |
| MIR210HG | 4 | 28217 | anchor2 | 32,639 | e-p | ns | promoter-TSS (NM_176795) | −473 | ENSG00000174775 | HRAS | protein-coding | promoter-TSS (NR_038262) | −231 | ENSG00000247095 | MIR210HG | ncRNA |
| HSD17B6 | 4 | 32695 | anchor2 | 137,481 | e-p | ns | promoter-TSS (NR_040053) | −752 | ENSG00000181852 | RNF41 | protein-coding | promoter-TSS (NM_005419) | −96 | ENSG00000170581 | STAT2 | protein-coding |
| HSD17B6 | 4 | 32702 | anchor2 | 60,102 | e-p | ns | intron (NM_004077, intron 1 of 10) | 229 | ENSG00000062485 | CS | protein-coding | promoter-TSS (NM_005419) | −96 | ENSG00000170581 | STAT2 | protein-coding |
| HSD17B6 | 4 | 32704 | anchor2 | 44,090 | e-p | ns | promoter-TSS (NM_014255) | −125 | ENSG00000257727 | CNPY2 | protein-coding | promoter-TSS (NM_005419) | −96 | ENSG00000170581 | STAT2 | protein-coding |
| COL7A1 | 6 | 10130 | anchor2 | 87,150 | e-p | ns | TTS (NM_001271022) | 190 | ENSG00000213689 | TREX1 | protein-coding | promoter-TSS (NM_001317138) | −734 | ENSG00000114268 | PFKFB4 | protein-coding |
| PODNL1 | 6 | 46954 | anchor2 | 109,067 | e-p | ns | promoter-TSS (NM_001320561) | −709 | ENSG00000104957 | CCDC130 | protein-coding | non-coding (NR_036515, exon 1 of 1) | 2808 | NA | LOC284454 | ncRNA |
| PODNL1 | 6 | 46970 | anchor2 | 65,696 | e-p | ns | promoter-TSS (NM_014047) | −42 | ENSG00000104979 | C19orf53 | protein-coding | non-coding (NR_036515, exon 1 of 1) | 2808 | NA | LOC284454 | ncRNA |
| CPNE7 | 6 | 40657 | anchor2 | 186,088 | e-e | ns | promoter-TSS (NM_001242885) | −22 | NA | LOC100287036 | protein-coding | Intergenic | −1189 | ENSG00000197912 | SPG7 | protein-coding |
| CPNE7 | 6 | 40720 | anchor2 | 76,223 | e-e | ns | promoter-TSS (NR_110931) | 57 | NA | LOC101927817 | ncRNA | Intergenic | −1189 | ENSG00000197912 | SPG7 | protein-coding |
| CPNE7 | 6 | 40622 | anchor2 | 290,001 | e-p | ns | promoter-TSS (NM_182531) | −506 | ENSG00000170100 | ZNF778 | protein-coding | Intergenic | −1189 | ENSG00000197912 | SPG7 | protein-coding |
| SPAAR | 6 | 23267 | anchor2 | 79,338 | e-p | ns | promoter-TSS (NM_016446) | 468 | ENSG00000204930 | FAM221B | protein-coding | TTS (NM_001039792) | 1400 | ENSG00000196196 | HRCT1 | protein-coding |
| IGF2BP1 | 6 | 43400 | anchor2 | 51,386 | e-p | ns | promoter-TSS (NR_038458) | −99 | ENSG00000229980 | TOB1-AS1 | ncRNA | Intergenic | −49,988 | ENSG00000141232 | TOB1 | protein-coding |
| HSD17B14 | 6 | 48426 | anchor2 | 62,105 | e-e | ns | promoter-TSS (NM_001331098) | 5 | ENSG00000178150 | ZNF114 | protein-coding | non-coding (NR_130317, exon 6 of 6) | 7398 | ENSG00000142227 | EMP3 | protein-coding |
| TSPAN13 | 6 | 19005 | anchor2 | 64,574 | e-p | ns | promoter-TSS (NM_020319) | 285 | ENSG00000136261 | BZW2 | protein-coding | Intergenic | −42,715 | ENSG00000106537 | TSPAN13 | protein-coding |
| Unspecific Anchor | ABD-Specific Anchor | GF-Specific Anchor | |||
|---|---|---|---|---|---|
| SNP_ID | Gene Name | SNP_ID | Gene Name | SNP_ID | Gene Name |
| rs12138127 | ZMIZ1-AS1 | rs1037925 | ARNTL2 | rs7907173 | LASTR |
| rs7530102 | REEP2 | rs61955587 | B3GNT4 | rs2734741 | PPL |
| rs3119837 | NA-BARX1 | rs1139653 | DNAJA3 | rs2957674 | SBF2 |
| rs3747636 | MIR3188-RPL39P38 | rs2074553 | DOT1L | rs2853986 | RNU6-283P-FGFR3P1 |
| rs12078075 | GDF5 | rs2240128 | DOT1L | rs273507 | MAST3 |
| rs762705 | DYRK1A-KCNJ6 | rs2835810 | DYRK1A-KCNJ6 | rs7350438 | LASTR |
| rs758801 | PPL | rs4722669 | GORAB-PRRX1 | rs2923125 | AMPD3 |
| rs12495674 | RAI1 | rs114709597 | H6PD-SPSB1 | ||
| rs11724804 | RAI1 | rs564101206 | H6PD-SPSB1 | ||
| rs55962025 | KANSL1 | rs10248288 | HOTTIP-EVX1-AS | ||
| rs2137234 | GATA4 | rs7801581 | HOXA11 | ||
| rs9742 | SLC44A4 | rs17501111 | HOXA11 | ||
| rs77881454 | C2 | rs9770544 | HOXA11-AS-HOXA13 | ||
| rs6546164 | RNU6-682P-RPL10P19 | rs1725074 | HOXA2-HOXA3 | ||
| rs34312154 | SMIM20-LINC02357 | rs61384251 | HOXA3 | ||
| rs3782086 | PSORS1C1 | rs10827226 | NRP1 | ||
| rs117737783 | DNM2 | rs875896 | HOXA7-HOXA9 | ||
| rs12580347 | LOXL1 | rs34957925 | HOXA9, HOXA10 | ||
| rs2277339 | RFLNA | rs368928402 | HOXA-AS3, HOXA3 | ||
| rs771846 | PHGR1 | rs8043060 | IQCH-AS1, IQCH | ||
| rs10827226 | NRP1 | rs28768122 | KMT5A | ||
| rs6480914 | HLA-DMB | rs10514889 | MAPT | ||
| rs12419064 | LIN52 | rs9896485 | MAPT | ||
| rs982085 | rs885683 | MAST3 | |||
| rs34000 | PBRM1 | rs2048498 | MLXIP-LRRC43 | ||
| rs3904600 | MLXIP | rs925460 | MLXIP-LRRC43 | ||
| rs4722669 | GORAB-PRRX1 | rs711082 | NAV3 | ||
| rs56285369 | LY75, CD302 | rs2474724 | NRP1 | ||
| rs9402211 | FLRT1, MACROD1 | rs4646342 | PEMT | ||
| rs7823561 | RPL35P2-NUDT3 | rs771846 | PHGR1 | ||
| rs71511927 | MICB-DT | rs750619494 | ABHD2 | ||
| rs6994124 | MRPS18A-VEGFA | rs747616512 | ABHD2 | ||
| rs112875651 | RPS10-NUDT3 | rs4135300 | PPARG-TSEN2 | ||
| rs2725308 | MIR9-1HG | rs2655268 | PPARG-TSEN2 | ||
| rs2166365 | LINC01142, LINC01681 | rs1699347 | PPARG-TSEN2 | ||
| rs7256111 | MICB-DT | rs778984966 | SMAD3 | ||
| rs143384 | GDF5 | rs12140013 | THEMIS2 | ||
| rs11664106 | SMCHD1-EMILIN2 | rs1583969 | ZFAT | ||
| rs2058914 | USP3 | rs55650389 | ZFAT | ||
| rs876476 | CLEC16A | ||||
| rs2925979 | CMIP | ||||
| rs12435046 | RAD51B | ||||
| rs12042959 | SDCCAG8 | ||||
| rs780159 | ZMIZ1 | ||||
| rs7907173 | LASTR | ||||
| rs793456 | COL8A1-CMSS1 | ||||
| rs797486 | DLEU1, DLEU7 | ||||
| rs8043060 | IQCH-AS1, IQCH | ||||
| rs8071778 | CDK5RAP3-COPZ2 | ||||
| rs1139653 | DNAJA3 | ||||
| rs12575252 | TRIM66 | ||||
| rs12828016 | WNK1 | ||||
| rs3736485 | DMXL2 | ||||
| rs4646342 | PEMT | ||||
| rs4660808 | PPIEL | ||||
| rs6021889 | LINC01524 | ||||
| rs1122080 | |||||
| rs459193 | RPL26P19-C5orf67 | ||||
| rs605203 | EHMT2-AS1 | ||||
| rs2276824 | PBRM1 | ||||
| rs2845885 | FLRT1, MACROD1 | ||||
| rs3810068 | SMCHD1-EMILIN2 | ||||
| rs7801581 | HOXA11 | ||||
| rs3741378 | SIPA1 | ||||
| rs3747577 | CORO7-PAM16, CORO7 | ||||
| rs1051921 | MLXIPL | ||||
| rs544668 | TSPAN9 | ||||
| rs11893688 | ADAM17 | ||||
| rs2595004 | ATG7 | ||||
| rs807067 | PAQR7 | ||||
| rs380654 | COL24A1 | ||||
| rs7783857 | KLF14-H4P1 | ||||
| rs12868881 | NA-LINC02337 | ||||
| rs2957658 | AMPD3 | ||||
| rs6694768 | TRIM33 | ||||
| rs7025089 | MED27 | ||||
| rs11694173 | THADA | ||||
| rs2747399 | TSHZ2 | ||||
| rs4871958 | EBF2 | ||||
| rs2835810 | DYRK1A-KCNJ6 | ||||
| rs2734741 | PPL | ||||
| rs7166081 | SMAD3-AAGAB | ||||
| rs4575098 | ADAMTS4 | ||||
| rs465002 | C5orf67 | ||||
| rs75766425 | NID2 | ||||
| rs9379082 | RREB1 | ||||
| rs79823890 | NID2 | ||||
| rs740746 | NHLRC2-ADRB1 | ||||
| rs750619494 | PLIN1 | ||||
| rs2284178 | HCP5 | ||||
| rs2921097 | PRAG1-RN7SL178P | ||||
| rs2921036 | PRAG1-RN7SL178P | ||||
| rs35190619 | NA-RN7SL178P | ||||
| rs56367294 | MFHAS1 | ||||
| rs10098531 | RNU6-682P-RPL10P19 | ||||
| rs2797963 | KRT18P9-CYCSP55 | ||||
| rs10248288 | HOTTIP-EVX1-AS | ||||
| rs57340203 | RREB1 | ||||
| rs3857546 | H1-4-H2BC5 | ||||
| rs11435482 | H3C9P-BTN3A2 | ||||
| rs9379850 | H3C9P-BTN3A2 | ||||
| rs4282054 | NT5DC2 | ||||
| rs7695004 | RBPJ | ||||
| rs11697492 | LINC01524 | ||||
| rs532086 | C2 | ||||
| rs4646404 | PEMT | ||||
| rs7224739 | RAI1 | ||||
| rs11649804 | RAI1 | ||||
| rs10514889 | MAPT | ||||
| rs11653367 | KANSL1 | ||||
| rs377346776 | EYA1 | ||||
| rs7928917 | PNPLA2 | ||||
| rs4841580 | LINC00208-GATA4 | ||||
| rs10503426 | GATA4 | ||||
| rs2957674 | SBF2 | ||||
| rs12419342 | RAPSN | ||||
| rs778984966 | SMAD3 | ||||
| rs76748772 | PEPD | ||||
| rs1264376 | HCG20-LINC00243 | ||||
| rs2535324 | HCG20 | ||||
| rs2853986 | RNU6-283P-FGFR3P1 | ||||
| rs7629072 | WDR82 | ||||
| rs885910 | DDR1 | ||||
| rs1265158 | POU5F1 | ||||
| rs2263314 | MICA | ||||
| rs28436034 | MICA | ||||
| rs730213 | LINC02875-TBX4 | ||||
| rs494620 | SLC44A4 | ||||
| rs521977 | SLC44A4 | ||||
| rs2844452 | C2 | ||||
| rs2734313 | TNXB | ||||
| rs2856451 | TNXB | ||||
| rs1150754 | TNXB | ||||
| rs448231 | RNU6-682P-RPL10P19 | ||||
| rs6917995 | H3C9P-BTN3A2 | ||||
| rs17643342 | RNU6-682P-RPL10P19 | ||||
| rs313736 | COL24A1 | ||||
| rs804281 | GATA4 | ||||
| rs7826055 | GATA4 | ||||
| rs1228024 | NUP160-PTPRJ | ||||
| rs6501784 | GRB2 | ||||
| rs11386443 | FNDC3B | ||||
| rs3773842 | DLG1 | ||||
| rs4690196 | DGKQ | ||||
| rs11724232 | NA-LINC01365 | ||||
| rs1567651 | SMIM20-LINC02357 | ||||
| rs5025813 | SMIM20-LINC02357 | ||||
| rs14323 | H1-10-AS1, H1-10 | ||||
| rs6764238 | H1-10-AS1-RPL32P3 | ||||
| rs3131014 | CCHCR1 | ||||
| rs254431 | SPRY4-AS1 | ||||
| rs3095304 | PSORS1C1 | ||||
| rs77169818 | GALR1 | ||||
| rs2074553 | DOT1L | ||||
| rs55818584 | DNMT1, S1PR2 | ||||
| rs55660036 | DNM2 | ||||
| rs273507 | MAST3 | ||||
| rs7246274 | PDE4C | ||||
| rs11130362 | TKT | ||||
| rs6068216 | LINC01524 | ||||
| rs28710106 | TSHZ2 | ||||
| rs62206548 | TSHZ2 | ||||
| rs6494407 | USP3 | ||||
| rs12441130 | LOXL1 | ||||
| rs7191812 | CORO7-PAM16, CORO7 | ||||
| rs1291695 | CORO7, CORO7-PAM16, VASN | ||||
| rs4785960 | CORO7-PAM16, CORO7 | ||||
| rs116734066 | DNAJC27-AS1-EFR3B | ||||
| rs79761284 | LINC01381-DNMT3A | ||||
| rs17745484 | DNMT3A | ||||
| rs7954697 | SCARB1 | ||||
| rs61953572 | DNAH10, CCDC92, DNAH10OS | ||||
| rs752843328 | RFLNA | ||||
| rs825508 | RFLNA | ||||
| rs1906937 | RFLNA | ||||
| rs35777573 | PHGR1 | ||||
| rs1473781 | RPAP1 | ||||
| rs201612157 | OR7E159P-GNG2 | ||||
| rs117311385 | GNG2 | ||||
| rs28469812 | RILPL2 | ||||
| rs117209788 | RILPL1 | ||||
| rs137963709 | RILPL1-MIR3908 | ||||
| rs148118721 | ATP6V0A2 | ||||
| rs6488898 | ATP6V0A2 | ||||
| rs2271049 | HIP1R | ||||
| rs940904 | PITPNM2 | ||||
| rs139192229 | DNAH10OS, DNAH10, CCDC92 | ||||
| rs59364353 | RFLNA | ||||
| rs17753769 | PPP1R14BP5-CENPW | ||||
| rs1725074 | HOXA2-HOXA3 | ||||
| rs368928402 | HOXA-AS3, HOXA3 | ||||
| rs875896 | HOXA7-HOXA9 | ||||
| rs34957925 | HOXA9, HOXA10 | ||||
| rs17501111 | HOXA11 | ||||
| rs9770544 | HOXA11-AS-HOXA13 | ||||
| rs28576490 | JAZF1 | ||||
| rs57291069 | NKX2-6-NA | ||||
| rs144362803 | TRIB1-NA | ||||
| rs1583969 | ZFAT | ||||
| rs7834111 | ZFAT | ||||
| rs2474724 | NRP1 | ||||
| rs35727416 | EYA1 | ||||
| rs35416759 | RILPL2 | ||||
| rs181981038 | BAZ1B | ||||
| rs7487608 | MLXIP | ||||
| rs11057291 | MLXIP | ||||
| rs2048498 | MLXIP-LRRC43 | ||||
| rs61955587 | B3GNT4 | ||||
| rs117269855 | KNTC1-HCAR2 | ||||
| rs2277346 | KNTC1 | ||||
| rs3121911 | LINC01681 | ||||
| rs1332952 | LINC01681, LINC01142 | ||||
| rs12131969 | HAUS4P1-GORAB-AS1 | ||||
| rs11808978 | GORAB-PRRX1 | ||||
| rs2641431 | SMG6 | ||||
| rs8081548 | POLR2A-Y_RNA | ||||
| rs11641142 | CMIP | ||||
| rs114709597 | H6PD-SPSB1 | ||||
| rs564101206 | H6PD-SPSB1 | ||||
| rs2999140 | ASAP3-E2F2 | ||||
| rs140681455 | FUBP1 | ||||
| rs2927327 | CMIP | ||||
| rs62064595 | RNA5SP443-ARHGAP27 | ||||
| rs9303523 | MAPT | ||||
| rs8080903 | MAPT | ||||
| rs720856 | RAI1 | ||||
| rs3818717 | RAI1 | ||||
| rs36058389 | ALKBH5-LLGL1 | ||||
| rs2240128 | DOT1L | ||||
| rs8191979 | SHC1 | ||||
| rs147847496 | DPM3-HMGN2P18 | ||||
| rs756916254 | |||||
| rs35444446 | |||||
| rs201632637 | KLF14-H4P1 | ||||
| rs2309651 | AFF3 | ||||
| rs56186131 | LY75, LY75-CD302 | ||||
| rs145272880 | PLA2R1 | ||||
| rs7594266 | GRB14-COBLL1 | ||||
| rs148358468 | TTLL4 | ||||
| rs4135300 | PPARG-TSEN2 | ||||
| rs11213979 | SIK2 | ||||
| rs60906625 | SSPN | ||||
| rs61914547 | SSPN-ITPR2 | ||||
| rs1037925 | ARNTL2 | ||||
| rs144737537 | SP7-SP1 | ||||
| rs12426763 | CISTR-RN7SKP289 | ||||
| rs4332564 | HOXC13-HOXC12 | ||||
| rs2366149 | HOXC13-HOXC12 | ||||
| rs75493807 | HOXC6, HOXC9, HOXC-AS2 | ||||
| rs10778496 | RFX4 | ||||
| rs1922432 | RFX4 | ||||
| rs157512 | C5orf67 | ||||
| rs10070929 | FGF1, SPRY4-AS1 | ||||
| rs9379081 | RREB1 | ||||
| rs1620540 | GNG2 | ||||
| rs730566 | TMA7-ATRIP | ||||
| rs34365302 | DNAH1 | ||||
| rs2655268 | PPARG-TSEN2 | ||||
| rs1699347 | PPARG-TSEN2 | ||||
| rs67409736 | STAB1 | ||||
| rs11176017 | RPL21P18-RNA5SP362 | ||||
| rs716446 | RFX4 | ||||
| rs925460 | MLXIP-LRRC43 | ||||
| rs7316114 | CLIP1-ZCCHC8 | ||||
| rs140323250 | NA-MIR148A | ||||
| rs287621 | KLF14-H4P1 | ||||
| rs854793 | MYO15A | ||||
| rs9896485 | MAPT | ||||
| rs4135268 | PPARG | ||||
| rs12358916 | ARID5B-RTKN2 | ||||
| rs4290124 | ARID5B-RTKN2 | ||||
| rs7917772 | SFXN2 | ||||
| rs2244524 | SFXN2 | ||||
| rs11199755 | NA-RPL19P16 | ||||
| rs61876729 | GATD1-CEND1 | ||||
| rs7107271 | GATD1-CEND1 | ||||
| rs12799550 | MACROD1, FLRT1 | ||||
| rs1006207 | MACROD1, FLRT1 | ||||
| rs2186643 | MACROD1, FLRT1 | ||||
| rs17158803 | FLRT1, MACROD1 | ||||
| rs73502335 | PRDX5-CCDC88B | ||||
| rs1662185 | PRDX5-CCDC88B | ||||
| rs55869750 | AHNAK | ||||
| rs67308910 | EML3 | ||||
| rs1893458 | INTS5-C11orf98 | ||||
| rs7978072 | RASSF8-BHLHE41 | ||||
| rs77757339 | BHLHE41, SSPN | ||||
| rs7955859 | SSPN | ||||
| rs7134738 | SSPN | ||||
| rs9668178 | SSPN | ||||
| rs3094014 | HCP5 | ||||
| rs2596473 | LINC01149-HCP5 | ||||
| rs9380180 | SUCLA2P1-RANP1 | ||||
| rs2797964 | KRT18P9-CYCSP55 | ||||
| rs1759637 | RPL35P2-NUDT3 | ||||
| rs12195665 | MICB-DT | ||||
| rs10661543 | MICB-DT | ||||
| rs2534681 | MICB | ||||
| rs62395355 | MICB | ||||
| rs12204413 | MRPS18A-VEGFA | ||||
| rs145416558 | FAM13A | ||||
| rs2905757 | HCG22 | ||||
| rs116594542 | RPS10-NUDT3 | ||||
| rs2763977 | HSPA1A | ||||
| rs2607015 | VARS1 | ||||
| rs10223666 | VEGFA-LINC02537 | ||||
| rs35208023 | MIR9-1HG | ||||
| rs34469991 | PC | ||||
| rs55650389 | ZFAT | ||||
| rs144831544 | NCR3-UQCRHP1 | ||||
| rs2857694 | AIF1-PRRC2A | ||||
| rs2763981 | SLC44A4, | ||||
| rs644774 | SLC44A4 | ||||
| rs9267653 | SLC44A4 | ||||
| rs7301643 | NA-HOXC13-AS | ||||
| rs67330701 | MYEOV | ||||
| rs10750786 | BRD9P1 | ||||
| rs313734 | COL24A1 | ||||
| rs12734458 | COL24A1 | ||||
| rs2990657 | LINC01142, LINC01681 | ||||
| rs71455259 | HOXC13-AS | ||||
| rs10784510 | LINC02425 | ||||
| rs711082 | NAV3 | ||||
| rs7139153 | NA-HOXC13-AS | ||||
| rs7307887 | KNTC1-HCAR2 | ||||
| rs7896335 | NA-RPL19P16 | ||||
| rs2509985 | AHNAK | ||||
| rs34341044 | PBRM1 | ||||
| rs6772089 | IL17RD | ||||
| rs111593386 | GLYCTK-AS1-DNAH1 | ||||
| rs62265318 | EFCC1 | ||||
| rs41264253 | PBXIP1 | ||||
| rs60925903 | EFR3B | ||||
| rs11124930 | THADA | ||||
| rs12466434 | LINC01937-TWIST2 | ||||
| rs852425 | ACTB | ||||
| rs17145717 | BAZ1B | ||||
| rs143214539 | PPP1R14BP5-CENPW | ||||
| rs9381248 | MRPS18A-VEGFA | ||||
| rs28768122 | KMT5A | ||||
| rs4759364 | KNTC1-HCAR2 | ||||
| rs80024005 | VPS37B-ABCB9 | ||||
| rs111854458 | CCDC92 | ||||
| rs2378280 | ZC3H11B-SLC30A10 | ||||
| rs73078824 | PBRM1 | ||||
| rs4786485 | VASN, CORO7, PAM16 | ||||
| rs73507245 | PAM16, CORO7-PAM16 | ||||
| rs60570301 | ELL | ||||
| rs1363120 | PGPEP1-GDF15 | ||||
| rs885683 | MAST3 | ||||
| rs72832896 | RNA5SP443-ARHGAP27 | ||||
| rs112881773 | EMILIN2 | ||||
| rs4378729 | MIR3188-RPL39P38 | ||||
| rs11670016 | RPL39P38-LSM4 | ||||
| rs61876744 | PNPLA2 | ||||
| rs2008019 | EBPL | ||||
| rs13412 | P3H4 | ||||
| rs854788 | MYO15A | ||||
| rs7219992 | ZBTB4, SLC35G6 | ||||
| rs7218457 | LINC02210-CRHR1 | ||||
| rs55762977 | SLC25A19-GRB2 | ||||
| rs550600266 | TRMT11 | ||||
| rs73243890 | LINC02357 | ||||
| rs421215 | LINC01948 | ||||
| rs61384251 | HOXA3 | ||||
| rs2108864 | FGF1-LINC01844 | ||||
| rs73005768 | ESR1 | ||||
| rs811458 | ASTN2 | ||||
| rs7350438 | LASTR | ||||
| rs144100226 | KRT18P9-CYCSP55 | ||||
| rs2923125 | AMPD3 | ||||
| rs60521849 | KANSL1 | ||||
| rs650180 | TSPAN9 | ||||
| rs57561811 | SLC38A6-PRKCH | ||||
| rs28378811 | LINC00316-MTCO1P3 | ||||
| rs4371408 | LINC01524 | ||||
| rs10992447 | BICD2 | ||||
| rs2246618 | MICB-PPIAP9 | ||||
| rs2904597 | MICB-DT | ||||
| rs2844498 | MICB | ||||
| rs3130277 | FKBPL-PRRT1 | ||||
| rs77318243 | HLA-DMB | ||||
| rs3132584 | TUBB | ||||
| rs1264375 | HCG20-LINC00243 | ||||
| rs1076829 | DHX16 | ||||
| rs2857595 | NCR3-UQCRHP1 | ||||
| rs3132450 | PRRC2A | ||||
| rs28752890 | LINC02571-HLA-B | ||||
| rs2844495 | MICB-PPIAP9 | ||||
| rs11057401 | CCDC92 | ||||
| rs6931262 | RREB1 | ||||
| rs150999300 | LINC02775-LINC01348 | ||||
| rs12140013 | THEMIS2 | ||||
| rs190930640 | THSD4 | ||||
| rs769422497 | FAM168A | ||||
| rs565732042 | LIN52 | ||||
| rs199913532 | KIDINS220 | ||||
| rs1982963 | NID2 | ||||
| rs17223632 | SPRY4-AS1, FGF1 | ||||
| rs747616512 | PLIN1 | ||||
| rs370499275 | PLIN1 | ||||
| rs12549058 | EYA1 | ||||
| rs11989744 | NKX2-6-NA | ||||
| rs16996700 | LINC01524 | ||||
| rs532552327 | RSPRY1 | ||||
| rs222487 | COX7A2L | ||||
| rs139516594 | |||||
| rs7975017 | SSPN | ||||
| rs2590838 | PBRM1 | ||||
| rs1894633 | DNM3 | ||||
| rs10783615 | HOXC12 | ||||
| rs12489828 | NT5DC2 | ||||
| rs1872992 | SSPN-ITPR2 | ||||
| rs13241538 | KLF14-H4P1 | ||||
| rs10743579 | SSPN-ITPR2 | ||||
| rs12443634 | CMIP | ||||
| rs6088552 | PIGU | ||||
Disclaimer/Publisher’s Note: The statements, opinions and data contained in all publications are solely those of the individual author(s) and contributor(s) and not of MDPI and/or the editor(s). MDPI and/or the editor(s) disclaim responsibility for any injury to people or property resulting from any ideas, methods, instructions or products referred to in the content. |
© 2023 by the authors. Licensee MDPI, Basel, Switzerland. This article is an open access article distributed under the terms and conditions of the Creative Commons Attribution (CC BY) license (https://creativecommons.org/licenses/by/4.0/).
Share and Cite
Halasz, L.; Divoux, A.; Sandor, K.; Erdos, E.; Daniel, B.; Smith, S.R.; Osborne, T.F. An Atlas of Promoter Chromatin Modifications and HiChIP Regulatory Interactions in Human Subcutaneous Adipose-Derived Stem Cells. Int. J. Mol. Sci. 2024, 25, 437. https://doi.org/10.3390/ijms25010437
Halasz L, Divoux A, Sandor K, Erdos E, Daniel B, Smith SR, Osborne TF. An Atlas of Promoter Chromatin Modifications and HiChIP Regulatory Interactions in Human Subcutaneous Adipose-Derived Stem Cells. International Journal of Molecular Sciences. 2024; 25(1):437. https://doi.org/10.3390/ijms25010437
Chicago/Turabian StyleHalasz, Laszlo, Adeline Divoux, Katalin Sandor, Edina Erdos, Bence Daniel, Steven R. Smith, and Timothy F. Osborne. 2024. "An Atlas of Promoter Chromatin Modifications and HiChIP Regulatory Interactions in Human Subcutaneous Adipose-Derived Stem Cells" International Journal of Molecular Sciences 25, no. 1: 437. https://doi.org/10.3390/ijms25010437
APA StyleHalasz, L., Divoux, A., Sandor, K., Erdos, E., Daniel, B., Smith, S. R., & Osborne, T. F. (2024). An Atlas of Promoter Chromatin Modifications and HiChIP Regulatory Interactions in Human Subcutaneous Adipose-Derived Stem Cells. International Journal of Molecular Sciences, 25(1), 437. https://doi.org/10.3390/ijms25010437