Article

Transcriptome, Ectopic Expression and Genetic Population Analysis Identify Candidate Genes for Fiber Quality Improvement in Cotton

State Key Laboratory of North China Crop Improvement and Regulation, North China Key Laboratory for Crop Germplasm Resources of Education Ministry, Hebei Agricultural University, Baoding 071001, China
*
Authors to whom correspondence should be addressed.
These authors contributed equally to this work.
Int. J. Mol. Sci. 2023, 24(9), 8293; https://doi.org/10.3390/ijms24098293
Submission received: 24 March 2023 / Revised: 22 April 2023 / Accepted: 24 April 2023 / Published: 5 May 2023
(This article belongs to the Special Issue Cotton Molecular Genomics and Genetics 2.0)

Abstract

:
Comparative transcriptome analysis of fiber tissues between Gossypium barbadense and Gossypium hirsutum could reveal the molecular mechanisms underlying high-quality fiber formation and identify candidate genes for fiber quality improvement. In this study, 759 genes were found to be strongly upregulated at the elongation stage in G. barbadense, which showed four distinct expression patterns (I–IV). Among them, the 346 genes of group IV stood out in terms of the potential to promote fiber elongation, in which we finally identified 42 elongation-related candidate genes by comparative transcriptome analysis between G. barbadense and G. hirsutum. Subsequently, we overexpressed GbAAR3 and GbTWS1, two of the 42 candidate genes, in Arabidopsis plants and validated their roles in promoting cell elongation. At the secondary cell wall (SCW) biosynthesis stage, 2275 genes were upregulated and exhibited five different expression profiles (I–V) in G. barbadense. We highlighted the critical roles of the 647 genes of group IV in SCW biosynthesis and further picked out 48 SCW biosynthesis-related candidate genes by comparative transcriptome analysis. SNP molecular markers were then successfully developed to distinguish the SCW biosynthesis-related candidate genes from their G. hirsutum orthologs, and the genotyping and phenotyping of a BC3F5 population proved their potential in improving fiber strength and micronaire. Our results contribute to the better understanding of the fiber quality differences between G. barbadense and G. hirsutum and provide novel alternative genes for fiber quality improvement.

1. Introduction

Cotton is an important economic crop which provides natural fiber materials for the textile industry [1]. Gossypium hirsutum, the most widely cultivated cotton species, accounts for more than 90% of the global cotton production because of its high yield and wide applicability. Gossypium barbadense, the other cultivated allotetraploid cotton species, is characterized by its superior fiber quality [2,3]. Breeders have been trying hard to develop cotton varieties with high yield, wide adaptability and superior fiber properties by crossing G. barbadense with G. hirsutum, but it is laborious and inefficient owing to the complex trait segregation of hybrid progenies. A more economic and effective strategy is molecular breeding, including molecular marker-assisted selection, transgene and gene editing, which requires a wide identification of fiber development-related genes and accurate verification of their functions.
Comparative transcriptome analysis has great potential in revealing molecular mechanisms underlying cotton fiber development and identifying candidate genes for fiber quality improvement. Various technologies have been developed to quantify the transcriptome, including microarray [4] and tag-based [5] methods. However, microarray methods have several limitations, including reliance upon the existing gene sequences, high background levels and a limited dynamic range of detection. Tag-based methods are also defective because a significant part of short tags cannot be uniquely mapped to the reference genome. By comparison, RNA-seq (massively parallel cDNA sequencing) has partly eliminated the challenges and provided a far more precise measurement of gene expression levels [6]. The RNA-seq of cotton fibers has been conducted for about ten years. Comparative transcriptome analysis based on RNA-seq has mainly been performed between superior and inferior upland cotton varieties (or lines) [7,8,9,10,11], between mutant (fuzzless, lintless or fuzzless–lintless) and wild-type varieties [12,13,14,15,16,17,18,19] and between chromosome segment substitution lines (a G. hirsutum background with G. barbadense introgression) and the recurrent parent [20,21,22]. These studies have contributed to dissecting cotton fiber development. G. barbadense and G. hirsutum clearly have different fiber properties, and thus a comparison of their fiber transcriptomes should also be an effective way to discover candidate genes for improving fiber quality. Nevertheless, as far as we can see, there are only a few studies that have conducted the comparison of the fiber transcriptomes of G. barbadense and G. hirsutum based on RNA-seq. The fiber transcriptomes of G. barbadense and G. hirsutum at 10 and 22 DPA were sequenced and compared in 2012, and high-quality reads from four libraries were assembled into 46,072 unigenes, functioning as the reference sequences [23]. The transcripts generated from the G. raimondii genome and the ESTs from G. arboreum were integrated to produce a mapping reference, and then the fiber transcriptomes of 10, 15, 18, 21 and 28 DPA were compared within and across genotypes (namely G. barbadense and G. hirsutum) in 2015 [24]. Recently, a series of released allotetraploid cotton whole-genome sequences has made it possible to apply a high-quality mapping reference to comparing the G. barbadense and G. hirsutum fiber transcriptomes. Moreover, the two studies mentioned above put the emphasis on hundreds of differentially expressed genes (DEGs), aiming to reveal the molecular mechanisms underlying cotton fiber development. Obviously, it still has a wide prospect to identify candidate genes by a comprehensive and ingenious comparison of the G. barbadense and G. hirsutum fiber transcriptomes.
Cotton fiber is a highly elongated and thickened unicellular trichome on the ovule surface whose development consists of four distinct but overlapping stages: fiber initiation (lint initiation at ~0 DPA; fuzz initiation at ~4 DPA), elongation (3–20 DPA), SCW biosynthesis (16–40 DPA) and maturation (40–50 DPA) [25,26]. Basically, fiber length is generated through primary cell wall (PCW) biosynthesis in the elongation stage, while the SCW biosynthesis stage forms a solid foundation for fiber strength and micronaire. G. barbadense, compared with G. hirsutum, possesses a higher rate of lint elongation and a prolonged elongation period, which gives rise to a greater length of mature fibers. However, secondary wall thickening in the two cotton species begins at a quite similar time, namely 16–20 DPA in G. barbadense and 16–19 DPA in G. hirsutum [27,28]. Consequently, we sequenced the fiber transcriptomes of initiation (represented by 0 DPA), elongation (represented by 5, 10 and 15 DPA) and SCW biosynthesis (represented by 20, 25 and 30 DPA) of G. barbadense and G. hirsutum in this study. Gene expression profiling was performed based on the G. hirsutum TM-1 genome [29] and subsequently comparative transcriptome analysis was conducted within and across genotypes. In addition to revealing the genetic basis for high-quality cotton fiber formation, more importantly, we further identified elongation-related and SCW biosynthesis-related candidate genes for fiber quality improvement. Transgenic Arabidopsis plants, SNP molecular markers and a BC3F5 population were then applied to validate candidate genes involving cotton fiber development. The identified candidate genes and developed SNP markers can facilitate future molecular breeding programs for improving cotton fiber quality.

2. Results

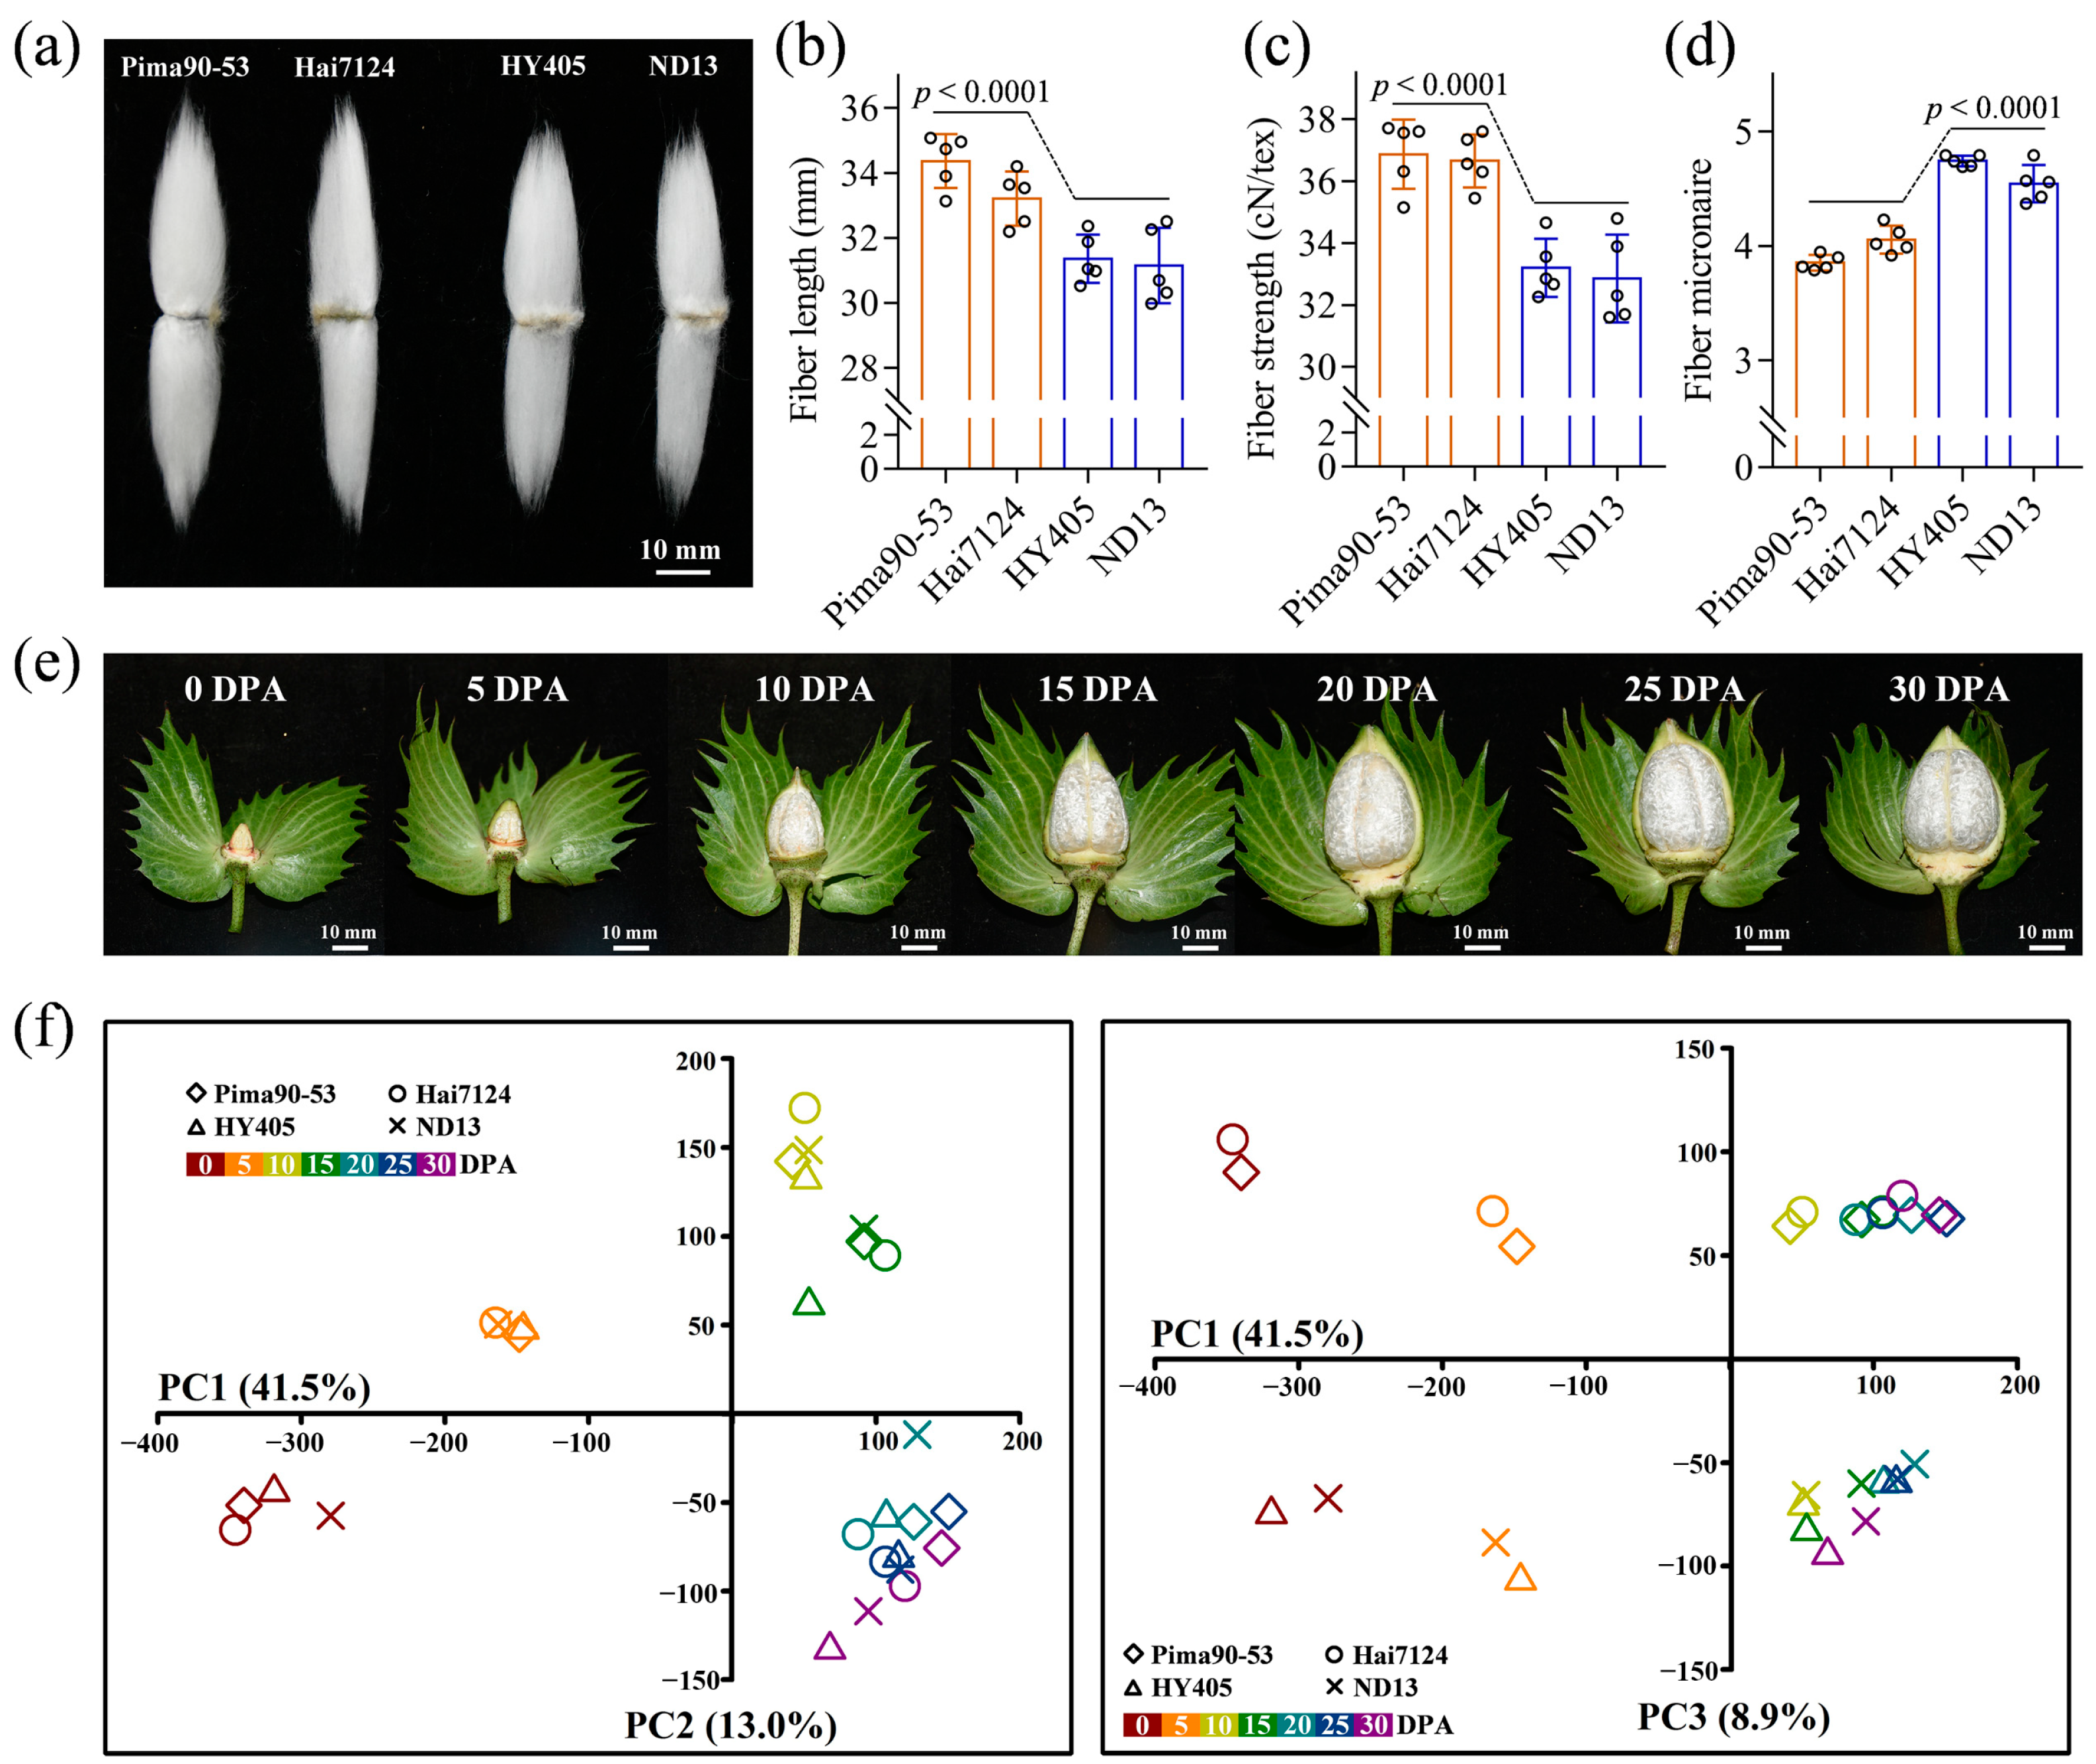
2.1. Overview of Fiber Transcriptomes

In the present study, to identify cotton fiber development-related genes, G. barbadense acc. Pima90-53 and Hai7124 with superior fiber properties and G. hirsutum acc. HY405 and ND13 with good fiber properties but inferior to G. barbadense were selected for comparative transcriptome analysis. Fiber quality analysis showed that the two G. barbadense accessions compared with the two G. hirsutum accessions possessed significantly higher fiber length (i.e., fiber upper-half mean length) and fiber strength and a lower fiber micronaire. Besides that, fiber elongation and fiber uniformity showed no significant differences (Figure 1a–d; Table S1). In total, 28 cDNA libraries from seven timepoints were constructed to perform RNA-seq, including 0, 5, 10, 15, 20, 25 and 30 DPA (Figure 1e). Based on the time course of fiber development [25,26,27,28], 0 DPA (ovule samples) was designated as lint initiation. Moreover, lint elongation was referred to the fiber samples of 5, 10 and 15 DPA, while SCW biosynthesis was characterized using the fiber samples of 20, 25 and 30 DPA. A total of 420, 430, 437 and 414 million clean reads were generated in Pima90-53, Hai7124, HY405 and ND13, respectively. Although multi-mapped reads account for approximately 11% of the clean reads due to the high homology between the At and Dt subgenomes, about 80% of the clean reads were uniquely mapped to the upland cotton TM-1 genome (Table S2). Specifically, the percentages varied from 75.74% to 79.63% in Pima90-53, from 74.50% to 80.03% in Hai7124, from 78.70% to 83.03% in HY405 and from 79.05% to 82.94% in ND13. According to the uniquely mapped reads, gene expression analysis was carried out for each sample, and then we performed principal component analysis (PCA) based on gene expression levels to analyze the correlations between the samples. Analyzed by PC1 and PC2, the samples were classified by development processes regardless of accessions. More specially, the samples of 20, 25 and 30 DPA clustered together, corresponding to the continuous and stable deposition of cellulose during SCW biosynthesis (Figure 1f). Analyzed by PC1 and PC3, the samples of G. barbadense were clearly separated from those of G. hirsutum, suggesting great potential to mine candidate genes for cotton fiber quality improvement by comparative transcriptome analysis.

2.2. Preferentially Expressed Genes during Fiber Elongation in G. barbadense

To identify the genes related to cotton fiber elongation and SCW biosynthesis in G. barbadense, differential expression analysis was conducted, which found a total of 17,473 and 16,538 genes (in Pima90-53 and Hai7124, respectively) to be significantly upregulated or downregulated at 5, 10, 15, 20, 25 and 30 DPA as compared with 0 DPA. Cluster analysis divided these differentially expressed genes into six categories based on expression trends (Figure S1a). By comparison with lint initiation (0 DPA), type I genes were upregulated during lint elongation, type III genes were upregulated during SCW biosynthesis and type II genes showed an upregulated expression at both of these stages. On the contrary, type IV and VI genes exhibited a downregulated expression during lint elongation and SCW biosynthesis, respectively, and type V genes were downregulated at the two stages. Furthermore, the common genes of Pima90-53 and Hai7124 in each category were characterized with GO enrichment analysis to identify the significantly enriched biological processes (Figure S1b). As a result, GO terms including fatty acid metabolic process, cellular carbohydrate metabolic process, plant type secondary cell wall biogenesis and actin cytoskeleton organization were enriched in the upregulated genes, while the downregulated genes were mainly enriched in GO terms involving cell proliferation and differentiation, such as chromatin organization, DNA metabolic process and meristem development. Obviously, the candidate genes promoting fiber elongation and/or SCW biosynthesis could be easily available from the upregulated genes rather than from the downregulated genes that may affect ovule development and fiber initiation.
Differential expression analysis identified 965 and 906 genes, whose expression was upregulated at 5, 10 and 15 DPA in comparison with 0 DPA, in G. barbadense acc. Pima90-53 and Hai7124, respectively (Figure 2a). The common 759 genes were subjected to cluster analysis and subsequently divided into four groups (Figure 2b; Table S3). Although upregulated during fiber elongation, group I containing 55 genes exhibited higher expression levels during SCW biosynthesis, indicating that these genes may play more important roles in SCW thickening. Correspondingly, these genes were enriched in the carbohydrate transport and cellulose biosynthesis processes, based on GO enrichment analysis (Figure 2c). The 86 genes of group II were highly expressed during both fiber elongation and SCW biosynthesis, suggesting a solid foundation involved in cell growth. Roughly, the 272 genes of group III and the 346 genes of group IV possessed similar expression trends, which were preferentially expressed during fiber elongation. Group III genes were mainly enriched in actin cytoskeleton organization, carbohydrate catabolic process, response to salt stress and transmembrane transport, indicating a potential role in cell expansion. Unlike group III genes, members in group IV were upregulated only during fiber elongation, not SCW biosynthesis. GO enrichment analysis showed that a lot of fiber elongation-related processes were enriched in group IV genes, including the S-adenosylmethionine metabolic process, very long-chain fatty acid metabolic process and water transport. Furthermore, group IV genes were divided into three subgroups (IV-I, -II and -III), based on the time at which their expression reached the peak (Figure 2b). The IV-I genes exhibited the highest expression at 5 and 10 DPA and were mainly enriched in the S-adenosylmethionine metabolic process, implying that these genes may create initial conditions for cotton fiber elongation. The expression of the IV-II genes peaked at 10 DPA, and the IV-III genes showed the highest expression at 10 and 15 DPA. Hence, these two subgroups might have contributed to the rapid elongation of fiber cells, which was also supported by the significantly enriched GO terms (Figure 2d).

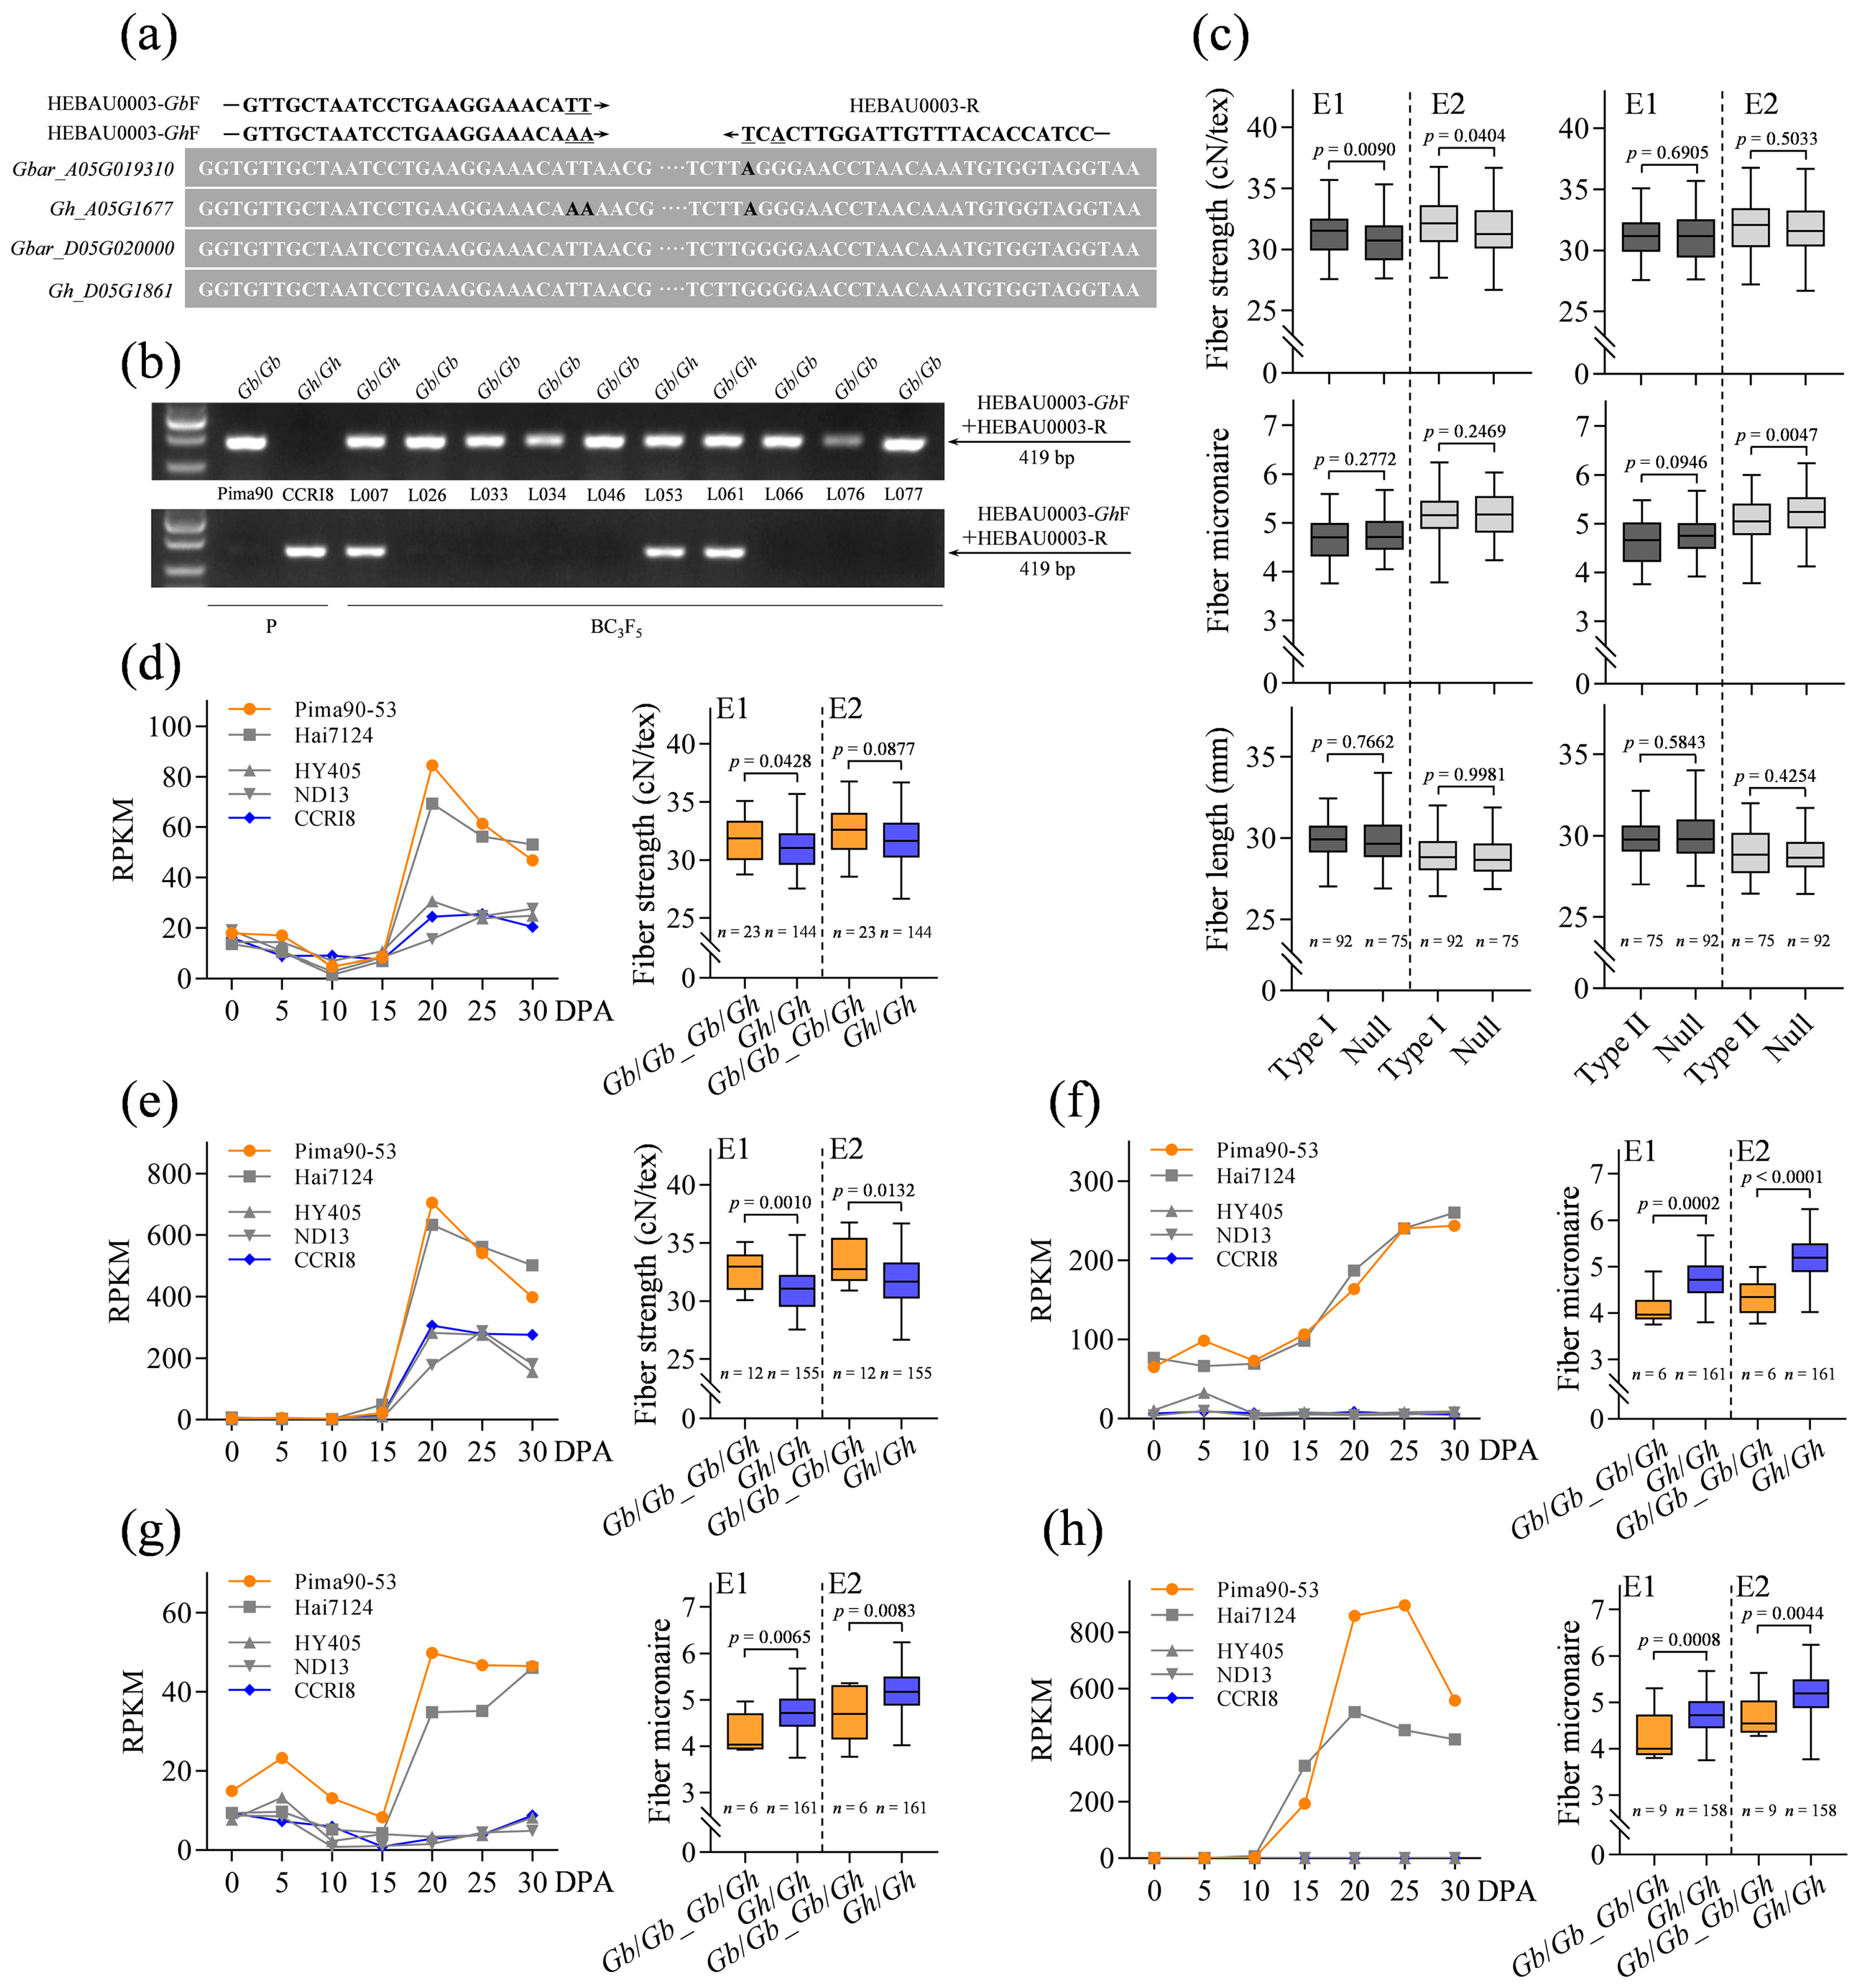
2.3. Identification and Functional Analysis of Fiber Elongation-Related Genes

Considering the deep involvement in cotton fiber elongation, the 346 genes of group IV were further employed and then refined by comparing the G. barbadense and G. hirsutum fiber transcriptomes. As a result, we identified 42 genes whose expression was upregulated in G. barbadense as compared with G. hirsutum during cotton fiber elongation (Figure 2e; Table S4). These genes consisted of 10 IV-I genes, 18 IV-II genes and 14 IV-III genes (Table 1). Among them, the G. hirsutum orthologs Gbar_A11G021290 (3-hydroxyacyl-CoA dehydratase) [30], Gbar_D04G001950 (cytochrome P450; GenBank: AJ606074), Gbar_D05G037750 ((+)-δ-cadinene synthase) [31], Gbar_D11G024050 (glutathione S-transferase; GenBank: AF159229) and Gbar_D12G003220 (SAUR-like auxin-responsive protein; GenBank: KM065453) were cloned in previous studies, as was Gbar_A07G001880 (pectinesterase) [32]. In addition, several genes were found in cotton fiber development-related gene families, such as Gbar_A03G019080 (nonspecific lipid-transfer protein) [33], Gbar_A07G007890 (α-expansin) [34] and Gbar_D08G001620 (dirigent protein) [35].
To further validate the potential roles of the 42 candidate genes in cell elongation, Gbar_A05G037170 and Gbar_A05G020690 driven by a CaMV35S promoter were transferred independently into A. thaliana plants, and then their roles were determined by observing the changes of leaf trichomes and dark-grown hypocotyl cells. The two genes were selected by considering their potential as novel genes related to cotton fiber development. Gbar_A05G037170 (termed GbAAR3) is highly homologous to the AtAAR3 identified in a screen for mutants resistant to an anti-auxin [36]. Encoding a DCN1-like protein, GbAAR3 may regulate cullin neddylation and thus participate in auxin signaling by the SCFTIR1/AFB pathway [37,38]. As expected, transient expression analysis of GbAAR3 fused to green fluorescent protein (GFP) confirmed its nuclear localization (Figure 3a). Two transgenic T3 lines OE2 and OE5 were developed, in which the stable expression of GbAAR3 was confirmed by qRT-PCR (Figure 3b). Arabidopsis leaf trichomes were subsequently measured because they partly share common regulatory mechanisms with cotton fiber cells [39,40,41,42]. As a result, the transgenic OE2 and OE5 plants, compared with WT plants, showed significantly longer trichomes (Figure 3c,d). Moreover, dark-grown hypocotyls were employed because their growth results from cell elongation rather than division [43,44]. Here, five-day-old dark-grown OE2, OE5 and WT seedlings were measured, and then we discovered that the transgenic seedlings had significantly longer hypocotyls (Figure 3e,f). Correspondingly, longer hypocotyl epidermal cells were observed in the transgenic seedlings in a microscopic inspection (Figure 3g). Similarly, Gbar_A05G020690 (named GbTWS1) is homologous to AtTWS1 which encodes a novel small protein and is speculated to affect the functionality of the endoplasmic reticulum [45]. To determine the involvement of GbTWS1 in cell elongation, Arabidopsis GbTWS1-overexpressed T3 lines OE5 and OE7 were generated, and stable expression was confirmed by qRT-PCR and Western blotting (Figure S2a,b). Although the overexpression of GbTWS1 in Arabidopsis plants promoted the elongation of leaf trichomes only slightly, the transgenic seedlings produced significantly longer dark-grown hypocotyl cells and thus longer hypocotyls in comparison with WT seedlings (Figure S2c–e). These results indicate that GbAAR3 and GbTWS1 can promote cell elongation and might have contributed to cotton fiber development and that the 42 elongation-related candidate genes may have good prospects in fiber quality improvement.

2.4. Preferentially Expressed Genes during SCW Biosynthesis in G. barbadense

Differential expression analysis produced 2639 and 2568 genes that were upregulated at 20, 25 and 30 DPA as compared with 0 DPA in G. barbadense acc. Pima90-53 and Hai7124, respectively (Figure 4a). Subsequently, cluster analysis using gene expression data divided the common 2275 genes into five groups (Figure 4b; Table S5). The 466 genes in group I were upregulated during SCW thickening but showed the highest expression during fiber elongation. A lot of GO terms were significantly enriched and mainly classified into five categories: cytoskeleton organization, ATP metabolism, cell wall development, gene expression regulation and transport (Figure S3). The 329 genes in group II exhibited high expression levels during both fiber elongation and SCW thickening. Interestingly, the group II genes were not enriched in biological processes associated with cell wall development, especially the biomacromolecule metabolic process (Figure S4). It was obvious that the biosynthesis of PCW and SCW featured distinct gene networks. The 686 genes in group III were preferentially expressed during SCW thickening and were slightly upregulated during fiber elongation. A number of cell wall development-related processes related to cellulose, hemicellulose and lignin were significantly enriched in the group III genes. Correspondingly, we observed a lot of significantly enriched GO terms involving transport, especially vesicle-mediated transport (Figure S5). The 647 genes in group IV and the 147 genes in group V had similar expression trends, i.e., only upregulated during SCW biosynthesis. The group IV genes were significantly enriched in the metabolic processes of cellulose, xylan, glucuronoxylan, lignin, pectin, arabinan and glycoprotein, which all belong to cell wall macromolecules (Figure S6a,b). However, being different from the group III genes, the group VI members were hardly enriched in transport-related processes. The group V genes showed the highest expression at 30 DPA and thus were more likely to affect cotton fiber maturation (Figure S6c–e). In addition, more GO terms involved in regulating gene expression were significantly enriched in the group I and II genes, presumably because the group III and IV genes were mainly responsible for continuous and stable SCW deposition. Obviously, all the five groups contributed to cotton fiber development based on the principle of coordination and unification (Figure 4c).

2.5. Identification and Functional Analysis of the SCW Biosynthesis-Related Genes

Given the critical roles of the group IV genes in SCW thickening (Figure 4d), the 647 genes were further used to identify candidate genes improving cotton fiber strength and micronaire. By means of comparative transcriptome analysis, 48 genes were filtered from the group IV genes which were upregulated in G. barbadense as compared with G. hirsutum during SCW biosynthesis (Figure 4e). The 48 candidate genes were subsequently divided into two categories based on their expression trends (Figure 4f). When the SCW biosynthesis stage was compared with the fiber initiation stage, the 25 genes of type I (Table 2 and Table S6) were upregulated in both G. barbadense and G. hirsutum, but the 23 genes of type II (Table 3 and Table S7) were only upregulated in G. barbadense. A number of well-known cell wall development-related genes were observed, including Gbar_A10G023160 (UDP-Xyl synthase) [46], Gbar_A11G034900 (laccase) [47], Gbar_A13G023580 (fasciclin-like arabinogalactan protein) [48], Gbar_D10G011020 (xylan glucuronosyltransferase) [49], Gbar_D10G018450 (β-xylosidase) [50], Gbar_A05G018470 (endo-β-1, 4-glucanase) [51], Gbar_A07G004070 (cellulose synthase) [52] and Gbar_D03G007510 (cellulose synthase) [52].
To further verify the involvement of the 48 candidate genes in fiber quality improvement, we performed the genotyping and phenotyping of a BC3F5 population developed from donor parent G. barbadense acc. Pima90-53 and recipient parent G. hirsutum acc. CCRI8, and then determined whether the introgression of the G. barbadense candidate genes into G. hirsutum could improve fiber properties. For the genotyping, SNP molecular markers of 39 candidate genes were successfully developed, which can distinguish the orthologous genes between G. barbadense and G. hirsutum accurately and easily (Figure S7). The primers of molecular markers were designed based on the SNPs between G. barbadense and G. hirsutum and the SNPs between the At and Dt subgenomes (Figure 5a; Table S8). Subsequently, in the BC3F5 population, alleles were detected at each locus, showing three types of genotypes: Gb/Gb homozygote, Gh/Gh homozygote and Gb/Gh heterozygote (Figure 5b). The phenotype data collected from Luntai (E1) and Qingxian (E2) were thus compared based on different genotypes. Interestingly enough, the type I SCW biosynthesis-related candidate genes enhanced fiber strength and did not impair fiber length and micronaire while the type II candidate genes were much more likely to improve fiber micronaire (Figure 5c; Figure S8). Gbar_A05G019310 belonging to type I shows similarity to AtIDD1 that encodes a C2H2 zinc finger protein and mediates GA signaling. GA has been proposed to promote SCW deposition in cotton fiber cells [53]. Here, Gbar_A05G019310 was preferentially expressed during SCW biosynthesis in G. barbadense, and its orthologous gene in G. hirsutum exhibited similar expression patterns but lower transcript levels, supported by the current transcriptome data and a supplementary RNA-seq project of G. hirsutum acc. CCRI8 (Figure 5d; Table S6). As expected, it contributed to fiber strength improvement when Pima90-53 genome fragments containing Gbar_A05G019310 were recombined into the CCRI8 genome. Similarly, another type I gene Gbar_A05G025000, encoding a hypothetical transmembrane protein with unknown functions, also enhanced fiber strength (Figure 5e). Comparative phenotype analysis also identified three type II genes Gbar_A06G015550 (Figure 5f), Gbar_A13G023450 (Figure 5g) and Gbar_D05G026930 (Figure 5h) that improved fiber micronaire significantly. Gbar_A06G015550 encodes the aldehyde dehydrogenase associated with cellular responses to oxidative stress [54]. Encoding the putative epoxide hydrolase, Gbar_A13G023450 is potentially involved in transforming epoxide-containing fatty acids and thereby cutin biosynthesis [55]. Gbar_D05G026930 encodes an uclacyanin-like blue copper-binding protein that has been implicated in lignin biosynthesis [56,57]. These kinds of genes are generally considered to involve stress responses, and thus the results provide a novel alternative way to improve cotton fiber quality.

3. Discussion

In the present study, we identified 42 and 48 candidate genes for cotton quality improvement during fiber elongation and SCW biosynthesis, respectively. Among the 42 elongation-related candidate genes, some genes, e.g., α-expansin and pectinesterase, have been widely proposed to affect cotton fiber development (Table 1). Therefore, the identified candidate genes have paved alternative ways for fiber length improvement. Gbar_A13G012640 from IV-I, encoding a DUF538 domain-containing protein, is homologous to AtSVB (AT1G56580), mutants of which exhibit smaller trichomes. Arabidopsis leaf trichomes share similar developmental mechanisms with fiber cells of cotton [39,40,41,42], and thus Gbar_A13G012640 might be responsible for cotton fiber development. ROS (reactive oxygen species) signaling is well-known to be crucial for cell elongation [58]. Strikingly, two highly homologous genes Gbar_A11G014750 and Gbar_D11G015570 encode a cysteine-rich STOMAGEN peptide, showing great potential in ROS perception [59]. The two genes were predominantly expressed during early stages of fiber elongation (Figure 2b), and thus it is conceivable that they might contribute to initiating the elongation process. ROS, at high concentrations, can lead to cell wall stiffening and thus suppress extension [60]. Not surprisingly, two IV-II candidate genes Gbar_D11G024050 (glutathione S-transferase) [61] and Gbar_D12G026630 (heat shock protein) [62], showing the highest expression at 10 DPA, may play a significant role in ROS homeostasis and help to maintain the rapid elongation of fiber cells. In addition, Gbar_A07G023310 from IV-III, encoding formate dehydrogenase, is also involved in scavenging ROS, as it produces NADH [63]. Remarkably, several genes participating in the metabolism of S-adenosylmethionine stood out, including Gbar_A07G013810 (S-adenosylmethionine synthase), Gbar_A09G015680 (S-adenosylmethionine synthase), Gbar_D10G014320 (methylenetetrahydrofolate reductase) and Gbar_A06G013440 (cystathionine β-synthase) [64]. S-adenosylmethionine not only provides the methyl group for the majority of methylation reactions, but also enters the ethylene and polyamine biosynthetic pathways. Obviously, it is worth trying to dissect the roles of the S-adenosylmethionine metabolism-related genes in fiber development. Besides that, the fact that GbAAR3 (from IV-III) promoted cell elongation in Arabidopsis plants raises our interest on cullin neddylation as well as SCFTIR1/AFB-mediated auxin signaling in cotton fiber elongation [37,38] reinforced by a SAUR-like auxin-responsive protein (Gbar_D12G003220 from IV-III).
Among the 48 SCW biosynthesis-related candidate genes, a number of well-known cell wall development-related genes were observed and presented. Here, we discuss the functions of other genes which provide novel potential ways for fiber quality improvement. Unlike vascular cells, cotton fibers contain only a small amount of lignin whose role in fiber development has been neglected. Recent studies, however, have shown that lignin-like phenolics can affect fiber quality substantially in a negative pattern during elongation and in a positive pattern during SCW thickening [65,66]. Type I candidate gene Gbar_A11G034900 encodes laccase that is responsible for the final stage of lignin polymerization [47]. Having higher expression levels than its G. hirsutum ortholog during SCW thickening (Figure 4f), Gbar_A11G034900 may contribute to forming stronger and thinner fiber cells. Uclacyanin proteins have been considered to regulate lignin biosynthesis [56,57], but the mechanisms remain unclear. Hence, the fiber fineness improvement caused by the introgression of type II candidate gene Gbar_D05G026930 encoding an uclacyanin-like blue copper-binding protein could be due to an increase in lignin/lignin-like phenolics (Figure 5h). Recent advances have revealed that plant hormones play a pivotal role in regulating cotton fiber development, mainly focusing on fiber initiation and elongation. Here, type I gene Gbar_A05G019310 shows high homology to AtIDD1 [67,68] and thus is assumed to mediate GA signaling. The fact that Gbar_A05G019310 can enhance fiber strength (Figure 5d) highlights the importance of the IDD (INDETERMINATE DOMAIN) family as well as GA signaling in SCW biosynthesis. Another type I gene Gbar_A05G022250 encodes the EXORDIUM protein that has been proposed to participate in BR signaling [69]. BR signaling appears likely to change the expression of cellulose synthase genes and thus affects SCW deposition in cotton fiber [70]. Intriguingly, we identified two cellulose synthase genes Gbar_A07G004070 and Gbar_D03G007510, suggesting a possible signaling module involved in BRs, EXORDIUM protein and cellulose synthase. The ABC transporter plays a central role in transporting auxin, ABA and cytokinin. Gbar_A10G008340 from type II, encoding the ABCG-type transporter, is homologous to AtABCG40 that exhibits ABA uptake activity [71]. Another type II gene Gbar_A13G001740 encodes the auxin influx transporter that is responsible for importing auxin into cells [38]. Obviously, phytohormones play a vital role in SCW biosynthesis, and their crosstalk and transcriptional regulation may contribute to stronger and thinner fibers in G. barbadense. Hormonal regulation of transcription is involved in the ubiquitin/26S proteasome pathway, such as Aux/IAA degradation in auxin signaling [38] and DELLA degradation in GA signaling [68]. Gbar_A05G004360 from type I encodes the putative F-box component of the SCF E3 ligase complex, while type II gene Gbar_D06G019950 encodes RING-type E3 ligase. It is particularly interesting to investigate whether these two genes act as key regulators of hormone signaling in plants.
In this study, genetic experiments were conducted to further confirm the roles of the candidate genes in cotton fiber development. By means of homology analysis, we speculated that GbAAR3, a type IV-III elongation-related candidate gene, could regulate auxin signaling through the cullin neddylation-mediated SCFTIR1/AFB pathway [36,37,38]. GbTWS1 from IV-II, which is implicated in the functioning of the endoplasmic reticulum, might affect fatty acid biosynthesis and thus regulate the organization of the endomembrane system [45]. The fact that overexpression of GbAAR3 (Figure 3) and GbTWS1 (Figure S2) can promote cell elongation in Arabidopsis has increased the importance of candidate genes in fiber length enhancement of cotton. For the SCW biosynthesis-related candidate genes, we developed SNP molecular markers to distinguish the candidate genes from their G. hirsutum orthologs, and then the genotyping and phenotyping of a BC3F5 population were conducted to evaluate the influence on cotton fiber quality generated by the introgression of the candidate genes into G. hirsutum. Although type I candidate genes enhanced fiber strength as a whole, several members showed pleiotropic effects. For instance, Gbar_D06G000230, a β-tubulin gene, exhibited dual functions in improving fiber strength and fiber micronaire (Figure S8c), presumably because cortical microtubules play a vital role in cellulose microfibril deposition [72]. GA signaling in general promotes both elongation and SCW development in cotton fiber cells [73]. Correspondingly, the proposed GA signaling-related gene Gbar_A05G019310 enhanced not only fiber strength but also length (Figure S8a). Similarly, the hypothetical transmembrane protein Gbar_A05G025000 also improved fiber length and strength (Figure S8b). Furthermore, Gbar_A05G019310 fell into FUqQtlc05_1b [74], and Gbar_A05G025000 fell around QTLClust_LEN_5_3 [75] when analyzing the QTLs reported for fiber length. In this light, we can infer that some SCW biosynthesis-related genes also contribute to fiber elongation, especially because a considerable portion of SCW thickening occurs before fiber elongation ceases in both G. barbadense [28] and G. hirsutum [27]. Type II gene Gbar_A06G015550 encoding aldehyde dehydrogenase can oxidize a wide range of reactive and toxic aldehydes and meanwhile produce NAD(P)H, a highly effective antioxidant [54]. Hence, BC3F5 lines with the introgression of Gbar_A06G015550 may enhance the capacity for the management of ROS and thus showed the enhancement of fiber length besides the abovementioned fiber micronaire improvement (Figure S8d). Interestingly enough, another type II gene Gbar_A13G023450 seemed to simultaneously improve fiber length, strength and micronaire (Figure S8e). Gbar_A13G023450 encodes epoxide hydrolase and is likely responsible for cutin biosynthesis [55]. Cutin is the main constituent of the cuticle, which is the outermost layer of cotton fibers and provides a physical barrier, but to date, there is little evidence that cutin biosynthesis affects cotton fiber development [76]. More genetic experiments by overexpressing and knocking out Gbar_A13G023450 need to be performed to further confirm its remarkable functions. Taken together, the BC3F5 population analysis proved the importance of the candidate genes in fiber quality improvement and highlighted several pleiotropic genes. Nevertheless, it is worth noting that some candidate genes failed to be characterized because of no or little corresponding lines and that the influence on cotton fiber quality may be caused by candidate genes and their closely linked genes. A larger population will be applied to overcome this problem, and we will investigate the functions of the candidate genes by means of CRISPR/Cas9-mediated gene editing in future efforts.

4. Materials and Methods

4.1. Plant Materials and Growth Conditions

The cotton plant materials used in this study included G. barbadense acc. Pima90-53 [77] and Hai7124 [3] and G. hirsutum acc. HY405 [35], ND13 [35] and CCRI8. Pima90-53 (accession number: M210080; introduced from the USA), Hai7124 (M210054; Jiangsu, China) and CCRI8 (M110553; Henan, China) were collected and preserved with the appropriate permissions by the National Medium-Term Gene Bank of Cotton in China. HY405 (G100937; Hebei, China) and ND13 (G100728; Hebei, China) were collected and preserved by Hebei Agricultural University. All the necessary permissions for planting and investigating these cultivars were obtained from Hebei Agricultural University and the National Medium-Term Gene Bank of Cotton in China. The collection and research of these cultivars complied with the Convention on International Trade in Endangered Species of Wild Fauna and Flora. A BC3F5 population consisting of 167 lines was constructed and used in this study. Firstly, G. barbadense acc. Pima90-53 as the male parent was crossed with G. hirsutum acc. CCRI8 to generate an F1 hybrid in Baoding, Hebei Province, China, during summer 2009. The hybrid plants as the female parent were then continuously backcrossed with CCRI8 for three generations to produce BC3F1 plants in Baoding from 2010 to 2012. Eventually, to raise BC3F5 plants, the BC3F1 plants were self-pollinated for four generations in summer 2013 (Baoding), winter 2013 (Sanya, Hainan, China), summer 2014 (Baoding) and summer 2015 (Baoding). Molecular marker-assisted selection was performed at the BC3F1–BC3F3 generations to ensure the introgression of G. barbadense into G. hirsutum.
For transcriptome sequencing, Pima90-53, Hai7124, HY405 and ND13 were grown at the cotton breeding center (38°45′ N, 115°29′ E) in Baoding, with a warm temperate continental monsoon climate, from late April to late October in 2014. Each plot consisted of six rows of 7 m in length containing 20–22 plants per row, with 30–35 cm between the plants within each row and 80 cm between the rows. The 167 BC3F5 lines and their parents were planted in a randomized complete block design including three replications in Qingxian, Hebei Province (38°65′ N, 116°91′ E), with a temperate semi-humid continental monsoon climate, and in Luntai, Xinjiang Uygur Autonomous Region (41°46′ N, 84°14′ E), with a warm temperate continental arid climate, in 2016. In Qingxian, each plot contained one row of 7 m in length, with 20–22 plants per row, 30–35 cm between the plants within each row and 76 cm between the rows, whereas in Luntai, each plot contained one row of 7 m in length containing 60–66 plants per row, with about 10 cm between the plants within each row and 76 cm between the rows. The population materials were sown in mid- to late April and were harvested in mid- to late October. All field management including watering, weed management and fertilization was performed according to the local production practices throughout the growth period. A. thaliana (Columbia ecotype) wild-type and transgenic plants were grown in pots containing sterile vermiculite in a greenhouse (22 °C, 16 h photoperiod, 70% relative humidity) at Hebei Agricultural University, with Hoagland’s nutrient solution added weekly.

4.2. Transcriptome Sequencing

Flowers of G. barbadense acc. Pima90-53 and Hai7124 and G. hirsutum acc. HY405 and ND13 were tagged at the flowering stage (from mid-July to late August). For each accession, ovule samples of 0 DPA and fiber samples of 5, 10, 15, 20, 25 and 30 DPA were collected independently from cotton bolls, frozen immediately in liquid nitrogen and ground mechanically to a fine powder. For each timepoint, samples from multiple cotton plants were pooled to minimize variations. Total RNA was then isolated using an RNAprep pure Plant Kit (TIANGEN, Beijing, China). Finally, 28 cDNA libraries were constructed using a NEBNext Ultra RNA Library Prep Kit for Illumina (NEB, Ipswich, MA, USA) at the Novogene Bioinformatics Institute, Beijing, China. Briefly, mRNA was first purified and fragmented. Secondly, cDNA was synthesized using a random hexamer primer, and the sequencing adaptor was ligated. Thirdly, fragments containing an insert of 150–200 bp were selected, and PCR amplification was performed.
An Illumina Hiseq 2500 platform was then used for the sequencing, and 125 bp paired-end reads were generated. To generate clean reads, raw data were first processed by removing the adapter- or polyN-containing reads and the reads with low quality. The clean reads were then aligned to the G. hirsutum TM-1 genome [29] using TopHat2 (version 2.0.12; Toronto, Ontario) [78] with the threshold of two mismatches, and the mapped reads were assembled by Cufflinks (version 2.1.1; Dallas, Texas, United States) [79]. HTSeq (version 0.6.1; Wilmington, Delaware, United States) [80] was used to count the reads mapped to each gene, and subsequently RPKM (reads per kilobase of exon model per million mapped reads) was applied to estimate the expression levels. After the read counts were adjusted using the edgeR package (version 3.0.8; Wilmington, Delaware, United States) [81], differential expression analysis was performed using the DEGSeq package (version 1.12.0; Wilmington, Delaware, United States) [82], with the criteria of |log2(fold change)| > 1 and Q-value < 0.005. GO enrichment analysis was implemented using KOBAS v3.0 [83]. The p-value generated from the hypergeometric test was adjusted via the Benjamini–Hochberg method, generating the Q-value. GO terms with the Q-value < 0.05 were considered significantly enriched.

4.3. Functional Analysis of the Elongation-Related Candidate Genes

The functional identification of cotton fiber elongation-related candidate genes in A. thaliana plants was conducted using the methods described previously [35]. To be specific, the coding sequence of candidate genes was cloned from fibers of G. barbadense acc. Pima90-53 and inserted into the Gateway pDONR207 vector to generate an entry clone. The gene clone was then recombined into the Gateway pGWB414 vector to construct a constitutive overexpression (OE) system under the control of a CaMV35S promoter. The OE system was transferred with an Agrobacterium-mediated method into A. thaliana Columbia ecotype plants, and subsequently the transgenic plants were confirmed by kanamycin-resistant selection and PCR detection. To observe the changes of trichomes, the fifth rosette leaves of four-week-old A. thaliana wild-type (WT) and OE plants (T3 homozygous lines) were harvested, decolorized by ethanol and photographed with an Olympus BX51 microscope (Tokyo, Japan). The longest branch of about 150 legible trichomes was measured using the ImageJ software [84] in each line. To compare dark-grown hypocotyls, the seeds of A. thaliana WT and OE plants were sterilized and then grown in vertical plates (1/2 MS medium, 0.9% agar and pH 5.8) under the conditions of 22 °C and continuous darkness. Five-day-old seedlings were photographed with a professional Epson V800 scanner (Nagano, Japan), and their hypocotyls were then measured using the ImageJ software. Stained with propidium iodide (PI), the seedlings used above were observed using an Olympus FV10i laser scanning microscope (Tokyo, Japan) to determine the epidermal cells of the hypocotyls. The GraphPad Prism software (San Diego, CA, USA) was employed to conduct a two-tailed t-test, and p-values < 0.05 were considered statistically significantly different. To determine the subcellular localization, the gene clone was recombined into the Gateway pEarleyGate103 vector to express the target protein with a C-terminal GFP fusion. The GFP-fused target protein and GFP as a control were transiently expressed in onion epidermal cells by means of a Bio-Rad PDS-1000/He system (Hercules, CA, USA). Incubated on an MS agar medium for 24 h in continuous darkness, the transformed cells were observed and photographed with an Olympus BX51 microscope (Tokyo, Japan).

4.4. Functional Identification of the SCW Biosynthesis-Related Candidate Genes

The BC3F5 population was employed to determine the involvement of the SCW biosynthesis-related candidate genes in fiber quality improvement. Twenty mature bolls of each accession (167 BC3F5 lines and their parents) were harvested from the middle fruiting branches of cotton plants, and the phenotyping of fiber quality traits including length, strength, micronaire, elongation and uniformity was performed using 15 g fiber samples on an Uster HVI 1000 system under environmental conditions of 20 °C and 65% relative humidity. For genotyping, fresh leaf tissue of each accession was used for genomic DNA isolation using a modified CTAB method [85]. To differentiate the SCW biosynthesis-related candidate genes from their G. hirsutum orthologs, a simple and cost-effective tri-primer AS-PCR [86] assay was employed based on in silico single-nucleotide polymorphism (SNP) identification. For each candidate gene locus, the 3’ end of primers P1 and P2 was designed for the SNP between G. barbadense and G. hirsutum, and the 3’ end of a third primer P3, common to both species, was designed for the SNP between the At and Dt subgenomes to avoid effects from highly homologous genes. The G. barbadense-specific primer pair (P1 and P3) and the G. hirsutum-specific primer pair (P2 and P3) were each used for population genotyping. The Gb/Gb homozygote showed PCR products only in P1–P3, the Gh/Gh homozygote showed PCR products only in P2 and P3 and the Gb/Gh heterozygote showed PCR products in both primer pairs. To determine the influence on fiber quality with the introgression of the candidate genes, the phenotype data of accessions with the Gh/Gh genotype were compared with those of accessions with the Gb/Gb or Gb/Gh genotype. The significance of difference was analyzed with a two-tailed t-test.

5. Conclusions

In the present study, we highlighted a batch of genes preferentially expressed during fiber elongation and SCW biosynthesis, and thus further revealed the genetic basis underlying high-quality fiber formation. By comparative transcriptome analysis between G. barbadense and G. hirsutum, we finally identified 42 elongation-related and 48 SCW biosynthesis-related candidate genes, whose potential roles were then confirmed by ectopic overexpression and SNP marker-based BC3F5 population analysis, respectively. These findings not only provide valuable information for the understanding of cotton fiber development, but also credibly contribute to cotton breeding for fiber quality improvement.

Supplementary Materials

The following supporting information can be downloaded at: https://www.mdpi.com/article/10.3390/ijms24098293/s1.

Author Contributions

Z.M., X.W. and G.Z. conceived the project. Z.L., Z.S. and Y.Z. performed the research and analyzed the data. Y.Z., Q.G., C.M. and G.W. contributed to the bioinformatics analysis. Z.L., B.C., N.W. and Y.L. collected the RNA-seq samples. B.C., H.K., M.Z., L.C. and L.W. grew the experimental materials. Z.L. and Z.S. wrote the manuscript. Z.M. and X.W. revised the manuscript. All authors read the final manuscript and approved submission. All authors have read and agreed to the published version of the manuscript.

Funding

This study was financially supported by Hebei Natural Science Foundation (C2022204205), the National Key Research and Development Program of China (2022YFF1001403), the Key Research and Development Program of Hebei Province (21326314D) and the Projects of the National Plan for Shennong Talents, National Top Talent and Hebei Top Talent. The authors are grateful to colleagues worldwide for releasing cotton genomic data.

Institutional Review Board Statement

Not applicable.

Informed Consent Statement

Not applicable.

Data Availability Statement

The data presented in this study are available within the article and the supplementary materials. The raw RNA-seq data have been deposited in the Genome Sequence Archive (https://bigd.big.ac.cn/gsa; PRJCA014806 (accessed on 26 April 2023)) and are available from the corresponding author on reasonable request.

Conflicts of Interest

The authors declare no conflict of interest.

References

  1. Chen, Z.J.; Scheffler, B.E.; Dennis, E.; Triplett, B.A.; Zhang, T.; Guo, W.; Chen, X.; Stelly, D.M.; Rabinowicz, P.D.; Town, C.D.; et al. Toward sequencing cotton (Gossypium) genomes. Plant Physiol. 2007, 145, 1303–1310. [Google Scholar] [CrossRef] [PubMed]
  2. Wang, M.; Tu, L.; Yuan, D.; Zhu, D.; Shen, C.; Li, J.; Liu, F.; Pei, L.; Wang, P.; Zhao, G.; et al. Reference genome sequences of two cultivated allotetraploid cottons Gossypium hirsutum and Gossypium barbadense. Nat. Genet. 2019, 51, 224–229. [Google Scholar] [CrossRef] [PubMed]
  3. Hu, Y.; Chen, J.; Fang, L.; Zhang, Z.; Ma, W.; Niu, Y.; Ju, L.; Deng, J.; Zhao, T.; Lian, J.; et al. Gossypium barbadense and Gossypium hirsutum genomes provide insights into the origin and evolution of allotetraploid cotton. Nat. Genet. 2019, 51, 739–748. [Google Scholar] [CrossRef] [PubMed]
  4. Malone, J.H.; Oliver, B. Microarrays, deep sequencing and the true measure of the transcriptome. BMC Biol. 2011, 9, 34. [Google Scholar] [CrossRef]
  5. Vega-Sánchez, M.E.; Gowda, M.; Wang, G.L. Tag-based approaches for deep transcriptome analysis in plants. Plant Sci. 2007, 173, 371–380. [Google Scholar] [CrossRef]
  6. Wang, Z.; Gerstein, M.; Snyder, M. RNA-Seq: A revolutionary tool for transcriptomics. Nat. Rev. Genet. 2009, 10, 57–63. [Google Scholar] [CrossRef]
  7. Nigam, D.; Kavita, P.; Tripathi, R.K.; Ranjan, A.; Goel, R.; Asif, M.; Shukla, A.; Singh, G.; Rana, D.; Sawant, S.V. Transcriptome dynamics during fibre development in contrasting genotypes of Gossypium hirsutum L. Plant Biotechnol. J. 2014, 12, 204–218. [Google Scholar] [CrossRef]
  8. Ma, J.; Jiang, Y.; Pei, W.; Wu, M.; Ma, Q.; Liu, J.; Song, J.; Jia, B.; Liu, S.; Wu, J.; et al. Expressed genes and their new alleles identification during fibre elongation reveal the genetic factors underlying improvements of fibre length in cotton. Plant Biotechnol. J. 2022, 20, 1940–1955. [Google Scholar] [CrossRef]
  9. Islam, M.S.; Fang, D.D.; Thyssen, G.N.; Delhom, C.D.; Liu, Y.; Kim, H.J. Comparative fiber property and transcriptome analyses reveal key genes potentially related to high fiber strength in cotton (Gossypium hirsutum L.) line MD52ne. BMC Plant Biol. 2016, 16, 36. [Google Scholar] [CrossRef]
  10. Zou, X.; Liu, A.; Zhang, Z.; Ge, Q.; Fan, S.; Gong, W.; Li, J.; Gong, J.; Shi, Y.; Tian, B.; et al. Co-expression network analysis and hub gene selection for high-quality fiber in upland cotton (Gossypium hirsutum) using RNA sequencing analysis. Genes 2019, 10, 119. [Google Scholar] [CrossRef]
  11. Qin, Y.; Sun, H.; Hao, P.; Wang, H.; Wang, C.; Ma, L.; Wei, H.; Yu, S. Transcriptome analysis reveals differences in the mechanisms of fiber initiation and elongation between long- and short-fiber cotton (Gossypium hirsutum L.) lines. BMC Genom. 2019, 20, 633. [Google Scholar] [CrossRef]
  12. Naoumkina, M.; Thyssen, G.N.; Fang, D.D.; Hinchliffe, D.J.; Florane, C.; Yeater, K.M.; Page, J.T.; Udall, J.A. The Li2 mutation results in reduced subgenome expression bias in elongating fibers of allotetraploid cotton (Gossypium hirsutum L.). PLoS ONE 2014, 9, e90830. [Google Scholar] [CrossRef]
  13. Naoumkina, M.; Thyssen, G.N.; Fang, D.D. RNA-seq analysis of short fiber mutants Ligon-lintless-1 (Li1) and -2 (Li2) revealed important role of aquaporins in cotton (Gossypium hirsutum L.) fiber elongation. BMC Plant Biol. 2015, 15, 65. [Google Scholar] [CrossRef]
  14. Liang, W.; Fang, L.; Xiang, D.; Hu, Y.; Feng, H.; Chang, L.; Zhang, T. Transcriptome analysis of short fiber mutant Ligon lintless-1 (Li1) reveals critical genes and key pathways in cotton fiber elongation and leaf development. PLoS ONE 2015, 10, e0143503. [Google Scholar] [CrossRef]
  15. Ma, Q.F.; Wu, C.H.; Wu, M.; Pei, W.F.; Li, X.L.; Wang, W.K.; Zhang, J.; Yu, J.W.; Yu, S.X. Integrative transcriptome, proteome, phosphoproteome and genetic mapping reveals new aspects in a fiberless mutant of cotton. Sci. Rep. 2016, 6, 24485. [Google Scholar] [CrossRef]
  16. Naoumkina, M.; Bechere, E.; Fang, D.D.; Thyssen, G.N.; Florane, C.B. Genome-wide analysis of gene expression of EMS-induced short fiber mutant Ligon lintless-y (liy) in cotton (Gossypium hirsutum L.). Genomics 2017, 109, 320–329. [Google Scholar] [CrossRef]
  17. Hu, H.; Wang, M.; Ding, Y.; Zhu, S.; Zhao, G.; Tu, L.; Zhang, X. Transcriptomic repertoires depict the initiation of lint and fuzz fibres in cotton (Gossypium hirsutum L.). Plant Biotechnol. J. 2018, 16, 1002–1012. [Google Scholar] [CrossRef]
  18. Salih, H.; Gong, W.; He, S.; Xia, W.; Odongo, M.R.; Du, X. Long non-coding RNAs and their potential functions in Ligon-lintless-1 mutant cotton during fiber development. BMC Genom. 2019, 20, 661. [Google Scholar] [CrossRef]
  19. Liu, X.; Moncuquet, P.; Zhu, Q.H.; Stiller, W.; Zhang, Z.; Wilson, I. Genetic identification and transcriptome analysis of lintless and fuzzless traits in Gossypium arboreum L. Int. J. Mol. Sci. 2020, 21, 1675. [Google Scholar] [CrossRef]
  20. Li, P.T.; Wang, M.; Lu, Q.W.; Ge, Q.; Rashid, M.H.O.; Liu, A.Y.; Gong, J.W.; Shang, H.H.; Gong, W.K.; Li, J.W.; et al. Comparative transcriptome analysis of cotton fiber development of Upland cotton (Gossypium hirsutum) and Chromosome Segment Substitution Lines from G. hirsutum × G. barbadense. BMC Genom. 2017, 18, 705. [Google Scholar] [CrossRef]
  21. Lu, Q.; Shi, Y.; Xiao, X.; Li, P.; Gong, J.; Gong, W.; Liu, A.; Shang, H.; Li, J.; Ge, Q.; et al. Transcriptome analysis suggests that chromosome introgression fragments from Sea Island cotton (Gossypium barbadense) increase fiber strength in Upland cotton (Gossypium hirsutum). G3-Genes Genom. Genet. 2017, 7, 3469–3479. [Google Scholar] [CrossRef] [PubMed]
  22. Song, Z.; Chen, Y.; Zhang, C.; Zhang, J.; Huo, X.; Gao, Y.; Pan, A.; Du, Z.; Zhou, J.; Zhao, Y.; et al. RNA-seq reveals hormone-regulated synthesis of non-cellulose polysaccharides associated with fiber strength in a single-chromosomal-fragment-substituted upland cotton line. Crop J. 2020, 8, 273–286. [Google Scholar] [CrossRef]
  23. Lacape, J.M.; Claverie, M.; Vidal, R.O.; Carazzolle, M.F.; Guimaraes Pereira, G.A.; Ruiz, M.; Pre, M.; Llewellyn, D.; Al-Ghazi, Y.; Jacobs, J.; et al. Deep sequencing reveals differences in the transcriptional landscapes of fibers from two cultivated species of cotton. PLoS ONE 2012, 7, e48855. [Google Scholar] [CrossRef] [PubMed]
  24. Tuttle, J.R.; Nah, G.; Duke, M.V.; Alexander, D.C.; Guan, X.; Song, Q.; Chen, Z.J.; Scheffler, B.E.; Haigler, C.H. Metabolomic and transcriptomic insights into how cotton fiber transitions to secondary wall synthesis, represses lignification and prolongs elongation. BMC Genom. 2015, 16, 477. [Google Scholar] [CrossRef]
  25. Zhang, D.; Zhang, T.; Sang, Z.; Guo, W. Comparative development of lint and fuzz using different cotton fiber-specific developmental mutants in Gossypium hirsutum. J. Integr. Plant Biol. 2007, 49, 1038–1046. [Google Scholar] [CrossRef]
  26. Haigler, C.H.; Betancur, L.; Stiff, M.R.; Tuttle, J.R. Cotton fiber, a powerful single-cell model for cell wall and cellulose research. Front. Plant Sci. 2012, 3, 104. [Google Scholar] [CrossRef]
  27. Jareczek, J.J.; Grover, C.E.; Wendel, J.F. Cotton fiber as a model for understanding shifts in cell development under domestication. Front. Plant Sci. 2023, 14, 1146802. [Google Scholar] [CrossRef]
  28. Schubert, A.M.; Benedict, C.R.; Gates, C.E.; Kohel, R.J. Growth and development of the lint fibers of Pima S-4 cotton. Crop Sci. 1976, 16, 539–543. [Google Scholar] [CrossRef]
  29. Zhang, T.; Hu, Y.; Jiang, W.; Fang, L.; Guan, X.; Chen, J.; Zhang, J.; Saski, C.A.; Scheffler, B.E.; Stelly, D.M.; et al. Sequencing of allotetraploid cotton (Gossypium hirsutum L. acc. TM-1) provides a resource for fiber improvement. Nat. Biotechnol. 2015, 33, 531–537. [Google Scholar] [CrossRef]
  30. Wang, X.C.; Li, Q.; Jin, X.; Xiao, G.H.; Liu, G.J.; Liu, N.J.; Qin, Y.M. Quantitative proteomics and transcriptomics reveal key metabolic processes associated with cotton fiber initiation. J. Proteom. 2015, 114, 16–27. [Google Scholar] [CrossRef]
  31. Townsend, B.J.; Poole, A.; Blake, C.J.; Llewellyn, D.J. Antisense suppression of a (+)-delta-cadinene synthase gene in cotton prevents the induction of this defense response gene during bacterial blight infection but not its constitutive expression. Plant Physiol. 2005, 138, 516–528. [Google Scholar] [CrossRef]
  32. Liu, Q.; Talbot, M.; Llewellyn, D.J. Pectin methylesterase and pectin remodelling differ in the fibre walls of two Gossypium species with very different fibre properties. PLoS ONE 2013, 8, e65131. [Google Scholar] [CrossRef]
  33. Meng, C.; Yan, Y.; Liu, Z.; Chen, L.; Zhang, Y.; Li, X.; Wu, L.; Zhang, G.; Wang, X.; Ma, Z. Systematic analysis of cotton non-specific lipid transfer protein family revealed a special group that is involved in fiber elongation. Front. Plant Sci. 2018, 9, 1285. [Google Scholar] [CrossRef]
  34. Lv, L.M.; Zuo, D.Y.; Wang, X.F.; Cheng, H.L.; Zhang, Y.P.; Wang, Q.L.; Song, G.L.; Ma, Z.Y. Genome-wide identification of the expansin gene family reveals that expansin genes are involved in fibre cell growth in cotton. BMC Plant Biol. 2020, 20, 223. [Google Scholar] [CrossRef]
  35. Liu, Z.; Wang, X.; Sun, Z.; Zhang, Y.; Meng, C.; Chen, B.; Wang, G.; Ke, H.; Wu, J.; Yan, Y.; et al. Evolution, expression and functional analysis of cultivated allotetraploid cotton DIR genes. BMC Plant Biol. 2021, 21, 89. [Google Scholar] [CrossRef]
  36. Biswas, K.K.; Ooura, C.; Higuchi, K.; Miyazaki, Y.; Van Nguyen, V.; Rahman, A.; Uchimiya, H.; Kiyosue, T.; Koshiba, T.; Tanaka, A.; et al. Genetic characterization of mutants resistant to the antiauxin p-chlorophenoxyisobutyric acid reveals that AAR3, a gene encoding a DCN1-like protein, regulates responses to the synthetic auxin 2,4-dichlorophenoxyacetic acid in Arabidopsis roots. Plant Physiol. 2007, 145, 773–785. [Google Scholar] [CrossRef]
  37. Kurz, T.; Ozlu, N.; Rudolf, F.; O’Rourke, S.M.; Luke, B.; Hofmann, K.; Hyman, A.A.; Bowerman, B.; Peter, M. The conserved protein DCN-1/Dcn1p is required for cullin neddylation in C. elegans and S. cerevisiae. Nature 2005, 435, 1257–1261. [Google Scholar] [CrossRef]
  38. Hayashi, K. The interaction and integration of auxin signaling components. Plant Cell Physiol. 2012, 53, 965–975. [Google Scholar] [CrossRef]
  39. Guan, X.; Yu, N.; Shangguan, X.; Wang, S.; Lu, S.; Wang, L.; Chen, X. Arabidopsis trichome research sheds light on cotton fiber development mechanisms. Chin. Sci. Bull. 2007, 52, 1734–1741. [Google Scholar] [CrossRef]
  40. Guan, X.; Pang, M.; Nah, G.; Shi, X.; Ye, W.; Stelly, D.M.; Chen, Z.J. miR828 and miR858 regulate homoeologous MYB2 gene functions in Arabidopsis trichome and cotton fibre development. Nat. Commun. 2014, 5, 3050. [Google Scholar] [CrossRef] [PubMed]
  41. Ma, Z.; He, S.; Wang, X.; Sun, J.; Zhang, Y.; Zhang, G.; Wu, L.; Li, Z.; Liu, Z.; Sun, G.; et al. Resequencing a core collection of upland cotton identifies genomic variation and loci influencing fiber quality and yield. Nat. Genet. 2018, 50, 803–813. [Google Scholar] [CrossRef] [PubMed]
  42. Yu, Y.; Wu, S.; Nowak, J.; Wang, G.; Han, L.; Feng, Z.; Mendrinna, A.; Ma, Y.; Wang, H.; Zhang, X.; et al. Live-cell imaging of the cytoskeleton in elongating cotton fibres. Nat. Plants 2019, 5, 498–504. [Google Scholar] [CrossRef] [PubMed]
  43. Gendreau, E.; Traas, J.; Desnos, T.; Grandjean, O.; Caboche, M.; Hofte, H. Cellular basis of hypocotyl growth in Arabidopsis thaliana. Plant Physiol. 1997, 114, 295–305. [Google Scholar] [CrossRef] [PubMed]
  44. Boron, A.K.; Vissenberg, K. The Arabidopsis thaliana hypocotyl, a model to identify and study control mechanisms of cellular expansion. Plant Cell Rep. 2014, 33, 697–706. [Google Scholar] [CrossRef] [PubMed]
  45. Fiume, E.; Guyon, V.; Remoue, C.; Magnani, E.; Miquel, M.; Grain, D.; Lepiniec, L. TWS1, a novel small protein, regulates various aspects of seed and plant development. Plant Physiol. 2016, 172, 1732–1745. [Google Scholar] [CrossRef]
  46. Kuang, B.; Zhao, X.; Zhou, C.; Zeng, W.; Ren, J.; Ebert, B.; Beahan, C.T.; Deng, X.; Zeng, Q.; Zhou, G.; et al. Role of UDP-glucuronic acid decarboxylase in xylan biosynthesis in Arabidopsis. Mol. Plant 2016, 9, 1119–1131. [Google Scholar] [CrossRef]
  47. Hoffmann, N.; Benske, A.; Betz, H.; Schuetz, M.; Samuels, A.L. Laccases and peroxidases co-localize in lignified secondary cell walls throughout stem development. Plant Physiol. 2020, 184, 806–822. [Google Scholar] [CrossRef]
  48. MacMillan, C.P.; Mansfield, S.D.; Stachurski, Z.H.; Evans, R.; Southerton, S.G. Fasciclin-like arabinogalactan proteins: Specialization for stem biomechanics and cell wall architecture in Arabidopsis and Eucalyptus. Plant J. 2010, 62, 689–703. [Google Scholar] [CrossRef]
  49. Grantham, N.J.; Wurman-Rodrich, J.; Terrett, O.M.; Lyczakowski, J.J.; Stott, K.; Iuga, D.; Simmons, T.J.; Durand-Tardif, M.; Brown, S.P.; Dupree, R.; et al. An even pattern of xylan substitution is critical for interaction with cellulose in plant cell walls. Nat. Plants 2017, 3, 859–865. [Google Scholar] [CrossRef]
  50. Arsovski, A.A.; Popma, T.M.; Haughn, G.W.; Carpita, N.C.; McCann, M.C.; Western, T.L. AtBXL1 encodes a bifunctional beta-D-xylosidase/alpha-L-arabinofuranosidase required for pectic arabinan modification in Arabidopsis mucilage secretory cells. Plant Physiol. 2009, 150, 1219–1234. [Google Scholar] [CrossRef]
  51. Glass, M.; Barkwill, S.; Unda, F.; Mansfield, S.D. Endo-beta-1,4-glucanases impact plant cell wall development by influencing cellulose crystallization. J. Integr. Plant Biol. 2015, 57, 396–410. [Google Scholar] [CrossRef]
  52. McFarlane, H.E.; Doring, A.; Persson, S. The cell biology of cellulose synthesis. Annu. Rev. Plant Biol. 2014, 65, 69–94. [Google Scholar] [CrossRef]
  53. Bai, W.Q.; Xiao, Y.H.; Zhao, J.; Song, S.Q.; Hu, L.; Zeng, J.Y.; Li, X.B.; Hou, L.; Luo, M.; Li, D.M.; et al. Gibberellin overproduction promotes sucrose synthase expression and secondary cell wall deposition in cotton fibers. PLoS ONE 2014, 9, e96537. [Google Scholar] [CrossRef]
  54. Singh, S.; Brocker, C.; Koppaka, V.; Chen, Y.; Jackson, B.C.; Matsumoto, A.; Thompson, D.C.; Vasiliou, V. Aldehyde dehydrogenases in cellular responses to oxidative/electrophilic stress. Free Radical Biol. Med. 2013, 56, 89–101. [Google Scholar] [CrossRef]
  55. Newman, J.W.; Morisseau, C.; Hammock, B.D. Epoxide hydrolases, their roles and interactions with lipid metabolism. Prog. Lipid Res. 2005, 44, 1–51. [Google Scholar] [CrossRef]
  56. Reyt, G.; Chao, Z.; Flis, P.; Salas-Gonzalez, I.; Castrillo, G.; Chao, D.Y.; Salt, D.E. Uclacyanin proteins are required for lignified nanodomain formation within casparian strips. Curr. Biol. 2020, 30, 4103–4111. [Google Scholar] [CrossRef]
  57. Zhu, W.; Gao, E.; Shaban, M.; Wang, Y.; Wang, H.; Nie, X.; Zhu, L. GhUMC1, a blue copper-binding protein, regulates lignin synthesis and cotton immune response. Biochem. Biophys. Res. Commun. 2018, 504, 75–81. [Google Scholar] [CrossRef]
  58. Waszczak, C.; Carmody, M.; Kangasjarvi, J. Reactive oxygen species in plant signaling. Annu. Rev. Plant Biol. 2018, 69, 209–236. [Google Scholar] [CrossRef]
  59. Cui, H.; Kong, D.; Wei, P.; Hao, Y.; Torii, K.U.; Lee, J.S.; Li, J. SPINDLY, ERECTA and its ligand STOMAGEN have a role in redox-mediated cortex proliferation in the Arabidopsis root. Mol. Plant 2014, 7, 1727–1739. [Google Scholar] [CrossRef]
  60. Mnich, E.; Bjarnholt, N.; Eudes, A.; Harholt, J.; Holland, C.; Jorgensen, B.; Larsen, F.H.; Liu, M.; Manat, R.; Meyer, A.S.; et al. Phenolic cross-links, building and de-constructing the plant cell wall. Nat. Prod. Rep. 2020, 37, 919–961. [Google Scholar]
  61. Gill, S.S.; Tuteja, N. Reactive oxygen species and antioxidant machinery in abiotic stress tolerance in crop plants. Plant Physiol. Biochem. 2010, 48, 909–930. [Google Scholar] [CrossRef]
  62. ul Haq, S.; Khan, A.; Ali, M.; Khattak, A.M.; Gai, W.X.; Zhang, H.X.; Wei, A.M.; Gong, Z.H. Heat shock proteins: Dynamic biomolecules to counter plant biotic and abiotic stresses. Int. J. Mol. Sci. 2019, 20, 5321. [Google Scholar] [CrossRef] [PubMed]
  63. Alekseeva, A.A.; Savin, S.S.; Tishkov, V.I. NAD+-dependent formate dehydrogenase from plants. Acta Nat. 2011, 3, 38–54. [Google Scholar] [CrossRef]
  64. Sauter, M.; Moffatt, B.; Saechao, M.C.; Hell, R.; Wirtz, M. Methionine salvage and S-adenosylmethionine, essential links between sulfur, ethylene and polyamine biosynthesis. Biochem. J. 2013, 451, 145–154. [Google Scholar] [CrossRef] [PubMed]
  65. Han, L.B.; Li, Y.B.; Wang, H.Y.; Wu, X.M.; Li, C.L.; Luo, M.; Wu, S.J.; Kong, Z.S.; Pei, Y.; Jiao, G.L.; et al. The dual functions of WLIM1a in cell elongation and secondary wall formation in developing cotton fibers. Plant Cell 2013, 25, 4421–4438. [Google Scholar] [CrossRef]
  66. Gao, Z.; Sun, W.; Wang, J.; Zhao, C.; Zuo, K. GhbHLH18 negatively regulates fiber strength and length by enhancing lignin biosynthesis in cotton fibers. Plant Sci. 2019, 286, 7–16. [Google Scholar] [CrossRef]
  67. Feurtado, J.A.; Huang, D.; Wicki-Stordeur, L.; Hemstock, L.E.; Potentier, M.S.; Tsang, E.W.; Cutler, A.J. The Arabidopsis C2H2 zinc finger INDETERMINATE DOMAIN1/ENHYDROUS promotes the transition to germination by regulating light and hormonal signaling during seed maturation. Plant Cell 2011, 23, 1772–1794. [Google Scholar] [CrossRef]
  68. Fukazawa, J.; Teramura, H.; Murakoshi, S.; Nasuno, K.; Nishida, N.; Ito, T.; Yoshida, M.; Kamiya, Y.; Yamaguchi, S.; Takahashi, Y. DELLAs function as coactivators of GAI-ASSOCIATED FACTOR1 in regulation of gibberellin homeostasis and signaling in Arabidopsis. Plant Cell 2014, 26, 2920–2938. [Google Scholar] [CrossRef]
  69. Mussig, C.; Lisso, J.; Coll-Garcia, D.; Altmann, T. Molecular analysis of brassinosteroid action. Plant Biol. 2006, 8, 291–296. [Google Scholar] [CrossRef]
  70. Sun, Y.; Veerabomma, S.; Fokar, M.; Abidi, N.; Hequet, E.; Payton, P.; Allen, R.D. Brassinosteroid signaling affects secondary cell wall deposition in cotton fibers. Ind. Crop Prod. 2015, 65, 334–342. [Google Scholar] [CrossRef]
  71. Borghi, L.; Kang, J.; Ko, D.; Lee, Y.; Martinoia, E. The role of ABCG-type ABC transporters in phytohormone transport. Biochem. Soc. Trans. 2015, 43, 924–930. [Google Scholar] [CrossRef]
  72. Zhong, R.; Cui, D.; Ye, Z.H. Secondary cell wall biosynthesis. New Phytol. 2019, 221, 1703–1723. [Google Scholar] [CrossRef]
  73. Xiao, G.; Zhao, P.; Zhang, Y. A pivotal role of hormones in regulating cotton fiber development. Front. Plant Sci. 2019, 10, 87. [Google Scholar] [CrossRef]
  74. Yu, J.Z.; Ulloa, M.; Hoffman, S.M.; Kohel, R.J.; Pepper, A.E.; Fang, D.D.; Percy, R.G.; Burke, J.J. Mapping genomic loci for cotton plant architecture, yield components and fiber properties in an interspecific (Gossypium hirsutum L. × G. barbadense L.) RIL population. Mol. Genet. Genom. 2014, 289, 1347–1367. [Google Scholar] [CrossRef]
  75. Lacape, J.M.; Llewellyn, D.; Jacobs, J.; Arioli, T.; Becker, D.; Calhoun, S.; Al-Ghazi, Y.; Liu, S.; Palai, O.; Georges, S.; et al. Meta-analysis of cotton fiber quality QTLs across diverse environments in a Gossypium hirsutum × G. barbadense RIL population. BMC Plant Biol. 2010, 10, 132. [Google Scholar] [CrossRef]
  76. Guo, X.; Runavot, J.L.; Bourot, S.; Meulewaeter, F.; Hernandez-Gomez, M.; Holland, C.; Harholt, J.; Willats, W.G.T.; Mravec, J.; Knox, P.; et al. Metabolism of polysaccharides in dynamic middle lamellae during cotton fibre development. Planta 2019, 249, 1565–1581. [Google Scholar] [CrossRef]
  77. Wang, X.F.; Ma, J.; Wang, W.S.; Zheng, Y.M.; Zhang, G.Y.; Liu, C.J.; Ma, Z.Y. Construction and characterization of the first bacterial artificial chromosome library for the cotton species Gossypium barbadense L. Genome 2006, 49, 1393–1398. [Google Scholar] [CrossRef]
  78. Kim, D.; Pertea, G.; Trapnell, C.; Pimentel, H.; Kelley, R.; Salzberg, S.L. TopHat2, accurate alignment of transcriptomes in the presence of insertions, deletions and gene fusions. Genome Biol. 2013, 14, R36. [Google Scholar] [CrossRef]
  79. Trapnell, C.; Williams, B.A.; Pertea, G.; Mortazavi, A.; Kwan, G.; van Baren, M.J.; Salzberg, S.L.; Wold, B.J.; Pachter, L. Transcript assembly and quantification by RNA-Seq reveals unannotated transcripts and isoform switching during cell differentiation. Nat. Biotechnol. 2010, 28, 511–515. [Google Scholar] [CrossRef]
  80. Anders, S.; Pyl, P.T.; Huber, W. HTSeq—A Python framework to work with high-throughput sequencing data. Bioinformatics 2015, 31, 166–169. [Google Scholar] [CrossRef]
  81. Robinson, M.D.; McCarthy, D.J.; Smyth, G.K. edgeR, a Bioconductor package for differential expression analysis of digital gene expression data. Bioinformatics 2010, 26, 139–140. [Google Scholar] [CrossRef] [PubMed]
  82. Wang, L.; Feng, Z.; Wang, X.; Wang, X.; Zhang, X. DEGseq, an R package for identifying differentially expressed genes from RNA-seq data. Bioinformatics 2010, 26, 136–138. [Google Scholar] [CrossRef] [PubMed]
  83. Xie, C.; Mao, X.; Huang, J.; Ding, Y.; Wu, J.; Dong, S.; Kong, L.; Gao, G.; Li, C.Y.; Wei, L. KOBAS 2.0, a web server for annotation and identification of enriched pathways and diseases. Nucleic Acids Res. 2011, 39, W316–W322. [Google Scholar] [CrossRef] [PubMed]
  84. Collins, T.J. ImageJ for microscopy. Biotechniques 2007, 43, 25–30. [Google Scholar] [CrossRef] [PubMed]
  85. Paterson, A.H.; Brubaker, C.L.; Wendel, J.F. A rapid method for extraction of cotton (Gossypium spp.) genomic DNA suitable for RFLP or PCR analysis. Plant Mol. Biol. Rep. 1993, 11, 122–127. [Google Scholar] [CrossRef]
  86. Ugozzoli, L.; Wallace, R.B. Allele-specific polymerase chain reaction. Methods 1991, 2, 42–48. [Google Scholar] [CrossRef]
Figure 1. Transcriptome sequencing of the G. barbadense and G. hirsutum fibers. (a) Mature cotton fibers from G. barbadense and G. hirsutum. (b) Difference in fiber length between the two cotton groups. Phenotype data were collected from five years × location agroecological environments. The significance of difference was analyzed with a two-tailed t-test. (c) Difference in fiber strength between the two cotton groups. (d) Difference in fiber micronaire between the two cotton groups. (e) Cotton boll development in G. barbadense. (f) Principal component analysis of the sequencing samples based on gene expression.
Ijms 24 08293 g001
Figure 2. Preferentially expressed genes during cotton fiber elongation in G. barbadense. (a) Identification of the DEGs that were upregulated at 5, 10 and 15 DPA in comparison with 0 DPA. (b) Cluster analysis of the upregulated DEGs based on expression trends. The RPKM values were normalized with the z-score method. (c) GO enrichment analysis in different clusters; p-value generated from the hypergeometric test was adjusted via the Benjamini–Hochberg method, generating a Q-value; GO terms with a Q-value < 0.05 were considered significantly enriched. (d) GO enrichment analysis in the IV-I, IV-II and IV-III subgroups. (e) Forty-two genes were extracted from cluster IV, which were upregulated in G. barbadense as compared with G. hirsutum during cotton fiber elongation.
Ijms 24 08293 g002
Figure 3. Functional analysis of GbAAR3 in Arabidopsis. (a) Subcellular localization of the GbAAR3–GFP protein in onion epidermal cells. GFP alone was used as the control. (b) Expression of GbAAR3 in GbAAR3-overexpressed Arabidopsis plants as detected by qRT-PCR. (c,d) Arabidopsis plants with overexpression of GbAAR3 compared with the wild type showed significantly longer leaf trichomes. In the boxplots, the center line indicates the median, the box limits denote the upper and lower quartiles and the whiskers mark the range of data; n shows the number of measured trichomes. The significance of difference was analyzed with a two-tailed t-test. (e,f) Arabidopsis plants with overexpression of GbAAR3 compared with the wild type showed significantly longer dark-grown hypocotyls. (g) Microscopic inspection of hypocotyl epidermal cells. The arrows mark the ends of representative epidermal cells.
Ijms 24 08293 g003
Figure 4. Preferentially expressed genes during SCW biosynthesis in G. barbadense. (a) Identification of the DEGs that were upregulated at 20, 25 and 30 DPA in comparison with 0 DPA. (b) Cluster analysis of the upregulated DEGs based on expression trends. The RPKM values were normalized with the z-score method. (c) Comprehensive diagram illustrating the involvement of different clusters in SCW biosynthesis. (d) Statistics on the genes related to cell wall macromolecule metabolism in different clusters. (e) The 48 genes extracted from cluster IV which were upregulated in G. barbadense as compared with G. hirsutum during SCW biosynthesis. (f) Forty-eight genes were divided into two groups based on the expression patterns of their G. hirsutum orthologs.
Ijms 24 08293 g004
Figure 5. Functional analysis of the SCW biosynthesis-related candidate genes using a BC3F5 population. (a) Strategy for SNP marker development. (b) Genotyping of the BC3F5 population. (c) The influence on fiber properties with the introgression of candidate genes into G. hirsutum. In the boxplots, the center line indicates the median, box limits denote the upper and lower quartiles and whiskers mark the range of data; n shows the number of BC3F5 lines containing the corresponding G. barbadense genomic fragments. The significance of difference was analyzed with a two-tailed t-test. (d) Expression patterns of Gbar_A05G019310 and its G. hirsutum ortholog and the influence on fiber strength generated by the introgression of Gbar_A05G019310. (e) Expression patterns of Gbar_A05G025000 and its G. hirsutum ortholog and the influence on fiber strength generated by the introgression of Gbar_A05G025000. (f) Expression patterns of Gbar_A06G015550 and its G. hirsutum ortholog and the influence on fiber micronaire generated by the introgression of Gbar_A06G015550. (g) Expression patterns of Gbar_A13G023450 and its G. hirsutum ortholog and the influence on fiber micronaire generated by the introgression of Gbar_A13G023450. (h) Expression patterns of Gbar_D05G026930 and its G. hirsutum ortholog and the influence on fiber micronaire generated by the introgression of Gbar_D05G026930.
Ijms 24 08293 g005
Table 1. Elongation-related candidate genes.
TypeReference aOrthologous Genes bFunctional Annotation
IV-IGh_A03G0826Gbar_A03G010660GPI-anchored adhesin-like protein
Gh_A07G1193Gbar_A07G013810S-adenosylmethionine synthase
Gh_A11G1313Gbar_A11G014750Stomagen
Gh_A11G3137Gbar_A11G0212903-hydroxyacyl-CoA dehydratase
Gh_A13G0932Gbar_A13G012640SMALLER WITH VARIABLE BRANCHES
Gh_D03G0078Gbar_D03G000870α-mannosidase
Gh_D05G3507Gbar_D05G037750(+)-δ-cadinene synthase
Gh_D08G1067Gbar_D08G011240BAHD acyltransferase
Gh_D09G0438Gbar_D09G004860Subtilisin-like protease
Gh_D11G1462Gbar_D11G015570Stomagen
IV-IIGh_A03G2157Gbar_A03G019080Nonspecific lipid-transfer protein
Gh_A05G1646Gbar_A05G018970β-mannanase
Gh_A05G1812Gbar_A05G020690TWISTED SEED
Gh_A07G0152Gbar_A07G001880Pectinesterase/pectinesterase inhibitor
Gh_A07G0664Gbar_A07G007890α-expansin
Gh_A08G0668Gbar_A08G007900BTB/POZ domain-containing protein
Gh_A09G1368Gbar_A09G015680S-adenosylmethionine synthase
Gh_A11G0547Gbar_A11G006130Serine protease inhibitor
Gh_A12G1104Gbar_A12G013240Ribonuclease H-like protein
Gh_D04G0006Gbar_D04G000050Pectinesterase/pectinesterase inhibitor
Gh_D05G2968Gbar_D05G031740Importin-β
Gh_D07G1581Gbar_D07G017340Acidic leucine-rich nuclear phosphoprotein
Gh_D08G0151Gbar_D08G001620Dirigent protein
Gh_D09G1136Gbar_D09G012750Alpha carbonic anhydrase
Gh_D10G1363Gbar_D10G014320Methylenetetrahydrofolate reductase
Gh_D11G0625Gbar_D11G006420Fatty acid amide hydrolase
Gh_D11G3426Gbar_D11G024050Glutathione S-transferase
Gh_D12G2436Gbar_D12G026630Heat shock protein
IV-IIIGh_A02G1644Gbar_A02G018320α-mannosidase
Gh_A05G0923Gbar_A05G010310Heavy metal transport
Gh_A05G3172Gbar_A05G037170ANTIAUXIN-RESISTANT
Gh_A06G1116Gbar_A06G013440Cystathionine β-synthase
Gh_A07G2014Gbar_A07G023310Formate dehydrogenase
Gh_A10G0126Gbar_A10G001450Actin cytoskeleton-regulatory complex
Gh_D04G0153Gbar_D04G001950Cytochrome P450
Gh_D04G1621Gbar_D04G017890Cytosolic cyclophilin
Gh_D05G2178Gbar_D05G023090Sugar transport protein
Gh_D08G2441Gbar_D08G025770Leucine-rich repeat (LRR) protein
Gh_D09G1484Gbar_D09G016550Short-chain dehydrogenase
Gh_D11G1941Gbar_D11G020770PLC-like phosphodiesterase
Gh_D12G0289Gbar_D12G003220SAUR-like auxin-responsive protein
Gh_D12G0652Gbar_D12G007360Membrane-associated kinase regulator
a Gene identifiers in the G. hirsutum acc. TM-1 genome [29]; b gene identifiers in the G. barbadense acc. 3-79 genome [2].
Table 2. Type I SCW biosynthesis-related candidate genes.
Reference aOrthologous Genes bFunctional AnnotationGenetic Marker
Gh_A04G0686Gbar_A04G008430Soluble inorganic pyrophosphataseHEBAU0001
Gh_A05G0370Gbar_A05G004360F-box/LRR-repeat proteinHEBAU0002
Gh_A05G1677Gbar_A05G019310C2H2-like zinc finger proteinHEBAU0003
Gh_A05G1930Gbar_A05G022250EXORDIUM proteinNA
Gh_A05G2177Gbar_A05G025000Transmembrane proteinHEBAU0004
Gh_A06G1590Gbar_A06G019480Leucine-rich repeat protein kinaseHEBAU0005
Gh_A10G1937Gbar_A10G023160UDP-Xyl synthaseHEBAU0006
Gh_A11G2936Gbar_A11G034900LaccaseHEBAU0007
Gh_A12G0165Gbar_A12G001790Nucleobase–ascorbate transporterHEBAU0008
Gh_A13G0090GB_A13G0103Cysteine/histidine-rich DC1 domainHEBAU0009
Gh_A13G1919Gbar_A13G023580Fasciclin-like arabinogalactan proteinHEBAU0010
Gh_D01G1187Gbar_D01G013340Protein of unknown functionHEBAU0011
Gh_D02G0286GB_D02G0284Cytochrome P450HEBAU0012
Gh_D02G1423Gbar_D02G015210Plasmodesmata-located proteinNA
Gh_D03G0537Gbar_D03G005540Cytochrome P450HEBAU0013
Gh_D03G1074Gbar_D03G011820Feruloyl-CoA transferaseHEBAU0014
Gh_D04G1519Gbar_D04G0169602-nitropropane dioxygenaseHEBAU0015
Gh_D05G1062Gbar_D05G011330LIGHT SENSITIVE HYPOCOTYLSHEBAU0016
Gh_D05G2936Gbar_D05G031310Phosphate transporterHEBAU0017
Gh_D06G2276Gbar_D06G000230β-tubulinHEBAU0018
Gh_D07G0285Gbar_D07G003310Clathrin assembly proteinNA
Gh_D09G0011Gbar_D09G000120Protein of unknown functionHEBAU0019
Gh_D10G1036Gbar_D10G011020Xylan glucuronosyltransferaseHEBAU0020
Gh_D10G1767Gbar_D10G018450β-xylosidaseHEBAU0021
Gh_D12G2377Gbar_D12G025300Protein of unknown functionNA
a Gene identifiers in the G. hirsutum acc. TM-1 genome [29]; b gene identifiers in the G. barbadense acc. 3-79 [2] or Hai7124 genome [3]. Note: NA, not available.
Table 3. Type II SCW biosynthesis-related candidate genes.
Reference aOrthologous Genes bFunctional AnnotationGenetic Marker
Gh_A03G1620Gbar_A03G020290Progesterone 5β-reductaseHEBAU0022
Gh_A05G0912Gbar_A05G010210BEL1-like homeodomain proteinHEBAU0023
Gh_A05G1599Gbar_A05G018470Endo-β-1, 4-glucanaseHEBAU0024
Gh_A06G0882Gbar_A06G010210Transmembrane proteinHEBAU0025
Gh_A06G1256Gbar_A06G015550Aldehyde dehydrogenaseHEBAU0026
Gh_A07G0322Gbar_A07G004070Cellulose synthaseNA
Gh_A09G0389NAProtein of unknown functionNA
Gh_A10G0145Gbar_A10G001660NTF2-like proteinNA
Gh_A10G0696Gbar_A10G008340ABC transporterHEBAU0027
Gh_A12G0108Gbar_A12G001190Protein of unknown functionHEBAU0028
Gh_A12G1564Gbar_A12G018330SLH domain proteinHEBAU0029
Gh_A12G2552Gbar_A12G010170Hydroxyproline-rich glycoproteinHEBAU0030
Gh_A13G0149Gbar_A13G001740Auxin influx transporterHEBAU0031
Gh_A13G0378Gbar_A13G004310Leucine-rich repeat (LRR) proteinHEBAU0032
Gh_A13G1904Gbar_A13G023450Epoxide hydrolaseHEBAU0033
Gh_A13G2039Gbar_A13G024860Networked (NET) family proteinHEBAU0034
Gh_A13G2237NAProtein of unknown functionNA
Gh_D03G0611Gbar_D03G007510Cellulose synthaseHEBAU0035
Gh_D05G2536Gbar_D05G026930Blue copper proteinHEBAU0036
Gh_D06G1911Gbar_D06G019950RING-type E3 ubiquitin ligaseHEBAU0037
Gh_D08G1431Gbar_D08G015060Subtilisin-like proteaseHEBAU0038
Gh_D10G1810Gbar_D10G018890UDP-glycosyltransferaseNA
Gh_D12G0575Gbar_D12G006270Kinesin-like proteinHEBAU0039
a Gene identifiers in the G. hirsutum acc. TM-1 genome [29]; b gene identifiers in the G. barbadense acc. 3-79 genome [2]. Note: NA, not available.
Disclaimer/Publisher’s Note: The statements, opinions and data contained in all publications are solely those of the individual author(s) and contributor(s) and not of MDPI and/or the editor(s). MDPI and/or the editor(s) disclaim responsibility for any injury to people or property resulting from any ideas, methods, instructions or products referred to in the content.

