
An Evaluation of the Cytotoxic and Genotoxic Effects of the Marine Toxin C17-SAMT in Human TK6 and HepaRG Cell Lines

 , ,
, ,  and
and 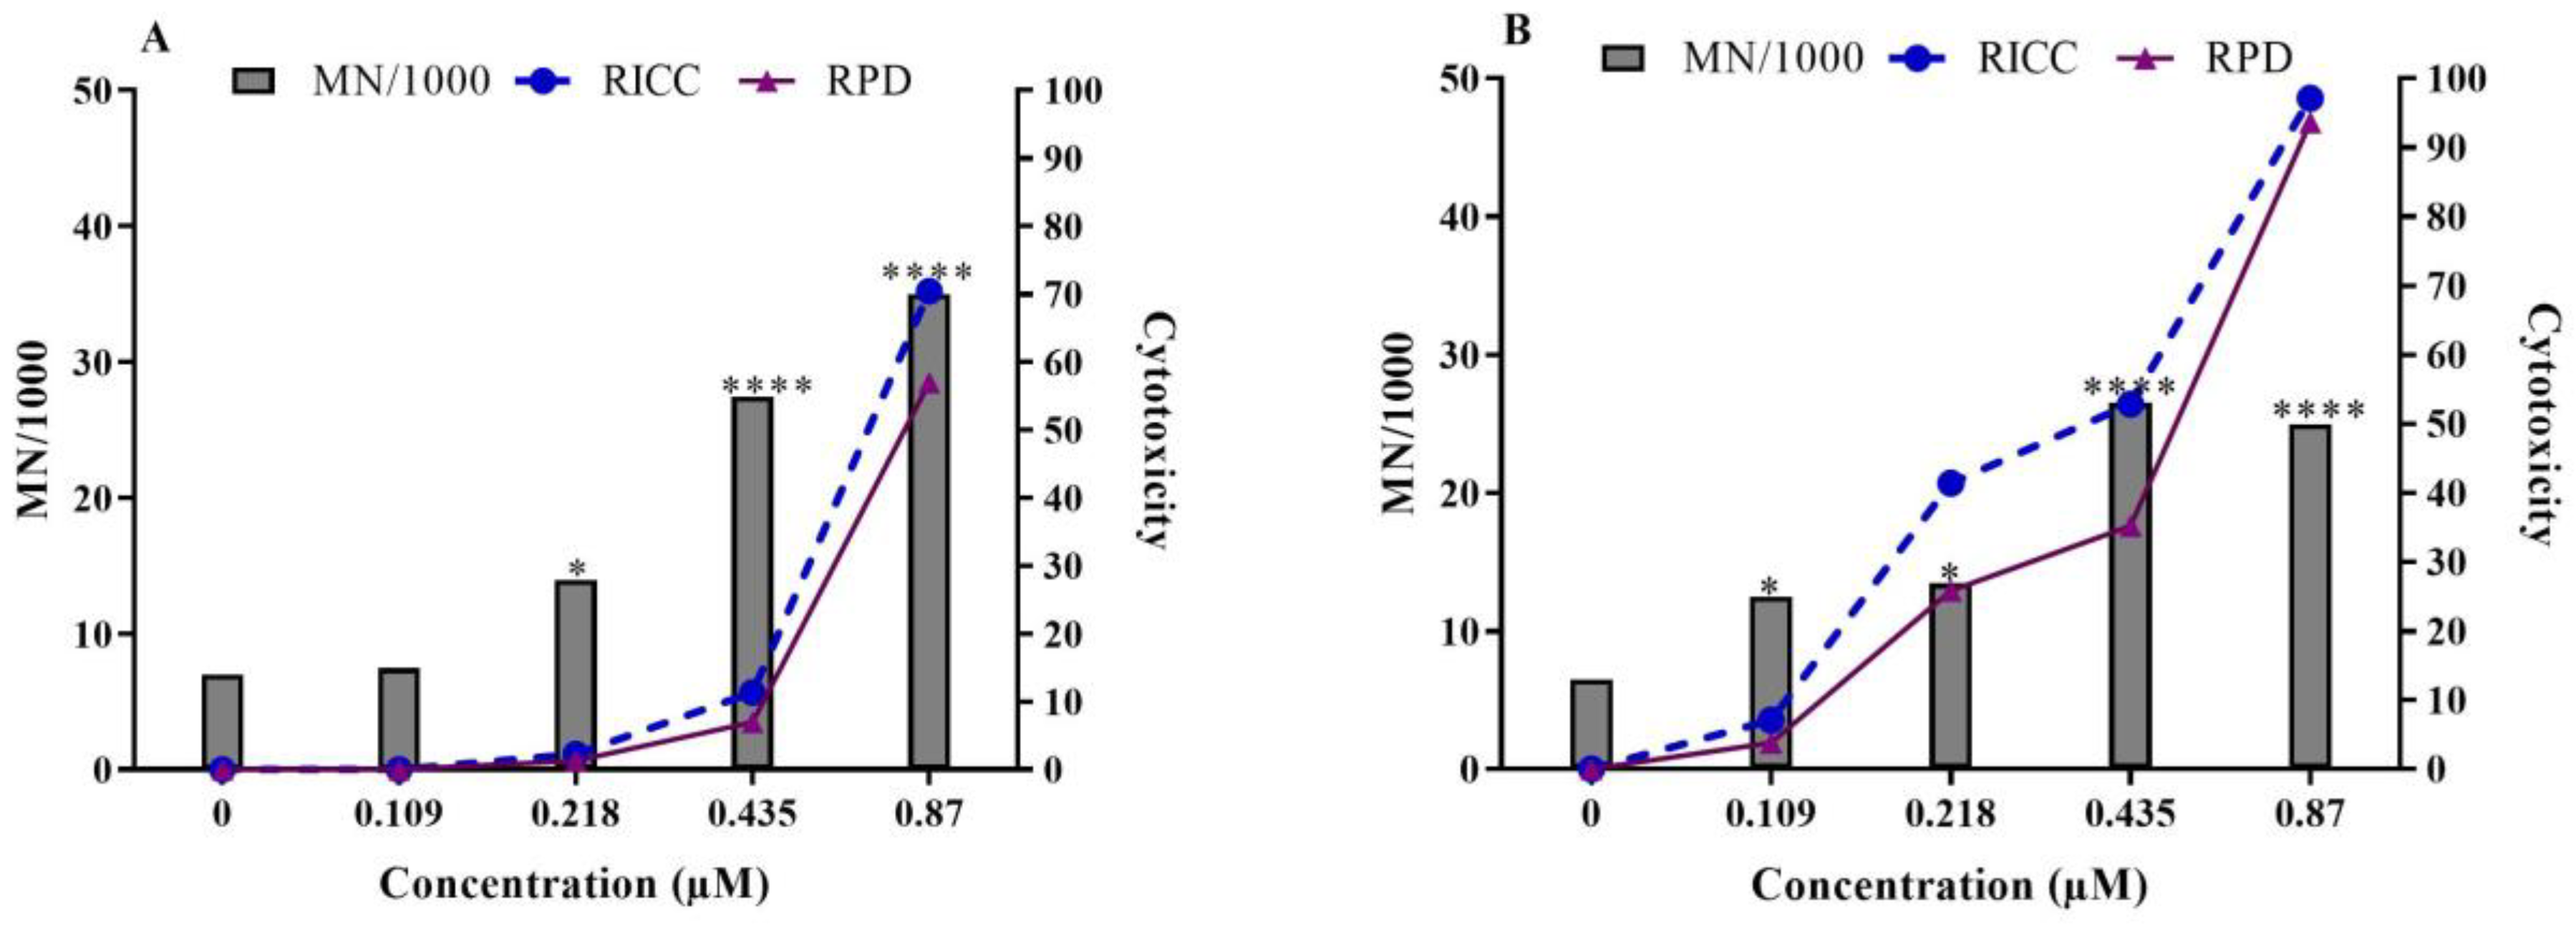
Abstract
1. Introduction
2. Results
2.1. In Vitro Micronucleus Test in TK6 Cells
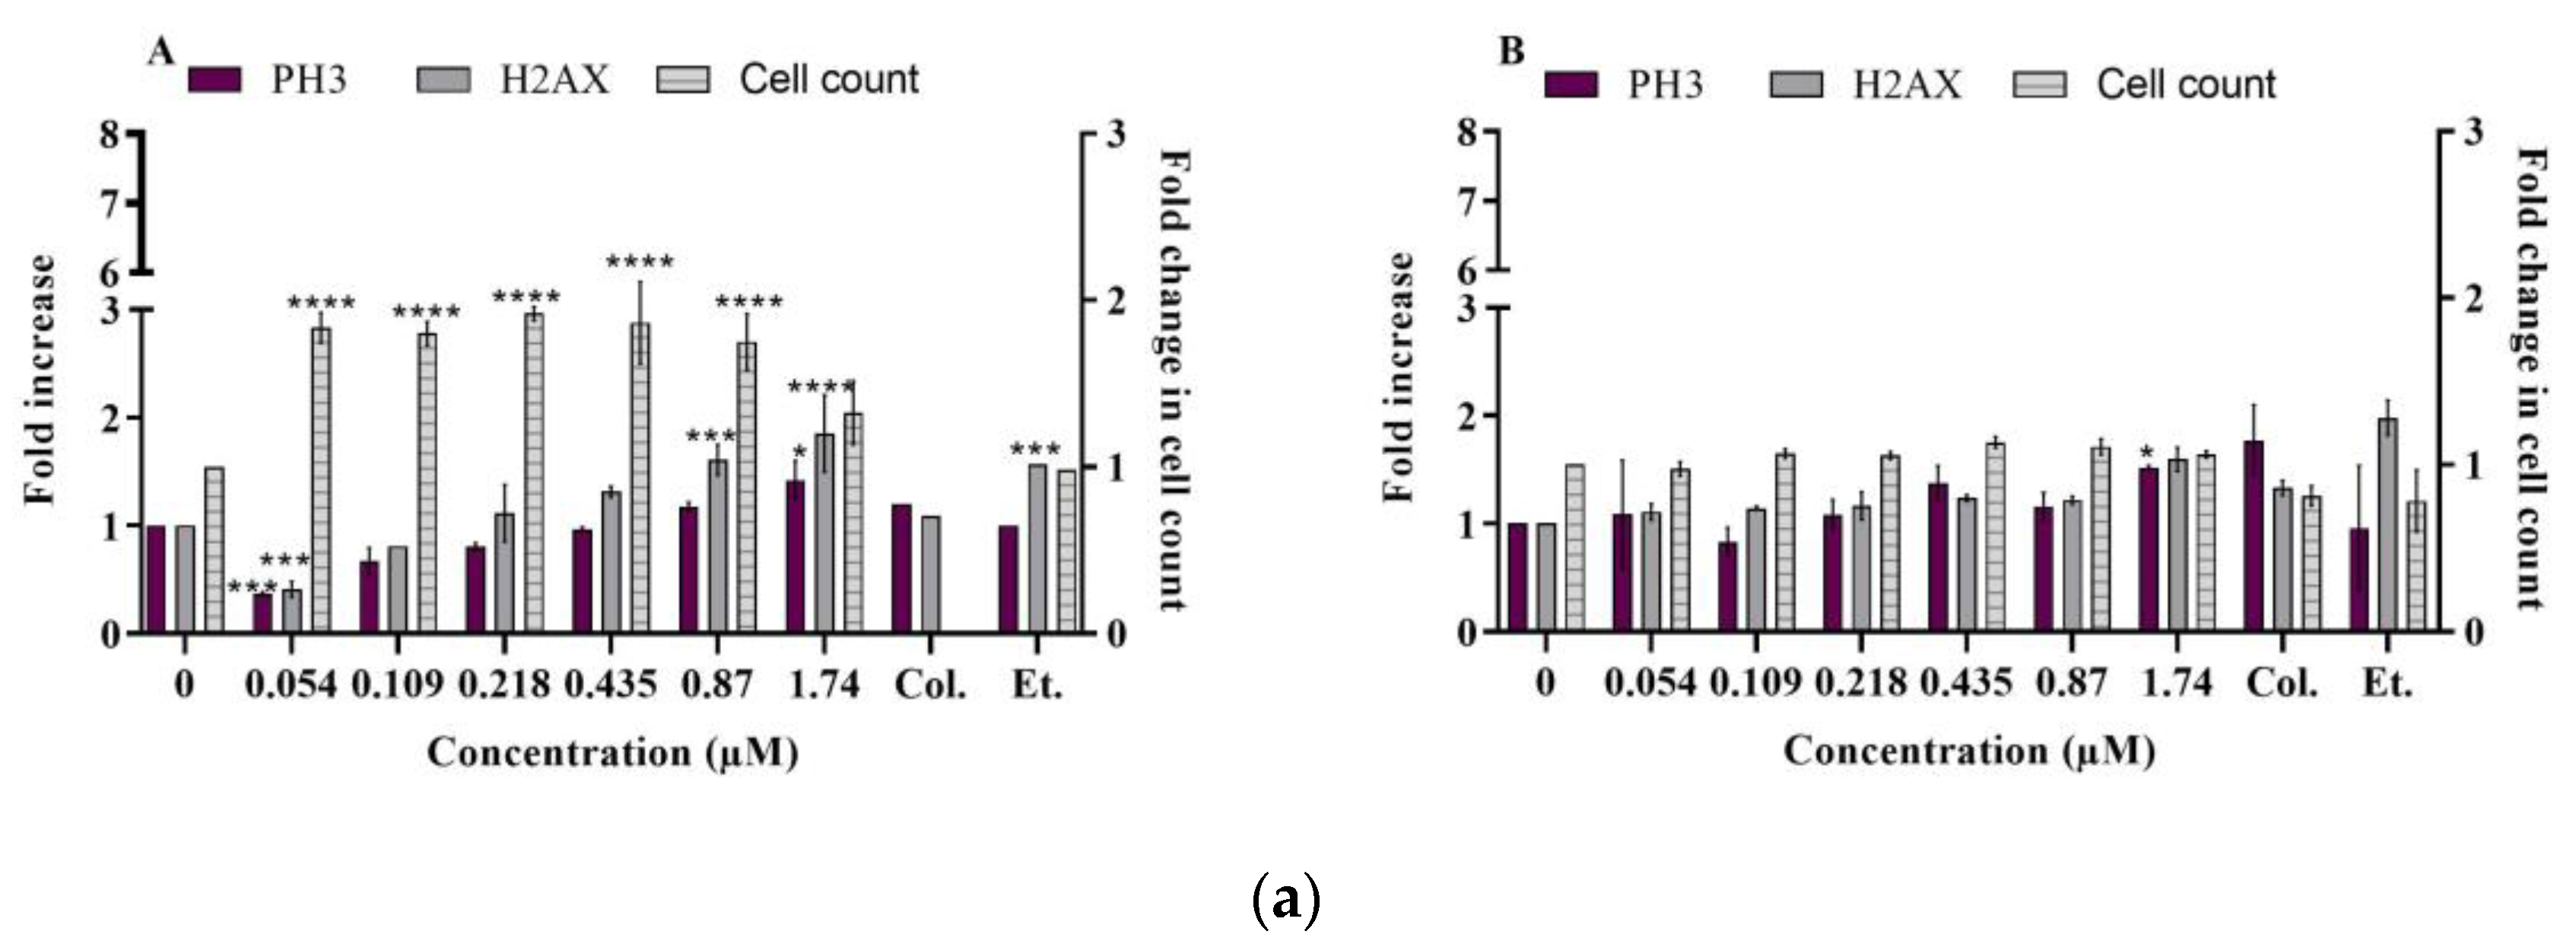
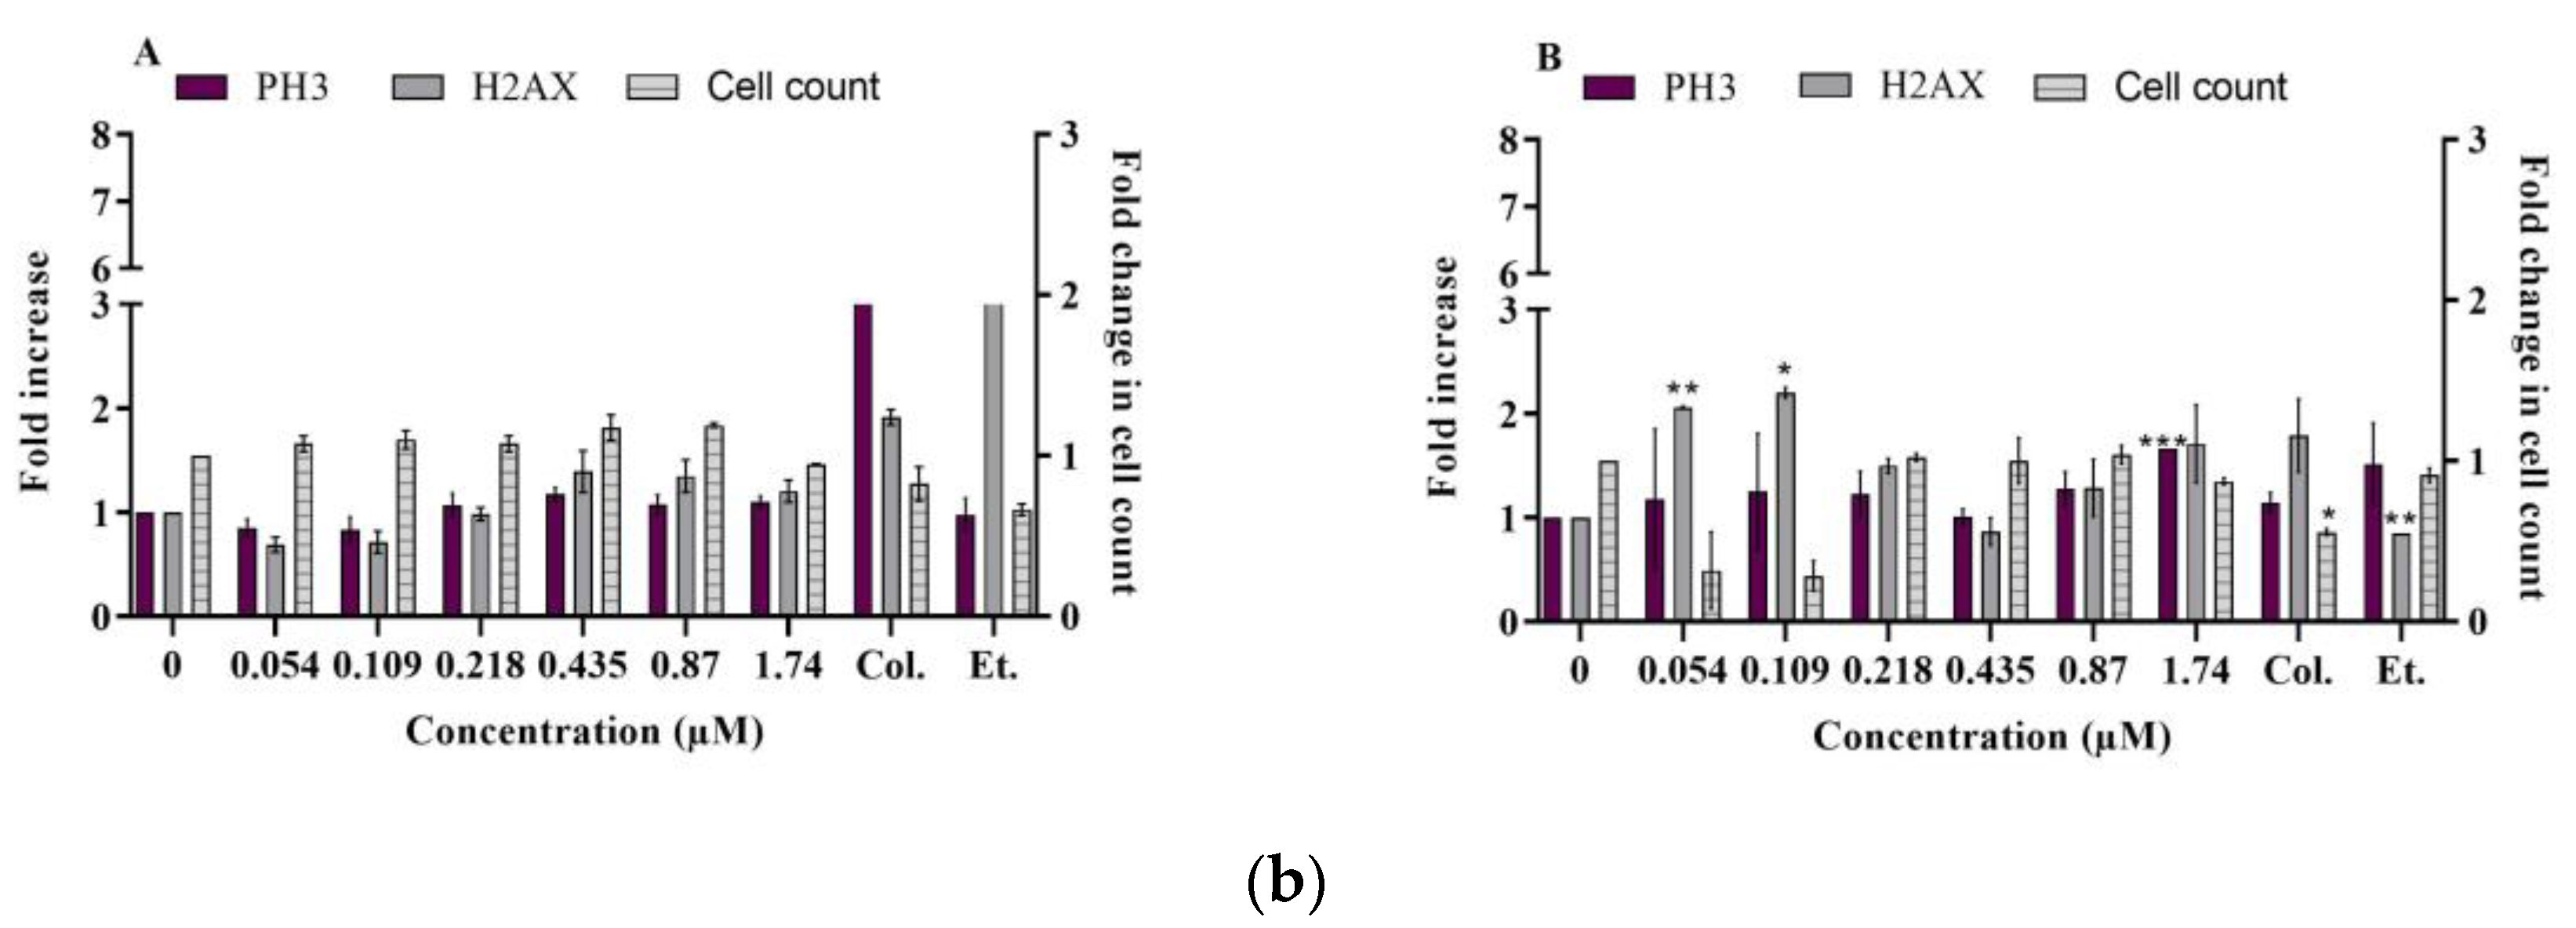
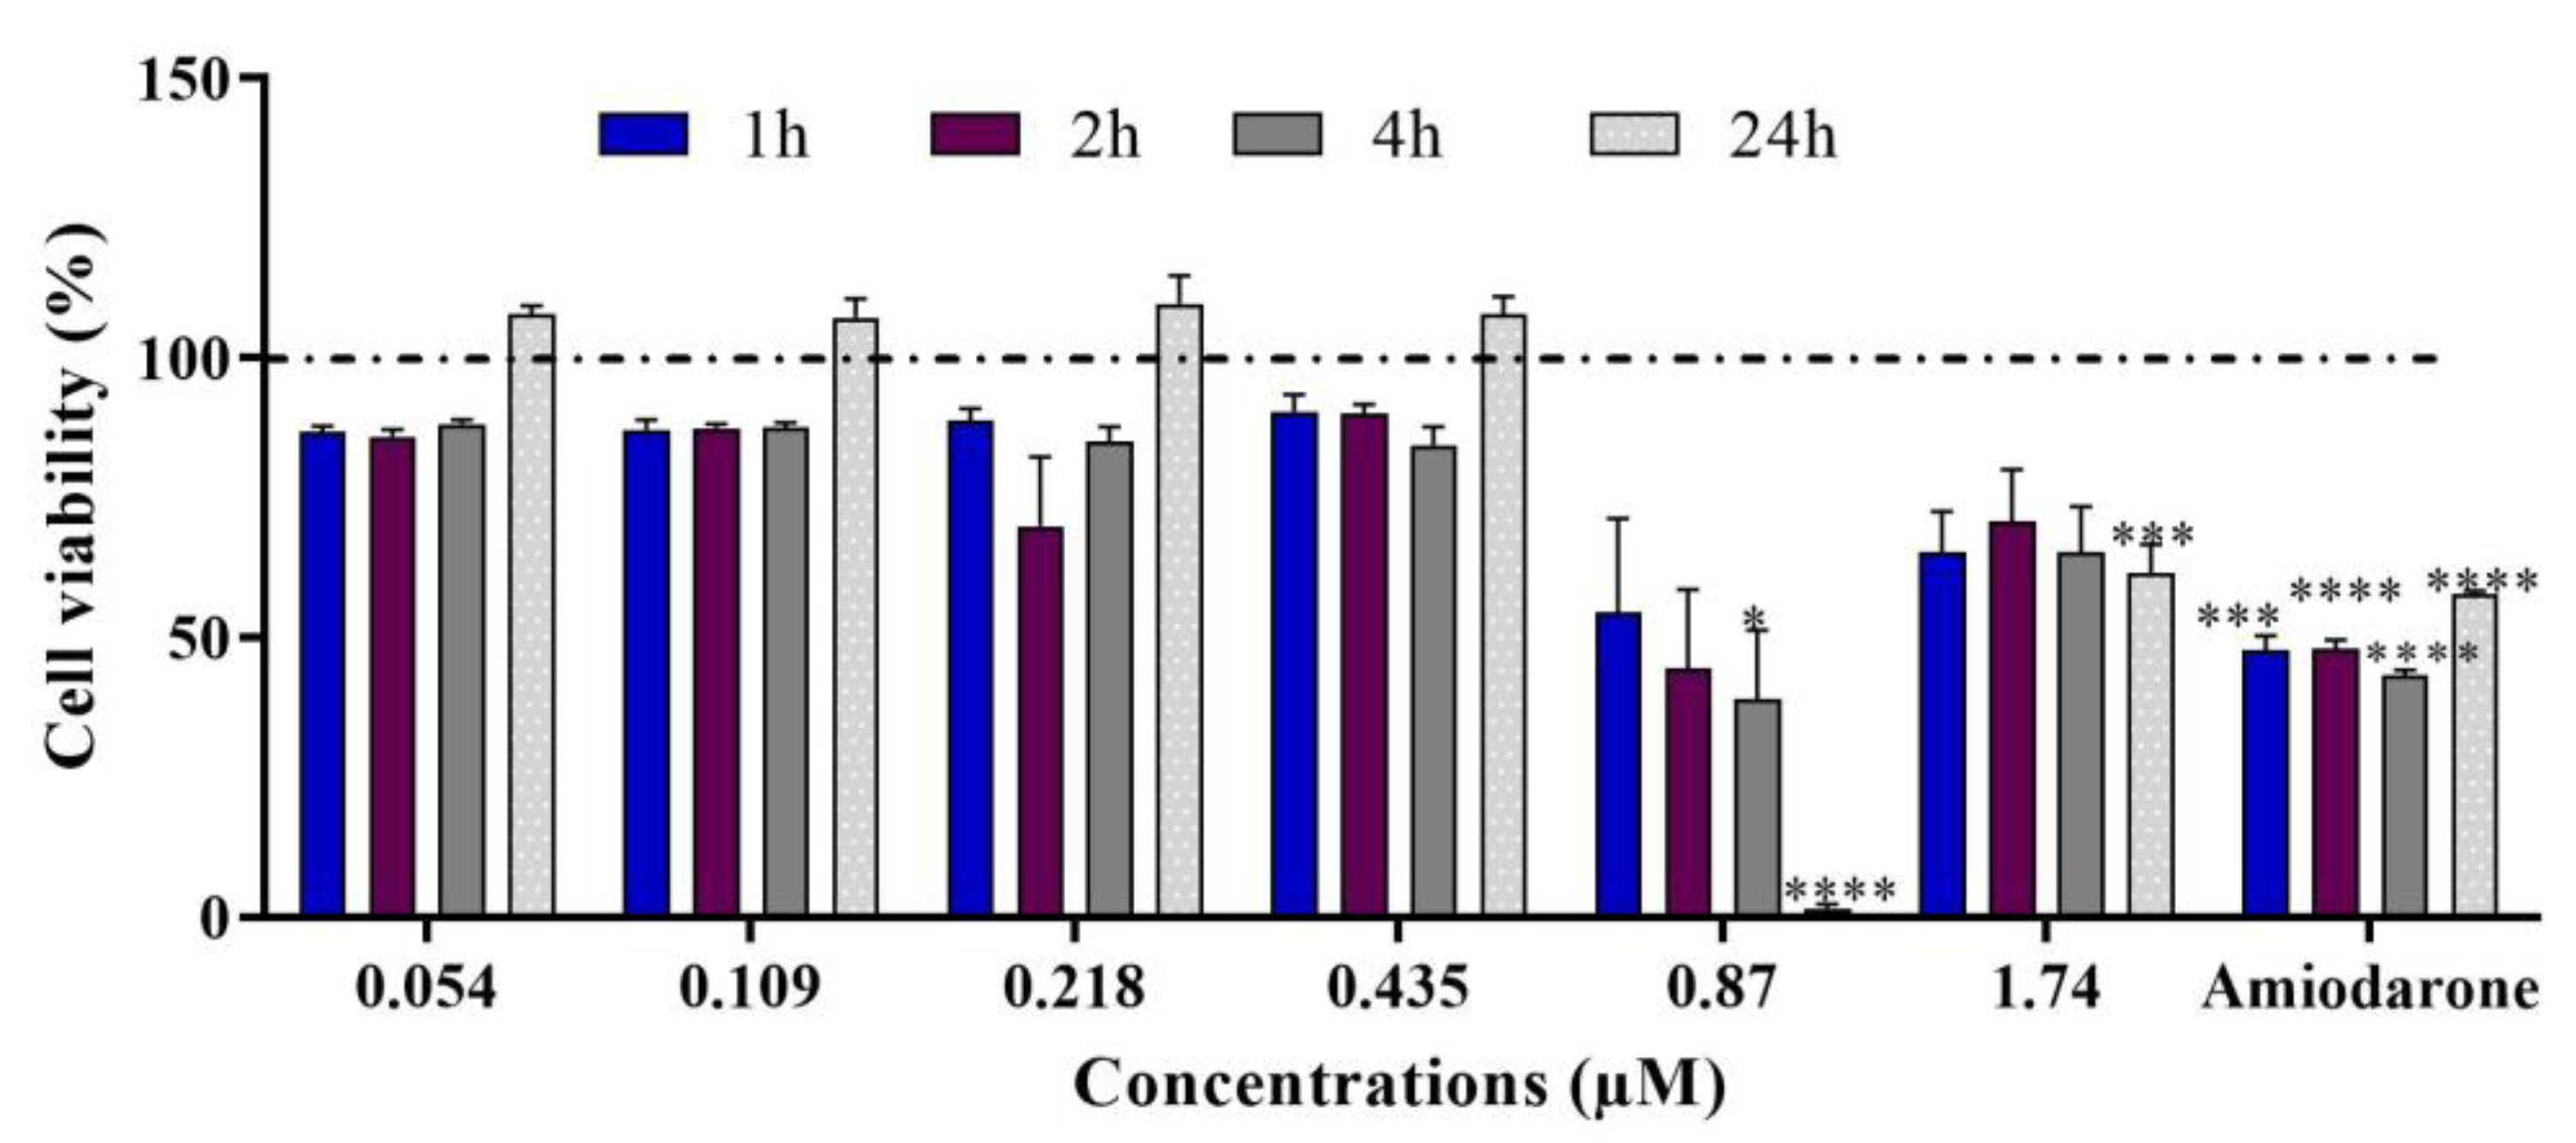
2.2. Multiparametric Cytotoxicity Assays in HepaRG Cells
2.2.1. DNA Damage
- γ-H2AX and phospho-H3
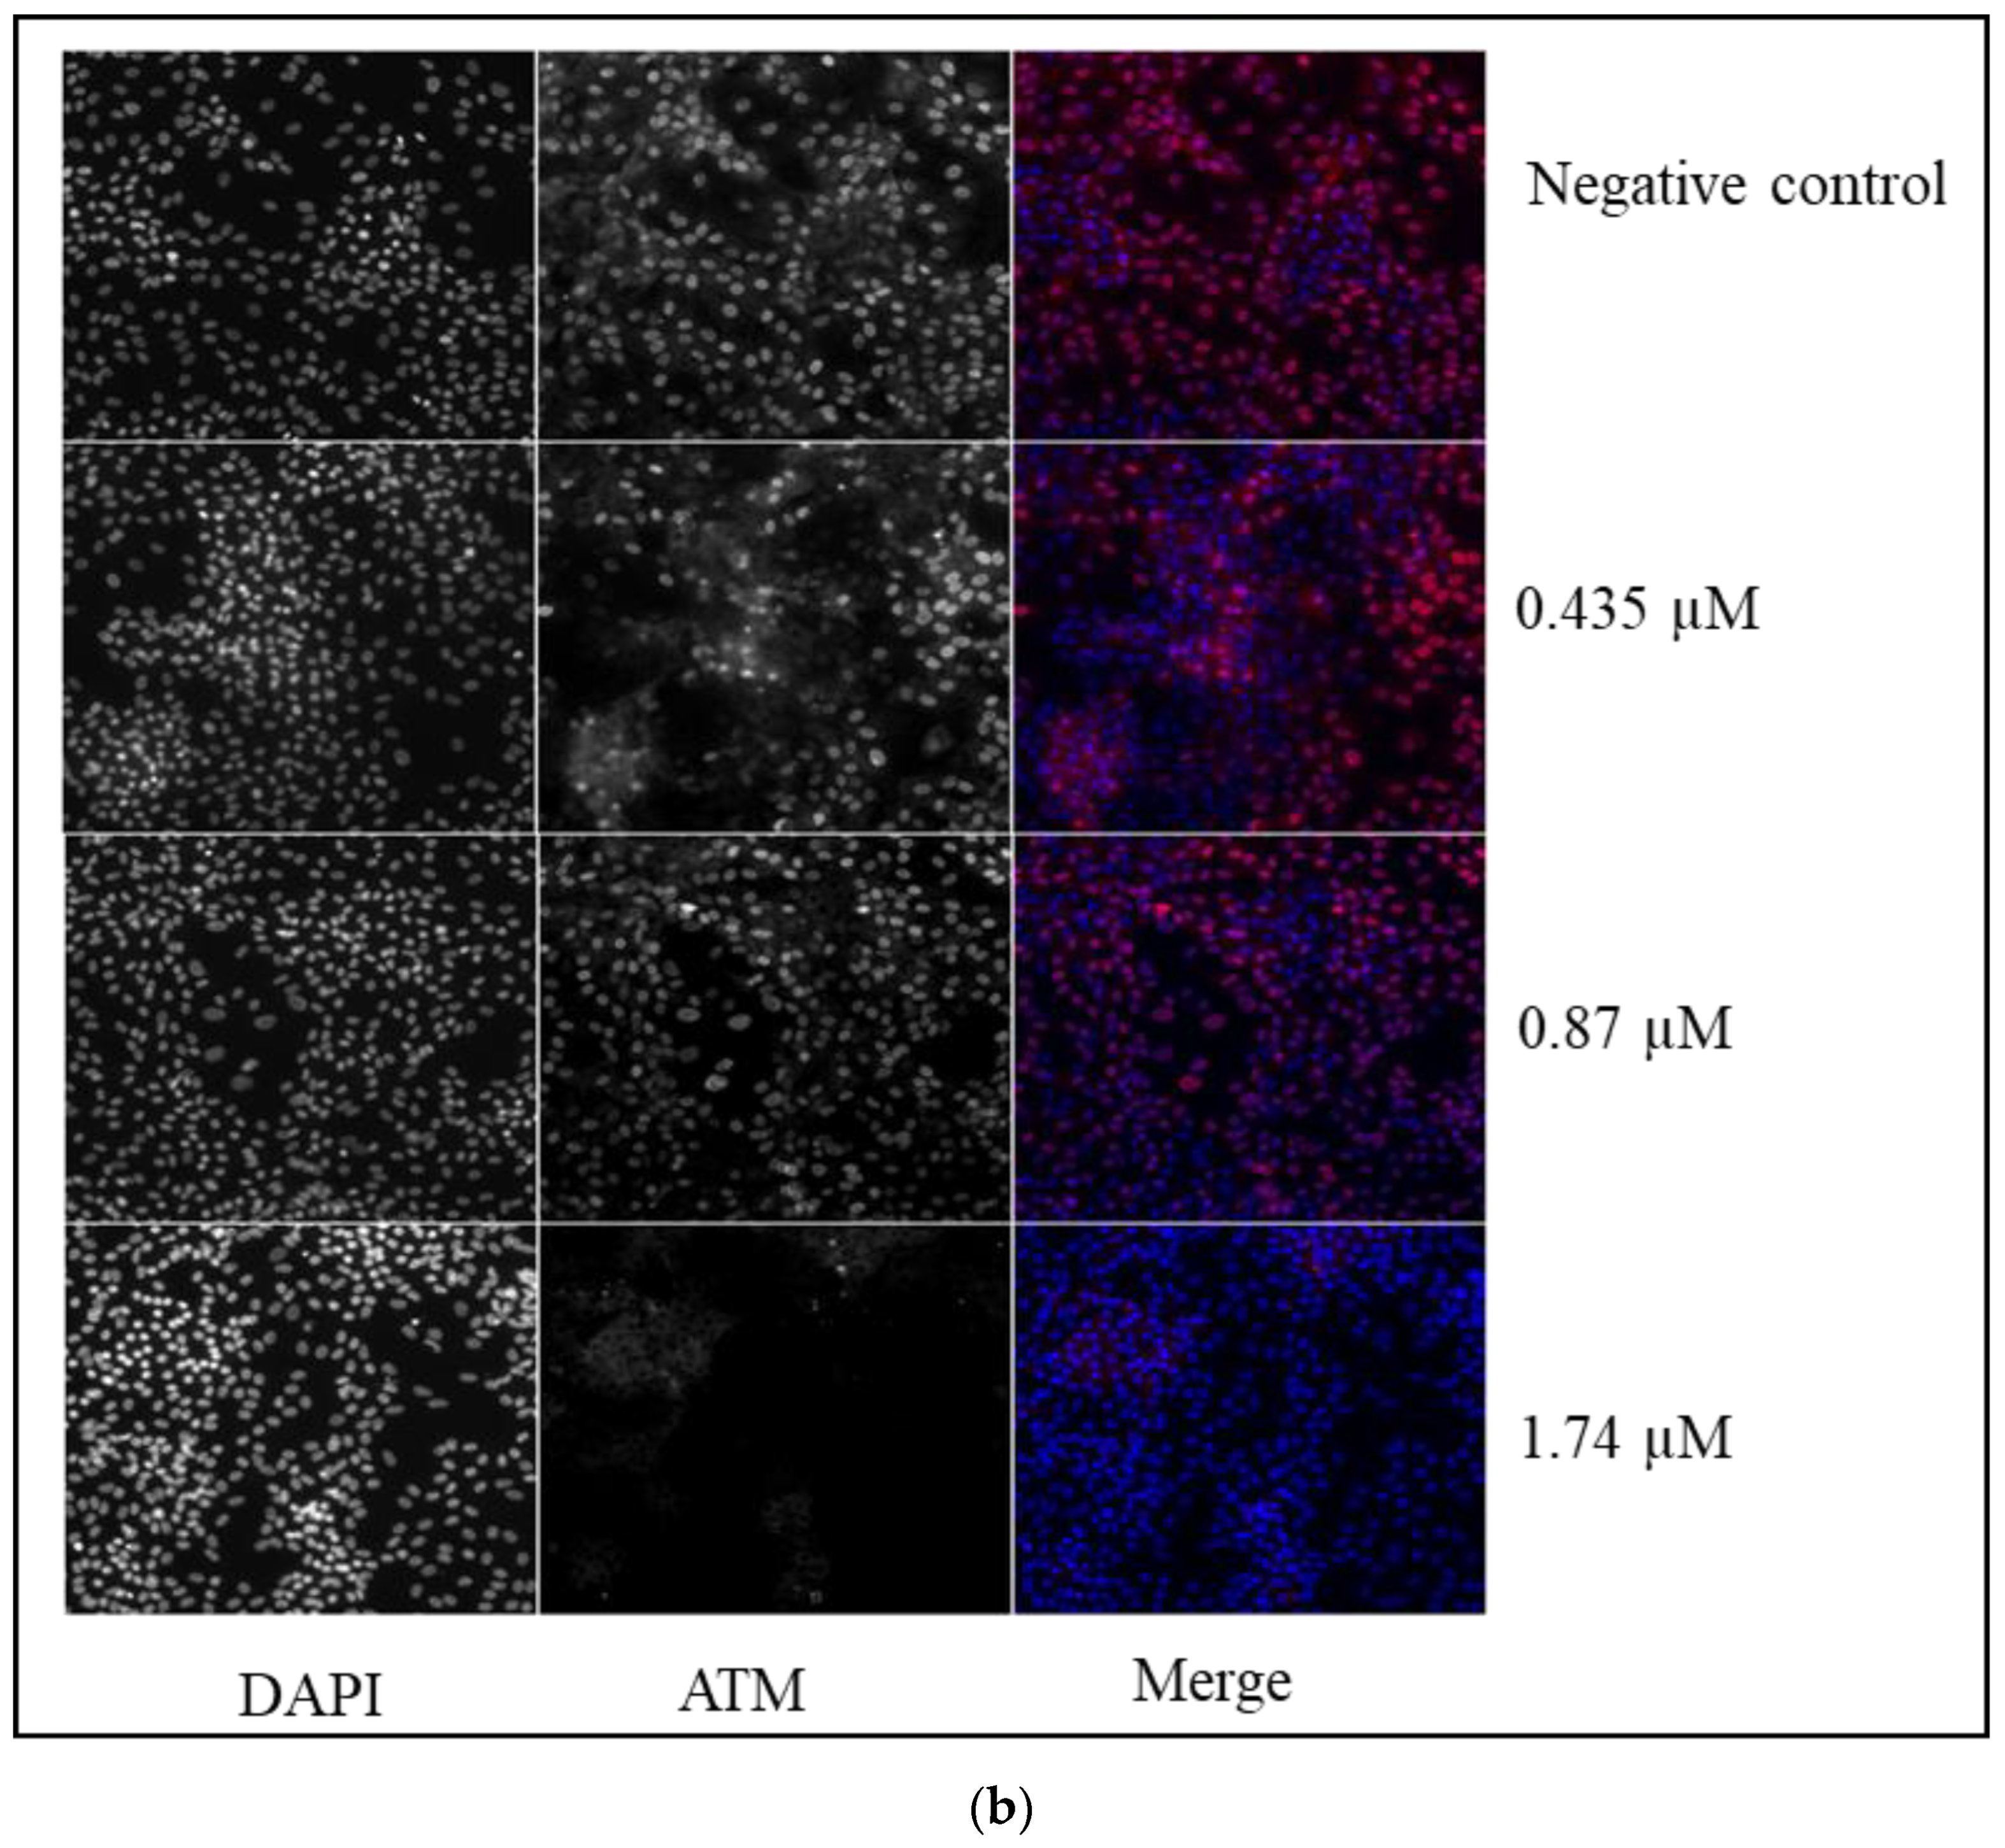
- Ataxia telangiectasia mutated (phospho ATM S1981)
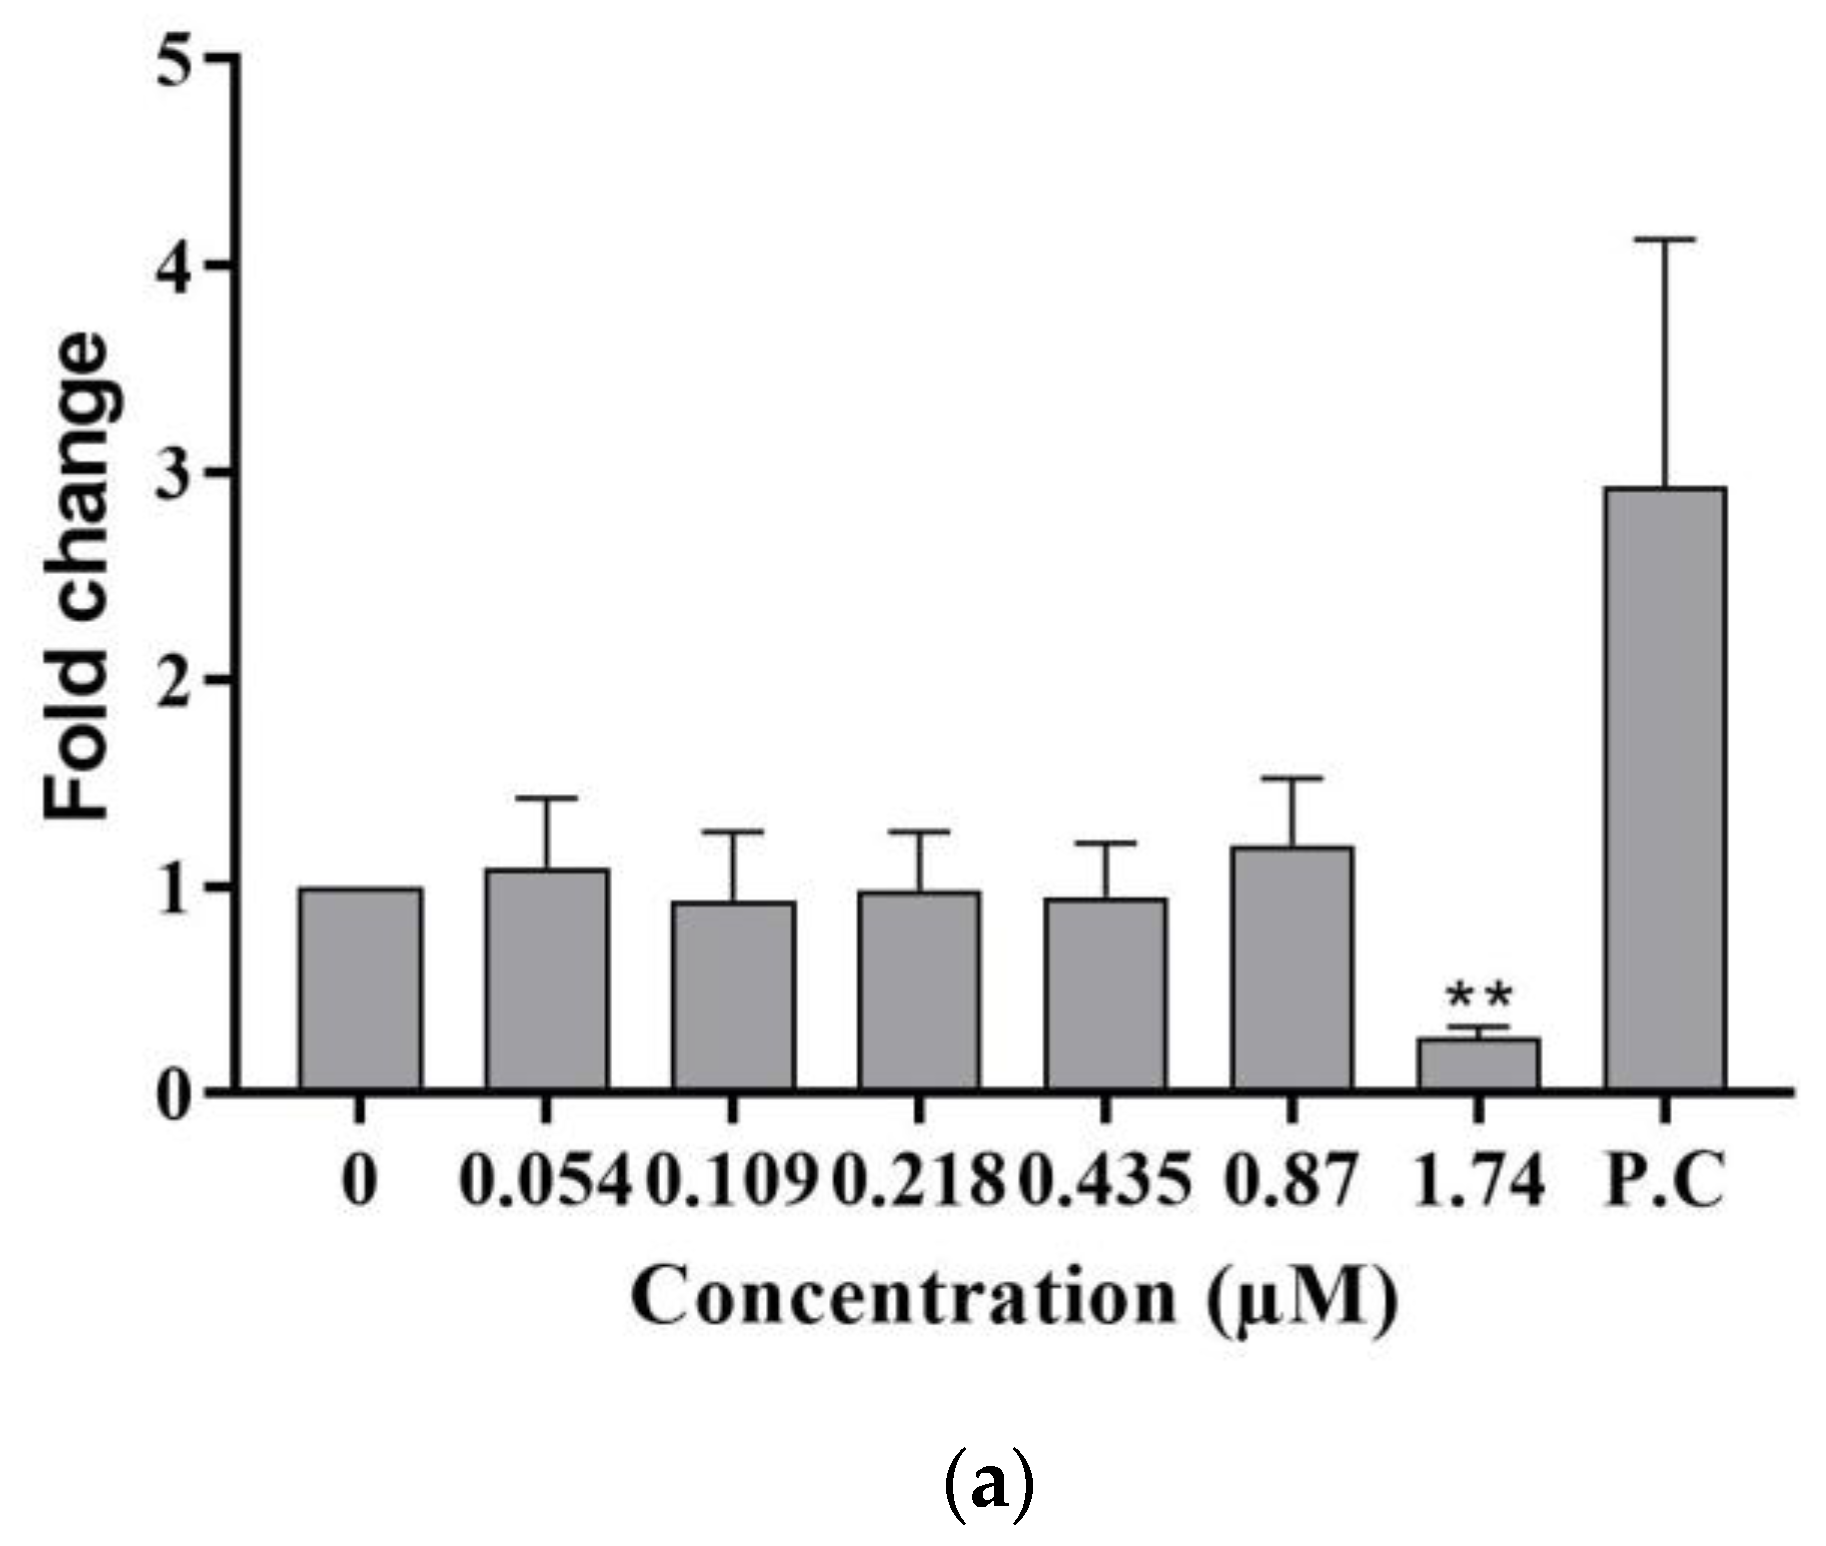
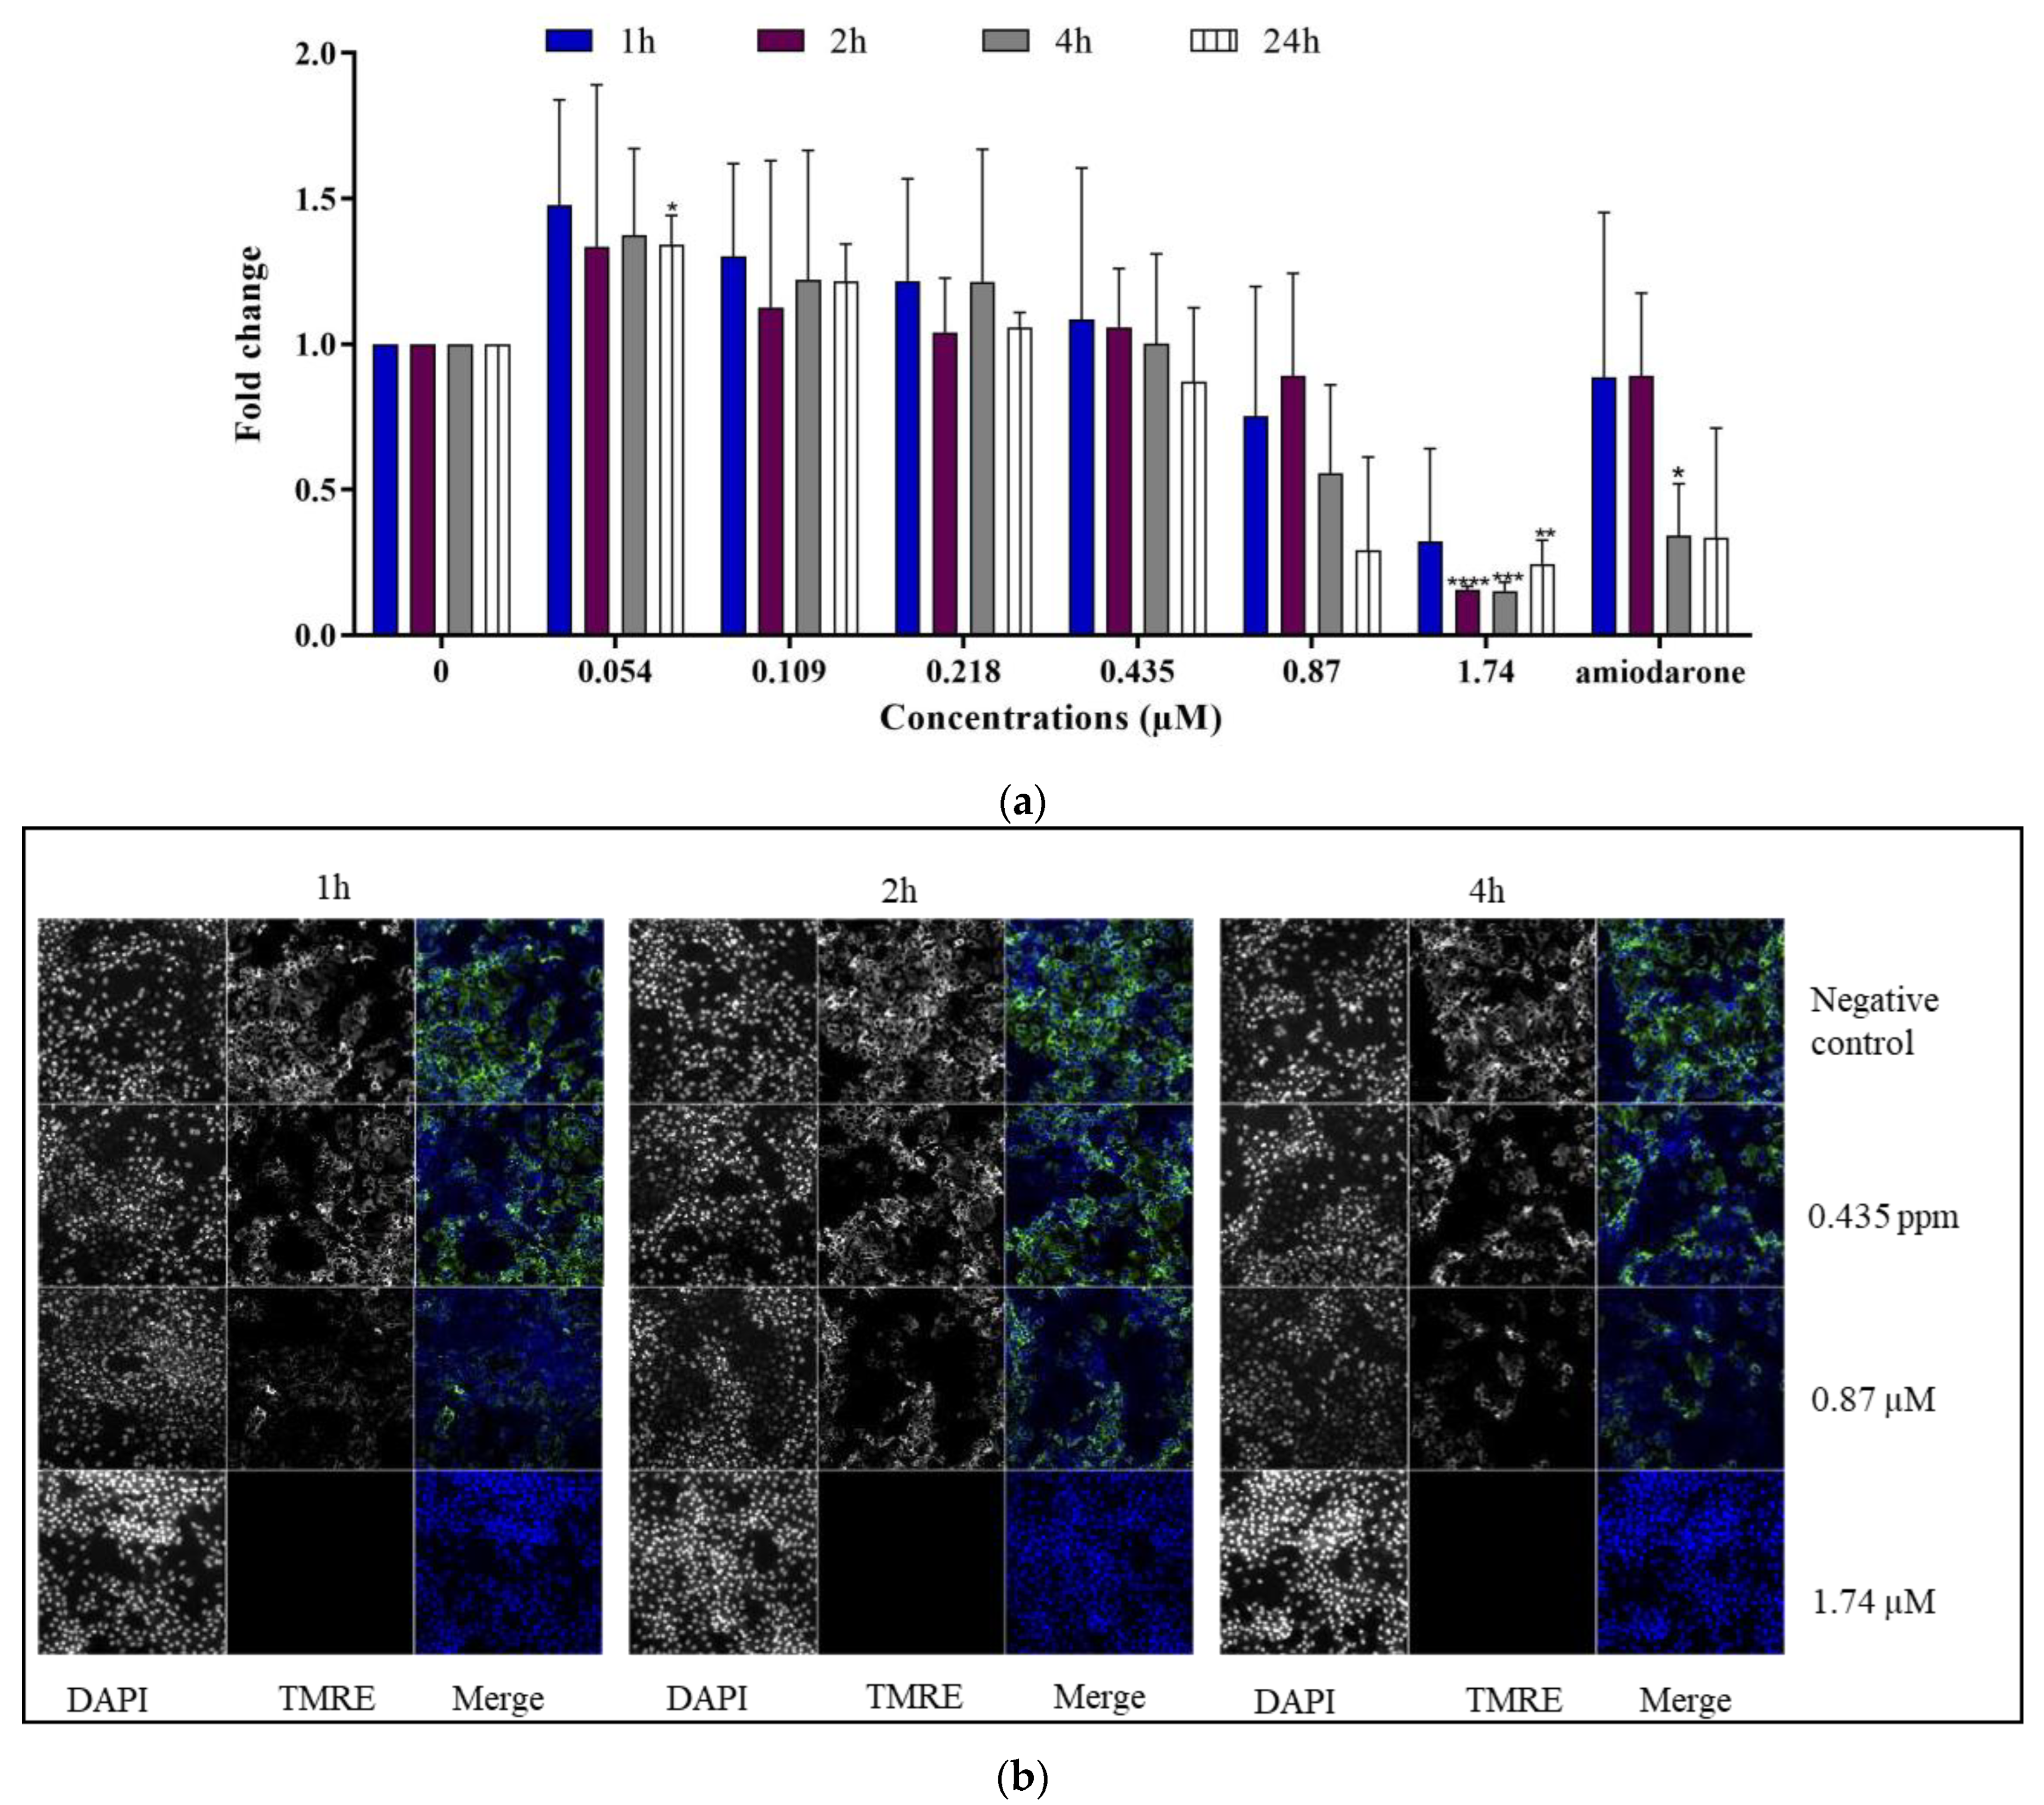
2.2.2. Mitochondrial Membrane Potential (ΔΨm)
- TMRE labeling
- ATP levels
2.2.3. Inflammatory Response
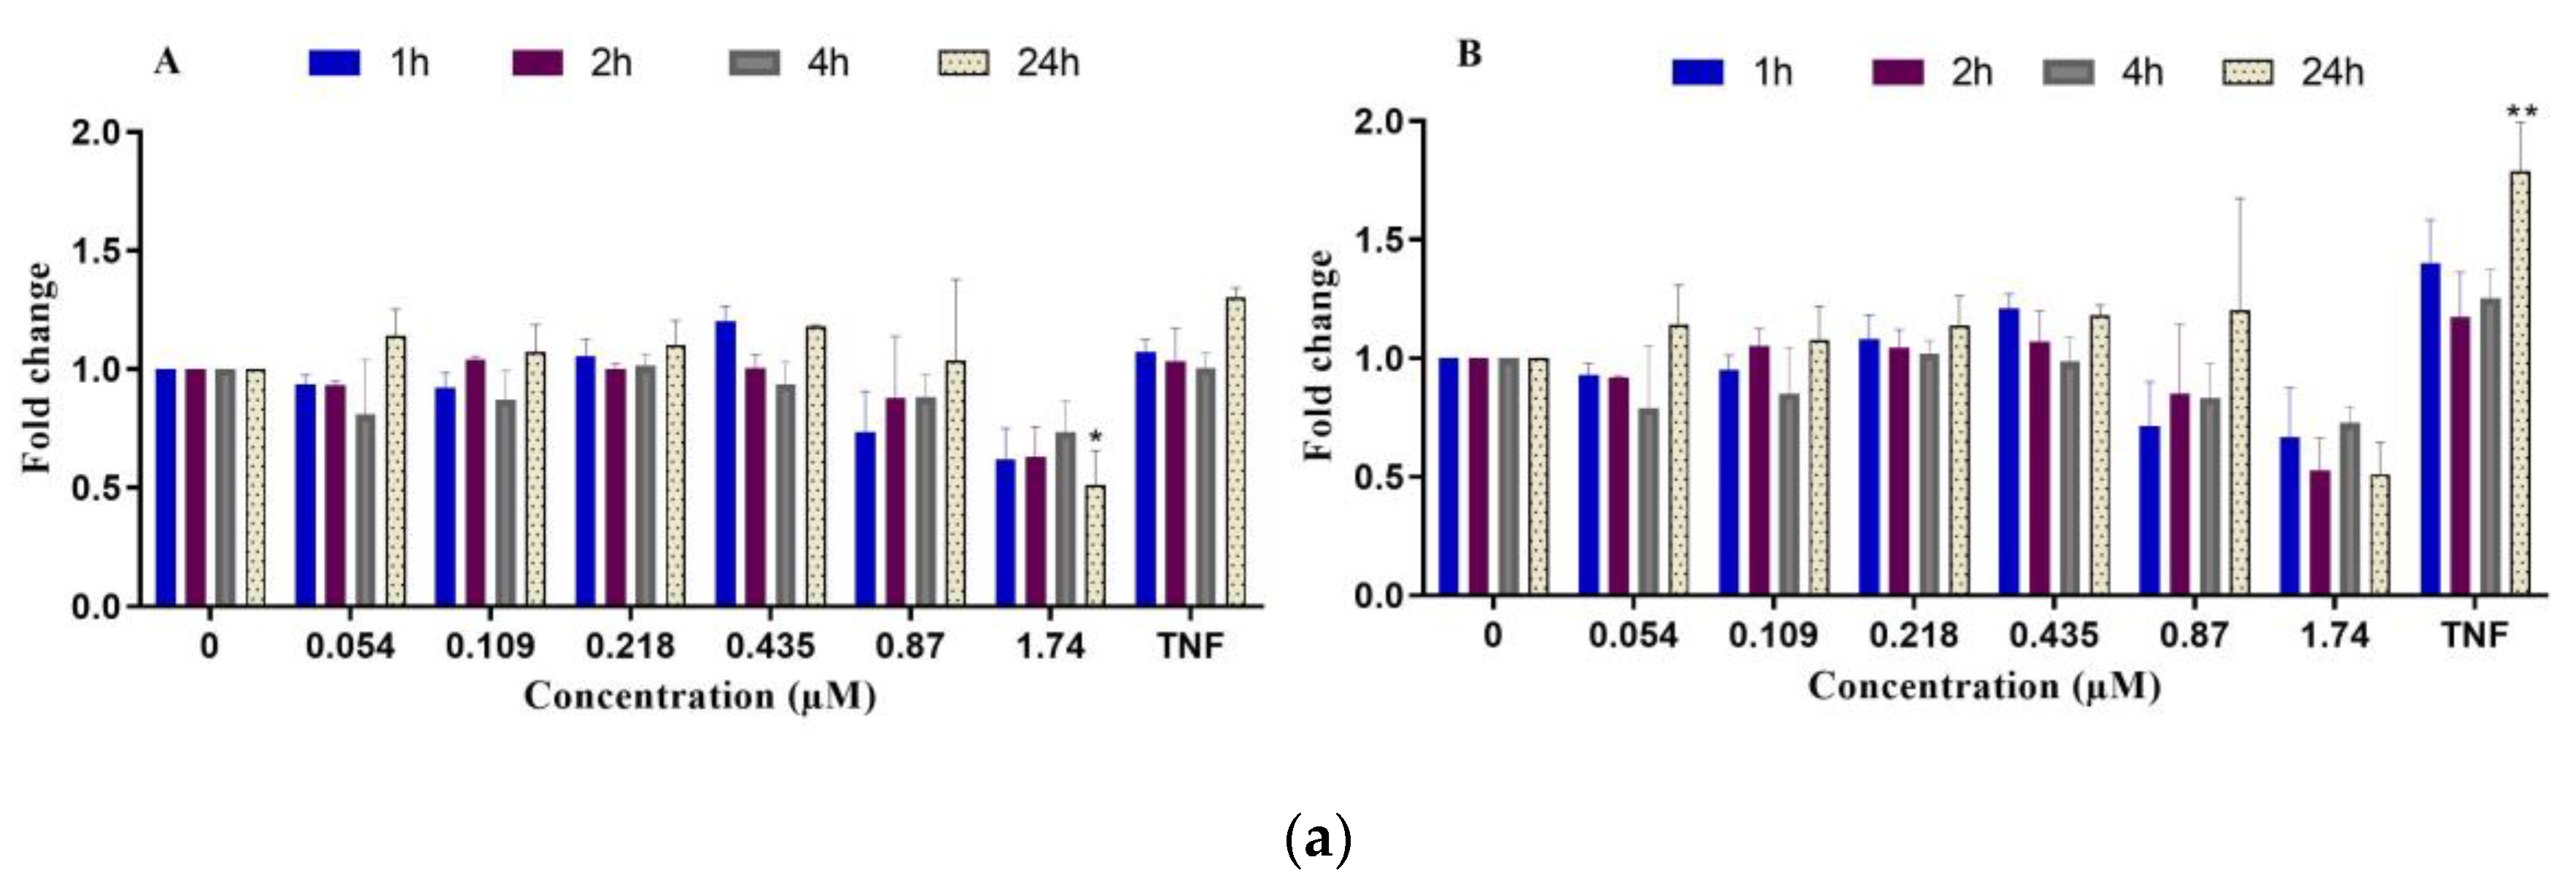
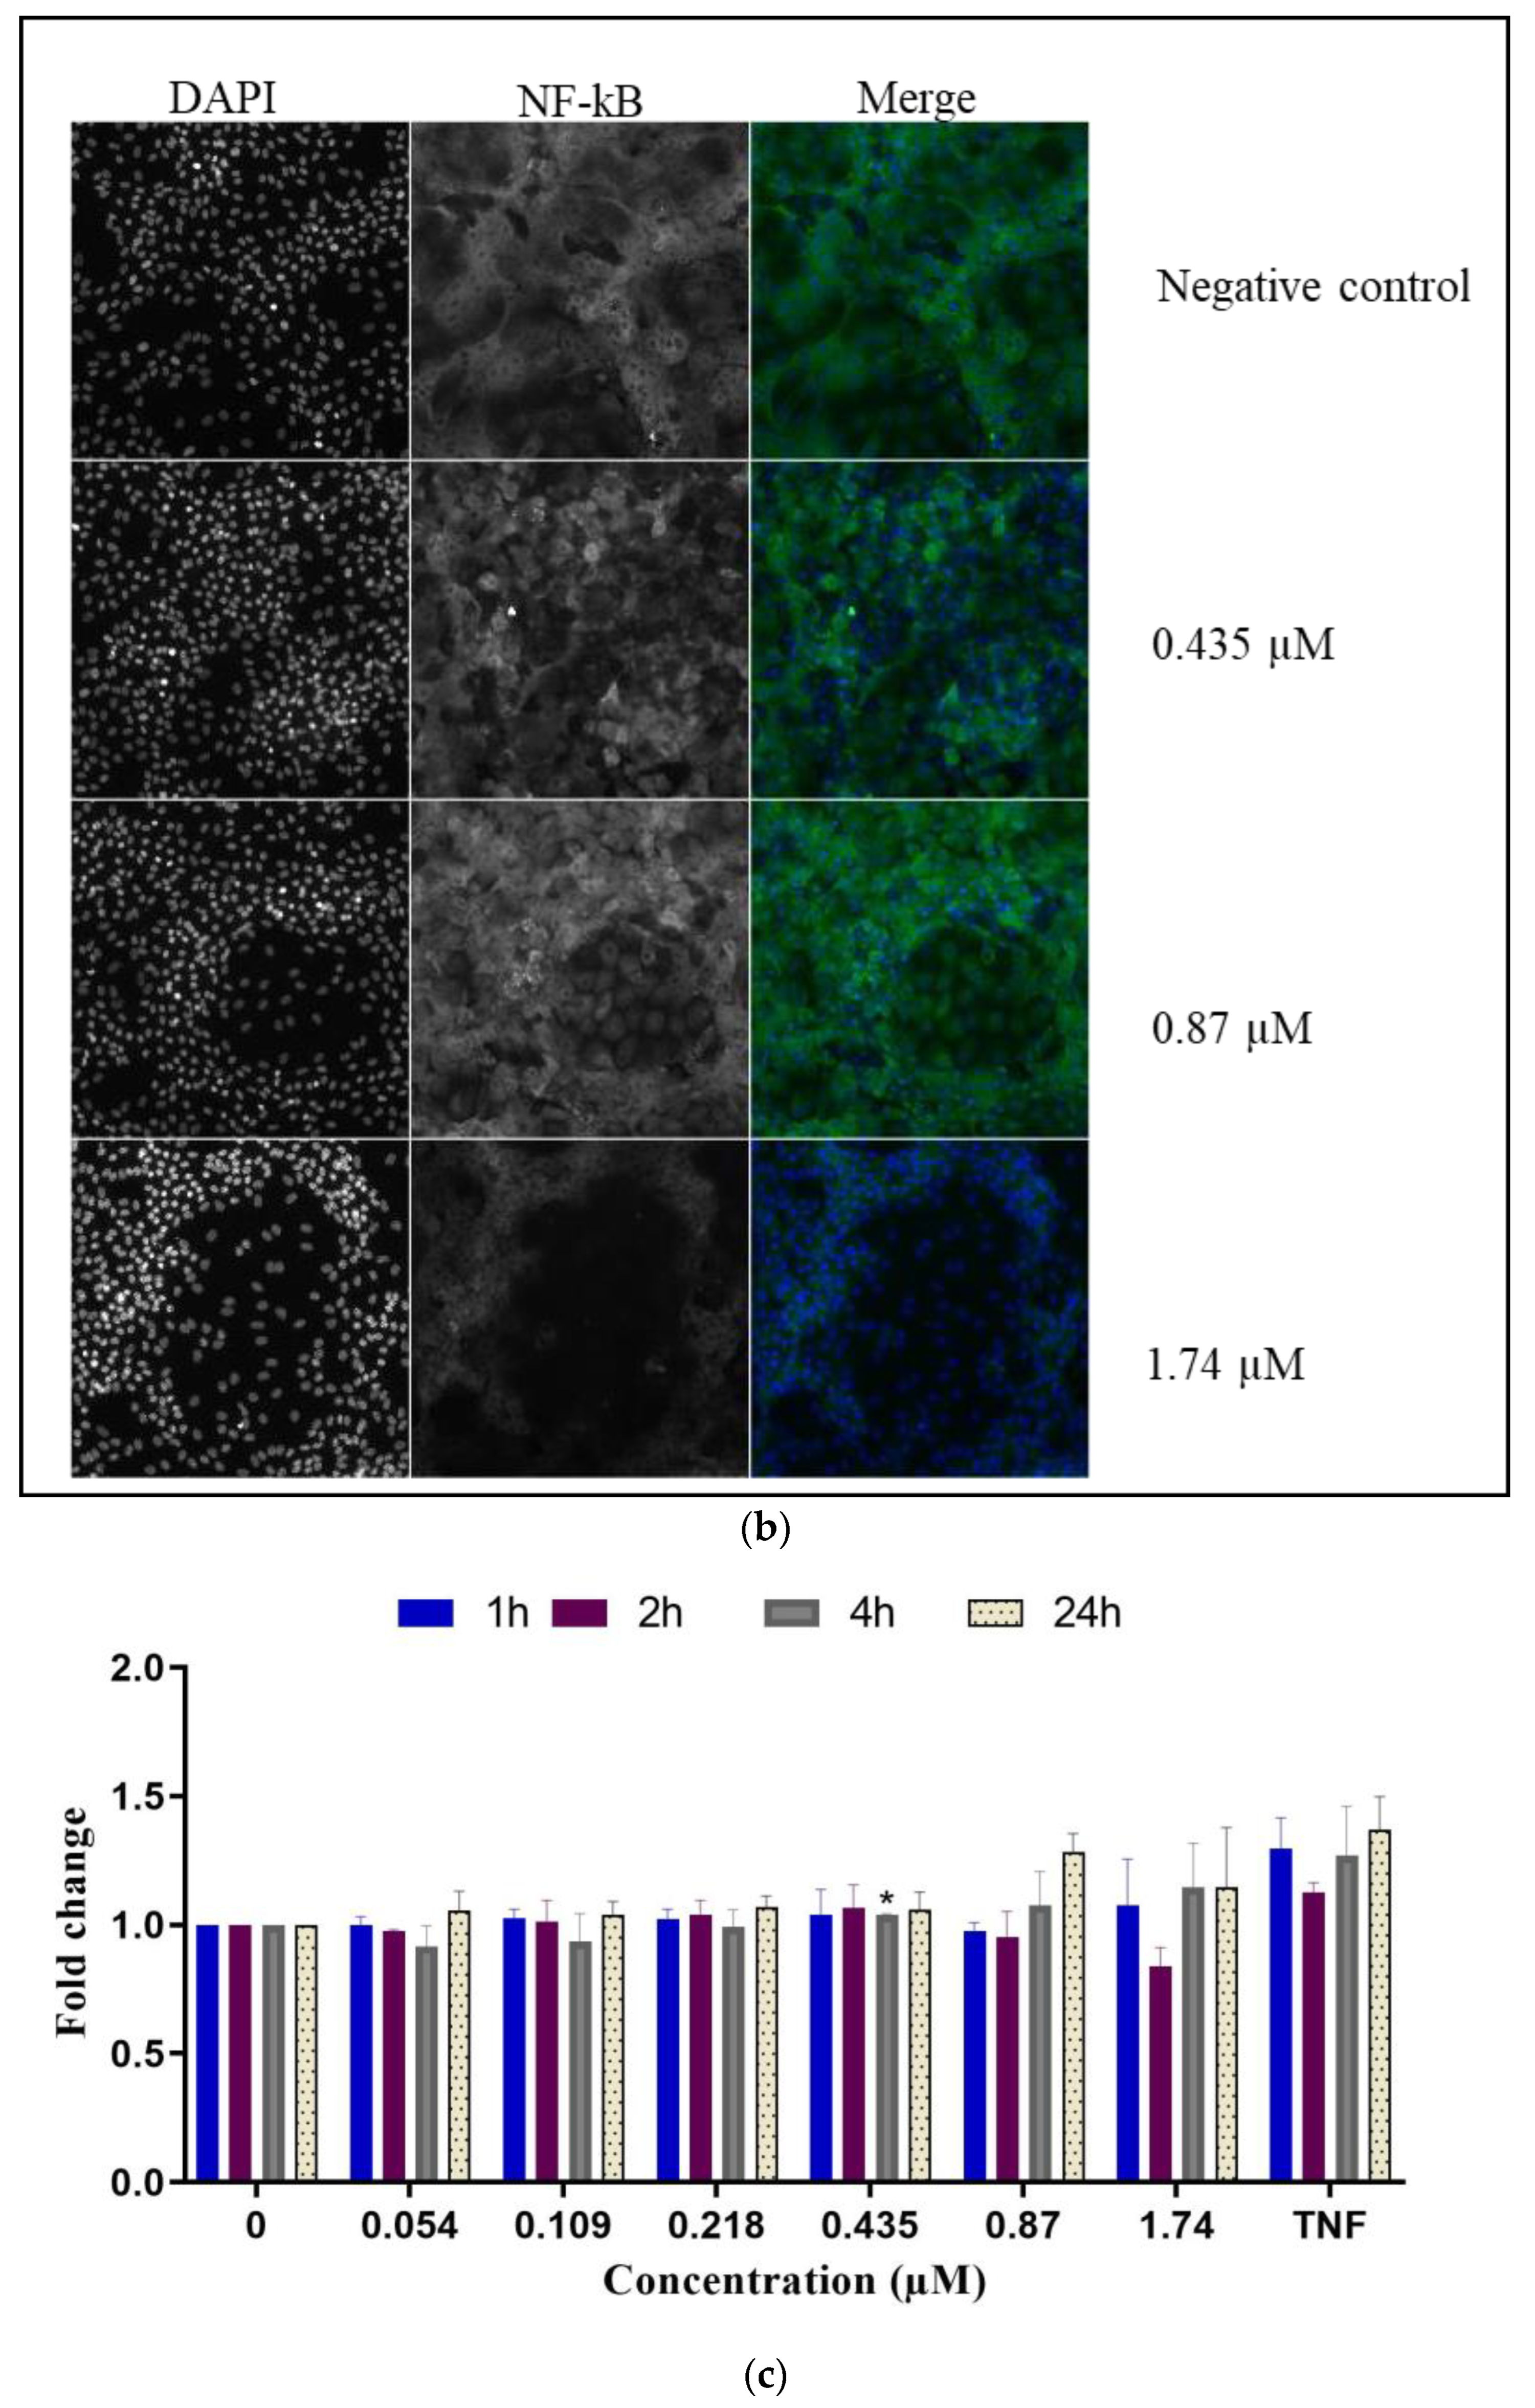
- NF-κB translocation
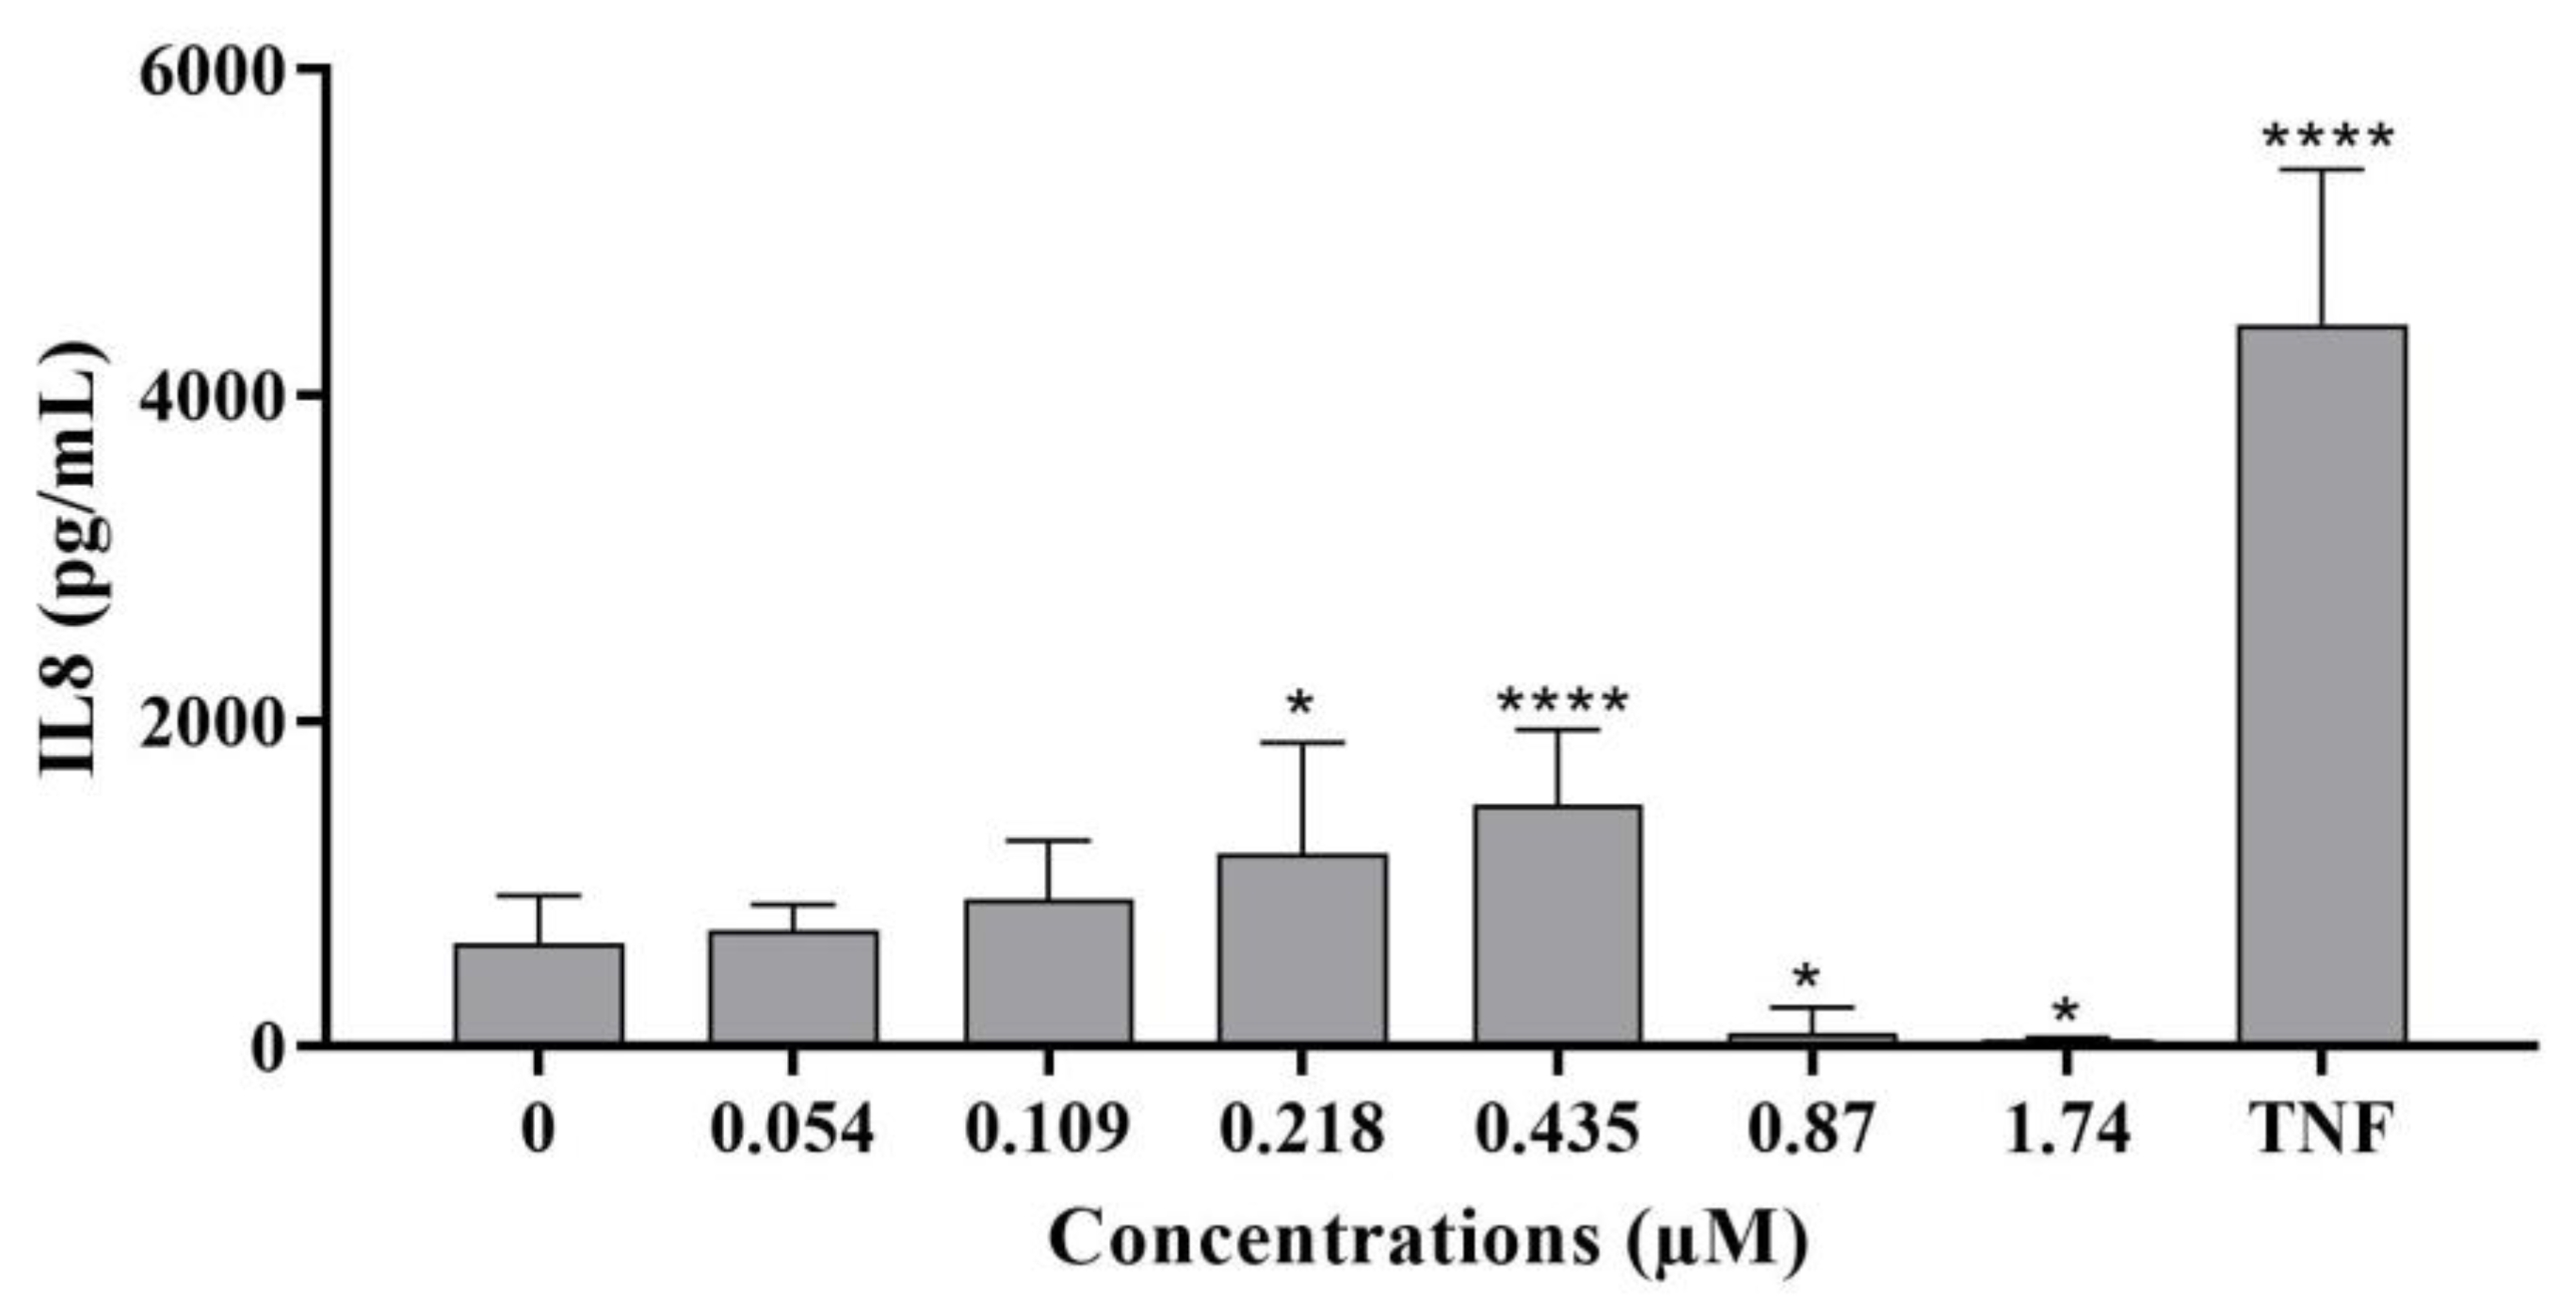
- IL-8 levels
2.2.4. Oxidative Stress
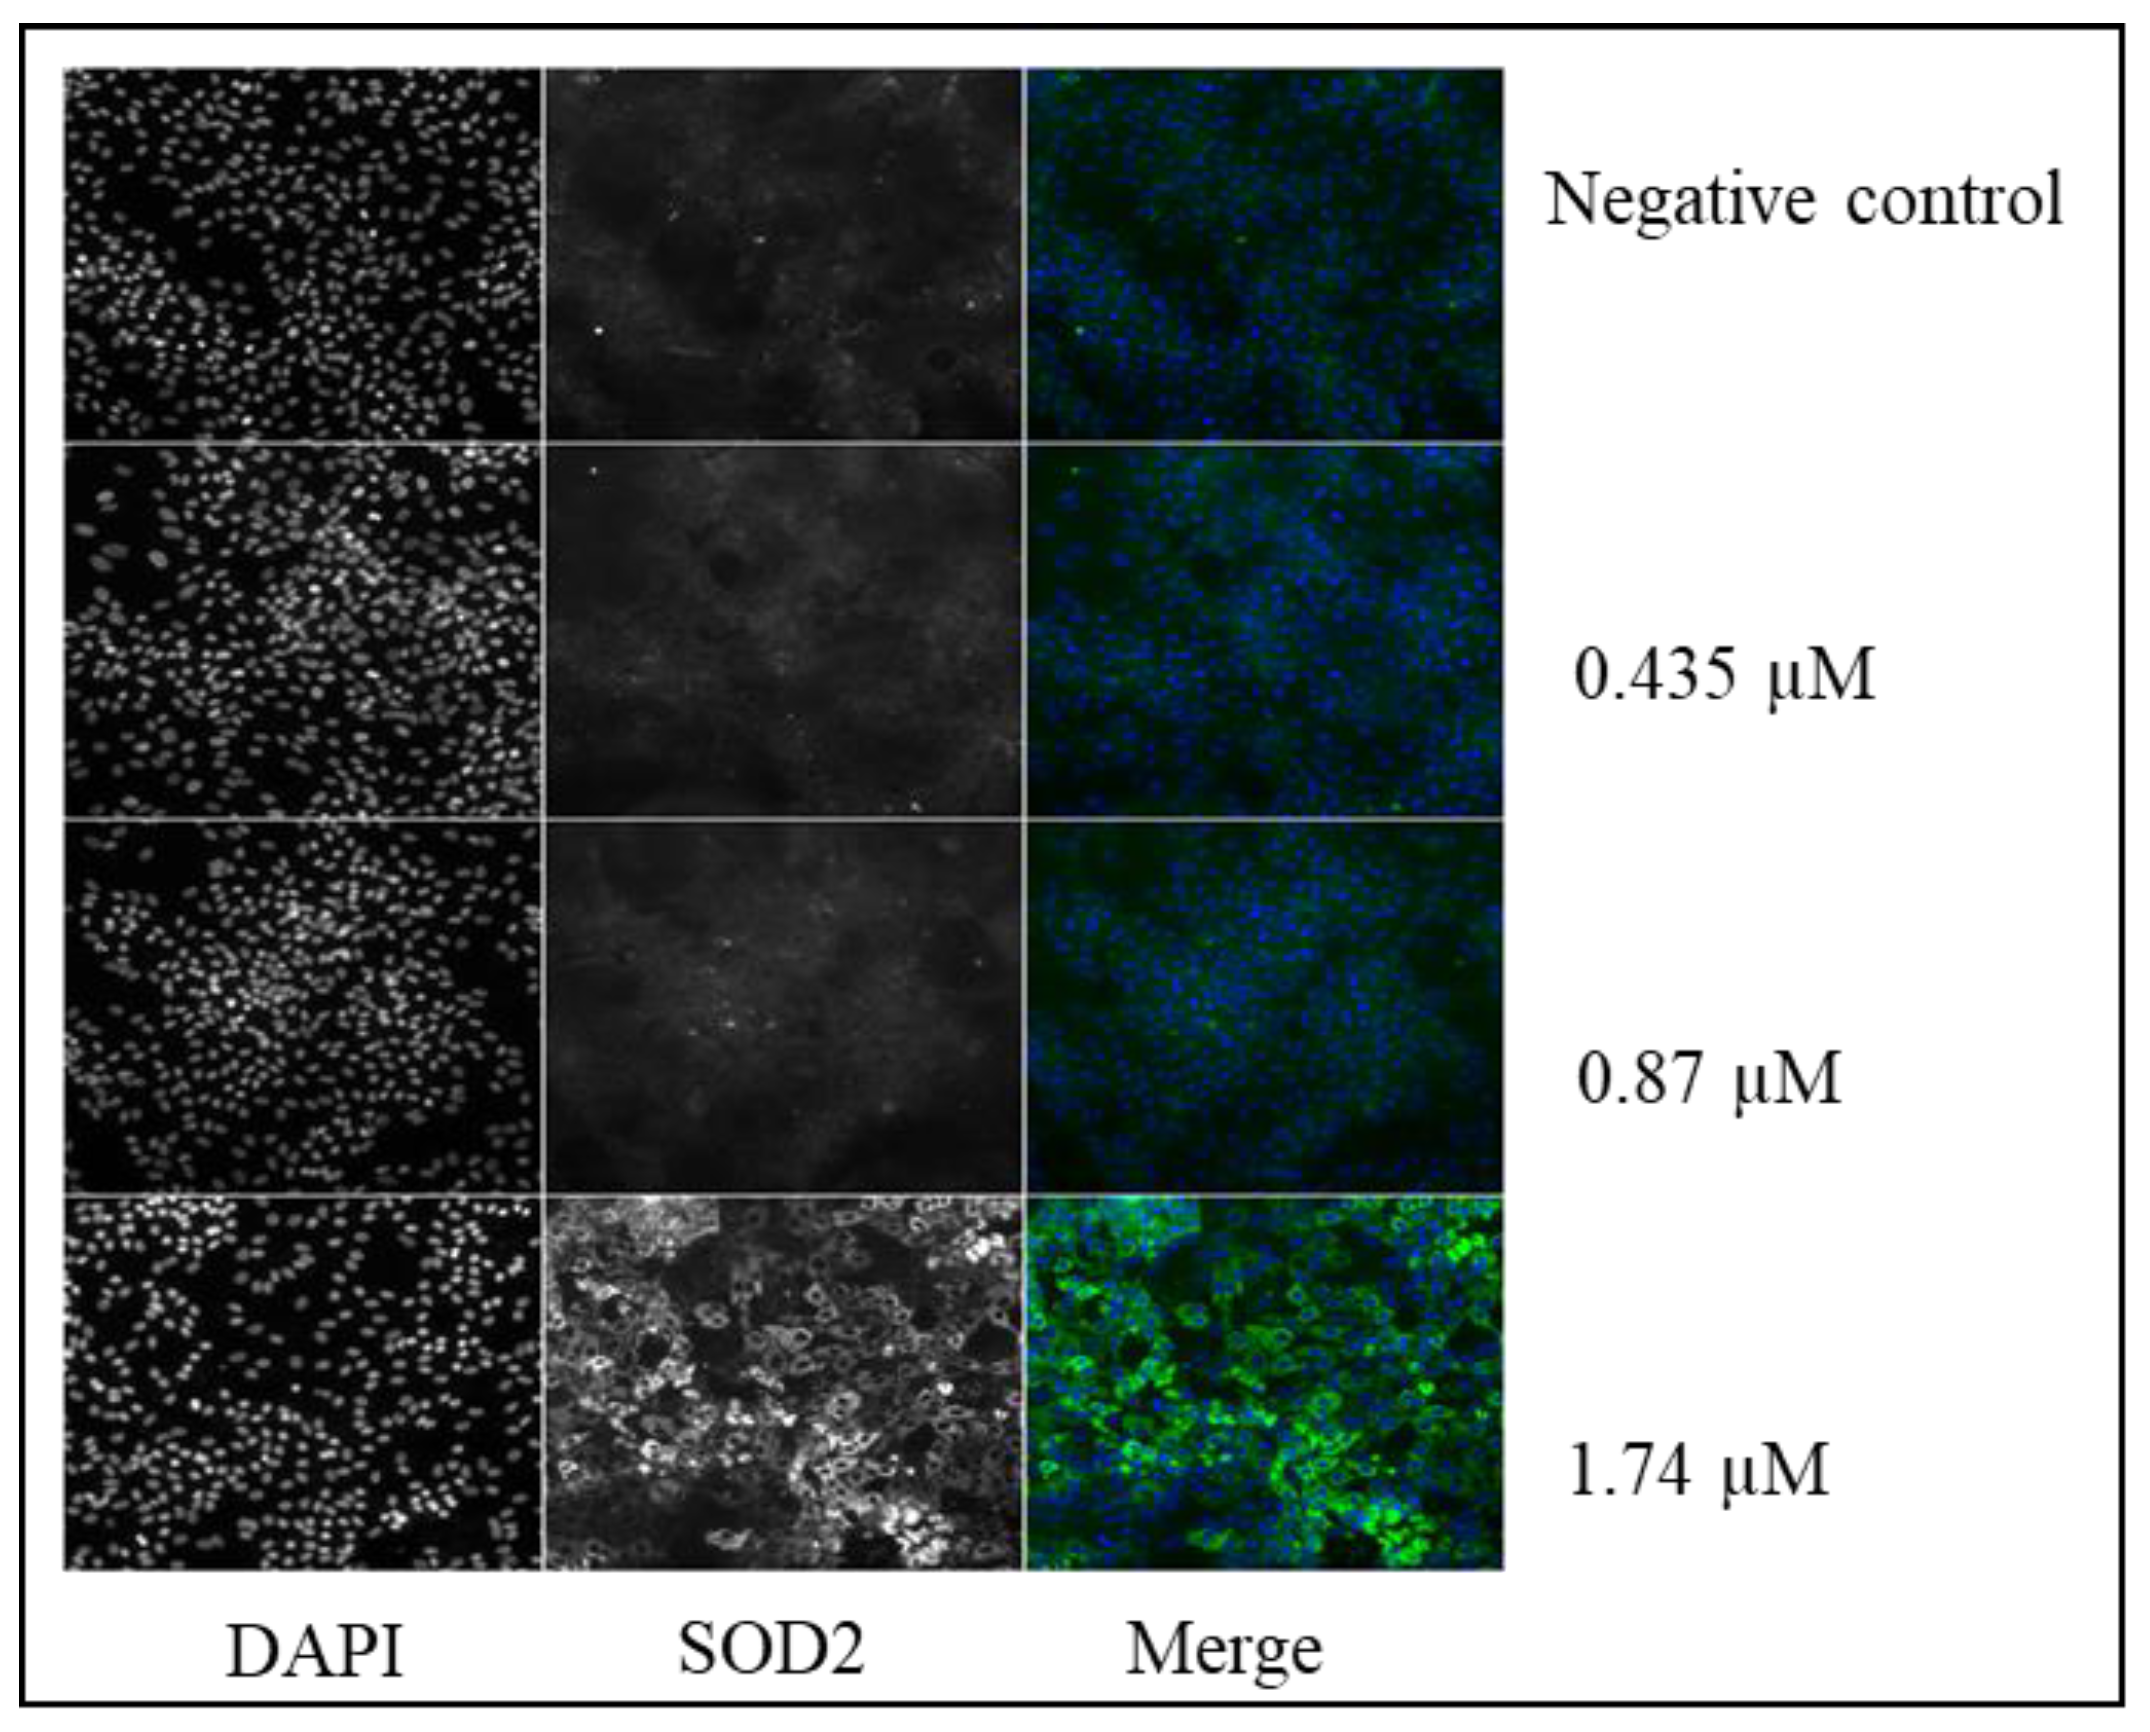
- Superoxide dismutase (SOD2)
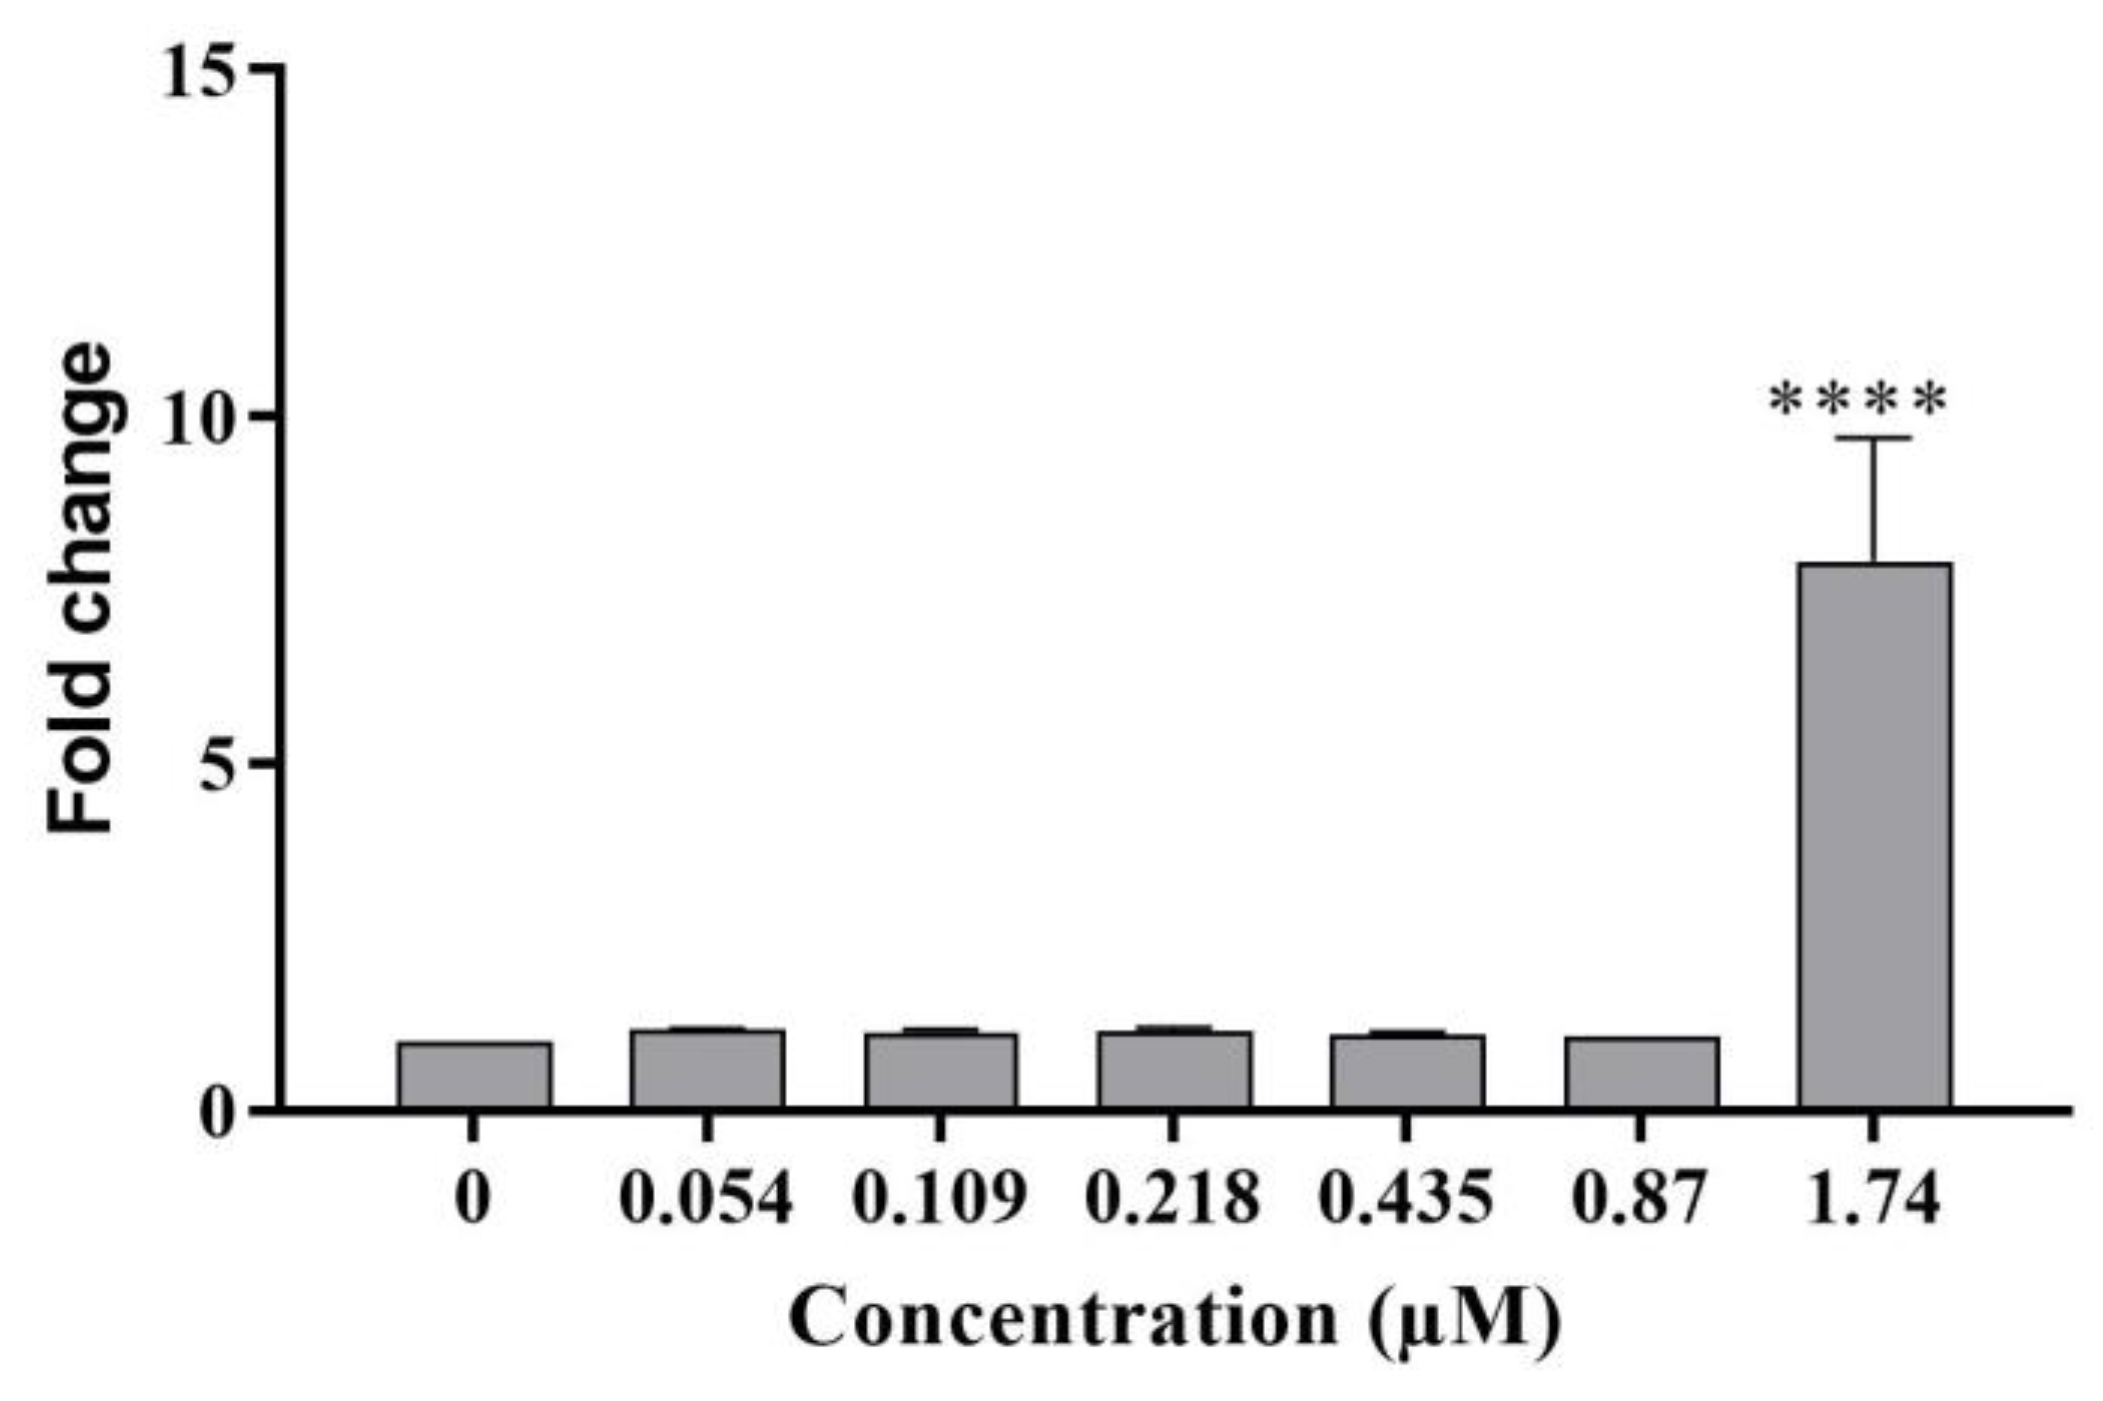
- Heme oxygenase-1
3. Discussion
4. Materials and Methods
4.1. Chemicals and Reagents
4.1.1. Shellfish Sampling
4.1.2. Chemicals and Reagents
4.1.3. Cell Culture
- TK6 cells
- HepaRG cells
4.1.4. Micronucleus Assay in TK6 Cells
4.1.5. High Content Analysis
4.1.6. Mitochondrial Activity
- Mitochondrial transmembrane potential: TMRE
- ATP levels
4.1.7. IL-8 Enzyme-Linked Immunosorbent Assay (ELISA)
4.1.8. Statistical Analysis
5. Conclusions
Supplementary Materials
Author Contributions
Funding
Institutional Review Board Statement
Informed Consent Statement
Data Availability Statement
Conflicts of Interest
References
- Amend, A.; Burgaud, G.; Cunliffe, M.; Edgcomb, V.P.; Ettinger, C.L.; Gutiérrez, M.H.; Heitman, J.; Hom, E.F.Y.; Ianiri, G.; Jones, A.C.; et al. Fungi in the Marine Environment: Open Questions and Unsolved Problems. mBio 2019, 10, e01189-18. [Google Scholar] [CrossRef] [PubMed]
- Gürbüzel, M.; Uysal, H.; Kızılet, H. Assessment of Genotoxic Potential of Two Mycotoxins in the Wing Spot Test of Drosophila Melanogaster. Toxicol. Ind. Health 2015, 31, 261–267. [Google Scholar] [CrossRef]
- Bensassi, F.; Gallerne, C.; Sharaf el dein, O.; Hajlaoui, M.R.; Lemaire, C.; Bacha, H. In Vitro Investigation of Toxicological Interactions between the Fusariotoxins Deoxynivalenol and Zearalenone. Toxicon 2014, 84, 1–6. [Google Scholar] [CrossRef] [PubMed]
- Ülger, T.G.; Uçar, A.; Çakıroğlu, F.P.; Yilmaz, S. Genotoxic Effects of Mycotoxins. Toxicon 2020, 185, 104–113. [Google Scholar] [CrossRef]
- Wen, J.; Mu, P.; Deng, Y. Mycotoxins: Cytotoxicity and Biotransformation in Animal Cells. Toxicol. Res. 2016, 5, 377–387. [Google Scholar] [CrossRef]
- Becit, M.; Aydin, S.; Baydar, T. Mikotoksinlerin Genotoksik Etkileri. J. Lit. Pharm. Sci. 2017, 6, 59–76. [Google Scholar] [CrossRef]
- Gupta, R.; Rahi Alhachami, F.; Khalid, I.; Majdi, H.S.; Nisar, N.; Mohamed Hasan, Y.; Sivaraman, R.; Romero Parra, R.M.; Al Mashhadani, Z.I.; Fakri Mustafa, Y. Recent Progress in Aptamer-Functionalized Metal-Organic Frameworks-Based Optical and Electrochemical Sensors for Detection of Mycotoxins. Crit. Rev. Anal. Chem. 2022, 1–22. [Google Scholar] [CrossRef] [PubMed]
- Orsi, W.; Biddle, J.F.; Edgcomb, V. Deep Sequencing of Subseafloor Eukaryotic RRNA Reveals Active Fungi across Marine Subsurface Provinces. PLoS ONE 2013, 8, e56335. [Google Scholar] [CrossRef]
- Pollock, C.G.; Rohrbach, B.; Ramsay, E.C. Fungal Dermatitis in Captive Pinnipeds. J. Zoo Wildl. Med. 2000, 31, 374–378. [Google Scholar] [CrossRef]
- Rämä, T.; Nordén, J.; Davey, M.L.; Mathiassen, G.H.; Spatafora, J.W.; Kauserud, H. Fungi Ahoy! Diversity on Marine Wooden Substrata in the High North. Fungal Ecol. 2014, 8, 46–58. [Google Scholar] [CrossRef]
- Taylor, J.D.; Cunliffe, M. Multi-Year Assessment of Coastal Planktonic Fungi Reveals Environmental Drivers of Diversity and Abundance. ISME J. 2016, 10, 2118–2128. [Google Scholar] [CrossRef] [PubMed]
- Wainwright, B.J.; Zahn, G.L.; Spalding, H.L.; Sherwood, A.R.; Smith, C.M.; Amend, A.S. Fungi Associated with Mesophotic Macroalgae from the ‘Au’au Channel, West Maui Are Differentiated by Host and Overlap Terrestrial Communities. PeerJ 2017, 5, e3532. [Google Scholar] [CrossRef] [PubMed]
- Yarden, O. Fungal Association with Sessile Marine Invertebrates. Front. Microbiol. 2014, 5, 228. [Google Scholar] [CrossRef] [PubMed]
- Grovel, O.; Pouchus, Y.F.; Verbist, J.-F. Accumulation of Gliotoxin, a Cytotoxic Mycotoxin from Aspergillus Fumigatus, in Blue Mussel (Mytilus Edulis). Toxicon 2003, 42, 297–300. [Google Scholar] [CrossRef]
- Poirier, L.; Montagu, M.; Landreau, A.; Mohamed-Benkada, M.; Grovel, O.; Sallenave-Namont, C.; Biard, J.-F.; Amiard-Triquet, C.; Amiard, J.-C.; Pouchus, Y.F. Peptaibols: Stable Markers of Fungal Development in the Marine Environment. Chem. Biodivers. 2007, 4, 1116–1128. [Google Scholar] [CrossRef]
- Mirza Alizadeh, A.; Mousavi Khaneghah, A.; Hosseini, H. Mycotoxins and Mycotoxigenic Fungi in Aquaculture and Seafood: A Review and New Perspective. Toxin Rev. 2022, 41, 1058–1065. [Google Scholar] [CrossRef]
- Marrouchi, R.; Benoit, E.; Le Caer, J.-P.; Belayouni, N.; Belghith, H.; Molgó, J.; Kharrat, R. Toxic C17-Sphinganine Analogue Mycotoxin, Contaminating Tunisian Mussels, Causes Flaccid Paralysis in Rodents. Mar. Drugs 2013, 11, 4724–4740. [Google Scholar] [CrossRef]
- Marzougui, Z.; Huet, S.; Blier, A.-L.; Hégarat, L.L.; Tounsi-Kettiti, H.; Kharrat, R.; Marrouchi, R.; Fessard, V. Investigation of the Genotoxic Potential of the Marine Toxin C17-SAMT Using the In Vivo Comet and Micronucleus Assays. Mar. Drugs 2022, 20, 619. [Google Scholar] [CrossRef]
- OCDE. Test No. 487: In Vitro Mammalian Cell Micronucleus Test; OECD Publishing: Paris, France, 2016. [Google Scholar]
- Barouki, R.; Samson, M.; Blanc, E.B.; Colombo, M.; Zucman-Rossi, J.; Lazaridis, K.N.; Miller, G.W.; Coumoul, X. The Exposome and Liver Disease—How Environmental Factors Affect Liver Health. J. Hepatol. 2023, S0168-8278(23)00166-6. [Google Scholar] [CrossRef]
- Zhang, Y.; Qi, Y.; Huang, S.; Jiang, X.; Xiao, W.; Wang, L.; Liu, Z.; Liu, S. Role of ER Stress in Xenobiotic-Induced Liver Diseases and Hepatotoxicity. Oxid. Med. Cell. Longev. 2022, 2022, 4640161. [Google Scholar] [CrossRef]
- Guo, X.; Seo, J.-E.; Petibone, D.; Tryndyak, V.; Lee, U.J.; Zhou, T.; Robison, T.W.; Mei, N. Performance of HepaRG and HepG2 Cells in the High-Throughput Micronucleus Assay for in Vitro Genotoxicity Assessment. J. Toxicol. Environ. Health A 2020, 83, 702–717. [Google Scholar] [CrossRef]
- Honma, M. Cytotoxicity Measurement in in Vitro Chromosome Aberration Test and Micronucleus Test. Mutat. Res. Toxicol. Environ. Mutagen. 2011, 724, 86–87. [Google Scholar] [CrossRef] [PubMed]
- O’Donovan, M. A Critique of Methods to Measure Cytotoxicity in Mammalian Cell Genotoxicity Assays. Mutagenesis 2012, 27, 615–621. [Google Scholar] [CrossRef] [PubMed]
- Rumora, L.; Kovačić, S.; Rozgaj, R.; Čepelak, I.; Pepeljnjak, S.; Žanić Grubišić, T. Cytotoxic and Genotoxic Effects of Fumonisin B1 on Rabbit Kidney RK13 Cell Line. Arch. Toxicol. 2002, 76, 55–61. [Google Scholar] [CrossRef]
- Ehrlich, V.; Darroudi, F.; Uhl, M.; Steinkellner, H.; Zsivkovits, M.; Knasmueller, S. Fumonisin B(1) Is Genotoxic in Human Derived Hepatoma (HepG2) Cells. Mutagenesis 2002, 17, 257–260. [Google Scholar] [CrossRef]
- Lerda, D.; Biaggi Bistoni, M.; Peralta, N.; Ychari, S.; Vazquez, M.; Bosio, G. Fumonisins in Foods from Cordoba (Argentina), Presence and Genotoxicity. Food Chem. Toxicol. 2005, 43, 691–698. [Google Scholar] [CrossRef]
- Hans, F.; Dimitrov, S. Histone H3 Phosphorylation and Cell Division. Oncogene 2001, 20, 3021–3027. [Google Scholar] [CrossRef] [PubMed]
- Khoury, L.; Zalko, D.; Audebert, M. Complementarity of Phosphorylated Histones H2AX and H3 Quantification in Different Cell Lines for Genotoxicity Screening. Arch. Toxicol. 2016, 90, 1983–1995. [Google Scholar] [CrossRef]
- Ibuki, Y.; Toyooka, T. Evaluation of Chemical Phototoxicity, Focusing on Phosphorylated Histone H2AX. J. Radiat. Res. 2015, 56, 220–228. [Google Scholar] [CrossRef]
- Cheung, J.R.; Dickinson, D.A.; Moss, J.; Schuler, M.J.; Spellman, R.A.; Heard, P.L. Histone Markers Identify the Mode of Action for Compounds Positive in the TK6 Micronucleus Assay. Mutat. Res. Genet. Toxicol. Environ. Mutagen. 2015, 777, 7–16. [Google Scholar] [CrossRef]
- Muehlbauer, P.A.; Schuler, M.J. Detection of Numerical Chromosomal Aberrations by Flow Cytometry: A Novel Process for Identifying Aneugenic Agents. Mutat. Res. 2005, 585, 156–169. [Google Scholar] [CrossRef] [PubMed]
- Sawicka, A.; Seiser, C. Histone H3 Phosphorylation—a Versatile Chromatin Modification for Different Occasions. Biochimie 2012, 94, 2193–2201. [Google Scholar] [CrossRef]
- Bryce, S.M.; Bernacki, D.T.; Bemis, J.C.; Spellman, R.A.; Engel, M.E.; Schuler, M.; Lorge, E.; Heikkinen, P.T.; Hemmann, U.; Thybaud, V.; et al. Interlaboratory Evaluation of a Multiplexed High Information Content in Vitro Genotoxicity Assay. Environ. Mol. Mutagen. 2017, 58, 146–161. [Google Scholar] [CrossRef] [PubMed]
- So, S.; Davis, A.J.; Chen, D.J. Autophosphorylation at Serine 1981 Stabilizes ATM at DNA Damage Sites. J. Cell Biol. 2009, 187, 977–990. [Google Scholar] [CrossRef] [PubMed]
- Ueno, S.; Sudo, T.; Hirasawa, A. ATM: Functions of ATM Kinase and Its Relevance to Hereditary Tumors. Int. J. Mol. Sci. 2022, 23, 523. [Google Scholar] [CrossRef]
- Pfeiffer, E.; Eschbach, S.; Metzler, M. Alternaria Toxins: DNA Strand-Breaking Activity in Mammalian Cellsin Vitro. Mycotoxin Res. 2007, 23, 152–157. [Google Scholar] [CrossRef]
- Fehr, M.; Pahlke, G.; Fritz, J.; Christensen, M.O.; Boege, F.; Altemöller, M.; Podlech, J.; Marko, D. Alternariol Acts as a Topoisomerase Poison, Preferentially Affecting the IIalpha Isoform. Mol. Nutr. Food Res. 2009, 53, 441–451. [Google Scholar] [CrossRef]
- Solhaug, A.; Vines, L.L.; Ivanova, L.; Spilsberg, B.; Holme, J.A.; Pestka, J.; Collins, A.; Eriksen, G.S. Mechanisms Involved in Alternariol-Induced Cell Cycle Arrest. Mutat. Res. 2012, 738–739, 1–11. [Google Scholar] [CrossRef]
- Gasparini, C.; Feldmann, M. NF-ΚB as a Target for Modulating Inflammatory Responses. Curr. Pharm. Des. 2012, 18, 5735–5745. [Google Scholar] [CrossRef]
- Rajapakse, N.; Kim, M.-M.; Mendis, E.; Kim, S.-K. Inhibition of Inducible Nitric Oxide Synthase and Cyclooxygenase-2 in Lipopolysaccharide-Stimulated RAW264.7 Cells by Carboxybutyrylated Glucosamine Takes Place via down-Regulation of Mitogen-Activated Protein Kinase-Mediated Nuclear Factor-ΚB Signaling. Immunology 2008, 123, 348–357. [Google Scholar] [CrossRef]
- Sumayya, A.S.; Muraleedhara Kurup, G. In Vitro Anti-Inflammatory Potential of Marine Macromolecules Cross-Linked Bio-Composite Scaffold on LPS Stimulated RAW 264.7 Macrophage Cells for Cartilage Tissue Engineering Applications. J. Biomater. Sci. Polym. Ed. 2021, 32, 1040–1056. [Google Scholar] [CrossRef] [PubMed]
- Choi, Y.H.; Kim, G.-Y.; Lee, H.H. Anti-Inflammatory Effects of Cordycepin in Lipopolysaccharide-Stimulated RAW 264.7 Macrophages through Toll-like Receptor 4-Mediated Suppression of Mitogen-Activated Protein Kinases and NF-ΚB Signaling Pathways. Drug Des. Devel. Ther. 2014, 8, 1941–1953. [Google Scholar] [CrossRef]
- Connor, M.G.; Sanchez, L.; Chevalier, C.; Carvalho, F.; Eldridge, M.G.; Chaze, T.; Matondo, M.; Weight, C.M.; Heyderman, R.S.; Enninga, J.; et al. Pneumococcus Triggers NFkB Degradation in COMMD2 Aggresome-like Bodies. bioRxiv 2022, 2022.04.08.487599. [Google Scholar] [CrossRef]
- Christian, F.; Smith, E.L.; Carmody, R.J. The Regulation of NF-ΚB Subunits by Phosphorylation. Cells 2016, 5, 12. [Google Scholar] [CrossRef]
- Riera-Romo, M. COMMD1: A Multifunctional Regulatory Protein. J. Cell. Biochem. 2018, 119, 34–51. [Google Scholar] [CrossRef]
- Vonk, W.I.M.; Kakkar, V.; Bartuzi, P.; Jaarsma, D.; Berger, R.; Hofker, M.H.; Klomp, L.W.J.; Wijmenga, C.; Kampinga, H.H.; van de Sluis, B. The Copper Metabolism MURR1 Domain Protein 1 (COMMD1) Modulates the Aggregation of Misfolded Protein Species in a Client-Specific Manner. PLoS ONE 2014, 9, e92408. [Google Scholar] [CrossRef] [PubMed]
- Groestlinger, J.; Spindler, V.; Pahlke, G.; Rychlik, M.; Del Favero, G.; Marko, D. Alternaria Alternata Mycotoxins Activate the Aryl Hydrocarbon Receptor and Nrf2-ARE Pathway to Alter the Structure and Immune Response of Colon Epithelial Cells. Chem. Res. Toxicol. 2022, 35, 731–749. [Google Scholar] [CrossRef] [PubMed]
- Sun, Y.; Huang, K.; Long, M.; Yang, S.; Zhang, Y. An Update on Immunotoxicity and Mechanisms of Action of Six Environmental Mycotoxins. Food Chem. Toxicol. 2022, 163, 112895. [Google Scholar] [CrossRef]
- Crowley, L.C.; Christensen, M.E.; Waterhouse, N.J. Measuring Mitochondrial Transmembrane Potential by TMRE Staining. Cold Spring Harb. Protoc. 2016, 2016, pdb-prot087361. [Google Scholar] [CrossRef]
- Choi, A.M.; Alam, J. Heme Oxygenase-1: Function, Regulation, and Implication of a Novel Stress-Inducible Protein in Oxidant-Induced Lung Injury. Am. J. Respir. Cell Mol. Biol. 1996, 15, 9–19. [Google Scholar] [CrossRef]
- Yachie, A. Heme Oxygenase-1 Deficiency and Oxidative Stress: A Review of 9 Independent Human Cases and Animal Models. Int. J. Mol. Sci. 2021, 22, 1514. [Google Scholar] [CrossRef] [PubMed]
- Domijan, A.-M.; Abramov, A.Y. Fumonisin B1 Inhibits Mitochondrial Respiration and Deregulates Calcium Homeostasis--Implication to Mechanism of Cell Toxicity. Int. J. Biochem. Cell Biol. 2011, 43, 897–904. [Google Scholar] [CrossRef] [PubMed]
- Arumugam, T.; Pillay, Y.; Ghazi, T.; Nagiah, S.; Abdul, N.S.; Chuturgoon, A.A. Fumonisin B1-Induced Oxidative Stress Triggers Nrf2-Mediated Antioxidant Response in Human Hepatocellular Carcinoma (HepG2) Cells. Mycotoxin Res. 2019, 35, 99–109. [Google Scholar] [CrossRef]
- Fernández-Blanco, C.; Font, G.; Ruiz, M.-J. Oxidative Stress of Alternariol in Caco-2 Cells. Toxicol. Lett. 2014, 229, 458–464. [Google Scholar] [CrossRef] [PubMed]
- Le Hegarat, L.; Dumont, J.; Josse, R.; Huet, S.; Lanceleur, R.; Mourot, A.; Poul, J.-M.; Guguen-Guillouzo, C.; Guillouzo, A.; Fessard, V. Assessment of the Genotoxic Potential of Indirect Chemical Mutagens in HepaRG Cells by the Comet and the Cytokinesis-Block Micronucleus Assays. Mutagenesis 2010, 25, 555–560. [Google Scholar] [CrossRef] [PubMed]
- Takakura, N.; Nesslany, F.; Fessard, V.; Le Hegarat, L. Absence of In Vitro Genotoxicity Potential of the Mycotoxin Deoxynivalenol in Bacteria and in Human TK6 and HepaRG Cell Lines. Food Chem. Toxicol. 2014, 66, 113–121. [Google Scholar] [CrossRef] [PubMed]


Disclaimer/Publisher’s Note: The statements, opinions and data contained in all publications are solely those of the individual author(s) and contributor(s) and not of MDPI and/or the editor(s). MDPI and/or the editor(s) disclaim responsibility for any injury to people or property resulting from any ideas, methods, instructions or products referred to in the content. |
© 2023 by the authors. Licensee MDPI, Basel, Switzerland. This article is an open access article distributed under the terms and conditions of the Creative Commons Attribution (CC BY) license (https://creativecommons.org/licenses/by/4.0/).
Share and Cite
Marzougui, Z.; Le Hegarat, L.; Hogeveen, K.; Huet, S.; Kharrat, R.; Marrouchi, R.; Fessard, V. An Evaluation of the Cytotoxic and Genotoxic Effects of the Marine Toxin C17-SAMT in Human TK6 and HepaRG Cell Lines. Int. J. Mol. Sci. 2023, 24, 7805. https://doi.org/10.3390/ijms24097805
Marzougui Z, Le Hegarat L, Hogeveen K, Huet S, Kharrat R, Marrouchi R, Fessard V. An Evaluation of the Cytotoxic and Genotoxic Effects of the Marine Toxin C17-SAMT in Human TK6 and HepaRG Cell Lines. International Journal of Molecular Sciences. 2023; 24(9):7805. https://doi.org/10.3390/ijms24097805
Chicago/Turabian StyleMarzougui, Zeineb, Ludovic Le Hegarat, Kevin Hogeveen, Sylvie Huet, Riadh Kharrat, Riadh Marrouchi, and Valérie Fessard. 2023. "An Evaluation of the Cytotoxic and Genotoxic Effects of the Marine Toxin C17-SAMT in Human TK6 and HepaRG Cell Lines" International Journal of Molecular Sciences 24, no. 9: 7805. https://doi.org/10.3390/ijms24097805
APA StyleMarzougui, Z., Le Hegarat, L., Hogeveen, K., Huet, S., Kharrat, R., Marrouchi, R., & Fessard, V. (2023). An Evaluation of the Cytotoxic and Genotoxic Effects of the Marine Toxin C17-SAMT in Human TK6 and HepaRG Cell Lines. International Journal of Molecular Sciences, 24(9), 7805. https://doi.org/10.3390/ijms24097805