
3D Visualization, Skeletonization and Branching Analysis of Blood Vessels in Angiogenesis
 ,
,  , ,
, ,  , , ,
, , ,  , , , , , , and
Abstract
1. Introduction
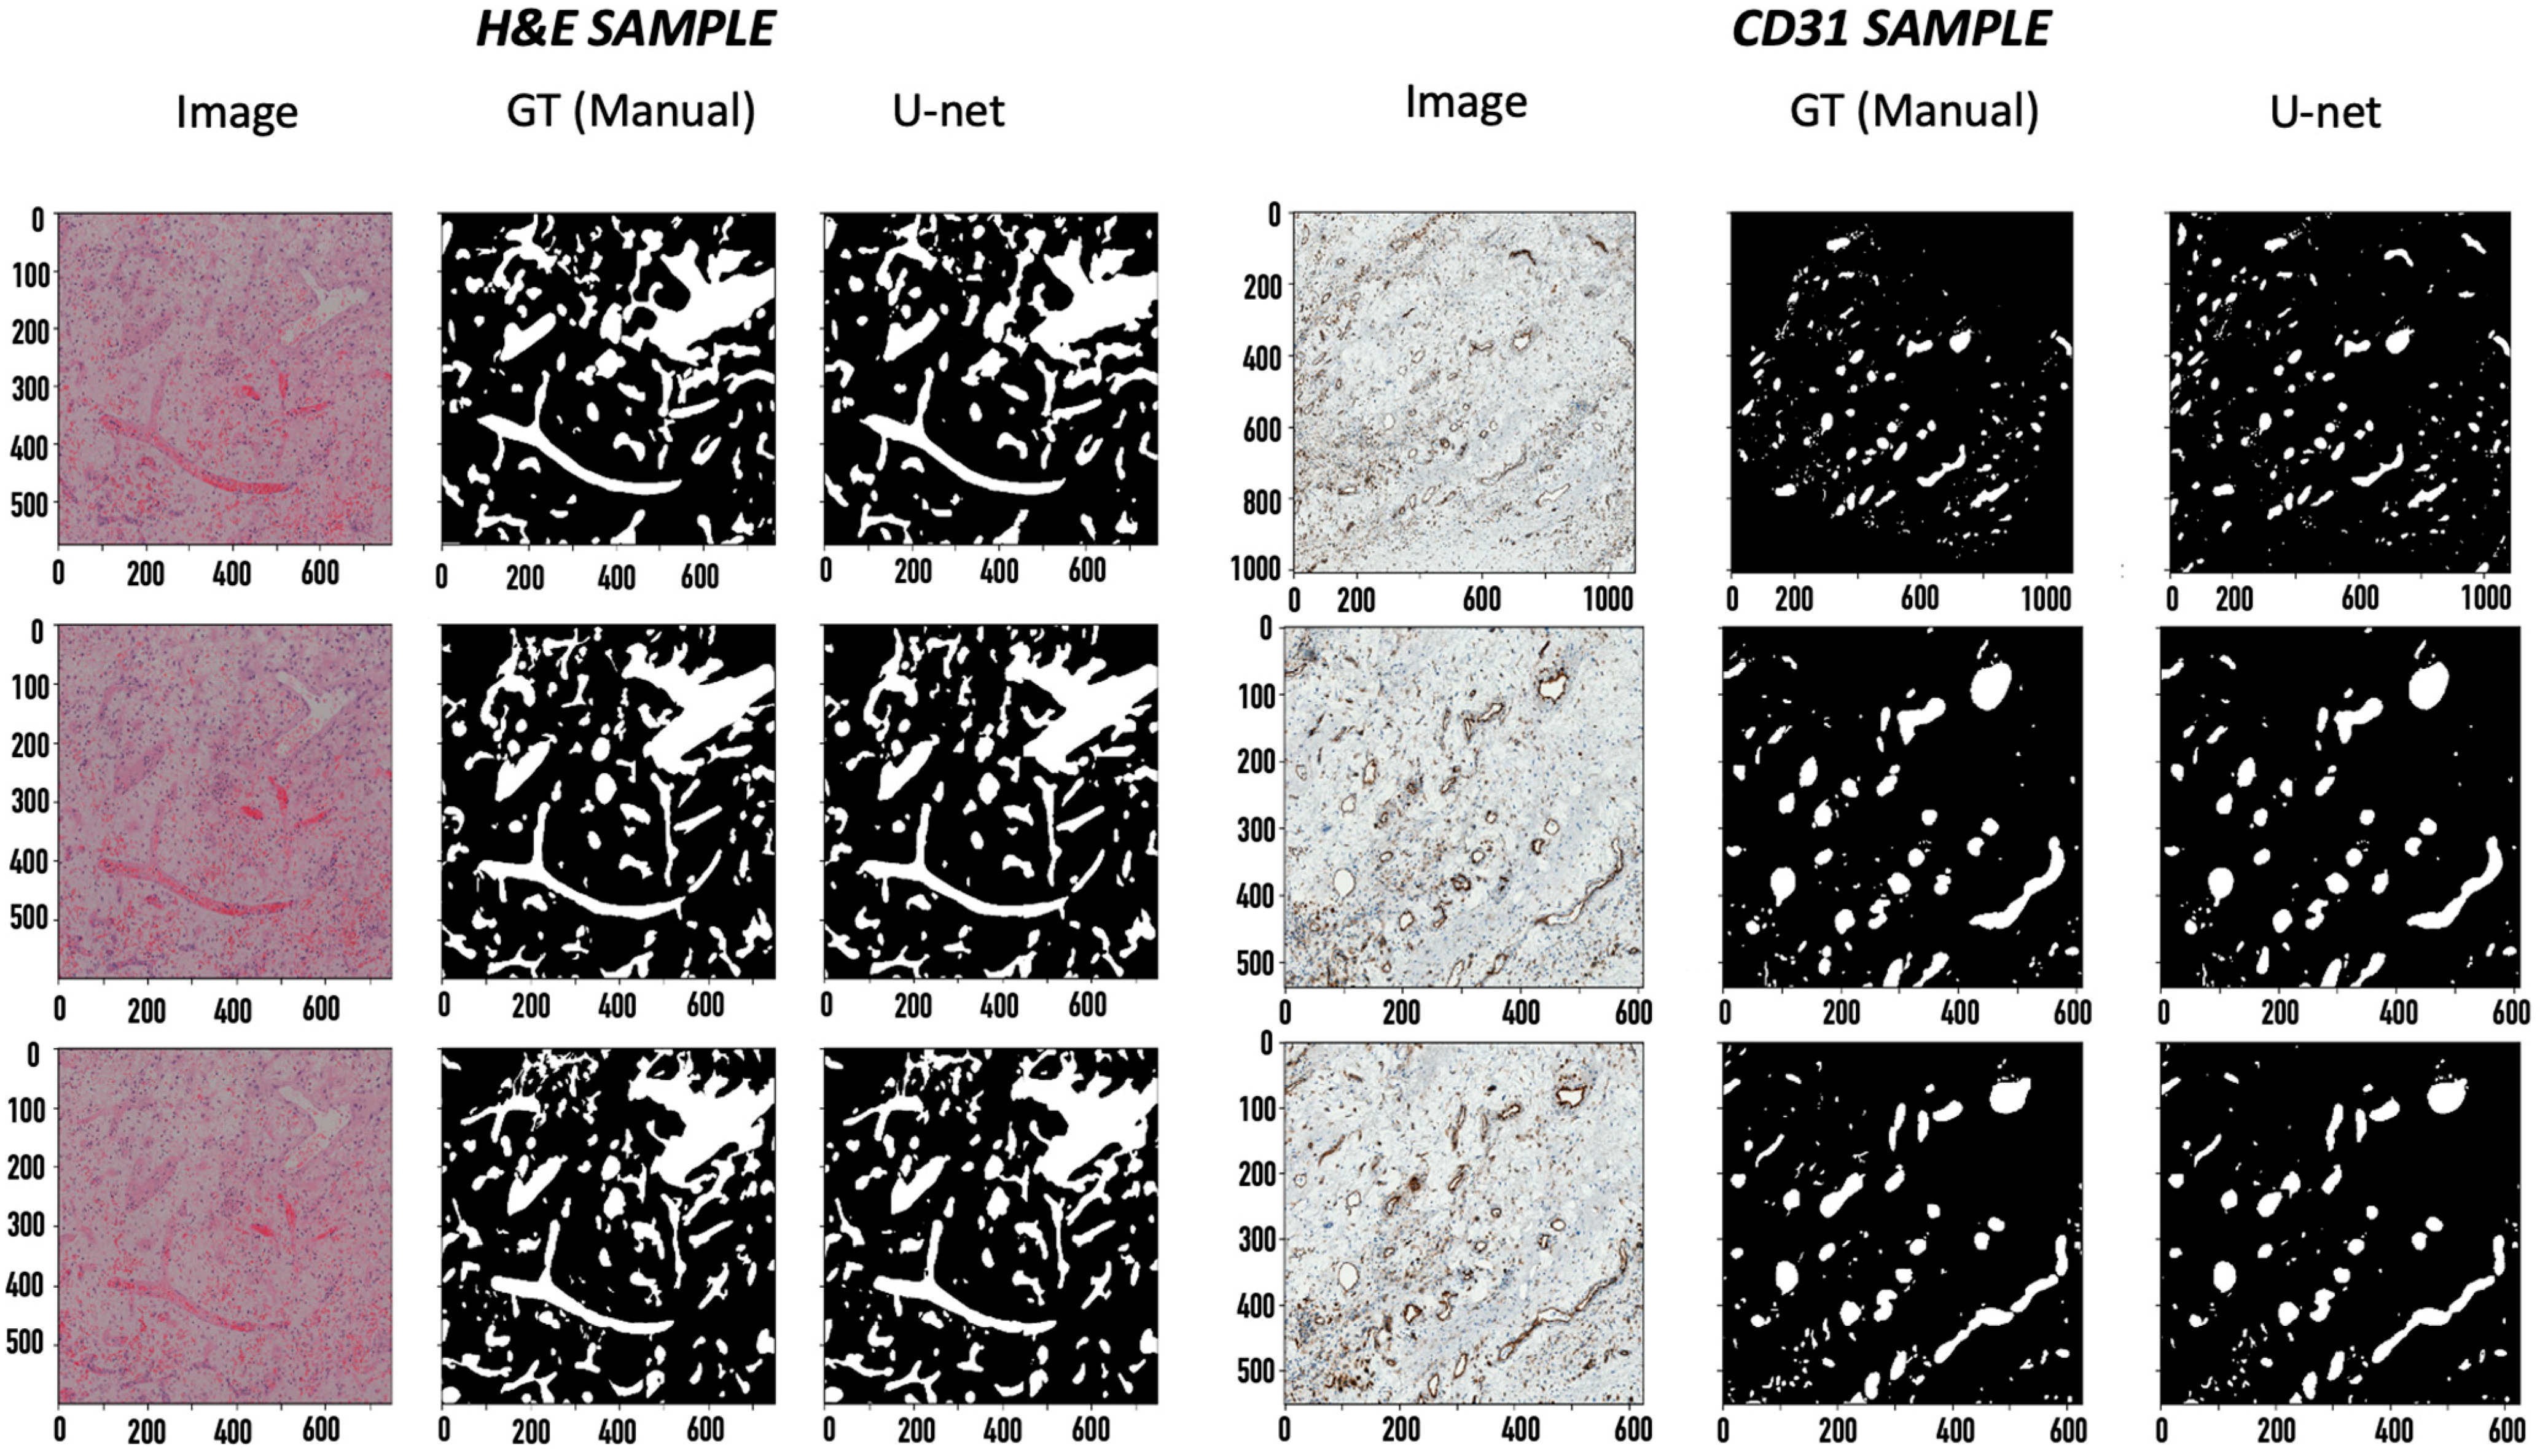
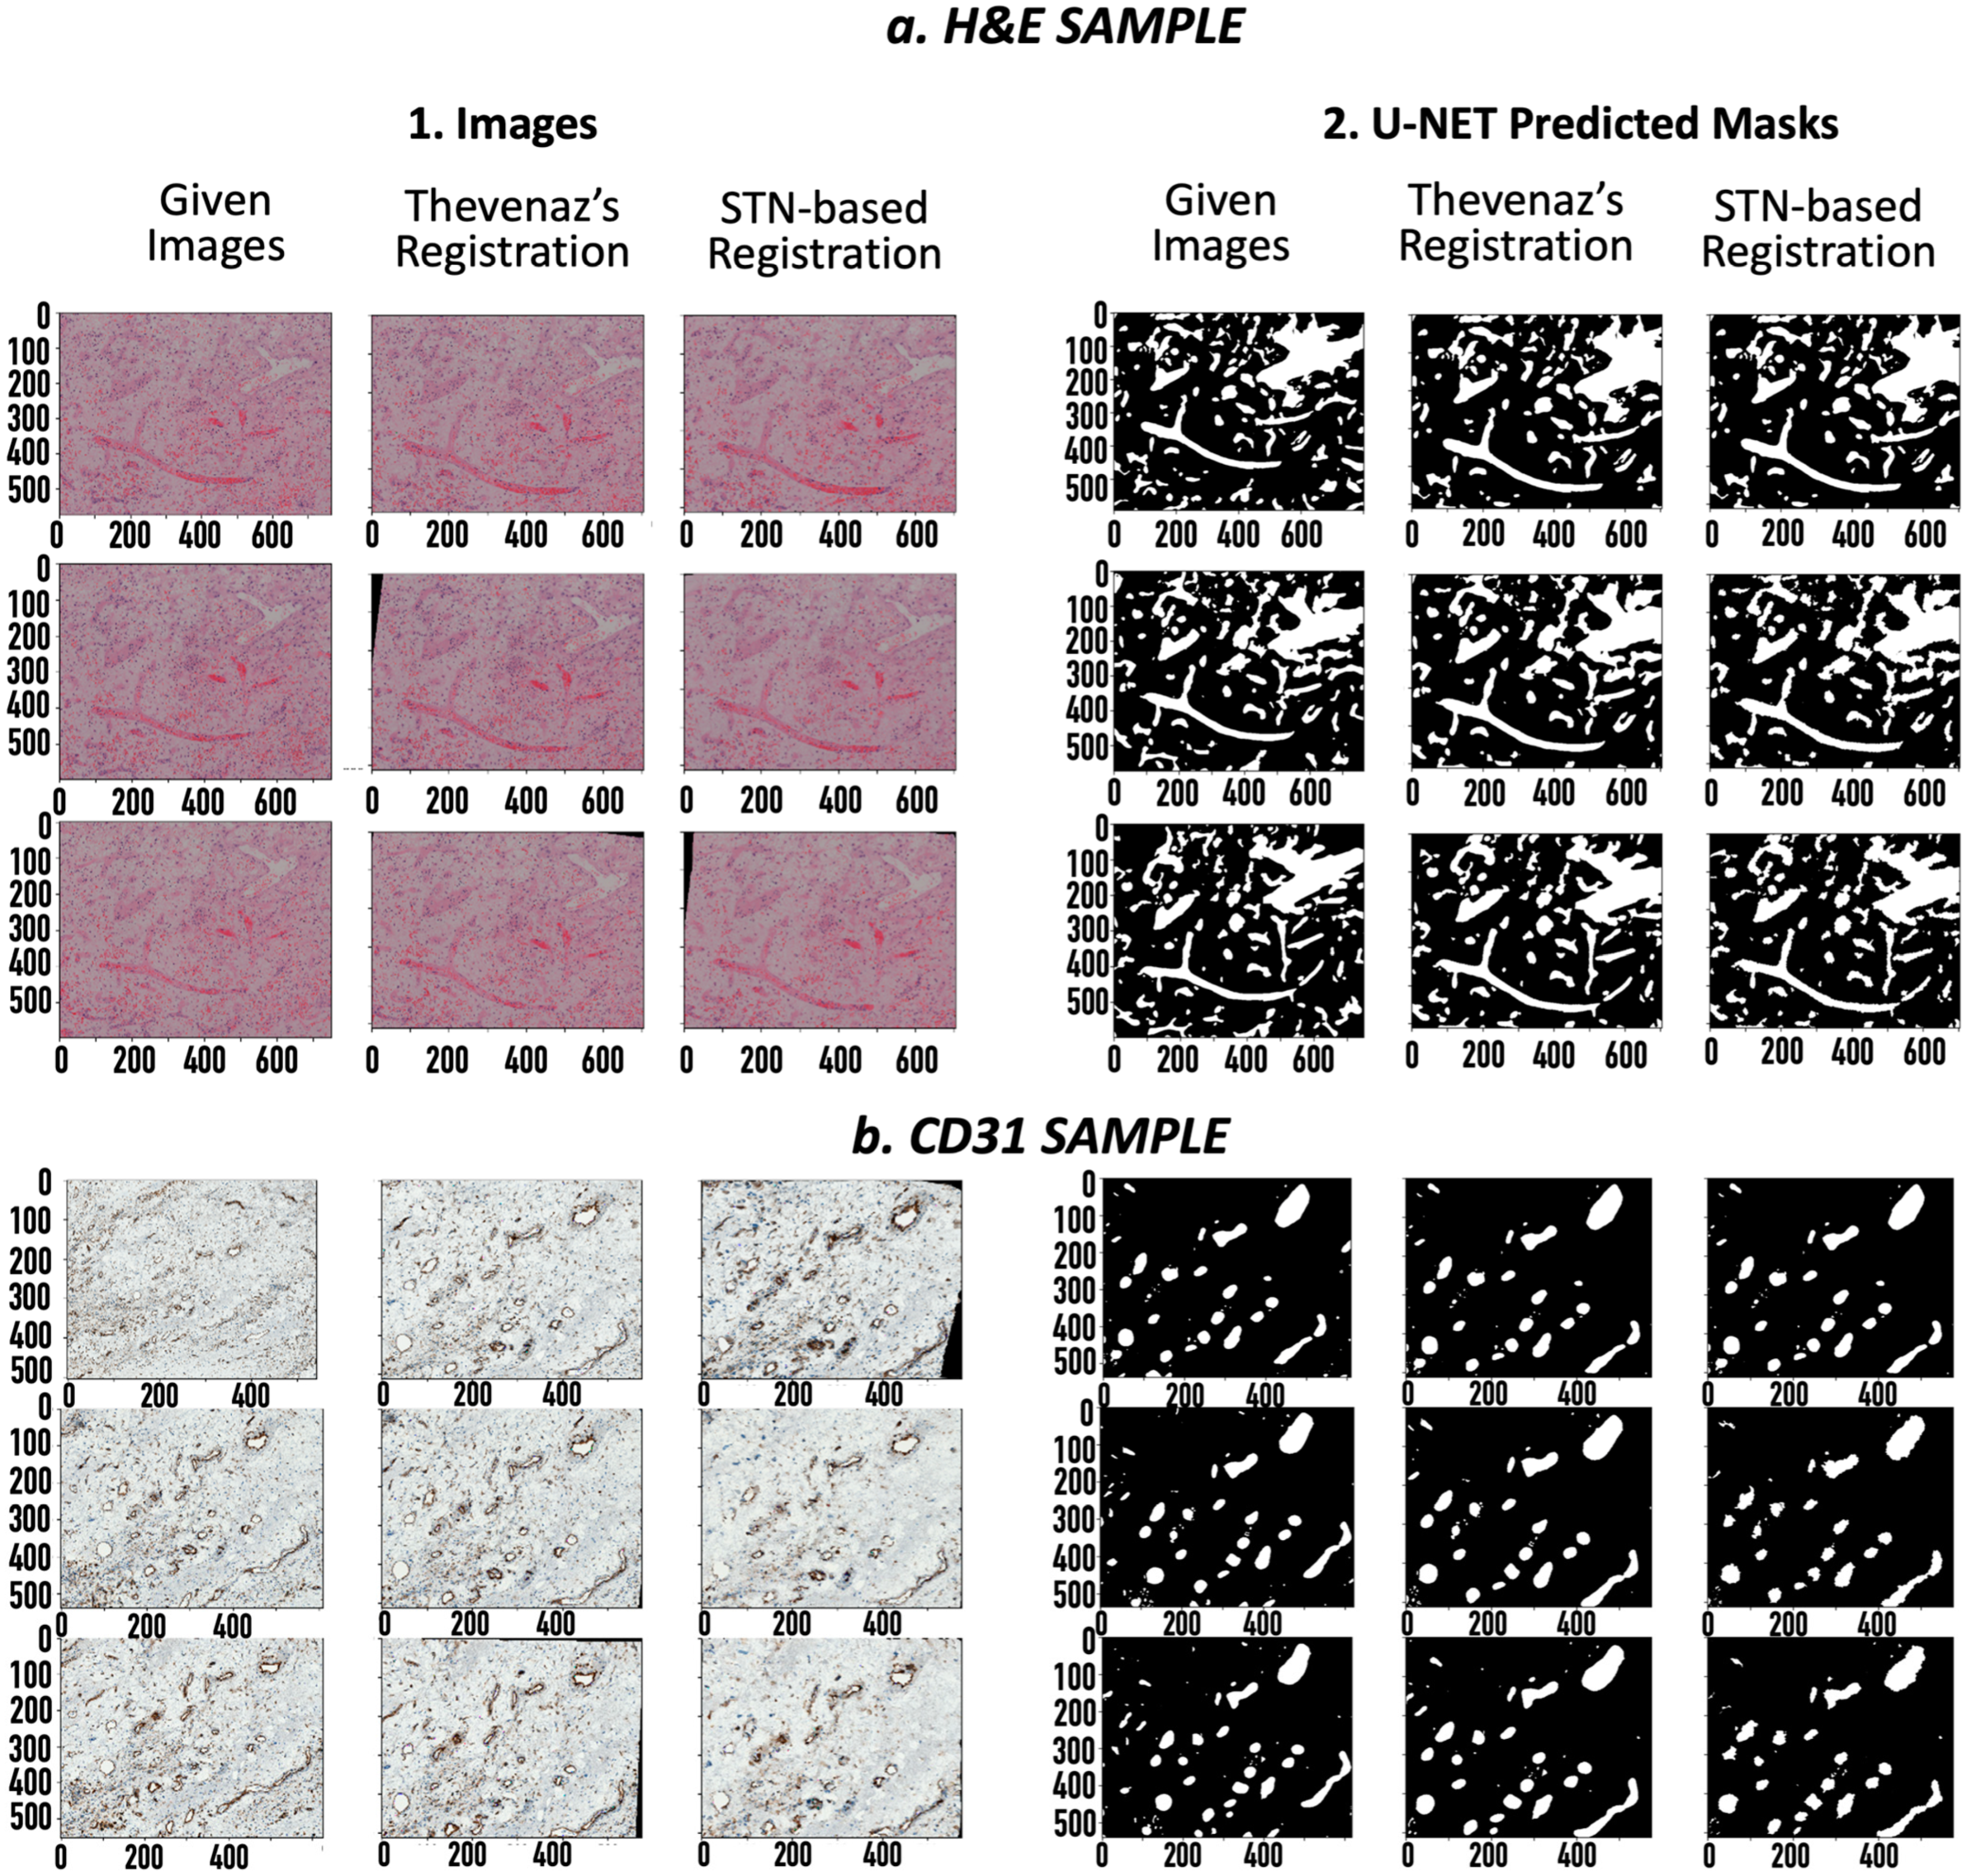
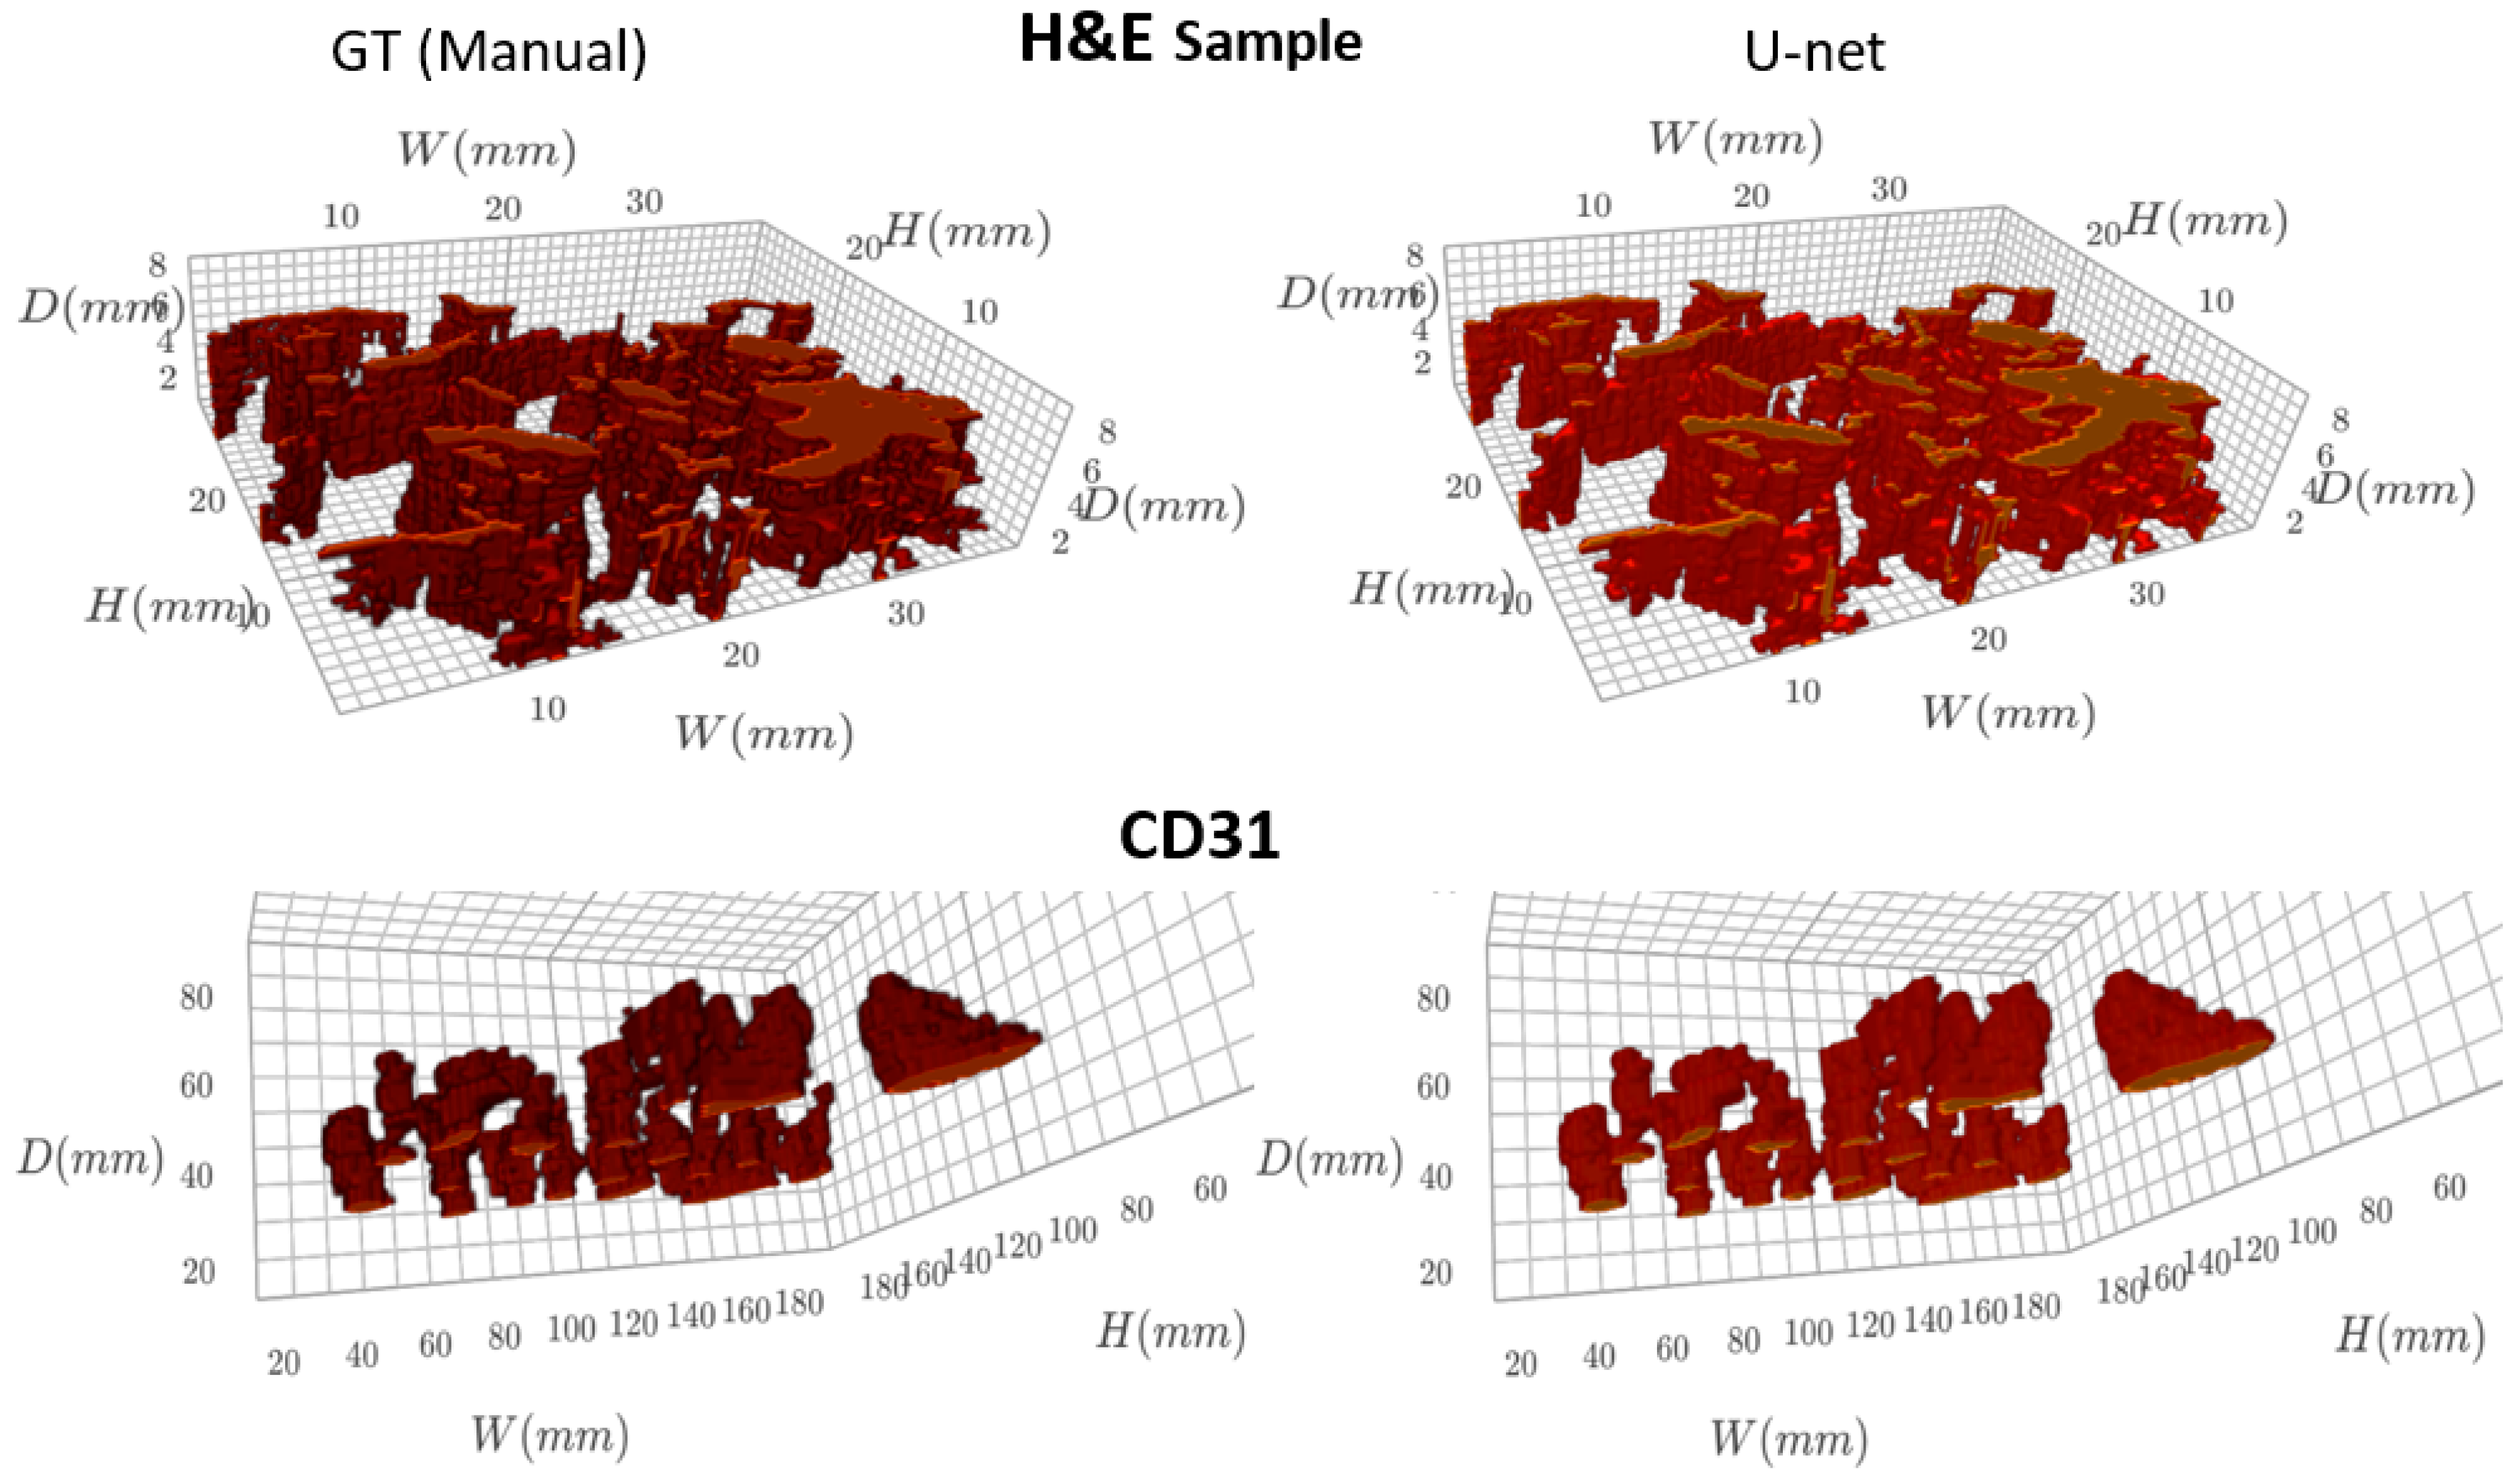
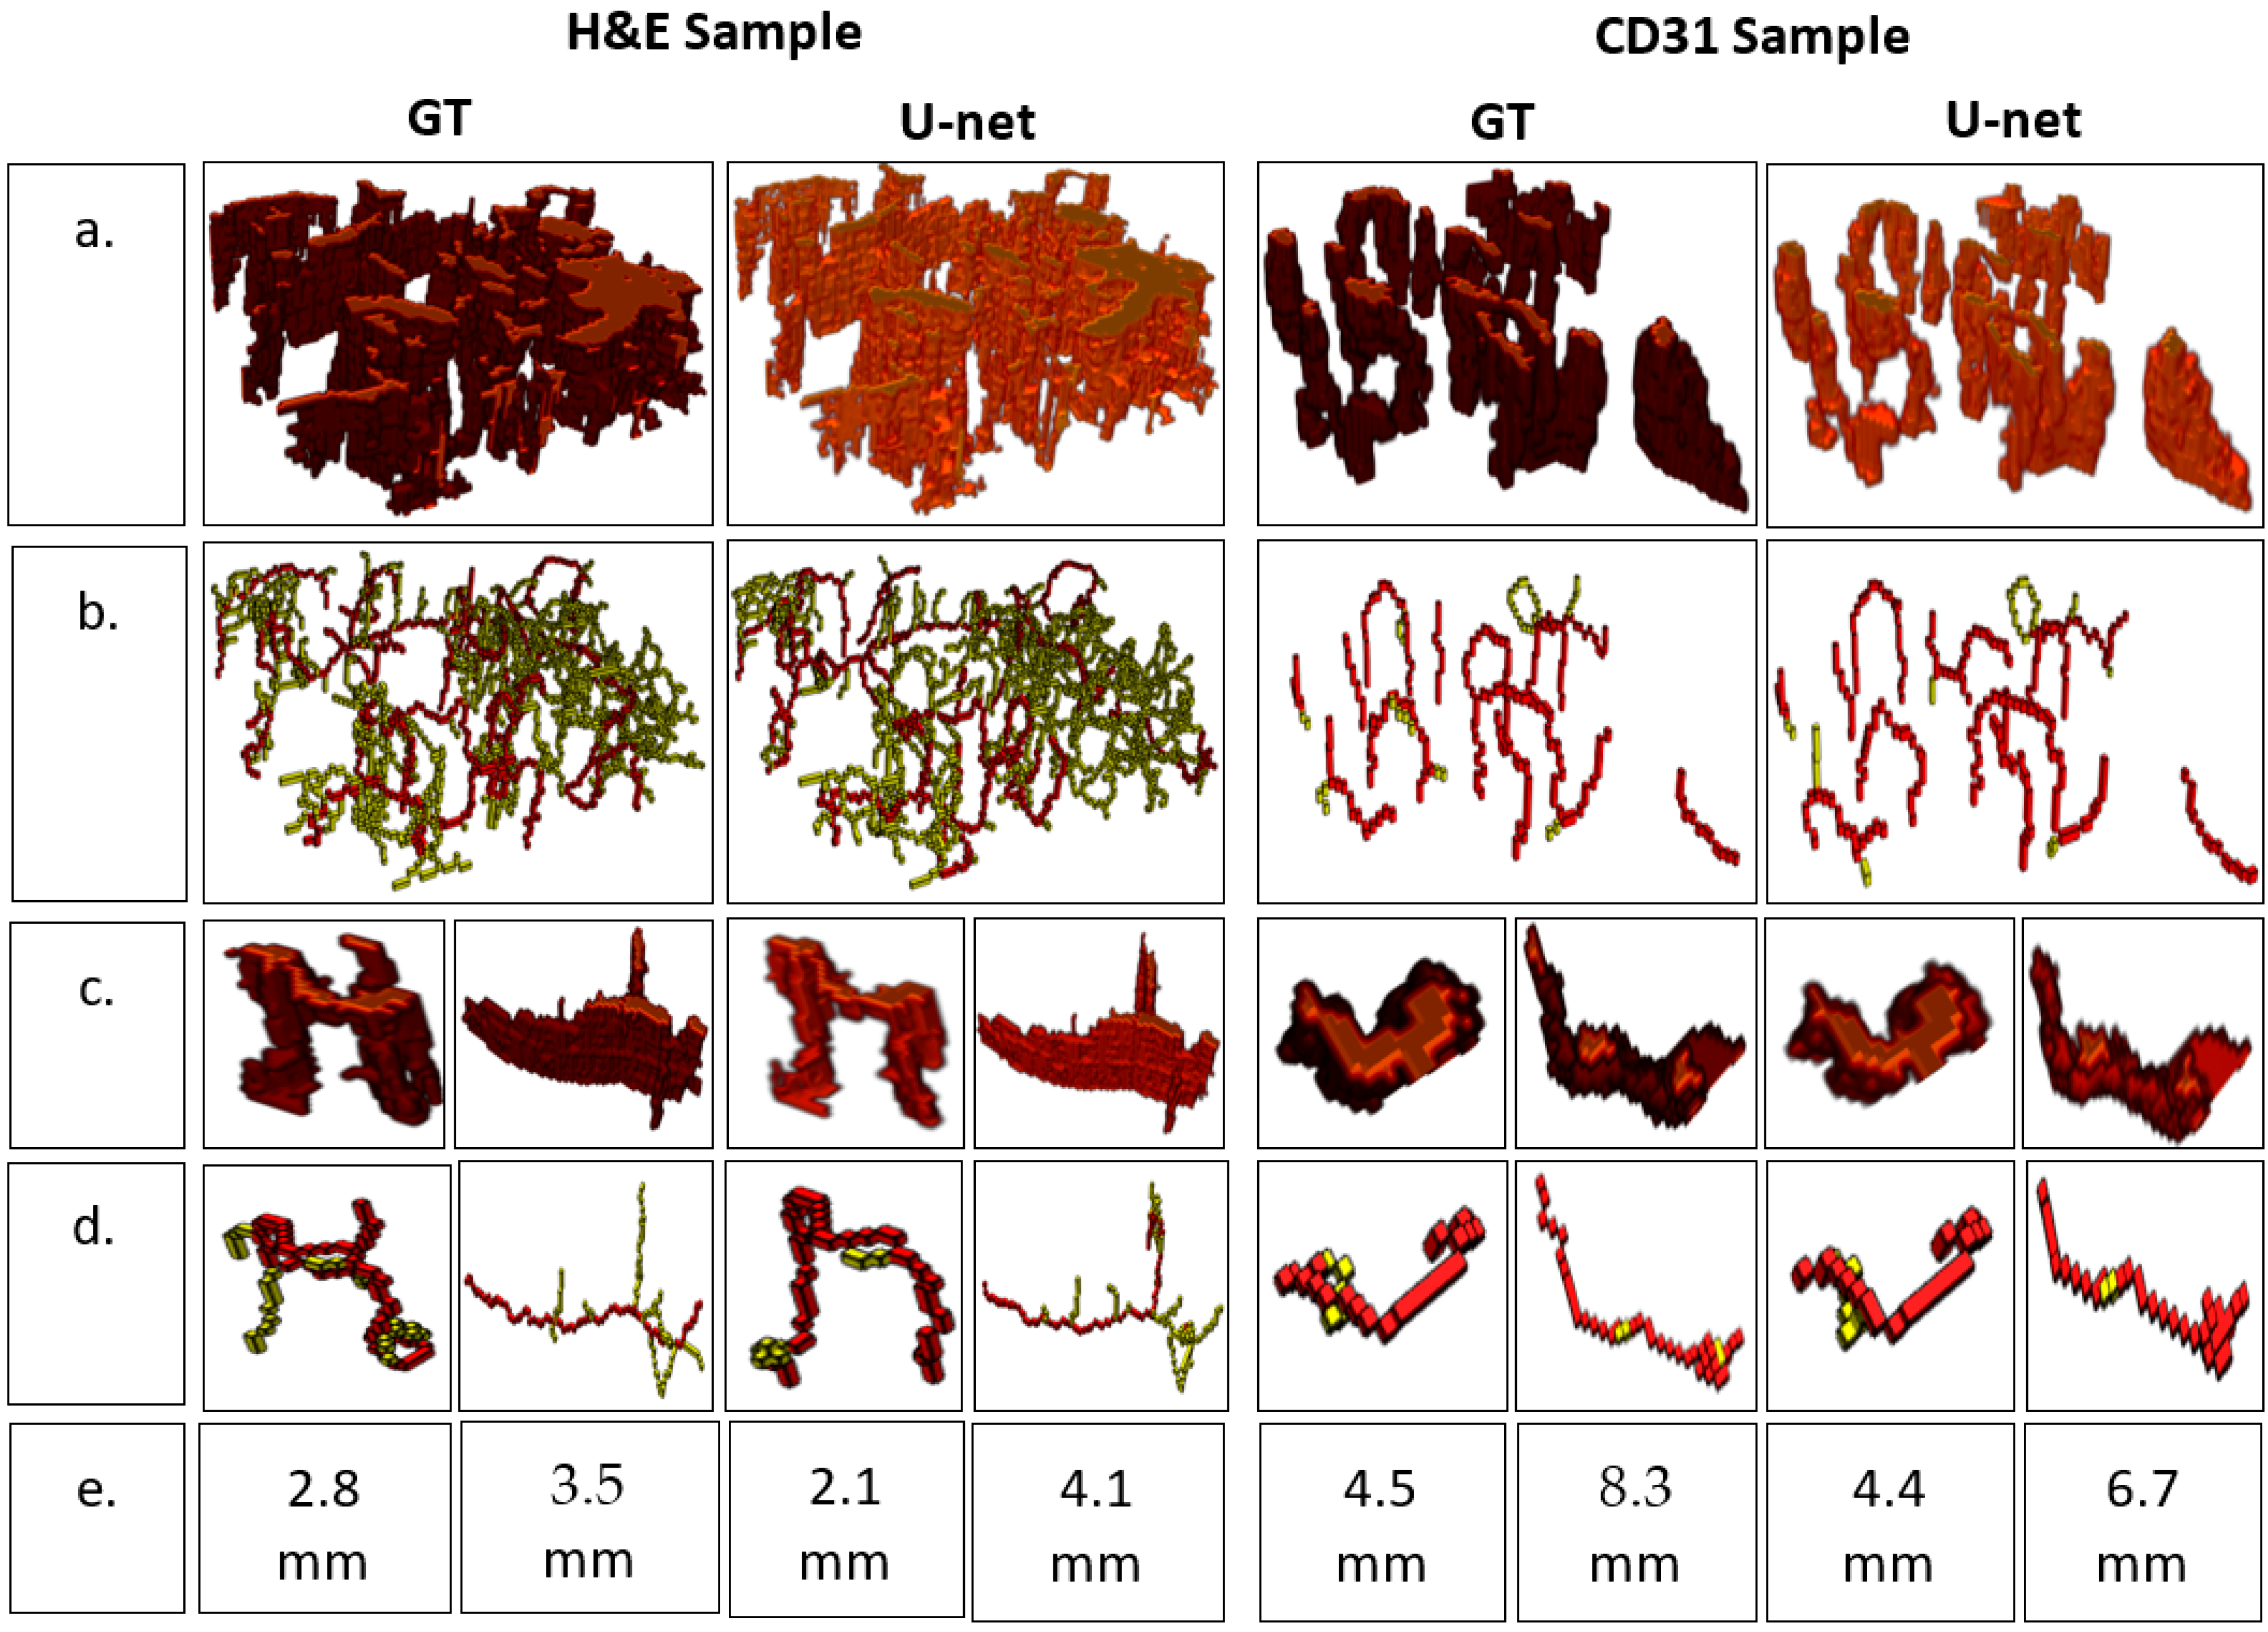
2. Results
3. Discussion
4. Materials and Methods
4.1. Tissue Preparation and Data Acquisition
4.2. Region of Interest (ROI) Selection
4.3. Image Segmentation
4.4. Image Registration
4.5. Image Registration Finetuning
4.6. Interpolation and 3D Visualization
4.7. Skeletonization and Analysis
4.8. Metrics
5. Conclusions
Supplementary Materials
Author Contributions
Funding
Institutional Review Board Statement
Informed Consent Statement
Data Availability Statement
Conflicts of Interest
Abbreviations
References
- Honnegowda, T.M.; Kumar, P.; Udupa, E.G.; Kumar, S.; Kumar, U.; Rao, P. Role of angiogenesis and angiogenic factors in acute and chronic wound healing. Plast. Aesthetic Res. 2015, 2, 239–242. [Google Scholar] [CrossRef]
- Folkman, J. Role of angiogenesis in tumor growth and metastasis. Semin. Oncol. 2002, 29, 15–18. [Google Scholar] [CrossRef]
- Hanahan, D. Hallmarks of Cancer: New Dimensions. Cancer Discov. 2022, 12, 31–46. [Google Scholar] [CrossRef]
- Guerra, A.; Belinha, J.; Jorge, R.N. Modelling skin wound healing angiogenesis: A review. J. Theor. Biol. 2018, 459, 1–17. [Google Scholar] [CrossRef]
- Pollefeys, M.; Koch, R.; Vergauwen, M.; Van Gool, L. Automated reconstruction of 3D scenes from sequences of images. ISPRS J. Photogramm. Remote Sens. 2001, 55, 251–267. [Google Scholar] [CrossRef]
- Gallo, A.; Muzzupappa, M.; Bruno, F. 3D reconstruction of small sized objects from a sequence of multi-focused images. J. Cult. Herit. 2014, 15, 173–182. [Google Scholar] [CrossRef]
- Carlbom, I.; Terzopoulos, D.; Harris, K.M. Computer-assisted registration, segmentation, and 3D reconstruction from images of neuronal tissue sections. IEEE Trans. Med. Imaging 1994, 13, 351–362. [Google Scholar] [CrossRef]
- Tom, M.; Ramakrishnan, V.; van Oterendorp, C.; Deserno, T. Automated Detection of Schlemm’s Canal in Spectral-Domain Optical Coherence Tomography. In Medical Imaging 2015: Computer-Aided Diagnosis; SPIE: Bellingham, WA, USA, 2015. [Google Scholar]
- Meiburger, K.M.; Nam, S.Y.; Chung, E.; Suggs, L.J.; Emelianov, S.Y.; Molinari, F. Skeletonization algorithm-based blood vessel quantification using in vivo 3D photoacoustic imaging. Phys. Med. Biol. 2016, 61, 7994–8009. [Google Scholar] [CrossRef] [PubMed]
- Toriwaki, J.-i.; Mori, K. Distance transformation and skeletonization of 3D pictures and their applications to medical images. In Digital and Image Geometry: Advanced Lectures; Springer: Berlin/Heidelberg, Germany, 2002; pp. 412–429. [Google Scholar]
- Swedlow, J. Open Microscopy Environment: OME Is a Consortium of Universities, Research Labs, Industry and Developers Producing Open-Source Software and Format Standards for Microscopy Data. 2020. Available online: https://discovery.dundee.ac.uk/en/publications/open-microscopy-environment-ome-is-a-consortium-of-universities-r (accessed on 20 April 2023).
- Otsu, N. A Threshold Selection Method from Gray-Level Histograms. IEEE Trans. Syst. Man Cybern. 1979, 9, 62–66. [Google Scholar] [CrossRef]
- Li, Y.; Wu, H. A Clustering Method Based on K-Means Algorithm. Phys. Procedia 2012, 25, 1104–1109. [Google Scholar] [CrossRef]
- Pratt, W.K. Introduction to Digital Image Processing; CRC Press: Boca Raton, FL, USA, 2013. [Google Scholar]
- Zaitoun, N.M.; Aqel, M.J. Survey on image segmentation techniques. Procedia Comput. Sci. 2015, 65, 797–806. [Google Scholar] [CrossRef]
- O’Mahony, N.; Campbell, S.; Carvalho, A.; Harapanahalli, S.; Hernandez, G.V.; Krpalkova, L.; Riordan, D.; Walsh, J. Deep learning vs. traditional computer vision. In Proceedings of the Advances in Computer Vision: Proceedings of the 2019 Computer Vision Conference (CVC), Las Vegas, NV, USA, 2–3 May 2019; Volume 11, pp. 128–144. [Google Scholar]
- He, K.; Zhang, X.; Ren, S.; Sun, J. Deep residual learning for image recognition. In Proceedings of the IEEE Conference on Computer Vision and Pattern Recognition, Las Vegas, NV, USA, 27–30 June 2016; pp. 770–778. [Google Scholar]
- Szegedy, C.; Ioffe, S.; Vanhoucke, V.; Alemi, A. Inception-v4, inception-resnet and the impact of residual connections on learning. In Proceedings of the AAAI Conference on Artificial Intelligence, San Francisco, CA, USA, 4–9 February 2017. [Google Scholar]
- Lateef, F.; Ruichek, Y. Survey on semantic segmentation using deep learning techniques. Neurocomputing 2019, 338, 321–348. [Google Scholar] [CrossRef]
- Ronneberger, O.; Fischer, P.; Brox, T. U-net: Convolutional networks for biomedical image segmentation. In Proceedings of the Medical Image Computing and Computer-Assisted Intervention–MICCAI 2015: 18th International Conference, Munich, Germany, 5–9 October 2015; pp. 234–241. [Google Scholar]
- Hesamian, M.H.; Jia, W.; He, X.; Kennedy, P. Deep learning techniques for medical image segmentation: Achievements and challenges. J. Digit. Imaging 2019, 32, 582–596. [Google Scholar] [CrossRef] [PubMed]
- Loshchilov, I.; Hutter, F. Fixing Weight Decay Regularization in Adam. 2017. Available online: https://openreview.net/forum?id=rk6qdGgCZ (accessed on 20 April 2023).
- Smith, L.N.; Topin, N. Super-convergence: Very fast training of neural networks using large learning rates. In Proceedings of the Artificial Intelligence and Machine Learning for Multi-Domain Operations Applications, Baltimore, MA, USA, 15–17 April 2019; pp. 369–386. [Google Scholar]
- Szeliski, R. Image alignment and stitching. In Handbook of Mathematical Models in Computer Vision; Springer: New York, NY, USA, 2006; pp. 273–292. [Google Scholar]
- Sotiras, A.; Davatzikos, C.; Paragios, N. Deformable medical image registration: A survey. IEEE Trans. Med. Imaging 2013, 32, 1153–1190. [Google Scholar] [CrossRef]
- Song, G.; Han, J.; Zhao, Y.; Wang, Z.; Du, H. A review on medical image registration as an optimization problem. Curr. Med. Imaging 2017, 13, 274–283. [Google Scholar] [CrossRef] [PubMed]
- Maintz, J.A.; Viergever, M.A. A survey of medical image registration. Med. Image Anal. 1998, 2, 1–36. [Google Scholar] [CrossRef]
- Adel, E.; Elmogy, M.; Elbakry, H. Image stitching based on feature extraction techniques: A survey. Int. J. Comput. Appl. 2014, 99, 1–8. [Google Scholar] [CrossRef]
- Zitova, B.; Flusser, J. Image registration methods: A survey. Image Vis. Comput. 2003, 21, 977–1000. [Google Scholar] [CrossRef]
- Thevenaz, P.; Ruttimann, U.E.; Unser, M. A pyramid approach to subpixel registration based on intensity. IEEE Trans. Image Process. 1998, 7, 27–41. [Google Scholar] [CrossRef]
- Chen, X.; Diaz-Pinto, A.; Ravikumar, N.; Frangi, A.F. Deep learning in medical image registration. Prog. Biomed. Eng. 2021, 3, 012003. [Google Scholar] [CrossRef]
- Kuang, D.; Schmah, T. Faim–a convnet method for unsupervised 3d medical image registration. In Proceedings of the Machine Learning in Medical Imaging: 10th International Workshop, MLMI 2019, Held in Conjunction with MICCAI 2019, Shenzhen, China, 13 October 2019; pp. 646–654. [Google Scholar]
- Jaderberg, M.; Simonyan, K.; Zisserman, A. Spatial transformer networks. Adv. Neural Inf. Process. Syst. 2015, 28. [Google Scholar] [CrossRef]
- Yan, P.; Xu, S.; Rastinehad, A.R.; Wood, B.J. Adversarial image registration with application for MR and TRUS image fusion. In Proceedings of the Machine Learning in Medical Imaging: 9th International Workshop, MLMI 2018, Held in Conjunction with MICCAI 2018, Granada, Spain, 16 September 2018; pp. 197–204. [Google Scholar]
- Goodfellow, I.; Pouget-Abadie, J.; Mirza, M.; Xu, B.; Warde-Farley, D.; Ozair, S.; Courville, A.; Bengio, Y. Generative adversarial networks. Commun. ACM 2020, 63, 139–144. [Google Scholar] [CrossRef]
- Dalca, A.; Rakic, M.; Guttag, J.; Sabuncu, M. Learning conditional deformable templates with convolutional networks. Adv. Neural Inf. Process. Syst. 2019, 32. [Google Scholar] [CrossRef]
- Steffensen, J. Interpolation; Courier Corporation: North Chelmsford, MA, USA, 2006. [Google Scholar]
- Yonghong, J. Digital Image Processing, 2nd ed.; Prentice Hall Press: Hoboken, NJ, USA, 2010. [Google Scholar]
- Wang, S.; Yang, K. An image scaling algorithm based on bilinear interpolation with VC++. Tech. Autom. Appl. 2008, 27, 44–45. [Google Scholar]
- Feng, J.-F.; Han, H.-J. Image enlargement based on non-uniform B-spline interpolation algorithm. J. Comput. Appl. 2010, 30, 82. [Google Scholar] [CrossRef]
- Han, D. Comparison of commonly used image interpolation methods. In Proceedings of the Conference of the 2nd International Conference on Computer Science and Electronics Engineering (ICCSEE 2013), Hangzhou, China, 22–23 March 2013; pp. 1556–1559. [Google Scholar]
- Saltar, G.; Aiyer, A.; Meneveau, C. Developing Notebook-based Flow Visualization and Analysis Modules for Computational Fluid Dynamics. In Proceedings of the APS Division of Fluid Dynamics Meeting Abstracts, Seattle, WA, USA, 23–26 November 2019; p. NP05.021. [Google Scholar]
- Kikinis, R.; Pieper, S.D.; Vosburgh, K.G. 3D Slicer: A platform for subject-specific image analysis, visualization, and clinical support. In Intraoperative Imaging and Image-Guided Therapy; Springer: Berlin/Heidelberg, Germany, 2013; pp. 277–289. [Google Scholar]
- Saha, P.K.; Borgefors, G.; di Baja, G.S. A survey on skeletonization algorithms and their applications. Pattern Recognit. Lett. 2016, 76, 3–12. [Google Scholar] [CrossRef]
- Blum, H.; Nagel, R.N. Shape description using weighted symmetric axis features. Pattern Recognit. 1978, 10, 167–180. [Google Scholar] [CrossRef]
- Lee, T.-C.; Kashyap, R.L.; Chu, C.-N. Building skeleton models via 3-D medial surface axis thinning algorithms. CVGIP Graph. Model. Image Process. 1994, 56, 462–478. [Google Scholar] [CrossRef]
- Van der Walt, S.; Schönberger, J.L.; Nunez-Iglesias, J.; Boulogne, F.; Warner, J.D.; Yager, N.; Gouillart, E.; Yu, T. scikit-image: Image processing in Python. PeerJ 2014, 2, e453. [Google Scholar] [CrossRef]
- Nunez-Iglesias, J.; Blanch, A.J.; Looker, O.; Dixon, M.W.; Tilley, L. A new Python library to analyse skeleton images confirms malaria parasite remodelling of the red blood cell membrane skeleton. PeerJ 2018, 6, e4312. [Google Scholar] [CrossRef]
- Nilsson, J.; Akenine-Möller, T. Understanding ssim. arXiv 2020, arXiv:2006.13846. [Google Scholar]
- Dice, L.R. Measures of the amount of ecologic association between species. Ecology 1945, 26, 297–302. [Google Scholar] [CrossRef]
- Sorensen, T.A. A method of establishing groups of equal amplitude in plant sociology based on similarity of species content and its application to analyses of the vegetation on Danish commons. Biol. Skar. 1948, 5, 1–34. [Google Scholar]
- Ahmed, T.; Goyal, A. Endomyocardial biopsy. In StatPearls [Internet]; StatPearls Publishing: Tampa, FL, USA, 2022. [Google Scholar]
- AlJaroudi, W.A.; Desai, M.Y.; Tang, W.W.; Phelan, D.; Cerqueira, M.D.; Jaber, W.A. Role of imaging in the diagnosis and management of patients with cardiac amyloidosis: State of the art review and focus on emerging nuclear techniques. J. Nucl. Cardiol. 2014, 21, 271–283. [Google Scholar] [CrossRef] [PubMed]
- Lal, S.; Li, A.; Allen, D.; Allen, P.D.; Bannon, P.; Cartmill, T.; Cooke, R.; Farnsworth, A.; Keogh, A.; Dos Remedios, C. Best practice biobanking of human heart tissue. Biophys. Rev. 2015, 7, 399–406. [Google Scholar] [CrossRef] [PubMed]
- Mahapatra, D.; Antony, B.; Sedai, S.; Garnavi, R. Deformable medical image registration using generative adversarial networks. In Proceedings of the 2018 IEEE 15th International Symposium on Biomedical Imaging (ISBI 2018), Washington, DC, USA, 4–7 April 2018; pp. 1449–1453. [Google Scholar]
- Arimura, H.; Soufi, M.; Kamezawa, H.; Ninomiya, K.; Yamada, M. Radiomics with artificial intelligence for precision medicine in radiation therapy. J. Radiat. Res. 2019, 60, 150–157. [Google Scholar] [CrossRef] [PubMed]
- Lee, J.Y.; Lee, K.-s.; Seo, B.K.; Cho, K.R.; Woo, O.H.; Song, S.E.; Kim, E.-K.; Lee, H.Y.; Kim, J.S.; Cha, J. Radiomic machine learning for predicting prognostic biomarkers and molecular subtypes of breast cancer using tumor heterogeneity and angiogenesis properties on MRI. Eur. Radiol. 2022, 32, 650–660. [Google Scholar] [CrossRef]
- Peng, W.K. Clustering Nuclear Magnetic Resonance: Machine learning assistive rapid two-dimensional relaxometry mapping. Eng. Rep. 2021, 3, e12383. [Google Scholar] [CrossRef]
- Kickingereder, P.; Götz, M.; Muschelli, J.; Wick, A.; Neuberger, U.; Shinohara, R.T.; Sill, M.; Nowosielski, M.; Schlemmer, H.P.; Radbruch, A.; et al. Large-scale Radiomic Profiling of Recurrent Glioblastoma Identifies an Imaging Predictor for Stratifying Anti-Angiogenic Treatment Response. Clin. Cancer Res. 2016, 22, 5765–5771. [Google Scholar] [CrossRef]


| Sample | Block-Based Otsu [12] (Dice Score %) | U-Net Based Network [11] (Dice Score %) |
|---|---|---|
| H&E | 67.5 | 92.1 |
| CD31 | 56.1 | 91.7 |
| Image Registration | H&E Sample | CD31 Sample | ||||
|---|---|---|---|---|---|---|
| Original | Thevenaz’s Algorithm [13] | STN [14] | Original | Thevenaz’s Algorithm [13] | STN [14] | |
| SSIM % | 29.2 | 46.3 | 57.0 | 9.1 | 14.9 | 25.6 |
| Dice % (GT) | 3.8 | 31.8 | 32.4 | 0.0 | 14.3 | 16.5 |
| Dice % (U-net) | 3.4 | 34.0 | 34.9 | 0.0 | 16.0 | 18.2 |
| H&E Sample | Before Registration | After Registration | ||||
|---|---|---|---|---|---|---|
| SSIM % | Dice % (GT) | Dice % (U-Net) | SSIM % | Dice % (GT) | Dice % (U-Net) | |
| pair 0, 1 | 26.0 | 38.2 | 38.0 | 43.4 | 77.6 | 80.7 |
| pair 1, 2 | 28.3 | 43.3 | 43.0 | 45.8 | 76.4 | 80.5 |
| pair 2, 3 | 28.3 | 43.8 | 44.0 | 44.9 | 79.3 | 81.4 |
| pair 3, 4 | 29.5 | 40.0 | 40.6 | 47.9 | 78.6 | 81.7 |
| pair 4, 5 | 33.0 | 32.5 | 31.3 | 50.5 | 76.3 | 80.3 |
| pair 5, 6 | 32.0 | 33.5 | 31.3 | 48.6 | 76.8 | 79.8 |
| pair 6, 7 | 27.6 | 39.9 | 39.5 | 43.3 | 74.0 | 75.6 |
| Full Sequence (Avg SSIM % or Mutual Dice %) | 29.2 | 3.8 | 3.4 | 57.0 | 32.4 | 34.9 |
| CD31 Sample | Before Registration | After Registration | ||||
|---|---|---|---|---|---|---|
| SSIM % | Dice %(GT) | Dice % (U-Net) | SSIM % | Dice % (GT) | Dice % (U-Net) | |
| pair 0, 1 | 8.5 | 25.5 | 24.8 | 34.2 | 80.8 | 83.5 |
| pair 1, 2 | 11.4 | 55.8 | 55.7 | 24.2 | 79.9 | 81.1 |
| pair 2, 3 | 11.4 | 9.7 | 9.0 | 20.2 | 69.7 | 73.6 |
| pair 3, 4 | 8.9 | 9.1 | 8.0 | 20.4 | 71.8 | 74.9 |
| pair 4, 5 | 8.6 | 28.4 | 28.0 | 24.7 | 69.9 | 70.0 |
| pair 5, 6 | 8.0 | 8.8 | 7.9 | 24.9 | 75.8 | 77.3 |
| pair 6, 7 | 8.3 | 38.6 | 39.0 | 26.5 | 74.8 | 78.3 |
| pair 7, 8 | 8.1 | 9.5 | 12.3 | 31.4 | 76.8 | 78.2 |
| pair 8, 9 | 8.5 | 3.4 | 4.5 | 24.2 | 67.5 | 69.1 |
| Full Sequence (Avg SSIM % or Mutual Dice %) | 9.1 | 0.0 | 0.0 | 25.6 | 16.5 | 18.2 |
Disclaimer/Publisher’s Note: The statements, opinions and data contained in all publications are solely those of the individual author(s) and contributor(s) and not of MDPI and/or the editor(s). MDPI and/or the editor(s) disclaim responsibility for any injury to people or property resulting from any ideas, methods, instructions or products referred to in the content. |
© 2023 by the authors. Licensee MDPI, Basel, Switzerland. This article is an open access article distributed under the terms and conditions of the Creative Commons Attribution (CC BY) license (https://creativecommons.org/licenses/by/4.0/).
Share and Cite
Ramakrishnan, V.; Schönmehl, R.; Artinger, A.; Winter, L.; Böck, H.; Schreml, S.; Gürtler, F.; Daza, J.; Schmitt, V.H.; Mamilos, A.; et al. 3D Visualization, Skeletonization and Branching Analysis of Blood Vessels in Angiogenesis. Int. J. Mol. Sci. 2023, 24, 7714. https://doi.org/10.3390/ijms24097714
Ramakrishnan V, Schönmehl R, Artinger A, Winter L, Böck H, Schreml S, Gürtler F, Daza J, Schmitt VH, Mamilos A, et al. 3D Visualization, Skeletonization and Branching Analysis of Blood Vessels in Angiogenesis. International Journal of Molecular Sciences. 2023; 24(9):7714. https://doi.org/10.3390/ijms24097714
Chicago/Turabian StyleRamakrishnan, Vignesh, Rebecca Schönmehl, Annalena Artinger, Lina Winter, Hendrik Böck, Stephan Schreml, Florian Gürtler, Jimmy Daza, Volker H. Schmitt, Andreas Mamilos, and et al. 2023. "3D Visualization, Skeletonization and Branching Analysis of Blood Vessels in Angiogenesis" International Journal of Molecular Sciences 24, no. 9: 7714. https://doi.org/10.3390/ijms24097714
APA StyleRamakrishnan, V., Schönmehl, R., Artinger, A., Winter, L., Böck, H., Schreml, S., Gürtler, F., Daza, J., Schmitt, V. H., Mamilos, A., Arbelaez, P., Teufel, A., Niedermair, T., Topolcan, O., Karlíková, M., Sossalla, S., Wiedenroth, C. B., Rupp, M., & Brochhausen, C. (2023). 3D Visualization, Skeletonization and Branching Analysis of Blood Vessels in Angiogenesis. International Journal of Molecular Sciences, 24(9), 7714. https://doi.org/10.3390/ijms24097714