
Differential Early Mechanistic Frontal Lobe Responses to Choline Chloride and Soy Isoflavones in an Experimental Model of Fetal Alcohol Spectrum Disorder
Abstract
1. Introduction
2. Results
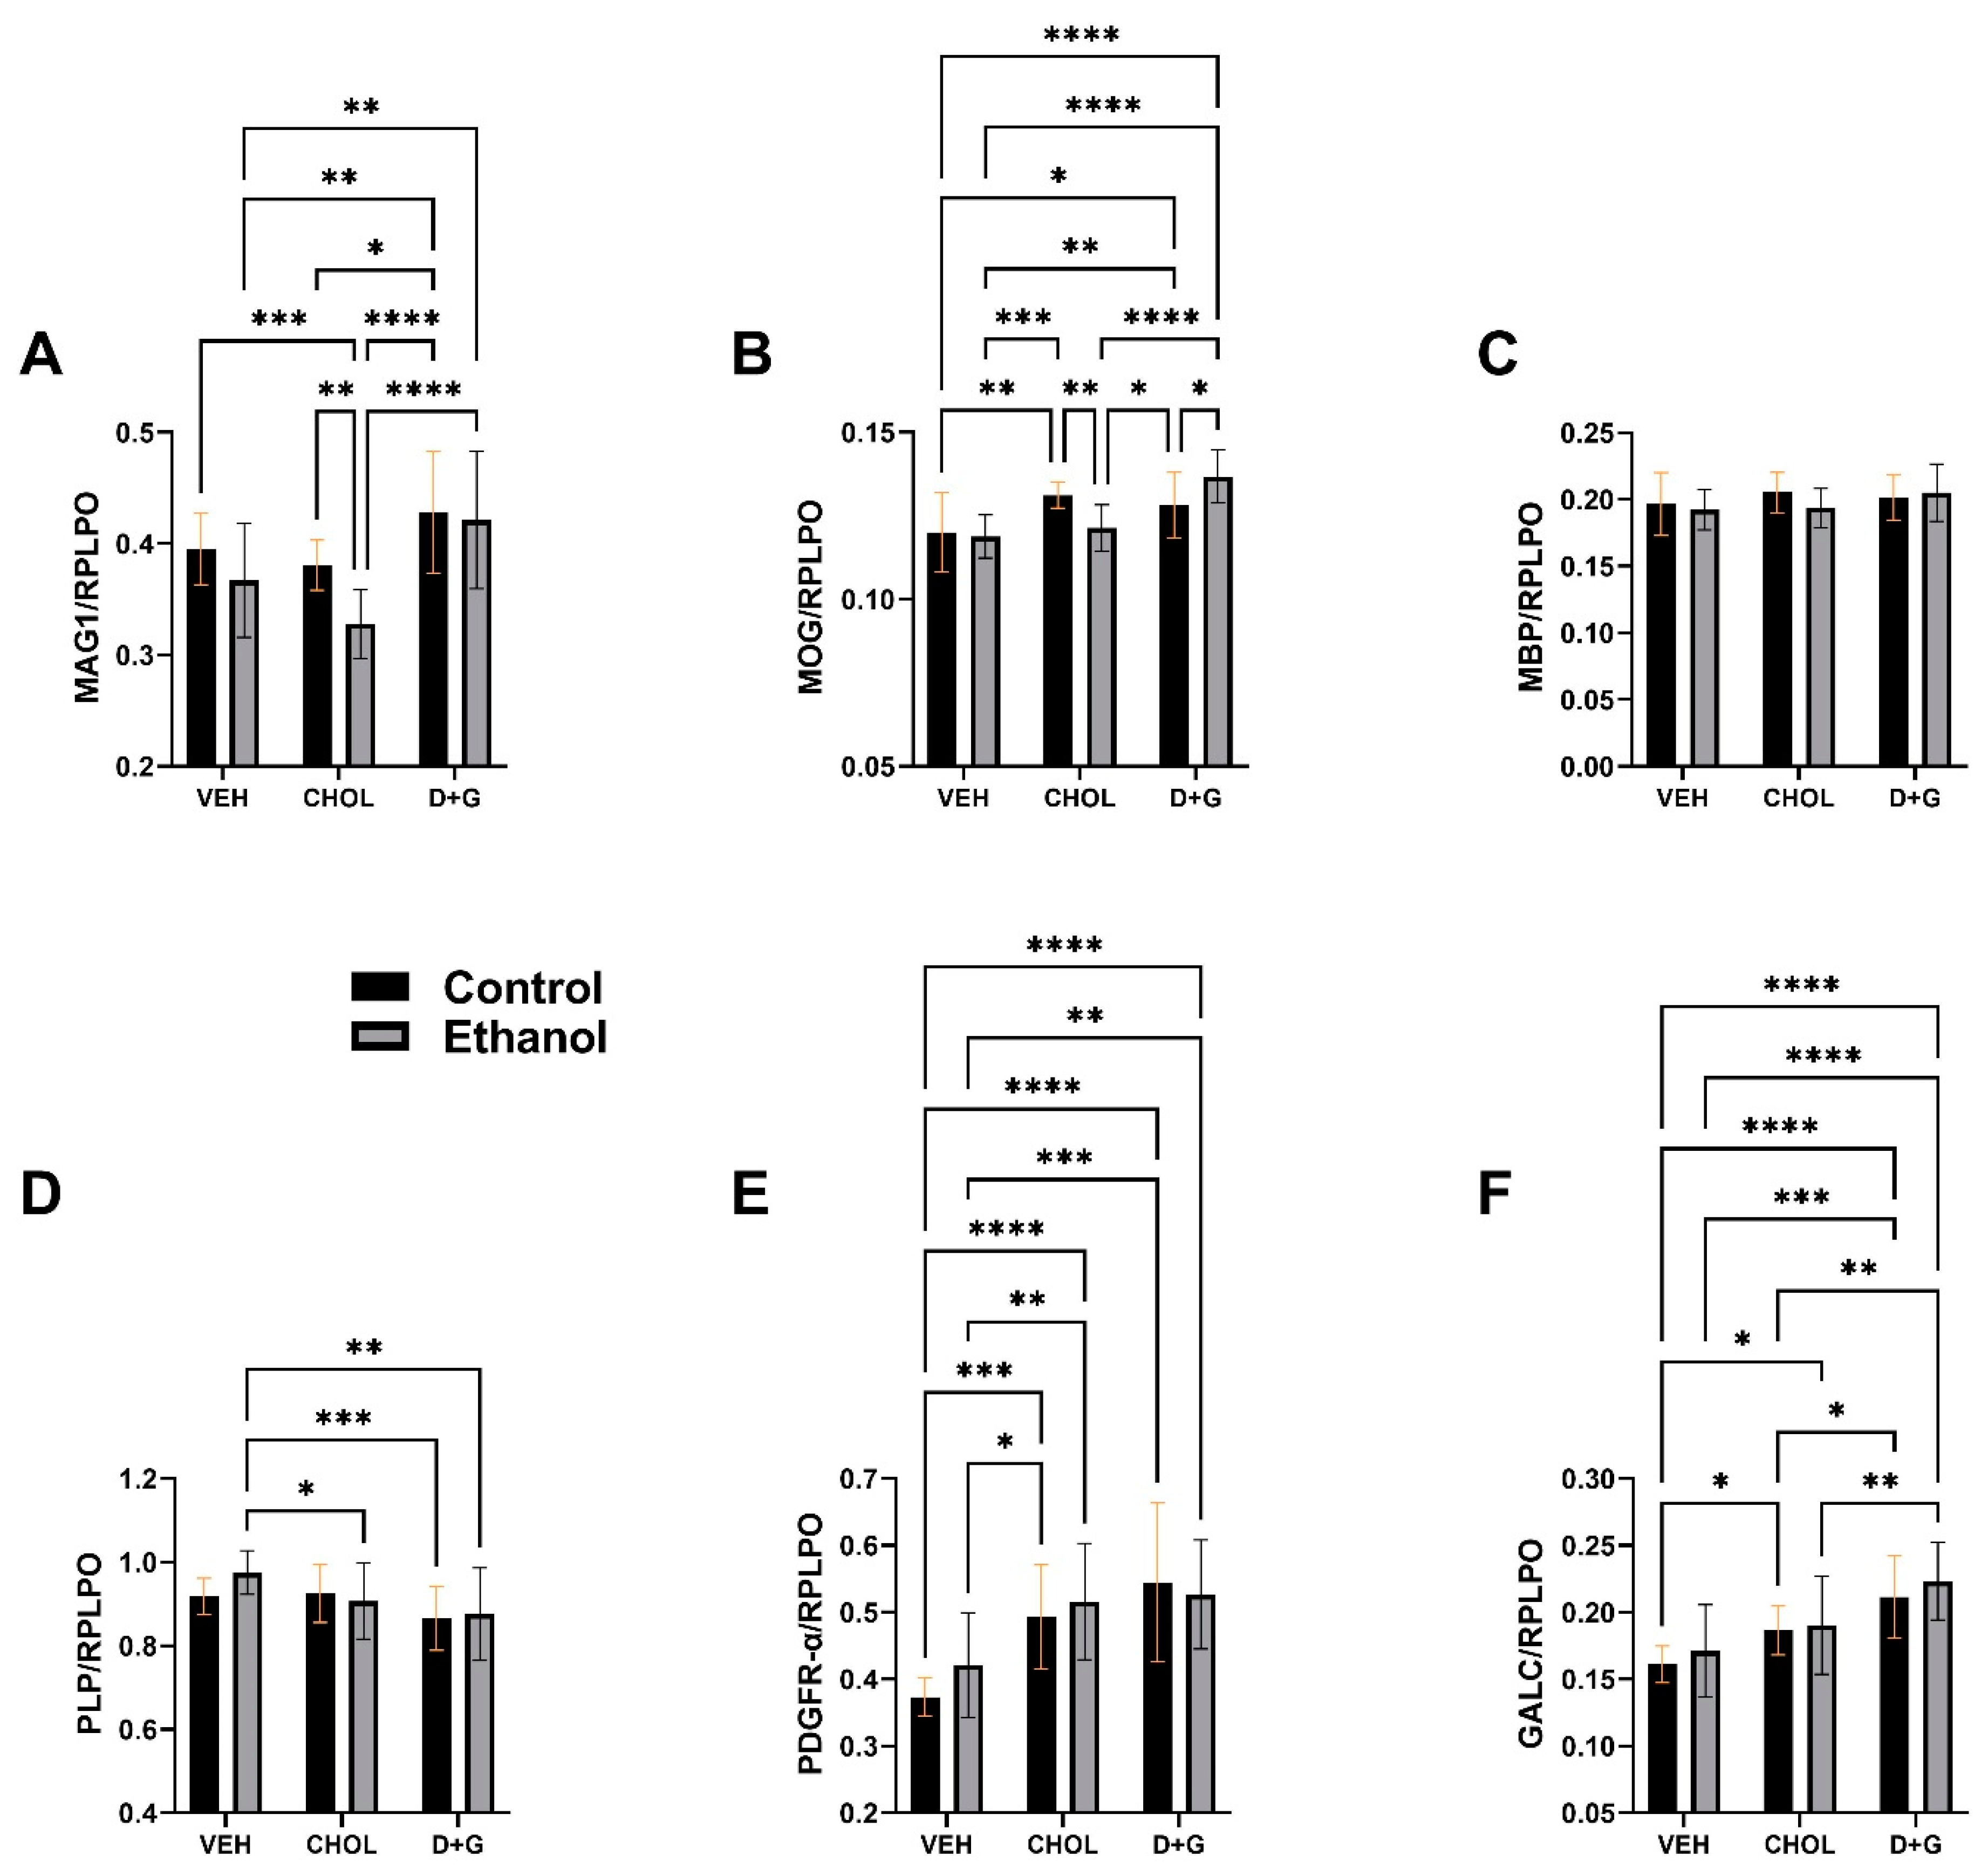
2.1. Oligodendrocyte Proteins
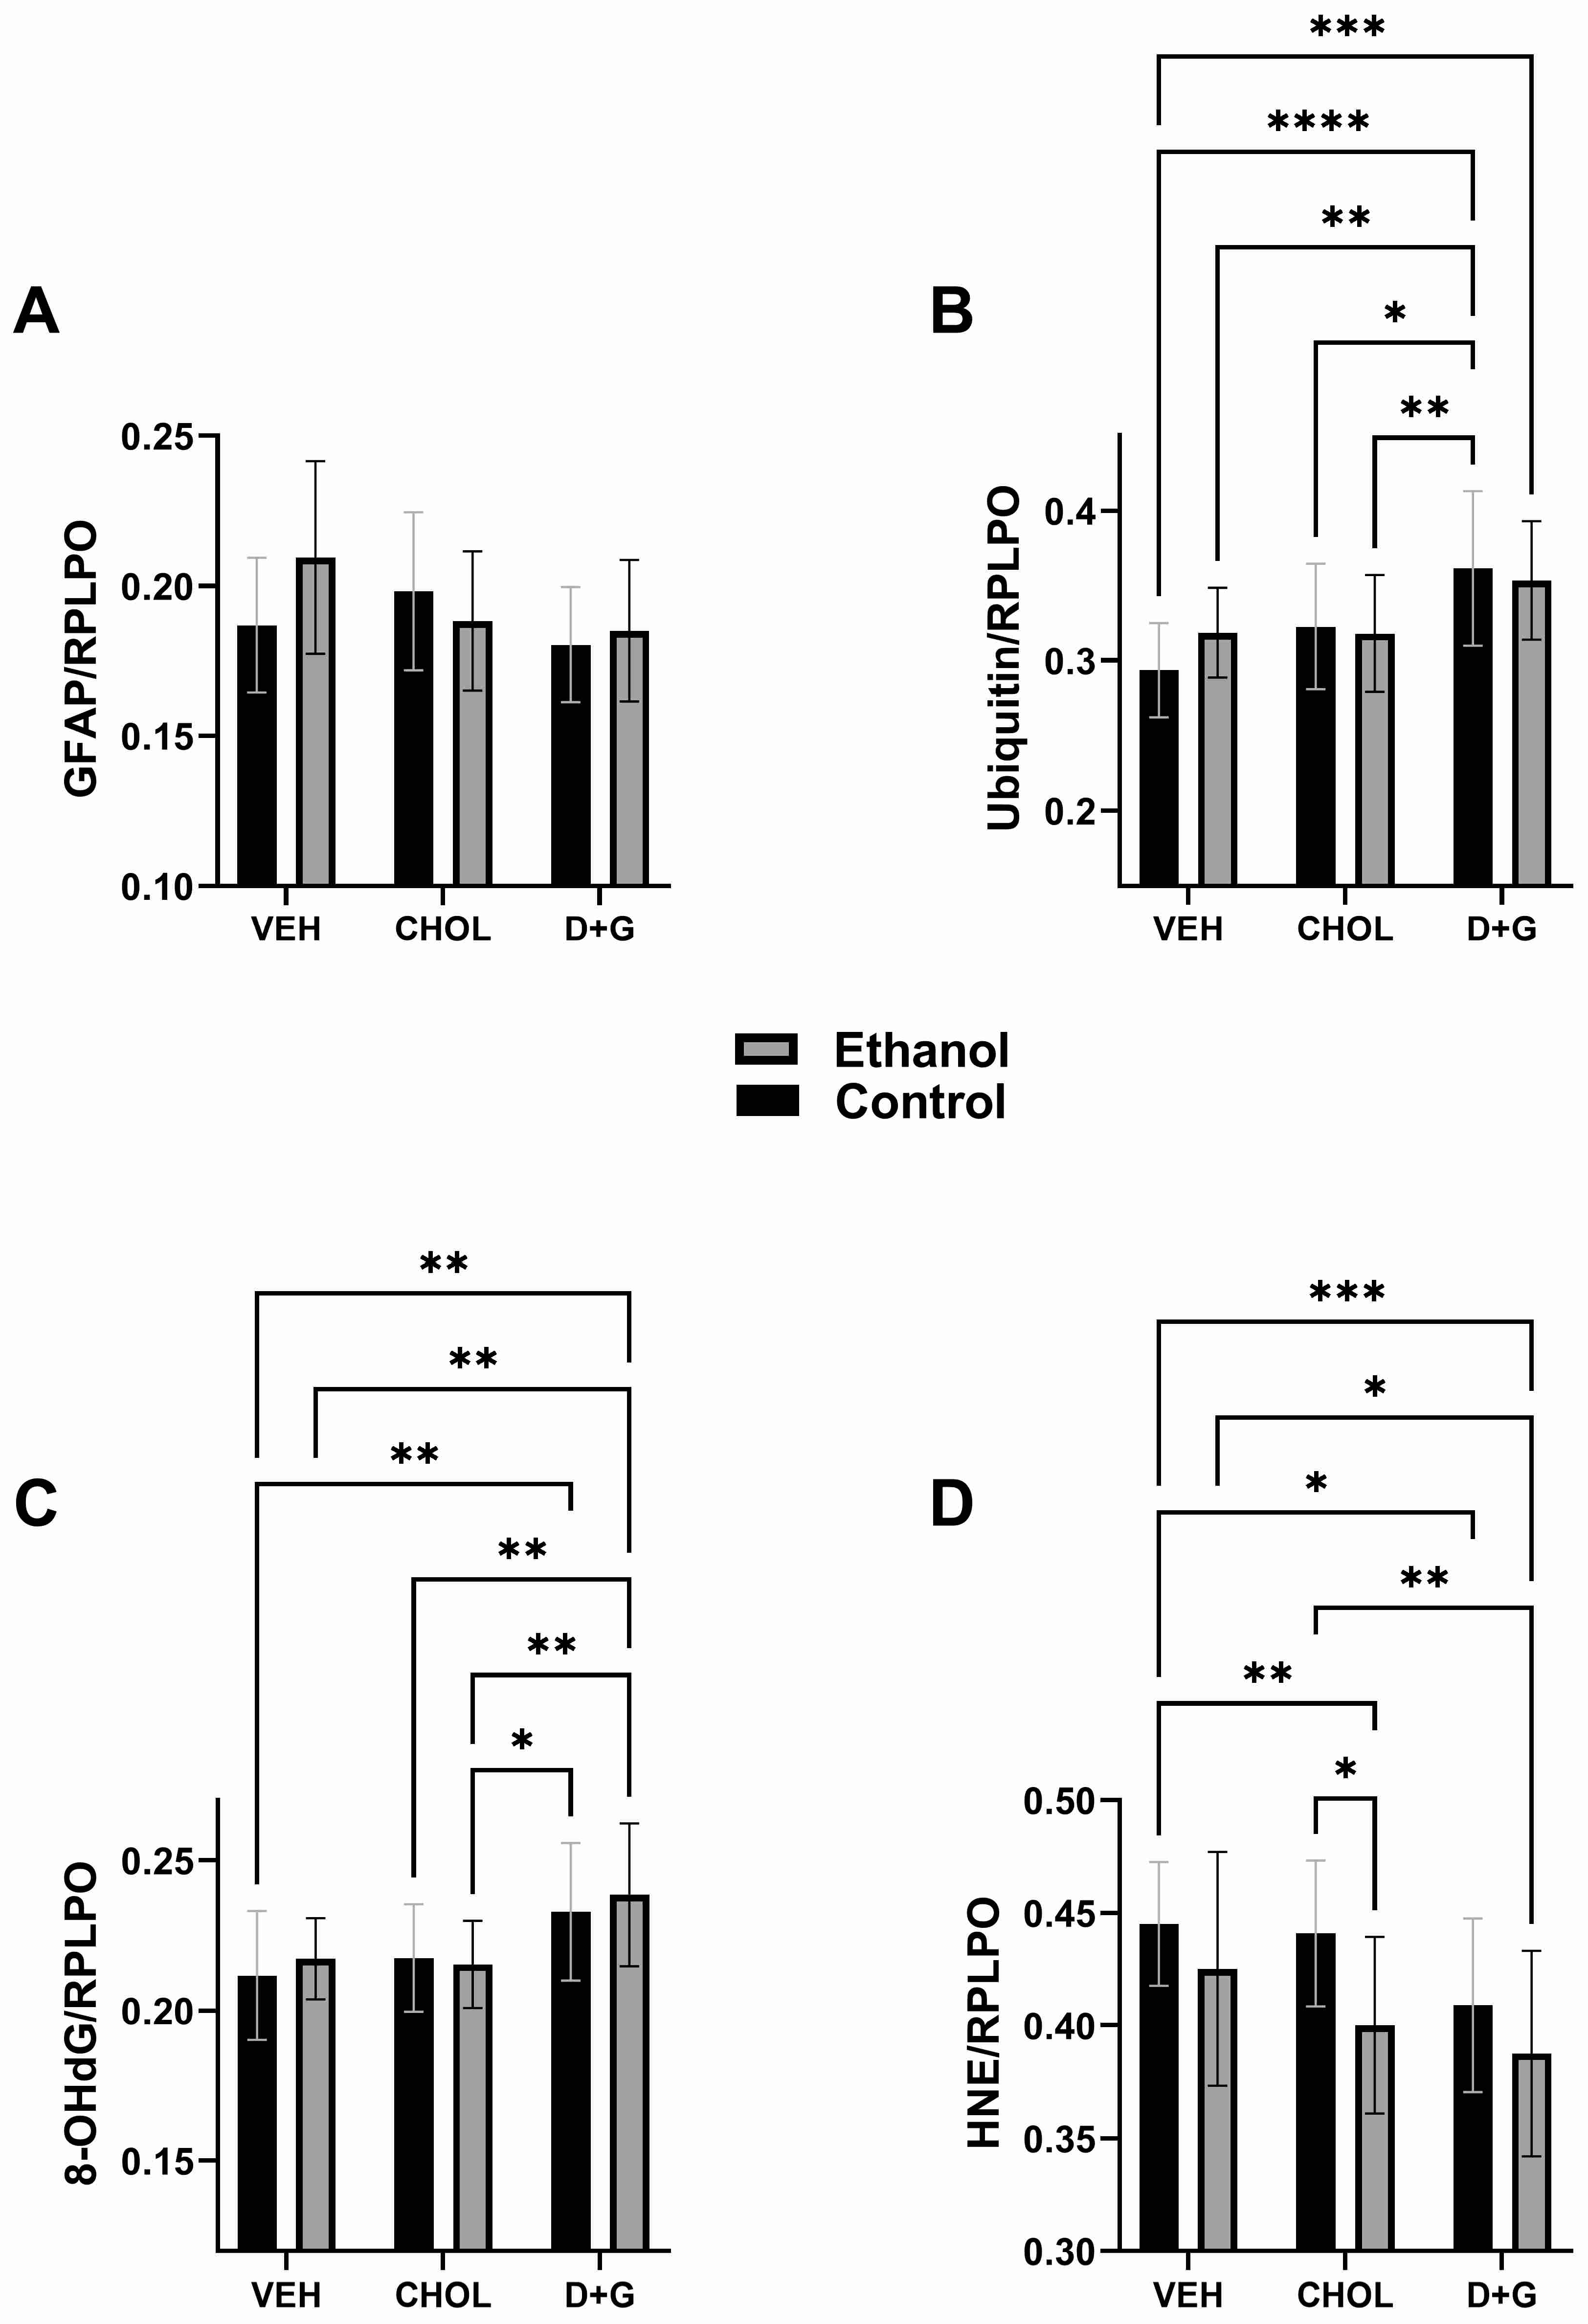
2.2. Astrocytes and Stress Molecules
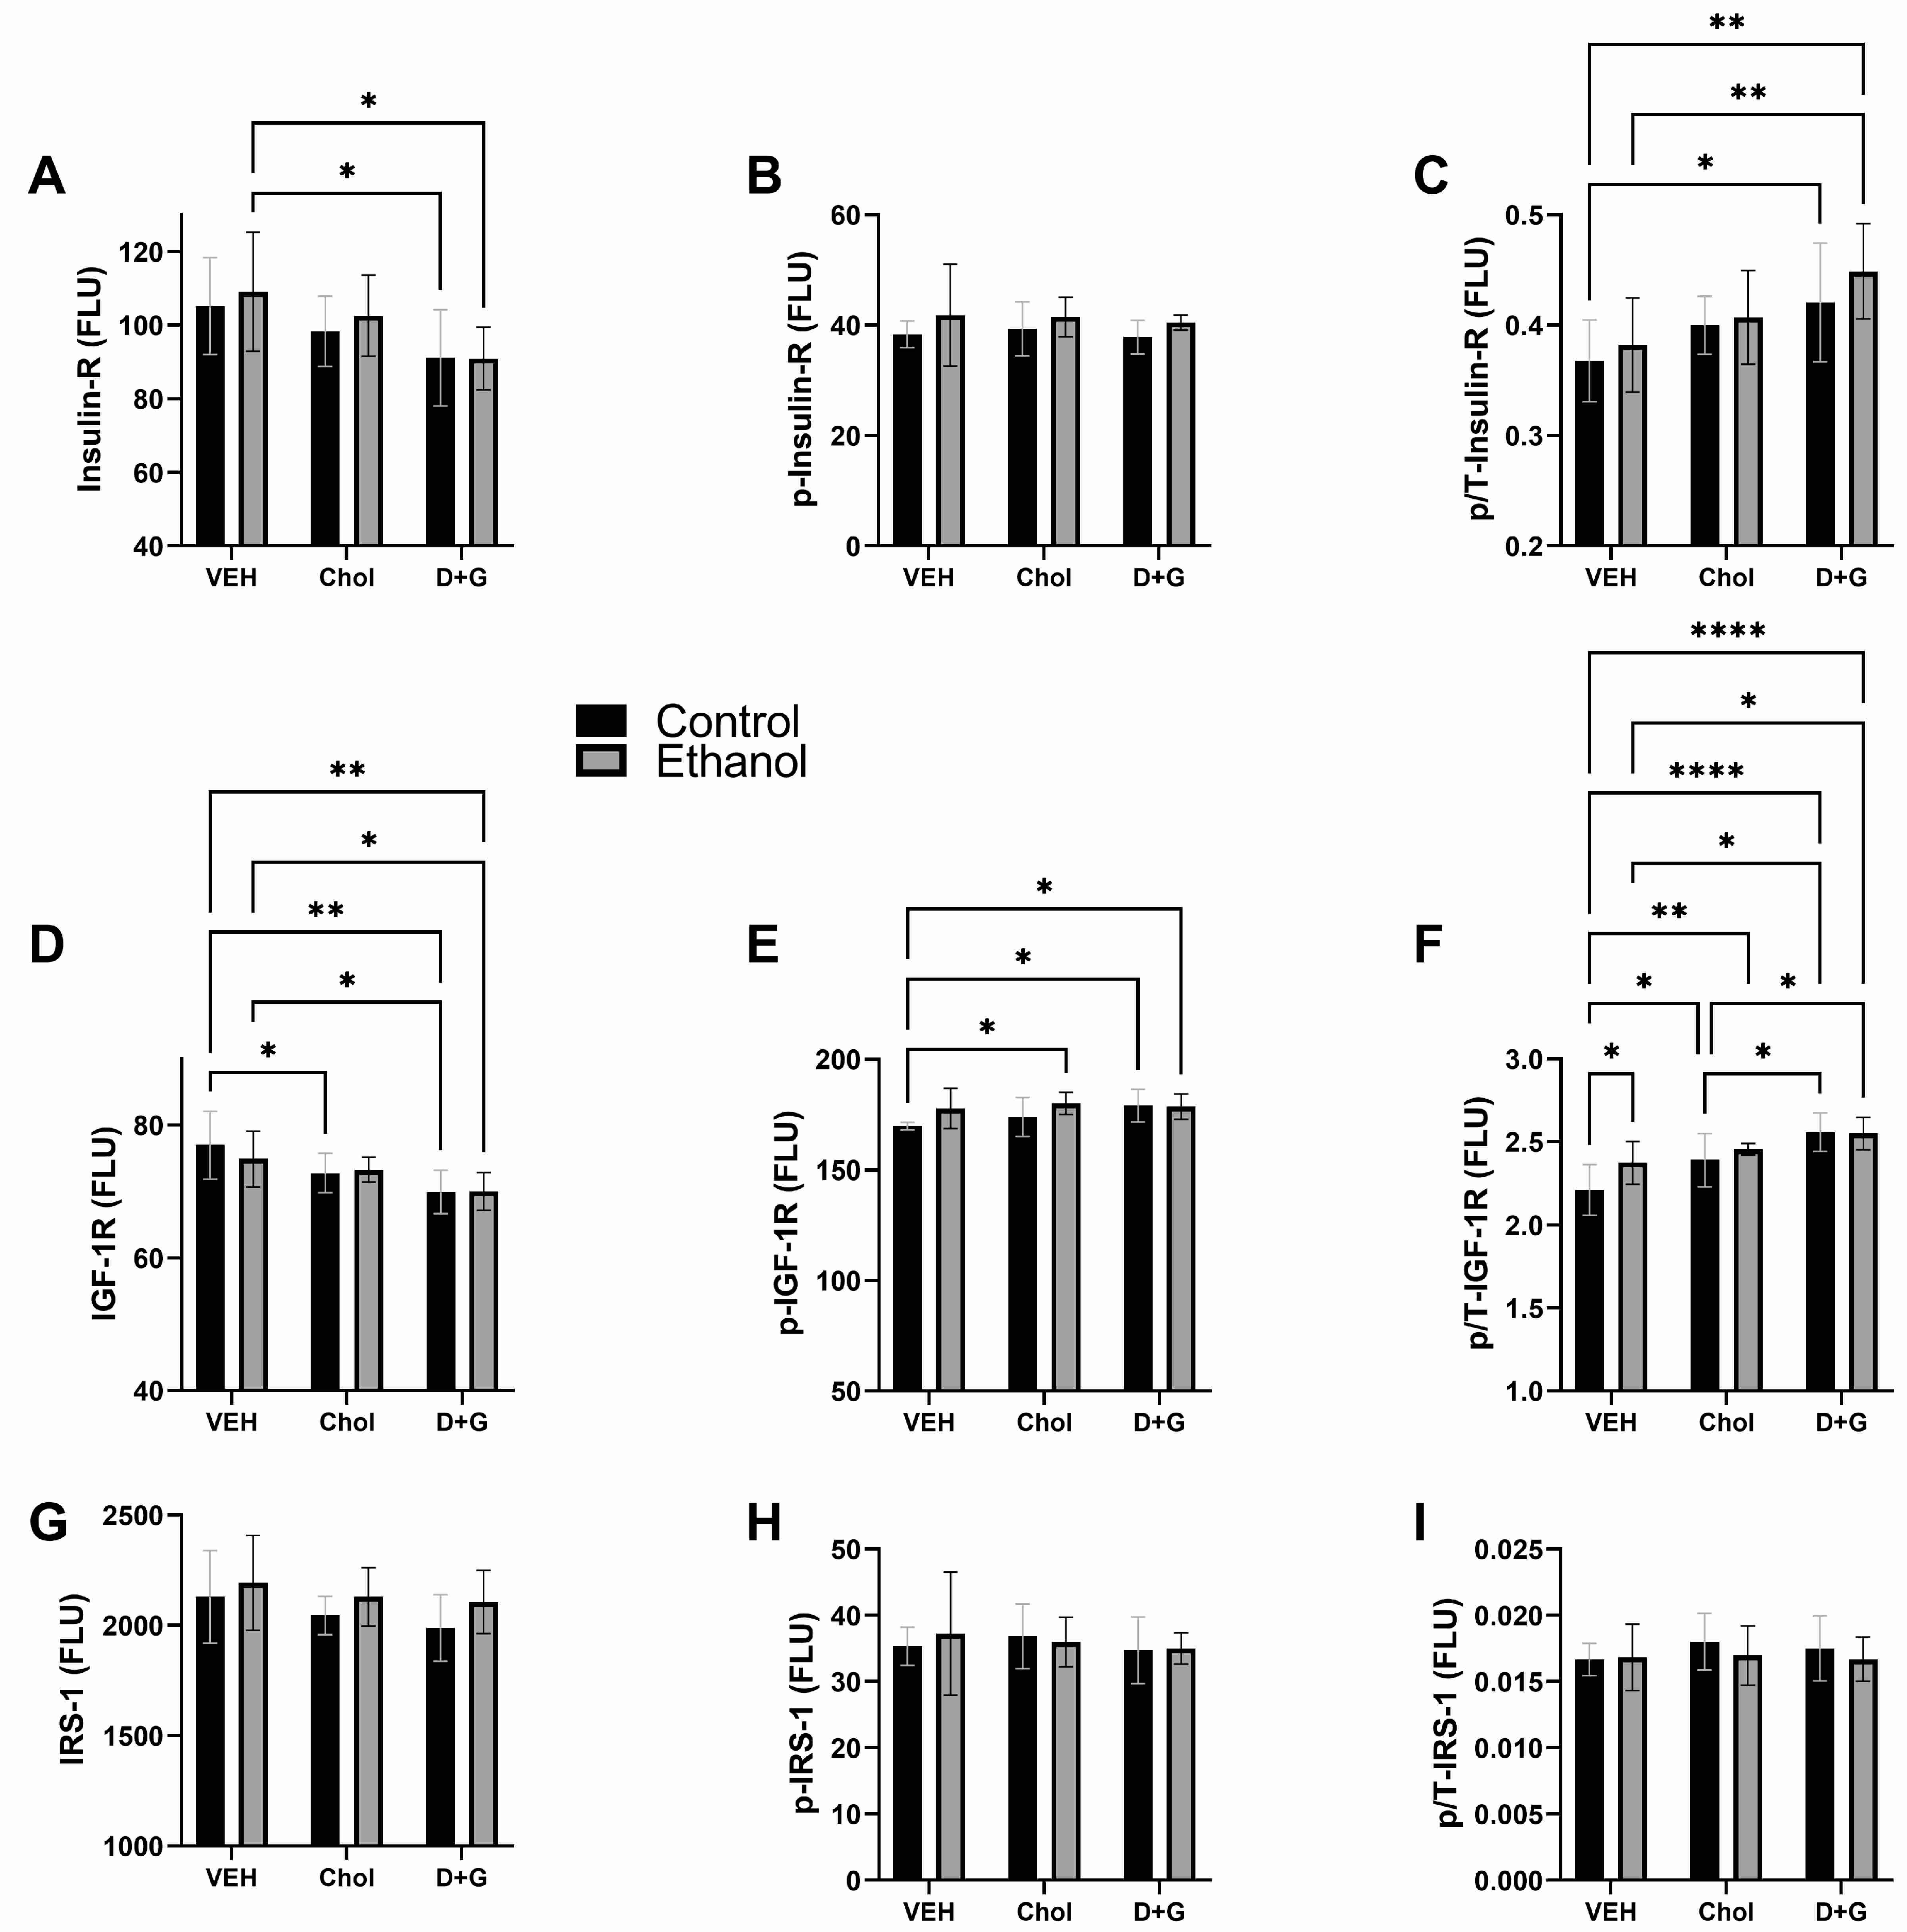
2.3. Upstream Insulin/IGF-1 Signaling
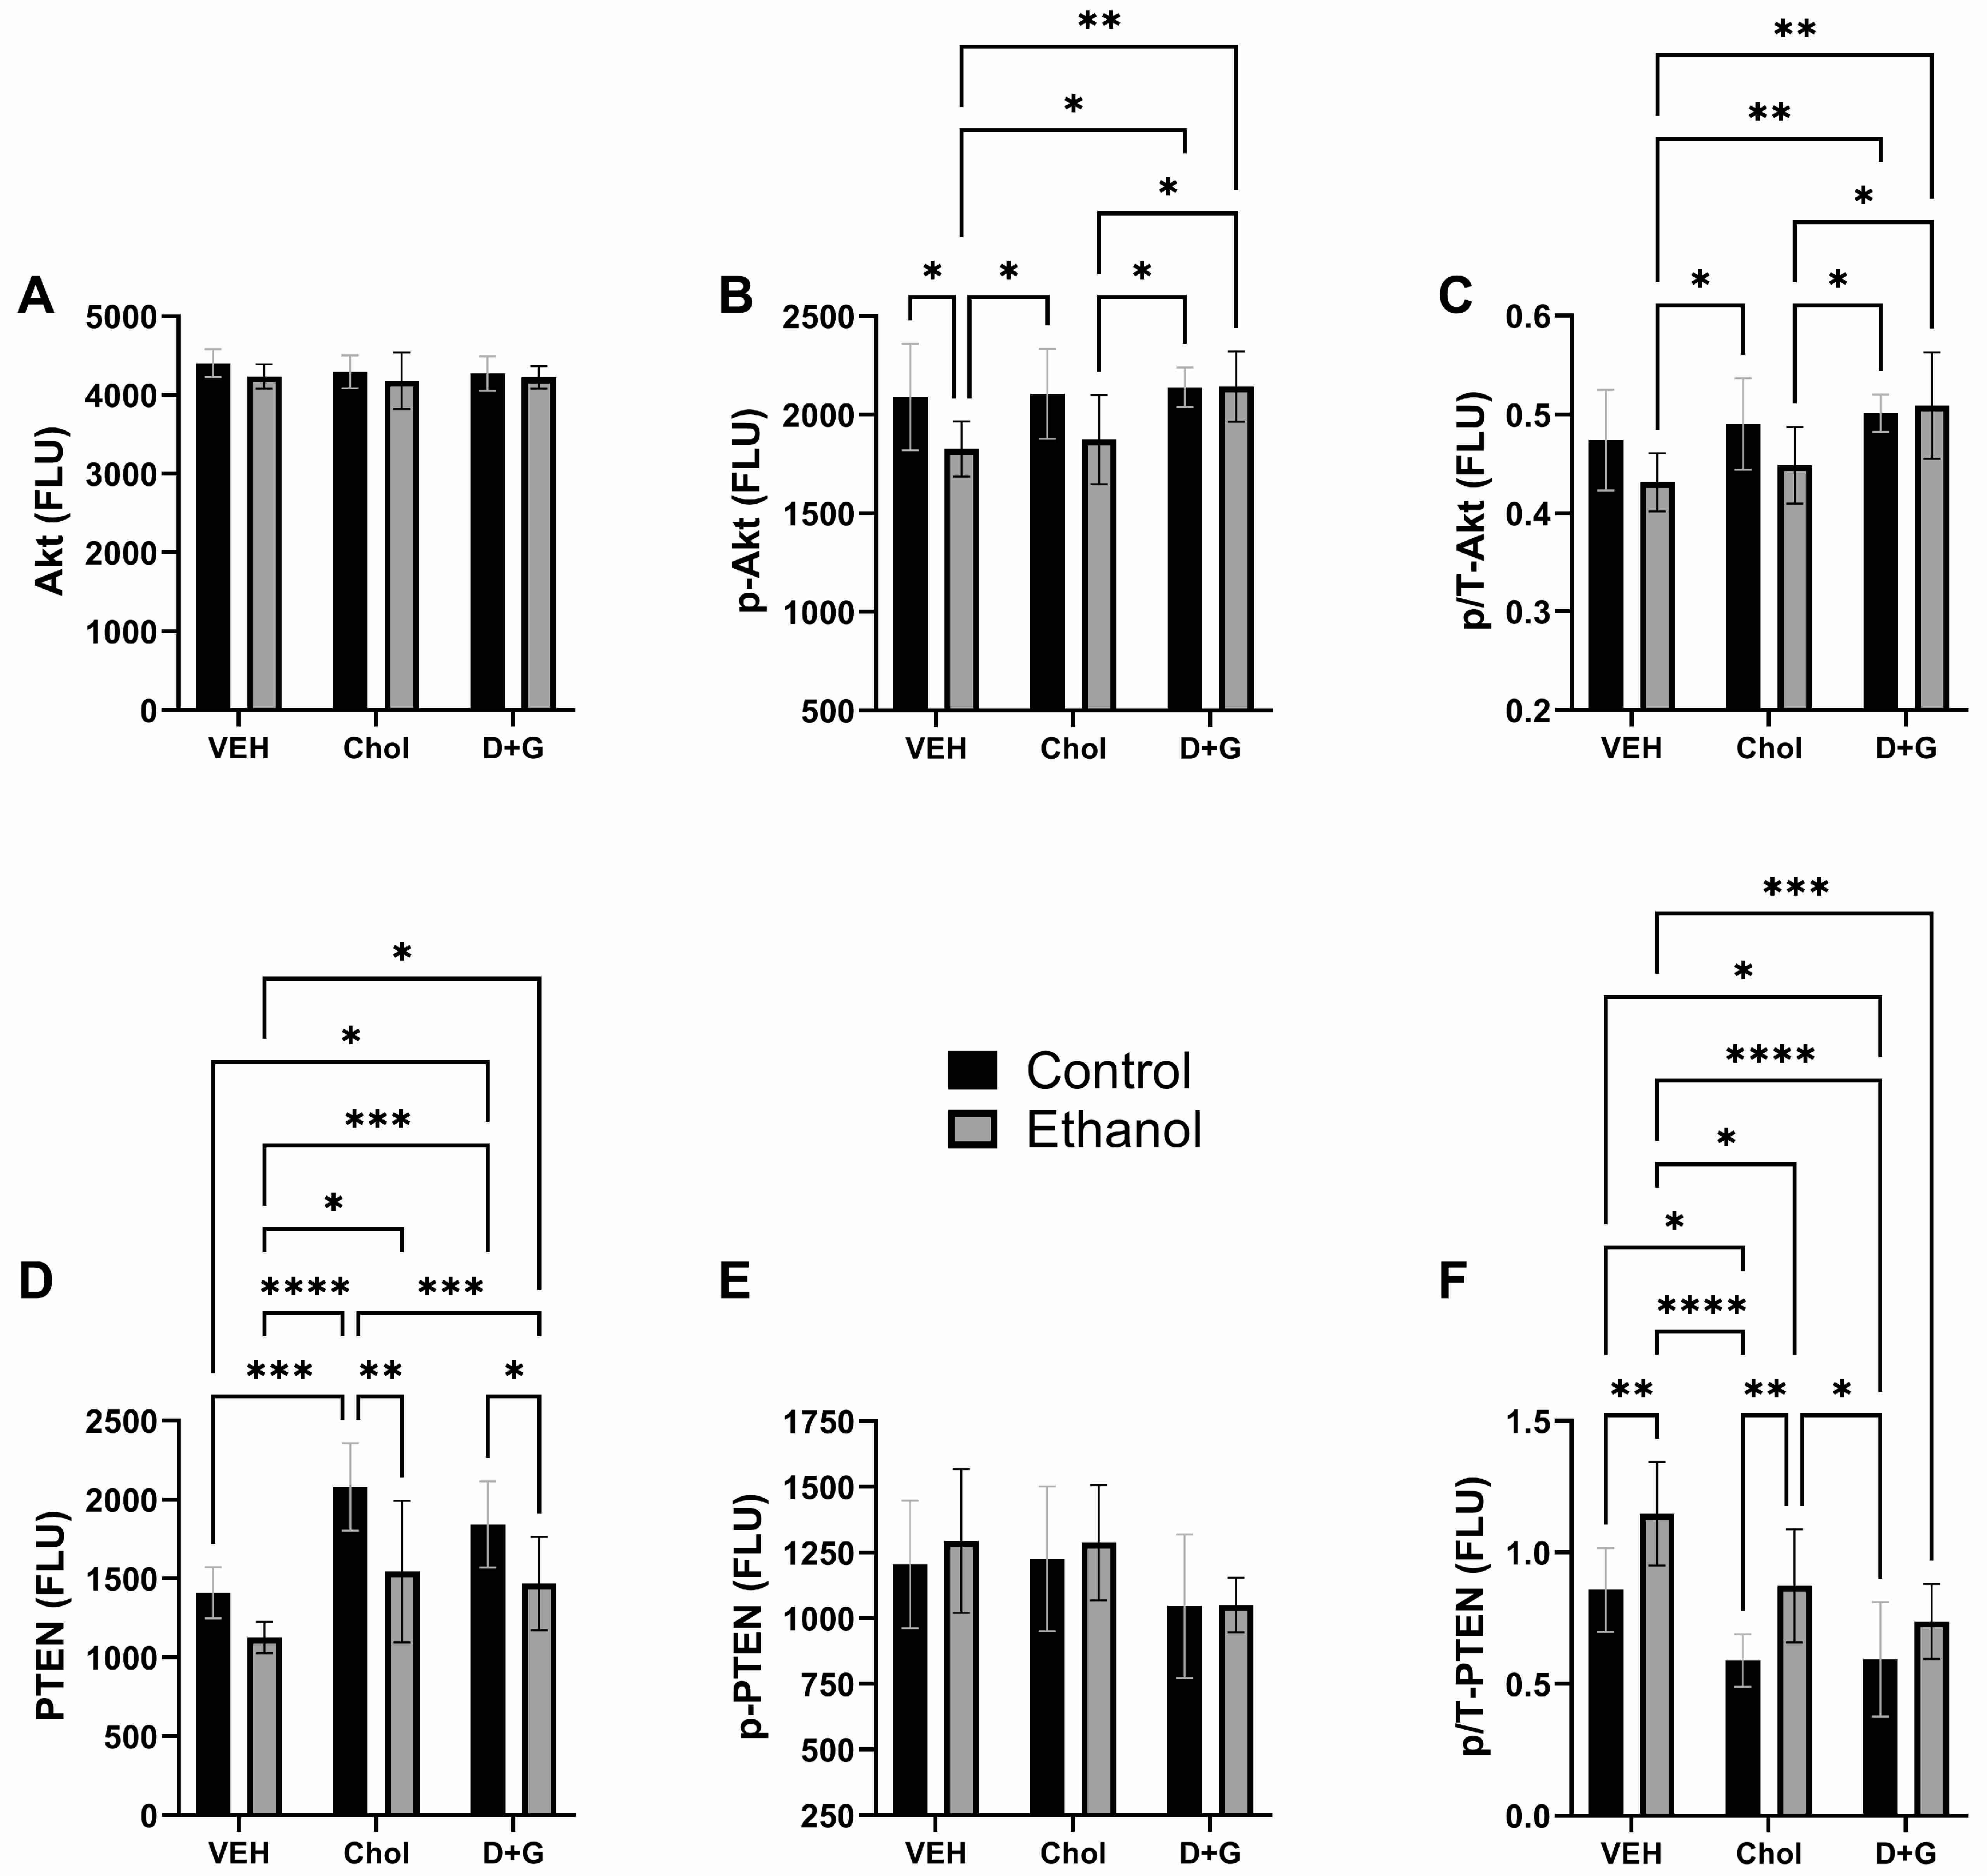
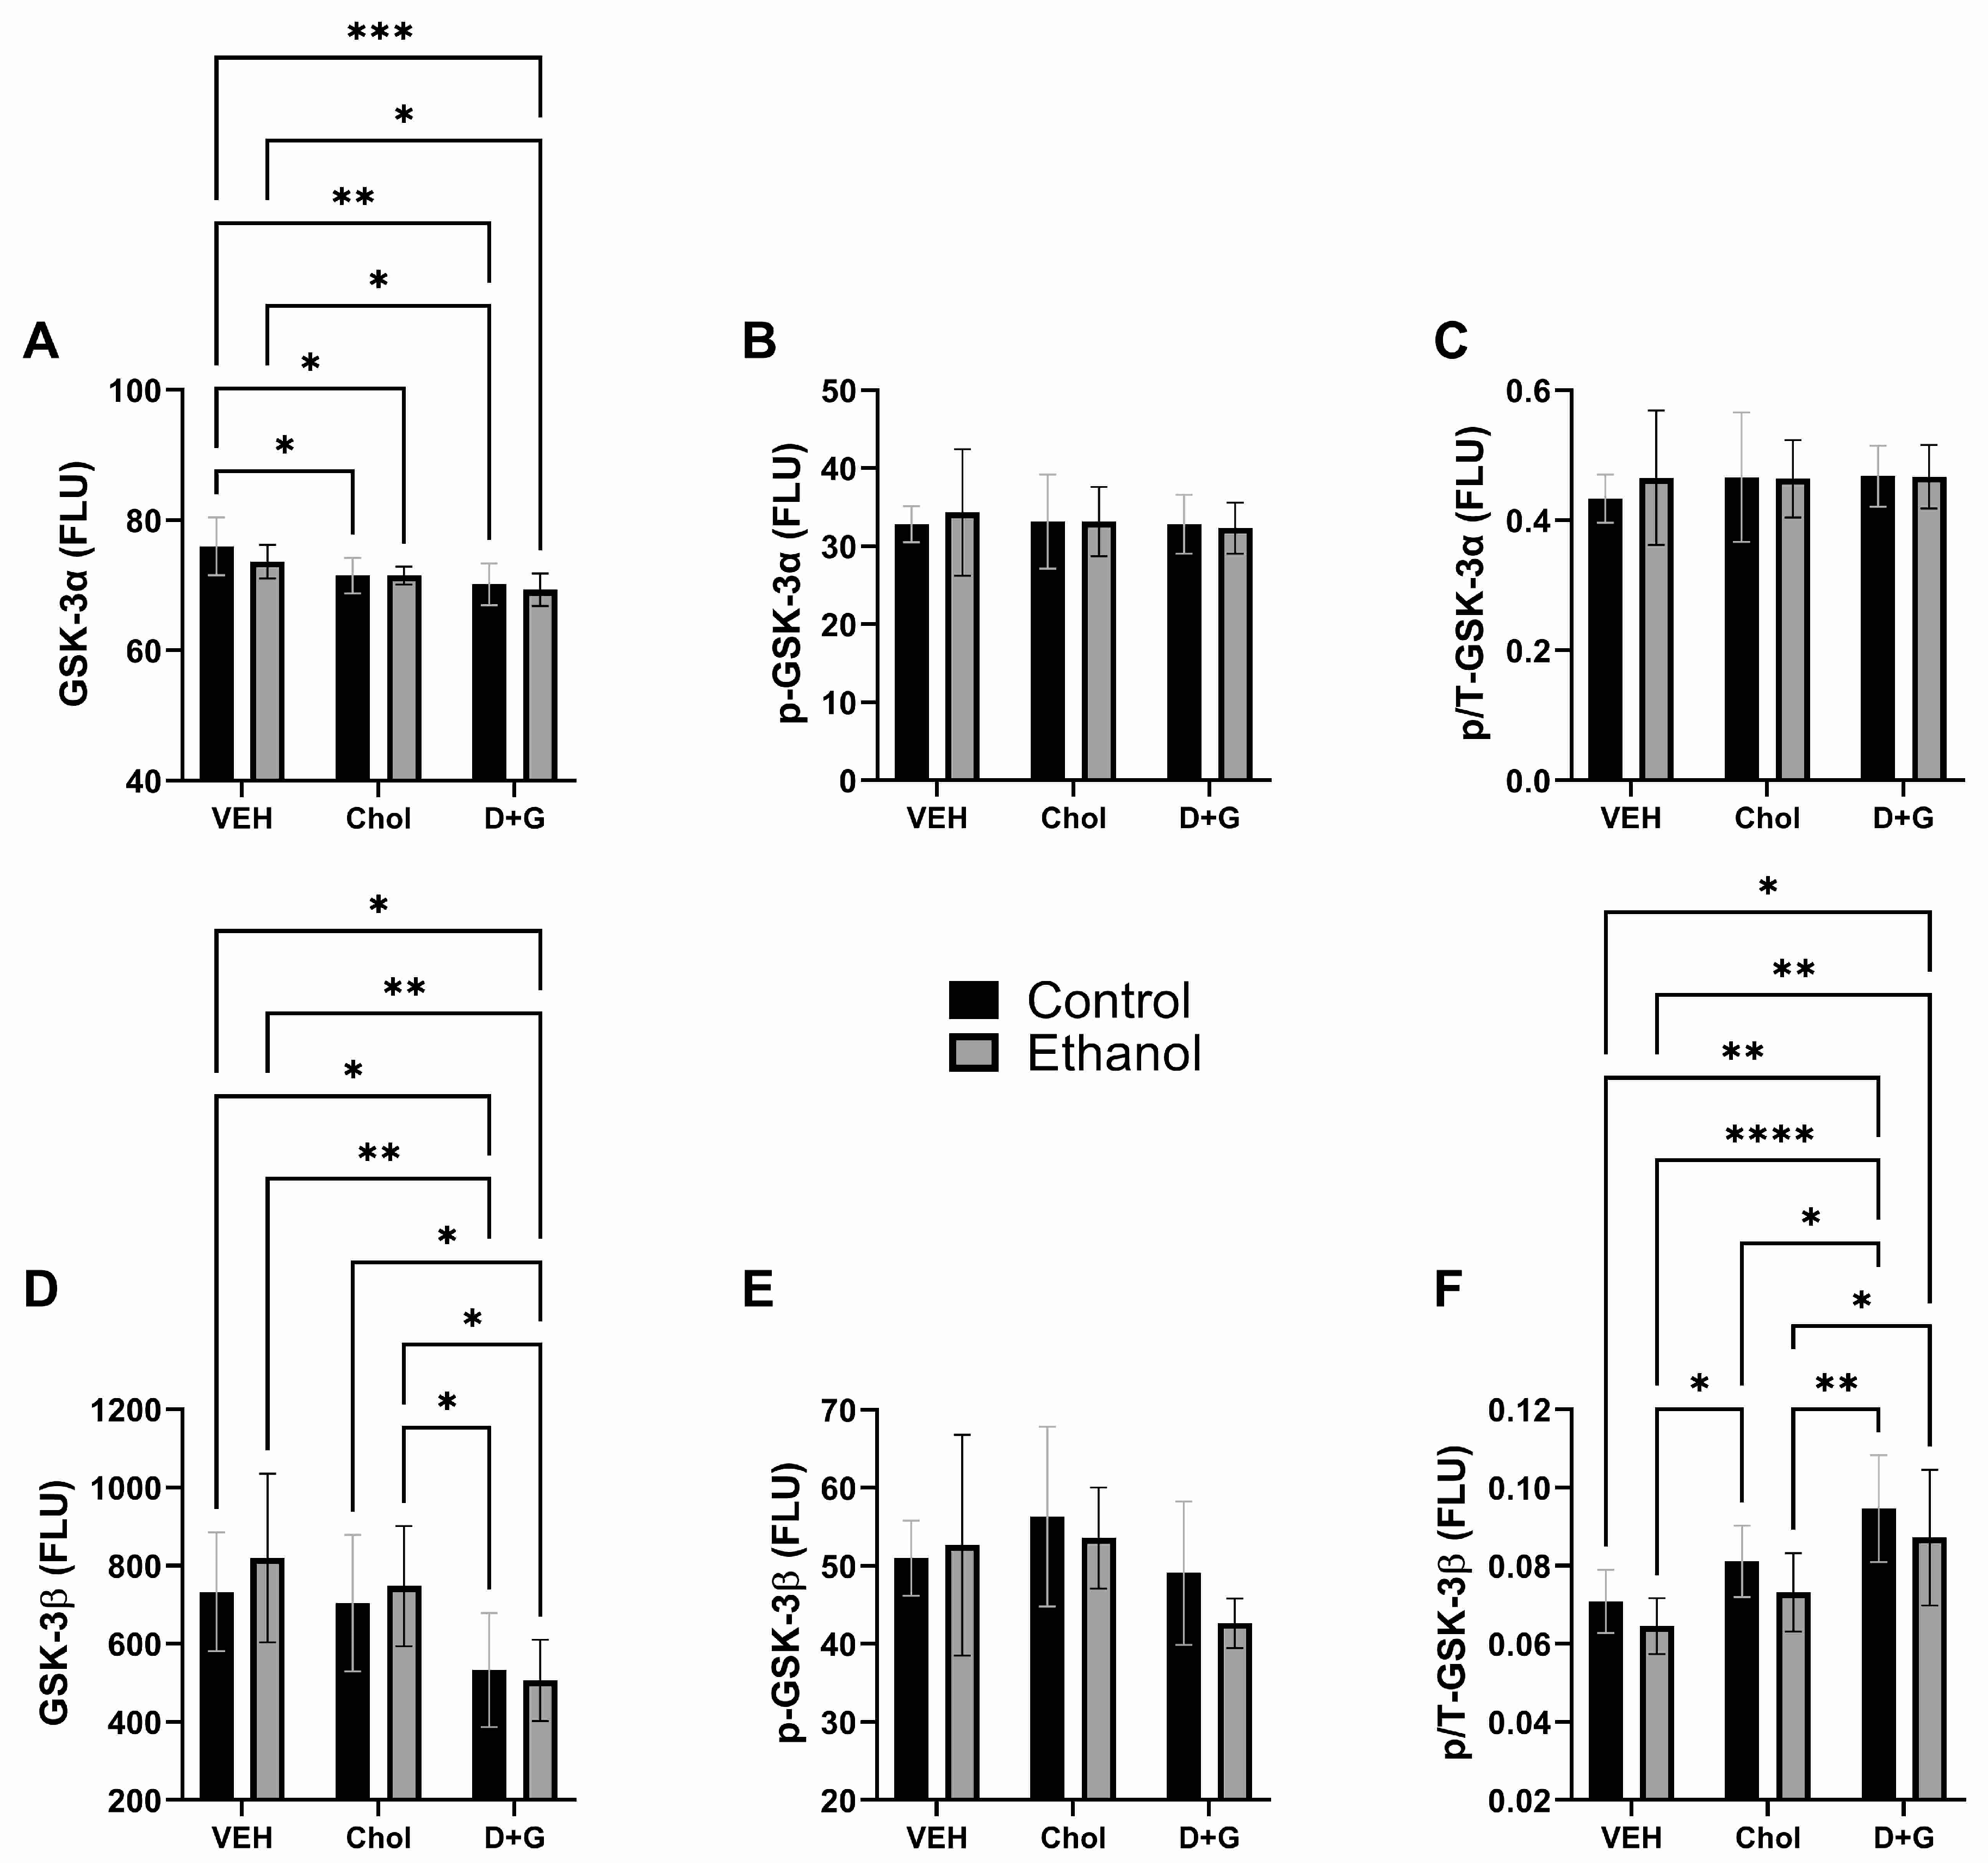
2.4. Akt Pathway (Table 3 and Figure 4)


| Protein | Ethanol Factor | Treatment Factor | Ethanol x Treatment Interaction | |||
|---|---|---|---|---|---|---|
| F-Ratio | p-Value | F-Ratio | p-Value | F-Ratio | p-Value | |
| Akt | 2.214 | N.S. | 0.491 | N.S. | 0.262 | N.S. |
| p-Akt | 6.113 | 0.01 | 2.915 | 0.0697 | 1.599 | N.S. |
| p/T-Akt | 3.434 | 0.074 | 4.977 | 0.014 | 1.432 | N.S. |
| PTEN | 17.94 | 0.0002 | 11.831 | 0.0002 | 0.616 | N.S. |
| p-PTEN | 0.413 | N.S. | 2.928 | 0.0689 | 0.097 | N.S. |
| p/T-PTEN | 16.39 | 0.0003 | 12.17 | 0.0001 | 0.527 | N.S. |
| GSK-3α | 1.153 | N.S. | 9.199 | 0.0008 | 0.482 | N.S. |
| p-GSK-3α | 0.039 | N.S. | 0.119 | N.S. | 0.128 | N.S. |
| p/T-GSK-3α | 0.166 | N.S. | 0.229 | N.S. | 0.232 | N.S. |
| GSK-3β | 0.413 | N.S. | 8.562 | 0.001 | 0.378 | N.S. |
| p-GSK-3β | 0.684 | N.S. | 3.108 | 0.059 | 0.598 | N.S. |
| p/T-GSK-3β | 3.591 | 0.068 | 12.37 | 0.0001 | 0.014 | N.S. |
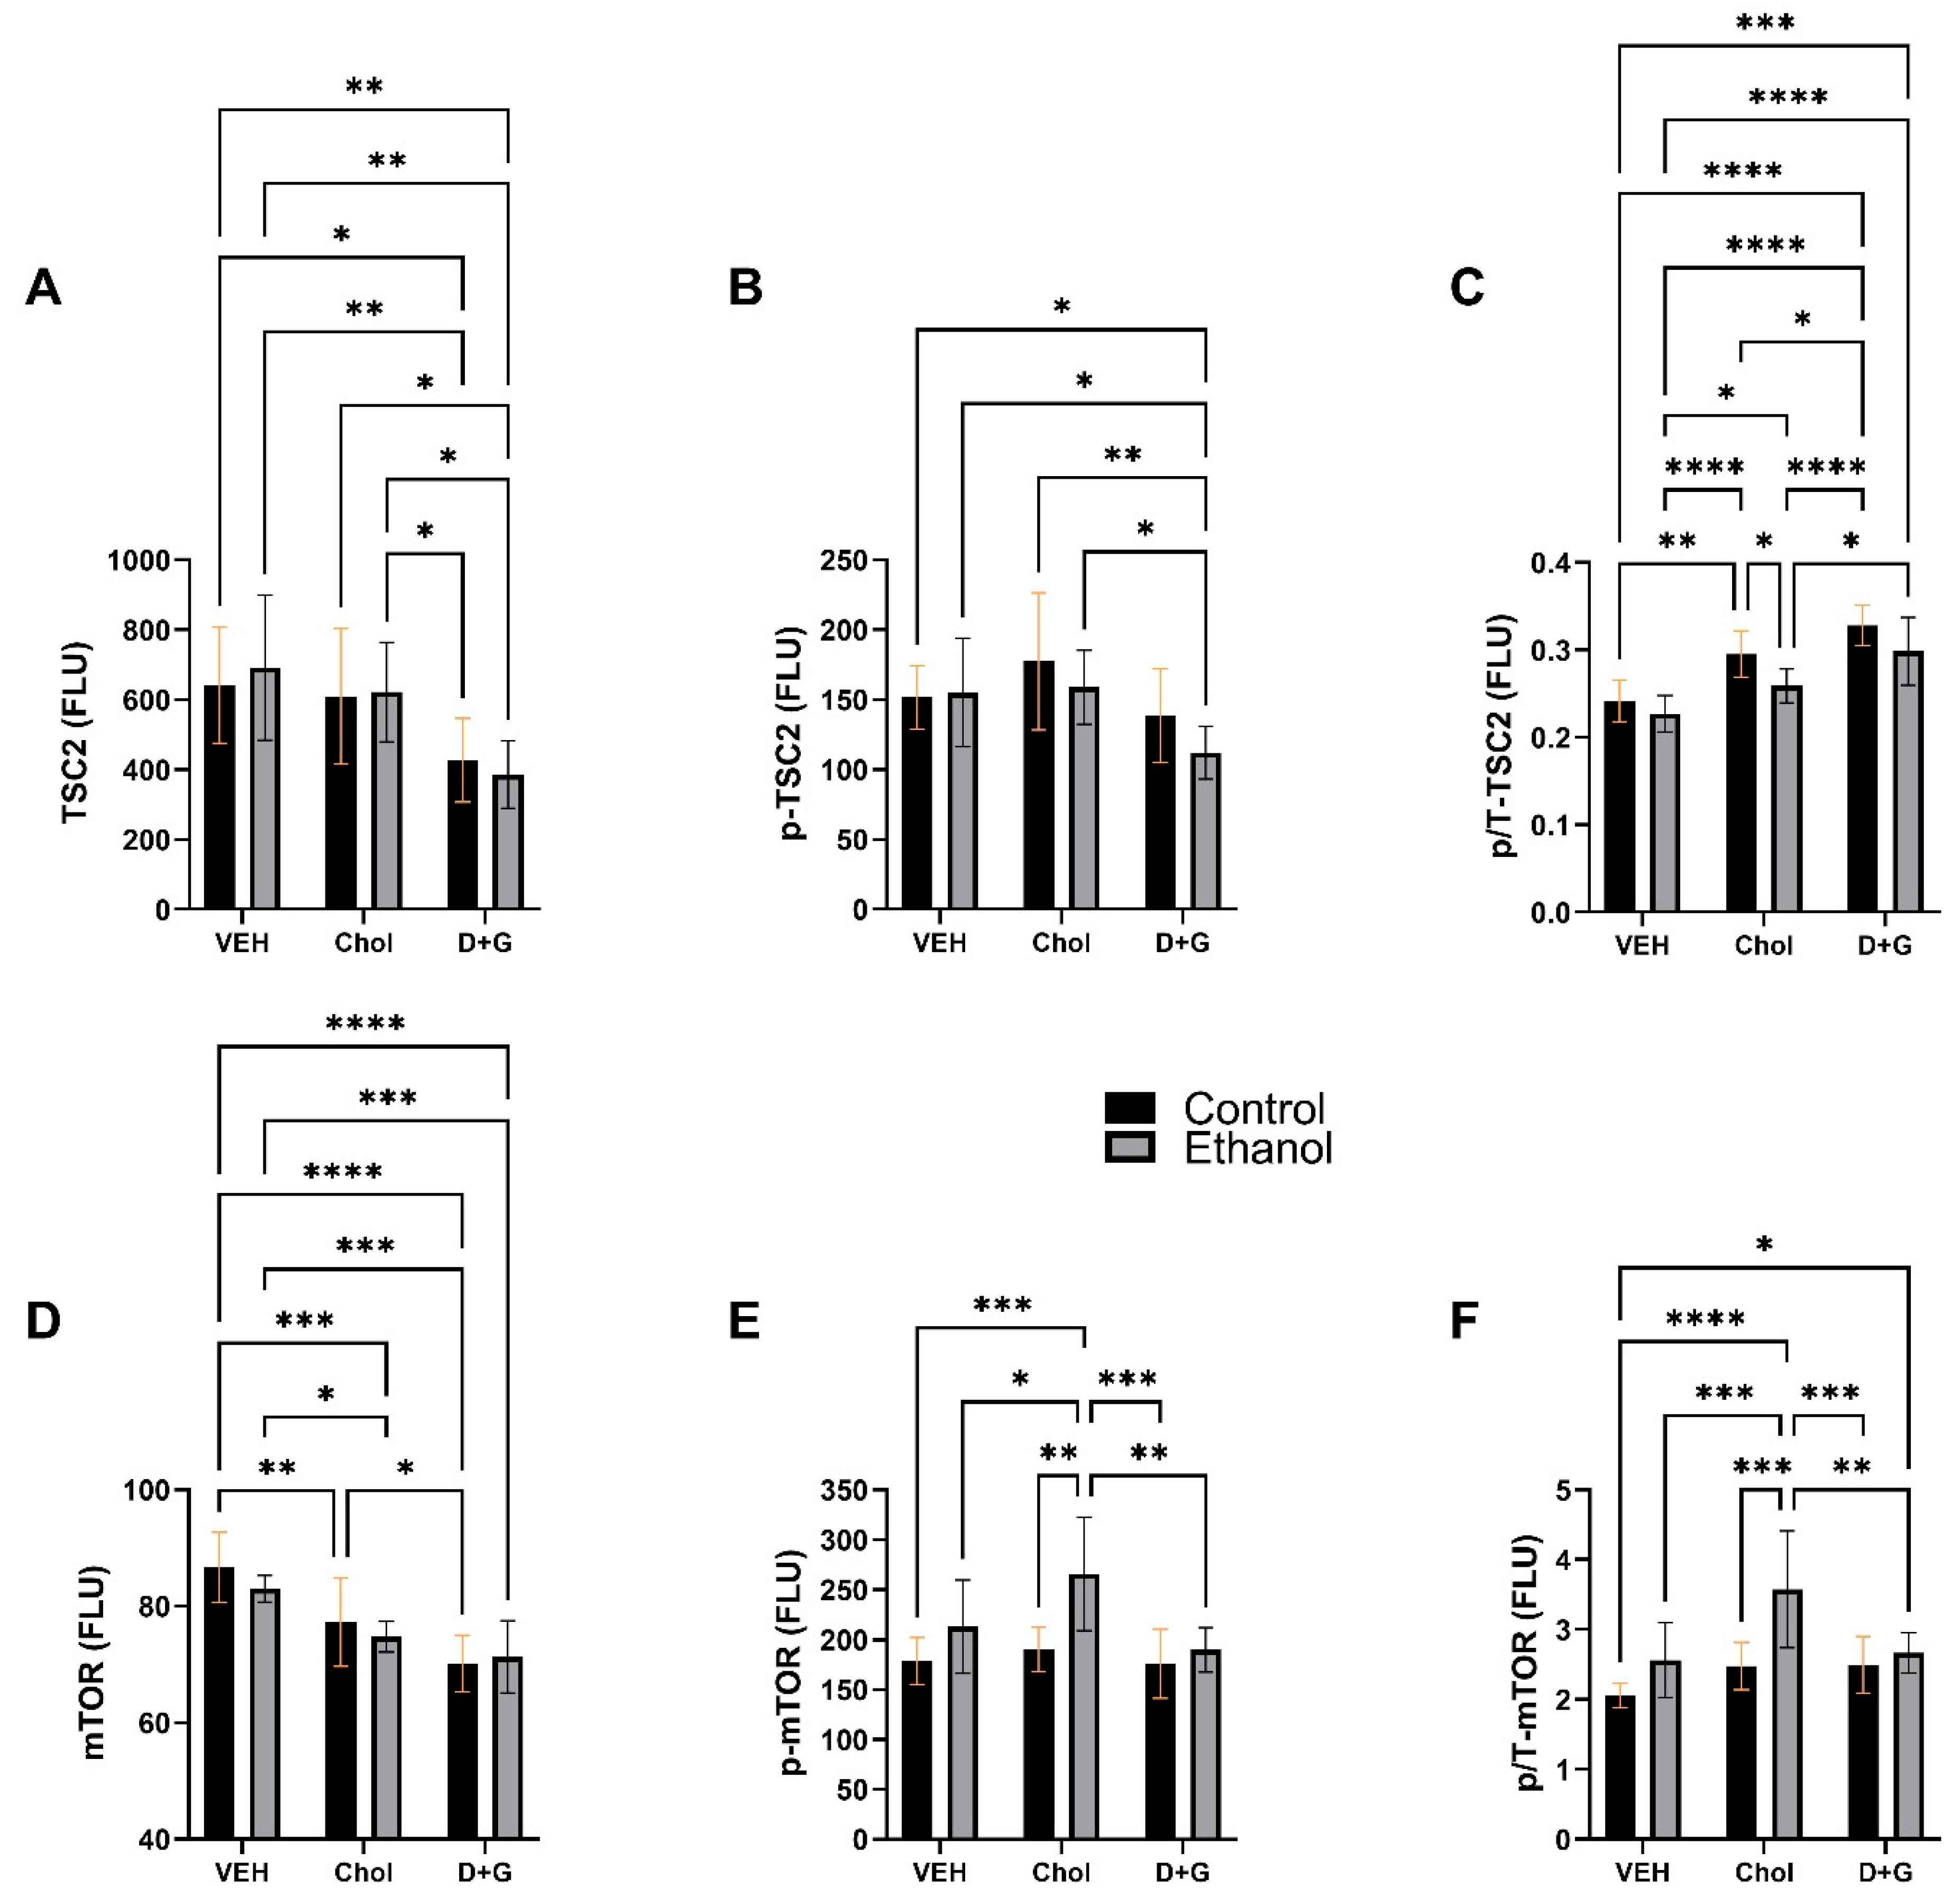
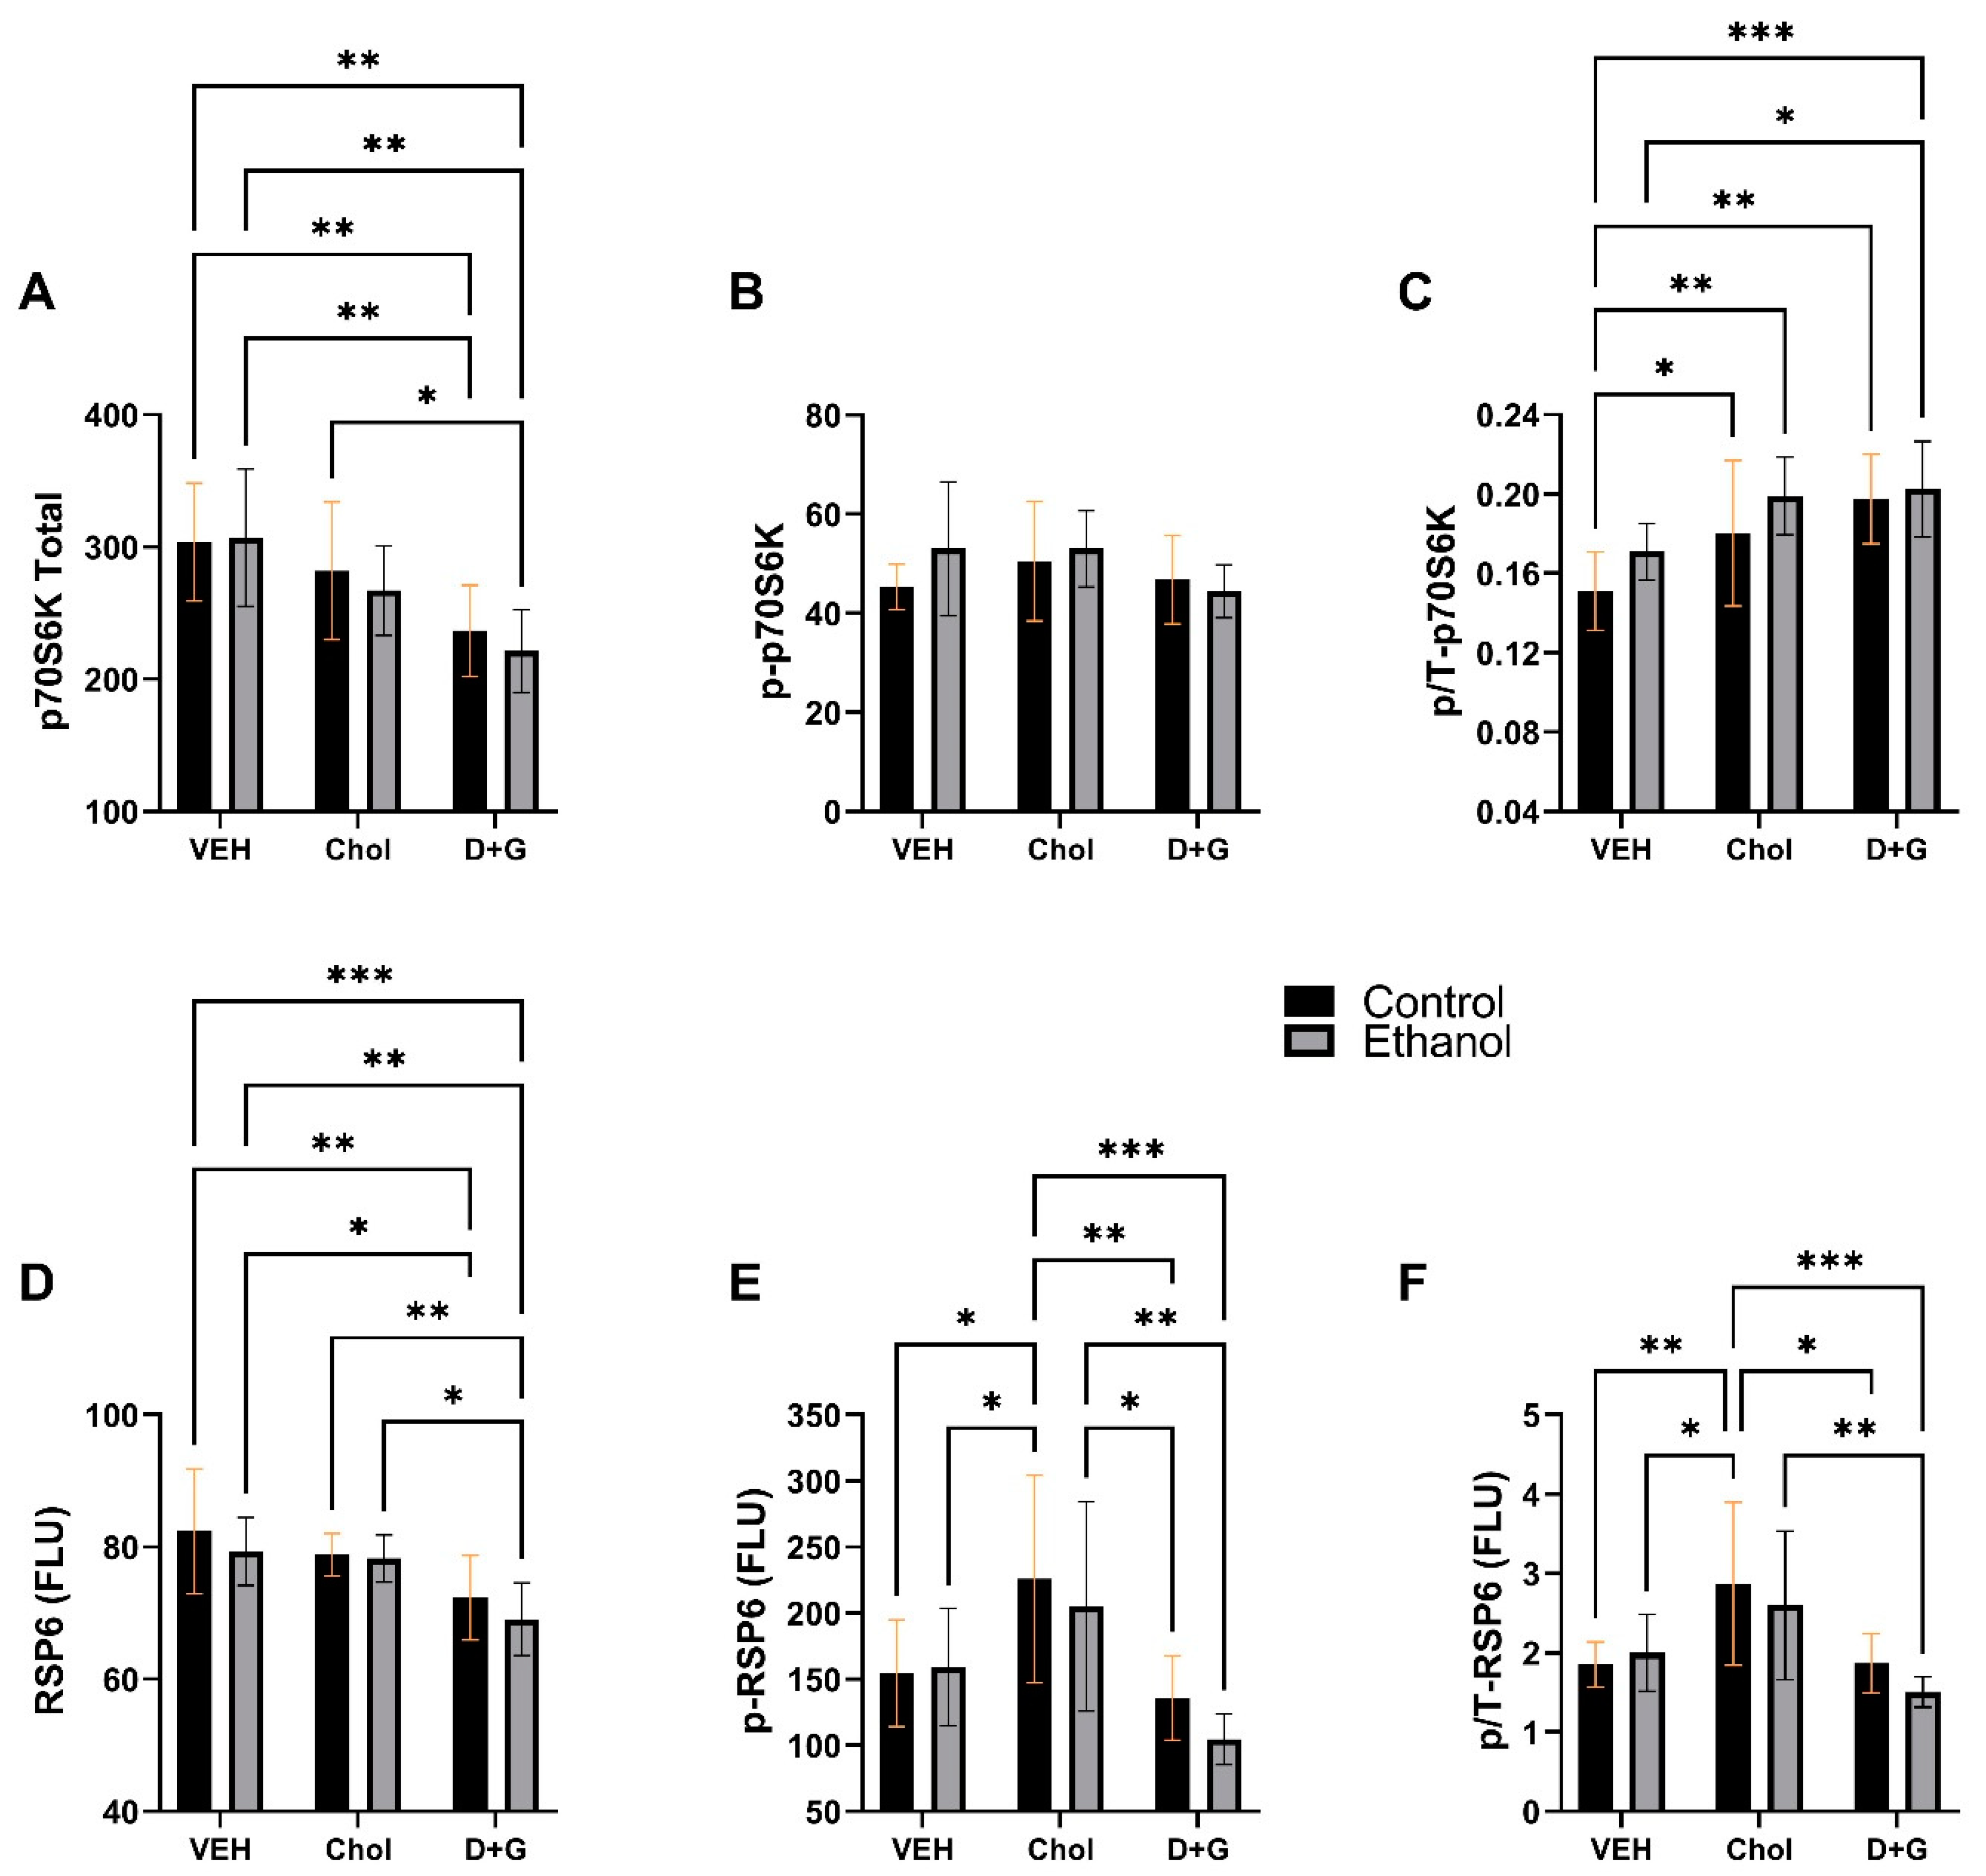
2.5. mTOR Pathway
3. Discussion
4. Summary
- Both Choline and D+G soy isoflavone treatments broadly impacted myelin protein expression, although their effects were non-identical and generally more robust for D+G than Choline.
- Choline and D+G treatments significantly affected both control and ethanol-exposed cultures.
- Ethanol-associated astrocyte activation (increased GFAP) was similarly suppressed by Choline and D+G soy isoflavones, but lipid peroxidation was more effectively dampened by D+G than Choline.
- D+G soy isoflavones enhanced signaling through both the insulin and IGF-1 receptors, whereas Choline significantly impacted IGF-1 and not insulin receptor tyrosine kinase signaling.
- Both the breadth and magnitude of enhanced Akt/mTOR signaling were greater with D+G than Choline relative to Vehicle.
- A unique effect of Choline was to significantly upregulate pS235/236-RPS6 and p/T-RPS6 relative to Veh and D+G, suggesting superior end results with respect to mTOR pathway activation via p70S6K.
5. Materials and Methods
5.1. Reagents and Resources
5.2. Experimental Model
5.3. Duplex ELISAs
5.4. Multiplex ELISAs
5.5. Statistics
6. Conclusions
- D+G soy isoflavones, without supplemental Choline, exerted superior support for oligodendrocyte myelin protein expression and inhibition of pro-inflammatory/oxidative stress mediators in immature frontal lobe tissue compared with Veh and Chol.
- Relative to Veh, the comparable levels of support afforded by Choline or D+G soy isoflavones in control versus ethanol-exposed cultures highlight their potential benefits for enhancing neurodevelopment independent of prenatal ethanol exposure, i.e., FASD.
- The aggregate results support the concept that FASD preventive or harm-reduction approaches should include encouraging the consumption of dietary soy, which is naturally rich in choline and, together with its isoflavones, would likely be more effective than Choline micronutrient supplementation.
- Alternatively, future approaches for FASD may include treatment with novel pharmaceutical isoflavones that are neuroprotective and support signaling pathways that promote neuroplasticity, including mTOR [149].
- A limitation of this study is its short-term design with data capture prior to the full development of FASD-associated cellular and molecular pathologies pertaining to impairments in myelin protein expression and insulin/IGF-1 signaling through Akt pathways. Follow-up experiments to compare long-term in vivo responses to soy protein isolate and choline in an FASD model will address this limitation.
Supplementary Materials
Author Contributions
Funding
Institutional Review Board Statement
Informed Consent Statement
Data Availability Statement
Conflicts of Interest
References
- Riley, E.P.; Infante, M.A.; Warren, K.R. Fetal alcohol spectrum disorders: An overview. Neuropsychol. Rev. 2011, 21, 73–80. [Google Scholar] [CrossRef] [PubMed]
- Riley, E.P.; McGee, C.L. Fetal alcohol spectrum disorders: An overview with emphasis on changes in brain and behavior. Exp. Biol. Med. 2005, 230, 357–365. [Google Scholar] [CrossRef] [PubMed]
- Del Campo, M.; Jones, K.L. A review of the physical features of the fetal alcohol spectrum disorders. Eur. J. Med. Genet. 2017, 60, 55–64. [Google Scholar] [CrossRef] [PubMed]
- Roozen, S.; Black, D.; Peters, G.Y.; Kok, G.; Townend, D.; Nijhuis, J.G.; Koek, G.H.; Curfs, L.M. Fetal Alcohol Spectrum Disorders (FASD): An Approach to Effective Prevention. Curr. Dev. Disord. Rep. 2016, 3, 229–234. [Google Scholar] [CrossRef]
- Lupton, C.; Burd, L.; Harwood, R. Cost of fetal alcohol spectrum disorders. Am. J. Med. Genet. C. Semin. Med. Genet. 2004, 127, 42–50. [Google Scholar] [CrossRef]
- Marquardt, K.; Brigman, J.L. The impact of prenatal alcohol exposure on social, cognitive and affective behavioral domains: Insights from rodent models. Alcohol 2016, 51, 1–15. [Google Scholar] [CrossRef]
- Murawski, N.J.; Moore, E.M.; Thomas, J.D.; Riley, E.P. Advances in Diagnosis and Treatment of Fetal Alcohol Spectrum Disorders: From Animal Models to Human Studies. Alcohol. Res. 2015, 37, 97–108. [Google Scholar]
- Reid, N.; Dawe, S.; Shelton, D.; Harnett, P.; Warner, J.; Armstrong, E.; LeGros, K.; O’Callaghan, F. Systematic Review of Fetal Alcohol Spectrum Disorder Interventions Across the Life Span. Alcohol. Clin. Exp. Res. 2015, 39, 2283–2295. [Google Scholar] [CrossRef]
- Roozen, S.; Peters, G.J.; Kok, G.; Townend, D.; Nijhuis, J.; Curfs, L. Worldwide Prevalence of Fetal Alcohol Spectrum Disorders: A Systematic Literature Review Including Meta-Analysis. Alcohol. Clin. Exp. Res. 2016, 40, 18–32. [Google Scholar] [CrossRef]
- Lange, S.; Probst, C.; Gmel, G.; Rehm, J.; Burd, L.; Popova, S. Global Prevalence of Fetal Alcohol Spectrum Disorder Among Children and Youth: A Systematic Review and Meta-analysis. JAMA Pediatr. 2017, 171, 948–956. [Google Scholar] [CrossRef]
- May, P.A.; Chambers, C.D.; Kalberg, W.O.; Zellner, J.; Feldman, H.; Buckley, D.; Kopald, D.; Hasken, J.M.; Xu, R.; Honerkamp-Smith, G.; et al. Prevalence of Fetal Alcohol Spectrum Disorders in 4 US Communities. JAMA J. Am. Med. Assoc. 2018, 319, 474–482. [Google Scholar] [CrossRef]
- de la Monte, S.M.; Kril, J.J. Human alcohol-related neuropathology. Acta Neuropathol. 2014, 127, 71–90. [Google Scholar] [CrossRef]
- Schmidt, K.S.; Gallo, J.L.; Ferri, C.; Giovannetti, T.; Sestito, N.; Libon, D.J.; Schmidt, P.S. The neuropsychological profile of alcohol-related dementia suggests cortical and subcortical pathology. Dement. Geriatr. Cogn. Disord. 2005, 20, 286–291. [Google Scholar] [CrossRef]
- Elofson, J.; Gongvatana, W.; Carey, K.B. Alcohol use and cerebral white matter compromise in adolescence. Addict. Behav. 2013, 38, 2295–2305. [Google Scholar] [CrossRef]
- Jacobus, J.; Squeglia, L.M.; Bava, S.; Tapert, S.F. White matter characterization of adolescent binge drinking with and without co-occurring marijuana use: A 3-year investigation. Psychiatry. Res. 2013, 214, 374–381. [Google Scholar] [CrossRef]
- Phillips, S.C.; Harper, C.G.; Kril, J. A quantitative histological study of the cerebellar vermis in alcoholic patients. Brain A J. Neurol. 1987, 110, 301–314. [Google Scholar] [CrossRef]
- de la Monte, S.M. Disproportionate atrophy of cerebral white matter in chronic alcoholics. Arch. Neurol. 1988, 45, 990–992. [Google Scholar] [CrossRef]
- Harper, C.G.; Smith, N.A.; Kril, J.J. The effects of alcohol on the female brain: A neuropathological study. Alcohol Alcohol. 1990, 25, 445–448. [Google Scholar]
- Sutherland, G.T.; Sheedy, D.; Kril, J.J. Neuropathology of alcoholism. Handb. Clin. Neurol. 2014, 125, 603–615. [Google Scholar] [CrossRef]
- Kril, J.J.; Gundlach, A.L.; Dodd, P.R.; Johnston, G.A.; Harper, C.G. Cortical dihydropyridine binding sites are unaltered in human alcoholic brain. Ann. Neurol. 1989, 26, 395–397. [Google Scholar] [CrossRef]
- Kril, J.J.; Halliday, G.M. Brain shrinkage in alcoholics: A decade on and what have we learned? Prog. Neurobiol. 1999, 58, 381–387. [Google Scholar] [CrossRef] [PubMed]
- Harper, C.G.; Kril, J.J.; Holloway, R.L. Brain shrinkage in chronic alcoholics: A pathological study. Br. Med. J. 1985, 290, 501–504. [Google Scholar] [CrossRef] [PubMed]
- Fontaine, C.J.; Patten, A.R.; Sickmann, H.M.; Helfer, J.L.; Christie, B.R. Effects of pre-natal alcohol exposure on hippocampal synaptic plasticity: Sex, age and methodological considerations. Neurosci. Biobehav. Rev. 2016, 64, 12–34. [Google Scholar] [CrossRef] [PubMed]
- Papp-Peka, A.; Tong, M.; Kril, J.J.; De La Monte, S.M.; Sutherland, G.T. The Differential Effects of Alcohol and Nicotine-Specific Nitrosamine Ketone on White Matter Ultrastructure. Alcohol Alcohol. 2017, 52, 165–171. [Google Scholar] [CrossRef]
- de la Monte, S.M.; Wands, J.R. Role of central nervous system insulin resistance in fetal alcohol spectrum disorders. J. Popul. Clin. Pharm. 2010, 17, e390–e404. [Google Scholar]
- Collins, M.A.; Tajuddin, N.; Moon, K.H.; Kim, H.Y.; Nixon, K.; Neafsey, E.J. Alcohol, phospholipase A2-associated neuroinflammation, and omega3 docosahexaenoic acid protection. Mol. Neurobiol. 2014, 50, 239–245. [Google Scholar] [CrossRef]
- Crews, F.T.; Nixon, K. Mechanisms of neurodegeneration and regeneration in alcoholism. Alcohol Alcohol. 2009, 44, 115–127. [Google Scholar] [CrossRef]
- Eysseric, H.; Gonthier, B.; Soubeyran, A.; Bessard, G.; Saxod, R.; Barret, L. Characterization of the production of acetaldehyde by astrocytes in culture after ethanol exposure. Alcohol. Clin. Exp. Res. 1997, 21, 1018–1023. [Google Scholar] [CrossRef]
- Melgaard, B. The neurotoxicity of ethanol. Acta Neurol. Scand. 1983, 67, 131–142. [Google Scholar] [CrossRef]
- Carter, J.J.; Tong, M.; Silbermann, E.; Lahousse, S.A.; Ding, F.F.; Longato, L.; Roper, N.; Wands, J.R.; de la Monte, S.M. Ethanol impaired neuronal migration is associated with reduced aspartyl-asparaginyl-beta-hydroxylase expression. Acta Neuropathol. 2008, 116, 303–315. [Google Scholar] [CrossRef]
- Cohen, A.C.; Tong, M.; Wands, J.R.; de la Monte, S.M. Insulin and insulin-like growth factor resistance with neurodegeneration in an adult chronic ethanol exposure model. Alcohol. Clin. Exp. Res. 2007, 31, 1558–1573. [Google Scholar] [CrossRef]
- de la Monte, S.M.; Ganju, N.; Banerjee, K.; Brown, N.V.; Luong, T.; Wands, J.R. Partial rescue of ethanol-induced neuronal apoptosis by growth factor activation of phosphoinositol-3-kinase. Alcohol. Clin. Exp. Res. 2000, 24, 716–726. [Google Scholar] [CrossRef]
- de la Monte, S.M.; Tong, M.; Bowling, N.; Moskal, P. si-RNA inhibition of brain insulin or insulin-like growth factor receptors causes developmental cerebellar abnormalities: Relevance to fetal alcohol spectrum disorder. Mol. Brain 2011, 4, 13. [Google Scholar] [CrossRef]
- de la Monte, S.M.; Tong, M.; Cohen, A.C.; Sheedy, D.; Harper, C.; Wands, J.R. Insulin and insulin-like growth factor resistance in alcoholic neurodegeneration. Alcohol. Clin. Exp. Res. 2008, 32, 1630–1644. [Google Scholar] [CrossRef]
- de la Monte, S.M.; Wands, J.R. Chronic gestational exposure to ethanol impairs insulin-stimulated survival and mitochondrial function in cerebellar neurons. Cell. Mol. Life. Sci. CMLS 2002, 59, 882–893. [Google Scholar] [CrossRef]
- de la Monte, S.M.; Xu, X.J.; Wands, J.R. Ethanol inhibits insulin expression and actions in the developing brain. Cell. Mol. Life. Sci. CMLS 2005, 62, 1131–1145. [Google Scholar] [CrossRef]
- Ewenczyk, A.; Ziplow, J.; Tong, M.; Le, T.; de la Monte, S.M. Sustained Impairments in Brain Insulin/IGF Signaling in Adolescent Rats Subjected to Binge Alcohol Exposures during Development. J. Clin. Exp. Pathol. 2012, 2, 106. [Google Scholar] [CrossRef]
- Nguyen, V.A.; Le, T.; Tong, M.; Silbermann, E.; Gundogan, F.; de la Monte, S.M. Impaired insulin/IGF signaling in experimental alcohol-related myopathy. Nutrients 2012, 4, 1058–1075. [Google Scholar] [CrossRef]
- Resnicoff, M.; Rubini, M.; Baserga, R.; Rubin, R. Ethanol inhibits insulin-like growth factor-1-mediated signalling and proliferation of C6 rat glioblastoma cells. Lab. Investig. 1994, 71, 657–662. [Google Scholar]
- Tong, M.; Yu, R.; Deochand, C.; de la Monte, S.M. Differential Contributions of Alcohol and the Nicotine-Derived Nitrosamine Ketone (NNK) to Insulin and Insulin-Like Growth Factor Resistance in the Adolescent Rat Brain. Alcohol Alcohol. 2015, 50, 670–679. [Google Scholar] [CrossRef]
- Xu, J.; Yeon, J.E.; Chang, H.; Tison, G.; Chen, G.J.; Wands, J.; de la Monte, S. Ethanol impairs insulin-stimulated neuronal survival in the developing brain: Role of PTEN phosphatase. J. Biol. Chem. 2003, 278, 26929–26937. [Google Scholar] [CrossRef] [PubMed]
- de la Monte, S.M.; Tong, M.; Carlson, R.I.; Carter, J.J.; Longato, L.; Silbermann, E.; Wands, J.R. Ethanol inhibition of aspartyl-asparaginyl-beta-hydroxylase in fetal alcohol spectrum disorder: Potential link to the impairments in central nervous system neuronal migration. Alcohol 2009, 43, 225–240. [Google Scholar] [CrossRef] [PubMed]
- Luo, J. Lithium-mediated protection against ethanol neurotoxicity. Front. Neurosci. 2010, 4, 41. [Google Scholar] [CrossRef] [PubMed]
- Jamal, M.; Ameno, K.; Miki, T.; Wang, W.; Kumihashi, M.; Isse, T.; Kawamoto, T.; Kitagawa, K.; Nakayama, K.; Ijiri, I.; et al. Cholinergic alterations following alcohol exposure in the frontal cortex of Aldh2-deficient mice models. Brain Res. 2009, 1295, 37–43. [Google Scholar] [CrossRef]
- Soscia, S.J.; Tong, M.; Xu, X.J.; Cohen, A.C.; Chu, J.; Wands, J.R.; de la Monte, S.M. Chronic gestational exposure to ethanol causes insulin and IGF resistance and impairs acetylcholine homeostasis in the brain. Cell. Mol. Life. Sci. CMLS 2006, 63, 2039–2056. [Google Scholar] [CrossRef]
- Bordner, K.A.; George, E.D.; Carlyle, B.C.; Duque, A.; Kitchen, R.R.; Lam, T.T.; Colangelo, C.M.; Stone, K.L.; Abbott, T.B.; Mane, S.M.; et al. Functional genomic and proteomic analysis reveals disruption of myelin-related genes and translation in a mouse model of early life neglect. Front. Psychiatry 2011, 2, 18. [Google Scholar] [CrossRef]
- Chiappelli, F.; Taylor, A.N.; Espinosa de los Monteros, A.; de Vellis, J. Fetal alcohol delays the developmental expression of myelin basic protein and transferrin in rat primary oligodendrocyte cultures. Int. J. Dev. Neurosci. Off. J. Int. Soc. Dev. Neurosci. 1991, 9, 67–75. [Google Scholar] [CrossRef]
- Lewohl, J.M.; Wixey, J.; Harper, C.G.; Dodd, P.R. Expression of MBP, PLP, MAG, CNP, and GFAP in the Human Alcoholic Brain. Alcohol. Clin. Exp. Res. 2005, 29, 1698–1705. [Google Scholar] [CrossRef]
- Tong, M.; Yu, R.; Silbermann, E.; Zabala, V.; Deochand, C.; de la Monte, S.M. Differential Contributions of Alcohol and Nicotine-Derived Nitrosamine Ketone (NNK) to White Matter Pathology in the Adolescent Rat Brain. Alcohol Alcohol. 2015, 50, 680–689. [Google Scholar] [CrossRef]
- Harper, C.; Dixon, G.; Sheedy, D.; Garrick, T. Neuropathological alterations in alcoholic brains. Studies arising from the New South Wales Tissue Resource Centre. Prog. Neuropsychopharmacol. Biol. Psychiatry 2003, 27, 951–961. [Google Scholar] [CrossRef]
- Monnig, M.A.; Tonigan, J.S.; Yeo, R.A.; Thoma, R.J.; McCrady, B.S. White matter volume in alcohol use disorders: A meta-analysis. Addict. Biol. 2013, 18, 581–592. [Google Scholar] [CrossRef]
- Creeley, C.E.; Dikranian, K.T.; Johnson, S.A.; Farber, N.B.; Olney, J.W. Alcohol-induced apoptosis of oligodendrocytes in the fetal macaque brain. Acta Neuropathol. Commun. 2013, 1, 23. [Google Scholar] [CrossRef]
- Homans, C.; Yalcin, E.B.; Tong, M.; Gallucci, G.; Bautista, D.; Moriel, N.; Monte, S.d.l. Therapeutic Effects of Myriocin in Experimental Alcohol-Related Neurobehavioral Dysfunction and Frontal Lobe White Matter Biochemical Pathology. J. Behav. Brain Sci. 2022, 12, 23–42. [Google Scholar] [CrossRef]
- Yalcin, E.B.; McLean, T.; Tong, M.; de la Monte, S.M. Progressive white matter atrophy with altered lipid profiles is partially reversed by short-term abstinence in an experimental model of alcohol-related neurodegeneration. Alcohol 2017, 65, 51–62. [Google Scholar] [CrossRef]
- Yalcin, E.B.; Nunez, K.; Tong, M.; de la Monte, S.M. Differential Sphingolipid and Phospholipid Profiles in Alcohol and Nicotine-Derived Nitrosamine Ketone-Associated White Matter Degeneration. Alcohol. Clin. Exp. Res. 2015, 39, 2324–2333. [Google Scholar] [CrossRef]
- Roux, A.; Muller, L.; Jackson, S.N.; Baldwin, K.; Womack, V.; Pagiazitis, J.G.; O’Rourke, J.R.; Thanos, P.K.; Balaban, C.; Schultz, J.A.; et al. Chronic ethanol consumption profoundly alters regional brain ceramide and sphingomyelin content in rodents. ACS Chem. Neurosci. 2015, 6, 247–259. [Google Scholar] [CrossRef]
- Tong, M.; Gonzalez-Navarrete, H.; Kirchberg, T.; Gotama, B.; Yalcin, E.B.; Kay, J.; de la Monte, S.M. Ethanol-Induced White Matter Atrophy Is Associated with Impaired Expression of Aspartyl-Asparaginyl-beta-Hydroxylase (ASPH) and Notch Signaling in an Experimental Rat Model. J. Drug. Alcohol. Res. 2017, 6, 236033. [Google Scholar] [CrossRef]
- Gilde, A.J.; Van Bilsen, M. Peroxisome proliferator-activated receptors (PPARS): Regulators of gene expression in heart and skeletal muscle. Acta Physiol. Scand. 2003, 178, 425–434. [Google Scholar] [CrossRef]
- Lee, C.H.; Olson, P.; Evans, R.M. Minireview: Lipid metabolism, metabolic diseases, and peroxisome proliferator-activated receptors. Endocrinology 2003, 144, 2201–2207. [Google Scholar] [CrossRef]
- Jiang, G.; Zhang, B.B. Modulation of insulin signalling by insulin sensitizers. Biochem. Soc. Trans. 2005, 33, 358–361. [Google Scholar] [CrossRef]
- Le, T.; Tong, M.; Nguyen, V.; de la Monte, S.M. PPAR Agonist Rescue of Ethanol-Impaired Brain Insulin Signaling: Cerebellar Slice Culture Model. J. Drug. Alcohol. Res. 2013, 2, 235611. [Google Scholar] [CrossRef]
- de la Monte, S.M.; Pang, M.; Chaudhry, R.; Duan, K.; Longato, L.; Carter, J.; Ouh, J.; Wands, J.R. Peroxisome proliferator-activated receptor agonist treatment of alcohol-induced hepatic insulin resistance. Hepatol. Res. Off. J. Jpn. Soc. Hepatol. 2011, 41, 386–398. [Google Scholar] [CrossRef] [PubMed]
- Wagner, J.D.; Zhang, L.; Shadoan, M.K.; Kavanagh, K.; Chen, H.; Tresnasari, K.; Kaplan, J.R.; Adams, M.R. Effects of soy protein and isoflavones on insulin resistance and adiponectin in male monkeys. Metab. Clin. Exp. 2008, 57, S24–S31. [Google Scholar] [CrossRef]
- Bonacasa, B.; Siow, R.C.; Mann, G.E. Impact of dietary soy isoflavones in pregnancy on fetal programming of endothelial function in offspring. Microcirculation 2011, 18, 270–285. [Google Scholar] [CrossRef] [PubMed]
- Clark, J.L.; Taylor, C.G.; Zahradka, P. Rebelling against the (Insulin) Resistance: A Review of the Proposed Insulin-Sensitizing Actions of Soybeans, Chickpeas, and Their Bioactive Compounds. Nutrients 2018, 10, 434. [Google Scholar] [CrossRef]
- Hassan, S.M. Soybean, Nutrition and Health. In Soybean—Bio-Active Compounds; El-Shemy, H.A., Ed.; IntechOpen: London, UK, 2013. [Google Scholar]
- Heo, G.; Ko, K.S. Long-Term Feeding of Soy Protein Attenuates Choline Deficient-Induced Adverse Effects in Wild Type Mice and Prohibitin 1 Deficient Mice Response More Sensitively. Prev. Nutr. Food Sci. 2019, 24, 32–40. [Google Scholar] [CrossRef]
- Tovar, A.R.; Torre-Villalvazo, I.; Ochoa, M.; Elias, A.L.; Ortiz, V.; Aguilar-Salinas, C.A.; Torres, N. Soy protein reduces hepatic lipotoxicity in hyperinsulinemic obese Zucker fa/fa rats. J. Lipid. Res. 2005, 46, 1823–1832. [Google Scholar] [CrossRef]
- Kim, M.H.; Kang, K.S. Isoflavones as a smart curer for non-alcoholic fatty liver disease and pathological adiposity via ChREBP and Wnt signaling. Prev. Med. 2011, 54, S57–S63. [Google Scholar] [CrossRef]
- Tong, M.; Ziplow, J.L.; Mark, P.; de la Monte, S.M. Dietary Soy Prevents Alcohol-Mediated Neurocognitive Dysfunction and Associated Impairments in Brain Insulin Pathway Signaling in an Adolescent Rat Model. Biomolecules 2022, 12, 676. [Google Scholar] [CrossRef]
- Qi, W.; Gundogan, F.; Gilligan, J.; de la Monte, S.M. Dietary Soy Prevents Fetal Demise, Intrauterine Growth Restriction, Craniofacial Dysmorphic Features, and Impairments in Placentation Linked to Gestational Alcohol Exposure: Pivotal Role of Insulin and Insulin-Like Growth Factor Signaling Networks. Alcohol, 2023; in press. [Google Scholar] [CrossRef]
- Zeisel, S.H.; da Costa, K.A. Choline: An essential nutrient for public health. Nutr. Rev. 2009, 67, 615–623. [Google Scholar] [CrossRef]
- Ryan, S.H.; Williams, J.K.; Thomas, J.D. Choline supplementation attenuates learning deficits associated with neonatal alcohol exposure in the rat: Effects of varying the timing of choline administration. Brain Res. 2008, 1237, 91–100. [Google Scholar] [CrossRef]
- Thomas, J.D.; Biane, J.S.; O’Bryan, K.A.; O’Neill, T.M.; Dominguez, H.D. Choline supplementation following third-trimester-equivalent alcohol exposure attenuates behavioral alterations in rats. Behav. Neurosci. 2007, 121, 120–130. [Google Scholar] [CrossRef]
- Thomas, J.D.; Idrus, N.M.; Monk, B.R.; Dominguez, H.D. Prenatal choline supplementation mitigates behavioral alterations associated with prenatal alcohol exposure in rats. Birth. Defects. Res. Part A Clin. Mol. Teratol. 2010, 88, 827–837. [Google Scholar] [CrossRef]
- Wozniak, J.R.; Fink, B.A.; Fuglestad, A.J.; Eckerle, J.K.; Boys, C.J.; Sandness, K.E.; Radke, J.P.; Miller, N.C.; Lindgren, C.; Brearley, A.M.; et al. Four-year follow-up of a randomized controlled trial of choline for neurodevelopment in fetal alcohol spectrum disorder. J. Neurodev. Disord. 2020, 12, 9. [Google Scholar] [CrossRef]
- Wozniak, J.R.; Fuglestad, A.J.; Eckerle, J.K.; Kroupina, M.G.; Miller, N.C.; Boys, C.J.; Brearley, A.M.; Fink, B.A.; Hoecker, H.L.; Zeisel, S.H.; et al. Choline supplementation in children with fetal alcohol spectrum disorders has high feasibility and tolerability. Nutr. Res. 2013, 33, 897–904. [Google Scholar] [CrossRef]
- Jeltsch, H.; Cassel, J.C.; Jackisch, R.; Neufang, B.; Greene, P.L.; Kelche, C.; Hertting, G.; Will, B. Lesions of supracallosal or infracallosal hippocampal pathways in the rat: Behavioral, neurochemical, and histochemical effects. Behav. Neural. Biol. 1994, 62, 121–133. [Google Scholar] [CrossRef]
- Blusztajn, J.K.; Slack, B.E.; Mellott, T.J. Neuroprotective Actions of Dietary Choline. Nutrients 2017, 9, 815. [Google Scholar] [CrossRef]
- Grafe, E.L.; Fontaine, C.J.; Thomas, J.D.; Christie, B.R. Effects of prenatal ethanol exposure on choline-induced long-term depression in the hippocampus. J. Neurophysiol. 2021, 126, 1622–1634. [Google Scholar] [CrossRef]
- Fructuoso, I.; Romao, B.; Han, H.; Raposo, A.; Ariza-Montes, A.; Araya-Castillo, L.; Zandonadi, R.P. An Overview on Nutritional Aspects of Plant-Based Beverages Used as Substitutes for Cow’s Milk. Nutrients 2021, 13, 2650. [Google Scholar] [CrossRef]
- Delmonte, P.; Rader, J.I. Analysis of isoflavones in foods and dietary supplements. J. AOAC Int. 2006, 89, 1138–1146. [Google Scholar] [CrossRef] [PubMed]
- Krizova, L.; Dadakova, K.; Kasparovska, J.; Kasparovsky, T. Isoflavones. Molecules 2019, 24, 1076. [Google Scholar] [CrossRef]
- Patterson, K.Y.; Bhagwat, S.A.; Williams, J.R.; Howe, J.C.; Holden, J.M.; Zeisel, S.H.; Dacosta, K.A.; Mar, M.-H. USDA Database for the Choline Content of Common Foods. Release 2. Food Data. Cent. 2008, 1–36. [Google Scholar] [CrossRef]
- Brunst, K.J.; Wright, R.O.; DiGioia, K.; Enlow, M.B.; Fernandez, H.; Wright, R.J.; Kannan, S. Racial/ethnic and sociodemographic factors associated with micronutrient intakes and inadequacies among pregnant women in an urban US population. Public Health. Nutr. 2014, 17, 1960–1970. [Google Scholar] [CrossRef] [PubMed]
- Lee, Y.B.; Lee, H.J.; Won, M.H.; Hwang, I.K.; Kang, T.C.; Lee, J.Y.; Nam, S.Y.; Kim, K.S.; Kim, E.; Cheon, S.H.; et al. Soy isoflavones improve spatial delayed matching-to-place performance and reduce cholinergic neuron loss in elderly male rats. J. Nutr. 2004, 134, 1827–1831. [Google Scholar] [CrossRef]
- Andreani, T.; Tong, M.; Gundogan, F.; Silbermann, E.; de la Monte, S.M. Differential Effects of 3rd Trimester-Equivalent Binge Ethanol and Tobacco-Specific Nitrosamine Ketone Exposures on Brain Insulin Signaling in Adolescence. J. Diabetes Relat. Disord. 2016, 1, 105–114. [Google Scholar]
- Lindholm, S.; Rosin, A.; Dahlin, I.; Georgieva, J.; Franck, J. Ethanol administration potentiates cocaine-induced dopamine levels in the rat nucleus accumbens. Brain Res. 2001, 915, 176–184. [Google Scholar] [CrossRef]
- Bake, S.; Tingling, J.D.; Miranda, R.C. Ethanol exposure during pregnancy persistently attenuates cranially directed blood flow in the developing fetus: Evidence from ultrasound imaging in a murine second trimester equivalent model. Alcohol. Clin. Exp. Res. 2012, 36, 748–758. [Google Scholar] [CrossRef]
- White, S.A.; Weber, J.N.; Howard, C.D.; Favero, C.B. Effects of binge ethanol exposure during first-trimester equivalent on corticothalamic neurons in Swiss Webster outbred mice. Neuroreport 2015, 26, 1083–1088. [Google Scholar] [CrossRef]
- Quarles, R.H.; Macklin, W.B.; Morell, P. Myelin Formation, Structure and Biochemistry, 6th ed.; Siegel, G.J., Ed.; Elsevier: Philadelphia, PA, USA, 2006. [Google Scholar]
- Tong, M.; Andreani, T.; Krotow, A.; Gundogan, F.; de la Monte, S.M. Potential Contributions of the Tobacco Nicotine-Derived Nitrosamine Ketone to White Matter Molecular Pathology in Fetal Alcohol Spectrum Disorder. J. Neurol. Brain Dis. 2016, 3, 1–12. [Google Scholar] [CrossRef]
- Pronker, M.F.; Lemstra, S.; Snijder, J.; Heck, A.J.; Thies-Weesie, D.M.; Pasterkamp, R.J.; Janssen, B.J. Structural basis of myelin-associated glycoprotein adhesion and signalling. Nat. Commun. 2016, 7, 13584. [Google Scholar] [CrossRef]
- Quarles, R.H. Myelin-associated glycoprotein (MAG): Past, present and beyond. J. Neurochem. 2007, 100, 1431–1448. [Google Scholar] [CrossRef]
- Johns, T.G.; Bernard, C.C. The structure and function of myelin oligodendrocyte glycoprotein. J. Neurochem. 1999, 72, 1–9. [Google Scholar] [CrossRef]
- Stapulionis, R.; Oliveira, C.L.; Gjelstrup, M.C.; Pedersen, J.S.; Hokland, M.E.; Hoffmann, S.V.; Poulsen, K.; Jacobsen, C.; Vorup-Jensen, T. Structural insight into the function of myelin basic protein as a ligand for integrin alpha M beta 2. J. Immunol. 2008, 180, 3946–3956. [Google Scholar] [CrossRef]
- Nadon, N.L.; West, M. Myelin proteolipid protein: Function in myelin structure is distinct from its role in oligodendrocyte development. Dev. Neurosci. 1998, 20, 533–539. [Google Scholar] [CrossRef]
- Cardona, H.J.; Somasundaram, A.; Crabtree, D.M.; Gadd, S.L.; Becher, O.J. Prenatal overexpression of platelet-derived growth factor receptor A results in central nervous system hypomyelination. Brain Behav. 2021, 11, e2332. [Google Scholar] [CrossRef]
- Funa, K.; Sasahara, M. The roles of PDGF in development and during neurogenesis in the normal and diseased nervous system. J. Neuroimmune Pharmacol. Off. J. Soc. NeuroImmune Pharmacol. 2014, 9, 168–181. [Google Scholar] [CrossRef]
- Ryckman, A.E.; Brockhausen, I.; Walia, J.S. Metabolism of Glycosphingolipids and Their Role in the Pathophysiology of Lysosomal Storage Disorders. Int. J. Mol. Sci. 2020, 21, 6881. [Google Scholar] [CrossRef]
- Yang, Z.; Wang, K.K. Glial fibrillary acidic protein: From intermediate filament assembly and gliosis to neurobiomarker. Trends Neurosci. 2015, 38, 364–374. [Google Scholar] [CrossRef]
- Turker, F.; Cook, E.K.; Margolis, S.S. The proteasome and its role in the nervous system. Cell Chem. Biol. 2021, 28, 903–917. [Google Scholar] [CrossRef]
- Korkmaz, K.S.; Debelec Butuner, B.; Roggenbuck, D. Detection of 8-OHdG as a diagnostic biomarker. J. Lab. Precis. Med. 2018, 3, 95. [Google Scholar] [CrossRef]
- Ock, C.Y.; Kim, E.H.; Choi, D.J.; Lee, H.J.; Hahm, K.B.; Chung, M.H. 8-Hydroxydeoxyguanosine: Not mere biomarker for oxidative stress, but remedy for oxidative stress-implicated gastrointestinal diseases. World. J. Gastroenterol. 2012, 18, 302–308. [Google Scholar] [CrossRef] [PubMed]
- Dalleau, S.; Baradat, M.; Gueraud, F.; Huc, L. Cell death and diseases related to oxidative stress: 4-hydroxynonenal (HNE) in the balance. Cell Death. Differ. 2013, 20, 1615–1630. [Google Scholar] [CrossRef]
- Myers, M.G., Jr.; Sun, X.J.; White, M.F. The IRS-1 signaling system. Trends Biochem. Sci. 1994, 19, 289–293. [Google Scholar] [CrossRef] [PubMed]
- Schmitz-Peiffer, C.; Whitehead, J.P. IRS-1 regulation in health and disease. IUBMB Life 2003, 55, 367–374. [Google Scholar] [CrossRef] [PubMed]
- White, M.F. IRS proteins and the common path to diabetes. Am. J. Physiol. Endocrinol. Metab. 2002, 283, E413–E422. [Google Scholar] [CrossRef]
- de la Monte, S.M.; Wands, J.R. Review of insulin and insulin-like growth factor expression, signaling, and malfunction in the central nervous system: Relevance to Alzheimer’s disease. J. Alzheimer’s Dis. JAD 2005, 7, 45–61. [Google Scholar] [CrossRef]
- Dudek, H.; Datta, S.R.; Franke, T.F.; Birnbaum, M.J.; Yao, R.; Cooper, G.M.; Segal, R.A.; Kaplan, D.R.; Greenberg, M.E. Regulation of neuronal survival by the serine-threonine protein kinase Akt [see comments]. Science 1997, 275, 661–665. [Google Scholar] [CrossRef]
- Yoon, M.S. The Role of Mammalian Target of Rapamycin (mTOR) in Insulin Signaling. Nutrients 2017, 9, 1176. [Google Scholar] [CrossRef]
- Cai, S.L.; Tee, A.R.; Short, J.D.; Bergeron, J.M.; Kim, J.; Shen, J.; Guo, R.; Johnson, C.L.; Kiguchi, K.; Walker, C.L. Activity of TSC2 is inhibited by AKT-mediated phosphorylation and membrane partitioning. J. Cell Biol. 2006, 173, 279–289. [Google Scholar] [CrossRef]
- Rosner, M.; Hengstschlager, M. Cytoplasmic and nuclear distribution of the protein complexes mTORC1 and mTORC2: Rapamycin triggers dephosphorylation and delocalization of the mTORC2 components rictor and sin1. Hum. Mol. Genet. 2008, 17, 2934–2948. [Google Scholar] [CrossRef]
- Hers, I.; Vincent, E.E.; Tavare, J.M. Akt signalling in health and disease. Cell Signal. 2011, 23, 1515–1527. [Google Scholar] [CrossRef]
- Pearl, L.H.; Barford, D. Regulation of protein kinases in insulin, growth factor and Wnt signalling. Curr. Opin. Struct. Biol. 2002, 12, 761–767. [Google Scholar] [CrossRef]
- Skelton, P.D.; Stan, R.V.; Luikart, B.W. The Role of PTEN in Neurodevelopment. Mol. Neuropsychiatry 2020, 5, 60–71. [Google Scholar] [CrossRef]
- van Diepen, M.T.; Eickholt, B.J. Function of PTEN during the formation and maintenance of neuronal circuits in the brain. Dev. Neurosci. 2008, 30, 59–64. [Google Scholar] [CrossRef]
- Hermida, M.A.; Dinesh Kumar, J.; Leslie, N.R. GSK3 and its interactions with the PI3K/AKT/mTOR signalling network. Adv. Biol. Regul. 2017, 65, 5–15. [Google Scholar] [CrossRef]
- Vazquez, F.; Grossman, S.R.; Takahashi, Y.; Rokas, M.V.; Nakamura, N.; Sellers, W.R. Phosphorylation of the PTEN tail acts as an inhibitory switch by preventing its recruitment into a protein complex. J. Biol. Chem. 2001, 276, 48627–48630. [Google Scholar] [CrossRef]
- Vazquez, F.; Ramaswamy, S.; Nakamura, N.; Sellers, W.R. Phosphorylation of the PTEN tail regulates protein stability and function. Mol. Cell. Biol. 2000, 20, 5010–5018. [Google Scholar] [CrossRef]
- Gulen, M.F.; Bulek, K.; Xiao, H.; Yu, M.; Gao, J.; Sun, L.; Beurel, E.; Kaidanovich-Beilin, O.; Fox, P.L.; DiCorleto, P.E.; et al. Inactivation of the enzyme GSK3alpha by the kinase IKKi promotes AKT-mTOR signaling pathway that mediates interleukin-1-induced Th17 cell maintenance. Immunity 2012, 37, 800–812. [Google Scholar] [CrossRef]
- Tian, T.; Li, X.; Zhang, J. mTOR Signaling in Cancer and mTOR Inhibitors in Solid Tumor Targeting Therapy. Int. J. Mol. Sci. 2019, 20, 755. [Google Scholar] [CrossRef]
- Inoki, K.; Li, Y.; Zhu, T.; Wu, J.; Guan, K.L. TSC2 is phosphorylated and inhibited by Akt and suppresses mTOR signalling. Nat. Cell Biol. 2002, 4, 648–657. [Google Scholar] [CrossRef] [PubMed]
- Orlova, K.A.; Crino, P.B. The tuberous sclerosis complex. Ann. N. Y. Acad. Sci. 2010, 1184, 87–105. [Google Scholar] [CrossRef] [PubMed]
- Chiang, G.G.; Abraham, R.T. Phosphorylation of mammalian target of rapamycin (mTOR) at Ser-2448 is mediated by p70S6 kinase. J. Biol. Chem. 2005, 280, 25485. [Google Scholar] [CrossRef] [PubMed]
- Copp, J.; Manning, G.; Hunter, T. TORC-specific phosphorylation of mammalian target of rapamycin (mTOR): Phospho-Ser2481 is a marker for intact mTOR signaling complex 2. Cancer Res. 2009, 69, 1821–1827. [Google Scholar] [CrossRef]
- Rosner, M.; Siegel, N.; Valli, A.; Fuchs, C.; Hengstschlager, M. mTOR phosphorylated at S2448 binds to raptor and rictor. Amino. Acids. 2010, 38, 223–228. [Google Scholar] [CrossRef]
- Harada, H.; Andersen, J.S.; Mann, M.; Terada, N.; Korsmeyer, S.J. p70S6 kinase signals cell survival as well as growth, inactivating the pro-apoptotic molecule BAD. Proc. Natl. Acad. Sci. USA 2001, 98, 9666–9670. [Google Scholar] [CrossRef]
- Kyriakis, J.M.; Avruch, J. Insulin and Growth Factor Signaling Pathways. In Endocrinology; Jameson, J.L., De Groot, L.J., Eds.; W.B. Saunders: Philadelphia, PA, USA, 2010; Volume 1, pp. 38–82. [Google Scholar]
- Biever, A.; Valjent, E.; Puighermanal, E. Ribosomal Protein S6 Phosphorylation in the Nervous System: From Regulation to Function. Front. Mol. Neurosci. 2015, 8, 75. [Google Scholar] [CrossRef]
- Zeisel, S.H. Choline: An important nutrient in brain development, liver function and carcinogenesis. J. Am. Coll. Nutr. 1992, 11, 473–481. [Google Scholar] [CrossRef]
- Phillis, J.W. Acetylcholine release from the central nervous system: A 50-year retrospective. Crit. Rev. Neurobiol. 2005, 17, 161–217. [Google Scholar] [CrossRef]
- Secades, J.J.; Frontera, G. CDP-choline: Pharmacological and clinical review. Methods Find. Exp. Clin. Pharm. 1995, 17 (Suppl. B), 1–54. [Google Scholar]
- Gossell-Williams, M.; Benjamin, J. Choline: Are our university students eating enough? West Indian Med. J. 2006, 55, 197–199. [Google Scholar] [CrossRef]
- Bernhard, W.; Full, A.; Arand, J.; Maas, C.; Poets, C.F.; Franz, A.R. Choline supply of preterm infants: Assessment of dietary intake and pathophysiological considerations. Eur. J. Nutr. 2013, 52, 1269–1278. [Google Scholar] [CrossRef]
- Zhang, J.; Song, P.K.; Zhao, L.Y.; Sun, Y.; Yu, K.; Yin, J.; Pang, S.J.; Liu, Z.; Man, Q.Q.; He, L.; et al. Malnutrition in Relation with Dietary, Geographical, and Socioeconomic Factors among Older Chinese. Biomed. Environ. Sci. BES 2021, 34, 337–347. [Google Scholar] [CrossRef]
- Tong, M.; Dominguez, C.; Didsbury, J.; de la Monte, S.M. Targeting Alzheimer’s Disease Neuro-Metabolic Dysfunction with a Small Molecule Nuclear Receptor Agonist (T3D-959) Reverses Disease Pathologies. J. Alzheimers Dis. Park. 2016, 6, 238. [Google Scholar] [CrossRef]
- de la Monte, S.M.; Tong, M.; Lester-Coll, N.; Plater, M., Jr.; Wands, J.R. Therapeutic rescue of neurodegeneration in experimental type 3 diabetes: Relevance to Alzheimer’s disease. J. Alzheimer’s Dis. JAD 2006, 10, 89–109. [Google Scholar] [CrossRef]
- de la Monte, S.M.; Tong, M.; Schiano, I.; Didsbury, J. Improved Brain Insulin/IGF Signaling and Reduced Neuroinflammation with T3D-959 in an Experimental Model of Sporadic Alzheimer’s Disease. J. Alzheimer’s Dis. JAD 2017, 55, 849–864. [Google Scholar] [CrossRef]
- Reich, D.; Gallucci, G.; Tong, M.; de la Monte, S.M. Therapeutic Advantages of Dual Targeting of PPAR-delta and PPAR-gamma in an Experimental Model of Sporadic Alzheimer’s Disease. J. Park. Dis. Alzheimers. Dis. 2018, 5, 10. [Google Scholar] [CrossRef]
- Tong, M.; Deochand, C.; Didsbury, J.; de la Monte, S.M. T3D-959: A Multi-Faceted Disease Remedial Drug Candidate for the Treatment of Alzheimer’s Disease. J. Alzheimer’s Dis. JAD 2016, 51, 123–138. [Google Scholar] [CrossRef]
- Chiang, Y.F.; Shaw, H.M.; Yang, M.F.; Huang, C.Y.; Hsieh, C.H.; Chao, P.M. Dietary oxidised frying oil causes oxidative damage of pancreatic islets and impairment of insulin secretion, effects associated with vitamin E deficiency. Br. J. Nutr. 2011, 105, 1311–1319. [Google Scholar] [CrossRef]
- Ernst, A.M.; Gimbel, B.A.; de Water, E.; Eckerle, J.K.; Radke, J.P.; Georgieff, M.K.; Wozniak, J.R. Prenatal and Postnatal Choline Supplementation in Fetal Alcohol Spectrum Disorder. Nutrients 2022, 14, 688. [Google Scholar] [CrossRef]
- Irvine, N.; England-Mason, G.; Field, C.J.; Dewey, D.; Aghajafari, F. Prenatal Folate and Choline Levels and Brain and Cognitive Development in Children: A Critical Narrative Review. Nutrients 2022, 14, 364. [Google Scholar] [CrossRef] [PubMed]
- Andreani, T.; Tong, M.; de la Monte, S.M. Hotdogs and Beer: Dietary Nitrosamine Exposure Exacerbates Neurodevelopmental Effects of Ethanol in Fetal Alcohol Spectrum Disorder. J. Drug. Alcohol. Res. 2014, 3, 1–9. [Google Scholar] [CrossRef]
- Tong, M.; Ziplow, J.; Chen, W.C.; Nguyen, Q.G.; Kim, C.; de la Monte, S.M. Motor Function Deficits Following Chronic Prenatal Ethanol Exposure are Linked to Impairments in Insulin/IGF, Notch and Wnt Signaling in the Cerebellum. J. Diabetes Metab. 2013, 4, 238. [Google Scholar] [CrossRef] [PubMed]
- Banuelos, C.; Gilbert, R.J.; Montgomery, K.S.; Fincher, A.S.; Wang, H.; Frye, G.D.; Setlow, B.; Bizon, J.L. Altered spatial learning and delay discounting in a rat model of human third trimester binge ethanol exposure. Behav. Pharmacol. 2012, 23, 54–65. [Google Scholar] [CrossRef]
- Crews, F.T.; Fisher, R.; Deason, C.; Vetreno, R.P. Loss of Basal Forebrain Cholinergic Neurons Following Adolescent Binge Ethanol Exposure: Recovery With the Cholinesterase Inhibitor Galantamine. Front. Behav. Neurosci. 2021, 15, 652494. [Google Scholar] [CrossRef]
- Goodlett, C.R.; Mahoney, J.C.; West, J.R. Brain growth deficits following a single day of alcohol exposure in the neonatal rat. Alcohol 1989, 6, 121–126. [Google Scholar] [CrossRef]
- Miguel, P.M.; Bronauth, L.P.; Deniz, B.F.; Confortim, H.D.; de Oliveira, B.C.; Dalle Molle, R.; Silveira, P.P.; Pereira, L.O. Neonatal hypoxia-ischemia induces dysregulated feeding patterns and ethanol consumption that are alleviated by methylphenidate administration in rats. Exp. Neurol. 2022, 353, 114071. [Google Scholar] [CrossRef]
- Glover, E.J.; Khan, F.; Clayton-Stiglbauer, K.; Chandler, L.J. Impact of sex, strain, and age on blood ethanol concentration and behavioral signs of intoxication during ethanol vapor exposure. Neuropharmacology 2021, 184, 108393. [Google Scholar] [CrossRef]
- de Oliveira, B.M.T.; Telles, T.; Lomba, L.A.; Correia, D.; Zampronio, A.R. Effects of binge-like ethanol exposure during adolescence on the hyperalgesia observed during sickness syndrome in rats. Pharm. Biochem. Behav. 2017, 160, 63–69. [Google Scholar] [CrossRef]
- Forbes, A.; Cooze, J.; Malone, C.; French, V.; Weber, J.T. Effects of intermittent binge alcohol exposure on long-term motor function in young rats. Alcohol 2013, 47, 95–102. [Google Scholar] [CrossRef]
- Lantz, C.L.; Pulimood, N.S.; Rodrigues-Junior, W.S.; Chen, C.K.; Manhaes, A.C.; Kalatsky, V.A.; Medina, A.E. Visual defects in a mouse model of fetal alcohol spectrum disorder. Front. Pediatr. 2014, 2, 107. [Google Scholar] [CrossRef]
- Lantz, C.L.; Wang, W.; Medina, A.E. Early alcohol exposure disrupts visual cortex plasticity in mice. Int. J. Dev. Neurosci. Off. J. Int. Soc. Dev. Neurosci. 2012, 30, 351–357. [Google Scholar] [CrossRef]
- Parnell, S.E.; Holloway, H.E.; Baker, L.K.; Styner, M.A.; Sulik, K.K. Dysmorphogenic effects of first trimester-equivalent ethanol exposure in mice: A magnetic resonance microscopy-based study. Alcohol. Clin. Exp. Res. 2014, 38, 2008–2014. [Google Scholar] [CrossRef]
- Semple, B.D.; Blomgren, K.; Gimlin, K.; Ferriero, D.M.; Noble-Haeusslein, L.J. Brain development in rodents and humans: Identifying benchmarks of maturation and vulnerability to injury across species. Prog. Neurobiol. 2013, 106–107, 1–16. [Google Scholar] [CrossRef]
- Zink, M.; Ferbert, T.; Frank, S.T.; Seufert, P.; Gebicke-Haerter, P.J.; Spanagel, R. Perinatal exposure to alcohol disturbs spatial learning and glutamate transmission-related gene expression in the adult hippocampus. Eur. J. Neurosci. 2011, 34, 457–468. [Google Scholar] [CrossRef]
- Carson, R.P.; Kelm, N.D.; West, K.L.; Does, M.D.; Fu, C.; Weaver, G.; McBrier, E.; Parker, B.; Grier, M.D.; Ess, K.C. Hypomyelination following deletion of Tsc2 in oligodendrocyte precursors. Ann. Clin. Transl. Neurol. 2015, 2, 1041–1054. [Google Scholar] [CrossRef]
- Grier, M.D.; West, K.L.; Kelm, N.D.; Fu, C.; Does, M.D.; Parker, B.; McBrier, E.; Lagrange, A.H.; Ess, K.C.; Carson, R.P. Loss of mTORC2 signaling in oligodendrocyte precursor cells delays myelination. PLoS ONE 2017, 12, e0188417. [Google Scholar] [CrossRef]
- Tyler, W.A.; Gangoli, N.; Gokina, P.; Kim, H.A.; Covey, M.; Levison, S.W.; Wood, T.L. Activation of the mammalian target of rapamycin (mTOR) is essential for oligodendrocyte differentiation. J. Neurosci. 2009, 29, 6367–6378. [Google Scholar] [CrossRef]
- Zabala, V.; Silbermann, E.; Re, E.; Andreani, T.; Tong, M.; Ramirez, T.; Gundogan, F.; de la Monte, S.M. Potential Co-Factor Role of Tobacco Specific Nitrosamine Exposures in the Pathogenesis of Fetal Alcohol Spectrum Disorder. Gynecol. Obs. Res. 2016, 2, 112–125. [Google Scholar] [CrossRef]
- Yalcin, E.B.; Tong, M.; de la Monte, S.M. Altered Oligodendroglial and Neuroglial Gene Expression in Adult Rat Cerebral White Matter Following Short- and Long-Term Ethanol Exposures and Brief Abstinence. J. Drug. Alc. Res. 2018, 7, 1–9. [Google Scholar] [CrossRef]
- Kaidanovich-Beilin, O.; Lipina, T.V.; Takao, K.; van Eede, M.; Hattori, S.; Laliberte, C.; Khan, M.; Okamoto, K.; Chambers, J.W.; Fletcher, P.J.; et al. Abnormalities in brain structure and behavior in GSK-3alpha mutant mice. Mol. Brain 2009, 2, 35. [Google Scholar] [CrossRef] [PubMed]
- Kim, W.Y.; Snider, W.D. Functions of GSK-3 Signaling in Development of the Nervous System. Front. Mol. Neurosci. 2011, 4, 44. [Google Scholar] [CrossRef] [PubMed]
- Xu, C.Q.; de la Monte, S.M.; Tong, M.; Huang, C.K.; Kim, M. Chronic Ethanol-Induced Impairment of Wnt/beta-Catenin Signaling is Attenuated by PPAR-delta Agonist. Alcohol. Clin. Exp. Res. 2015, 39, 969–979. [Google Scholar] [CrossRef] [PubMed]
- Singh, A.K.; Gupta, S.; Jiang, Y.; Younus, M.; Ramzan, M. In vitro neurogenesis from neural progenitor cells isolated from the hippocampus region of the brain of adult rats exposed to ethanol during early development through their alcohol-drinking mothers. Alcohol Alcohol. 2009, 44, 185–198. [Google Scholar] [CrossRef] [PubMed]
- Gundogan, F.; Gilligan, J.; Qi, W.; Chen, E.; Naram, R.; de la Monte, S.M. Dose effect of gestational ethanol exposure on placentation and fetal growth. Placenta 2015, 36, 523–530. [Google Scholar] [CrossRef]
- Yeon, J.E.; Califano, S.; Xu, J.; Wands, J.R.; De La Monte, S.M. Potential role of PTEN phosphatase in ethanol-impaired survival signaling in the liver. Hepatology 2003, 38, 703–714. [Google Scholar] [CrossRef]
- Derdak, Z.; Lang, C.H.; Villegas, K.A.; Tong, M.; Mark, N.M.; de la Monte, S.M.; Wands, J.R. Activation of p53 enhances apoptosis and insulin resistance in a rat model of alcoholic liver disease. J. Hepatol. 2011, 54, 164–172. [Google Scholar] [CrossRef]
- Laplante, M.; Sabatini, D.M. mTOR Signaling. Cold Spring Harb. Perspect. Biol. 2012, 15, a011593. [Google Scholar] [CrossRef]
- Copps, K.D.; White, M.F. Regulation of insulin sensitivity by serine/threonine phosphorylation of insulin receptor substrate proteins IRS1 and IRS2. Diabetologia 2012, 55, 2565–2582. [Google Scholar] [CrossRef]
- Zhou, H.; Huang, S. The complexes of mammalian target of rapamycin. Curr. Protein Pept. Sci. 2010, 11, 409–424. [Google Scholar] [CrossRef]
- Figlia, G.; Gerber, D.; Suter, U. Myelination and mTOR. Glia 2018, 66, 693–707. [Google Scholar] [CrossRef]
- Narayanan, S.P.; Flores, A.I.; Wang, F.; Macklin, W.B. Akt signals through the mammalian target of rapamycin pathway to regulate CNS myelination. J. Neurosci. 2009, 29, 6860–6870. [Google Scholar] [CrossRef]
- Liu, H.T.; Zou, Y.X.; Zhu, W.J.; Sen, L.; Zhang, G.H.; Ma, R.R.; Guo, X.Y.; Gao, P. lncRNA THAP7-AS1, transcriptionally activated by SP1 and post-transcriptionally stabilized by METTL3-mediated m6A modification, exerts oncogenic properties by improving CUL4B entry into the nucleus. Cell Death. Differ. 2022, 29, 627–641. [Google Scholar] [CrossRef]
- DaDalt, A.A.; Bonham, C.A.; Lotze, G.P.; Luiso, A.A.; Vacratsis, P.O. Src-mediated phosphorylation of the ribosome biogenesis factor hYVH1 affects its localization, promoting partitioning to the 60S ribosomal subunit. J. Biol. Chem. 2022, 298, 102679. [Google Scholar] [CrossRef]
- Xie, J.J.; Jiang, Y.Y.; Jiang, Y.; Li, C.Q.; Lim, M.C.; An, O.; Mayakonda, A.; Ding, L.W.; Long, L.; Sun, C.; et al. Super-Enhancer-Driven Long Non-Coding RNA LINC01503, Regulated by TP63, Is Over-Expressed and Oncogenic in Squamous Cell Carcinoma. Gastroenterology 2018, 154, 2137–2151. [Google Scholar] [CrossRef]
- Sevigny, M.; Bourdeau Julien, I.; Venkatasubramani, J.P.; Hui, J.B.; Dutchak, P.A.; Sephton, C.F. FUS contributes to mTOR-dependent inhibition of translation. J. Biol. Chem. 2020, 295, 18459–18473. [Google Scholar] [CrossRef]
- Nagashima, F.; Nishiyama, R.; Iwao, B.; Kawai, Y.; Ishii, C.; Yamanaka, T.; Uchino, H.; Inazu, M. Molecular and Functional Characterization of Choline Transporter-Like Proteins in Esophageal Cancer Cells and Potential Therapeutic Targets. Biomol. 2018, 26, 399–408. [Google Scholar] [CrossRef]
- Estrada-Cortes, E.; Negron-Perez, V.M.; Tribulo, P.; Zenobi, M.G.; Staples, C.R.; Hansen, P.J. Effects of choline on the phenotype of the cultured bovine preimplantation embryo. J. Dairy. Sci. 2020, 103, 10784–10796. [Google Scholar] [CrossRef]
- Bastian, T.W.; von Hohenberg, W.C.; Kaus, O.R.; Lanier, L.M.; Georgieff, M.K. Choline Supplementation Partially Restores Dendrite Structural Complexity in Developing Iron-Deficient Mouse Hippocampal Neurons. J. Nutr. 2022, 152, 747–757. [Google Scholar] [CrossRef]
- Chin, E.W.; Marcy, G.; Yoon, S.I.; Ma, D.; Rosales, F.J.; Augustine, G.J.; Goh, E.L. Choline Ameliorates Disease Phenotypes in Human iPSC Models of Rett Syndrome. Neuromolecular Med. 2016, 18, 364–377. [Google Scholar] [CrossRef]
- Wang, W.; Bringe, N.A.; Berhow, M.A.; Gonzalez de Mejia, E. beta-Conglycinins among sources of bioactives in hydrolysates of different soybean varieties that inhibit leukemia cells in vitro. J. Agric. Food Chem. 2008, 56, 4012–4020. [Google Scholar] [CrossRef] [PubMed]
- Jones, K.L.; Harty, J.; Roeder, M.J.; Winters, T.A.; Banz, W.J. In vitro effects of soy phytoestrogens on rat L6 skeletal muscle cells. J. Med. Food 2005, 8, 327–331. [Google Scholar] [CrossRef] [PubMed]
- Boggs, J.M. Myelin basic protein: A multifunctional protein. Cell. Mol. Life Sci. CMLS 2006, 63, 1945–1961. [Google Scholar] [CrossRef] [PubMed]
- Middeldorp, J.; Hol, E.M. GFAP in health and disease. Prog. Neurobiol. 2011, 93, 421–443. [Google Scholar] [CrossRef]
- Osman, I.; Wang, L.; Hu, G.; Zheng, Z.; Zhou, J. GFAP (Glial Fibrillary Acidic Protein)-Positive Progenitor Cells Contribute to the Development of Vascular Smooth Muscle Cells and Endothelial Cells-Brief Report. Arterioscler. Thromb. Vasc. Biol. 2020, 40, 1231–1238. [Google Scholar] [CrossRef]


| Molecule | Ethanol Factor | Treatment Factor | Ethanol x Treatment Interaction | |||
|---|---|---|---|---|---|---|
| F-Ratio | p-Value | F-Ratio | p-Value | F-Ratio | p-Value | |
| MAG1 | 7.86 | 0.0066 | 15.30 | <0.0001 | 1.589 | N.S. |
| MOG | 0.161 | N.S. | 16.11 | <0.0001 | 7.52 | 0.001 |
| MBP | 0.925 | N.S. | 1.45 | N.S. | 1.06 | N.S. |
| PLP | 0.817 | N.S. | 5.88 | 0.0045 | 1.46 | N.S. |
| PDGFR-α | 0.811 | N.S. | 18.33 | <0.0001 | 0.968 | N.S. |
| GALC | 1.574 | N.S. | 19.67 | <0.0001 | 0.125 | N.S. |
| GFAP | 0.979 | N.S. | 2.41 | 0.0974 | 2.55 | 0.0855 |
| UBIQUITIN | 0.192 | N.S. | 10.81 | <0.0001 | 1.269 | N.S. |
| 8-OHdG | 0.446 | N.S. | 8.798 | <0.0001 | 0.320 | N.S. |
| HNE | 8.464 | 0.0049 | 5.167 | 0.0082 | 0.506 | N.S. |
| Index | Ethanol Factor | Treatment Factor | Ethanol x Treatment Interaction | |||
|---|---|---|---|---|---|---|
| F-Ratio | p-Value | F-Ratio | p-Value | F-Ratio | p-Value | |
| Insulin R | 0.423 | N.S. | 5.272 | 0.011 | 0.127 | N.S. |
| p-Insulin R | 3.014 | 0.093 | 0.182 | N.S. | 0.059 | N.S. |
| p/T-Insulin R | 1.417 | N.S. | 6.144 | 0.006 | 0.192 | N.S. |
| IGF-1 R | 0.182 | N.S. | 8.504 | 0.001 | 0.467 | N.S. |
| p-IGF-1 R | 4.204 | 0.049 | 1.731 | N.S. | 1.257 | N.S. |
| p/T-IGF-1 R | 3.285 | 0.080 | 13.85 | <0.0001 | 1.507 | N.S. |
| IRS-1 | 2.694 | N.S. | 1.512 | N.S. | 0.081 | N.S. |
| p-IRS-1 | 0.066 | N.S. | 0.325 | N.S. | 0.213 | N.S. |
| p/T-IRS-1 | 0.638 | N.S. | 0.388 | N.S. | 0.279 | N.S. |
| Protein | Ethanol Factor | Treatment Factor | Ethanol x Treatment Interaction | |||
|---|---|---|---|---|---|---|
| F-Ratio | p-Value | F-Ratio | p-Value | F-Ratio | p-Value | |
| TSC2 | 0.01 | N.S. | 9.036 | 0.0008 | 0.249 | N.S. |
| p-TSC2 | 1.568 | N.S. | 5.174 | 0.012 | 0.657 | N.S. |
| p/T-TSC2 | 9.47 | 0.004 | 27.27 | <0.0001 | 0.549 | N.S. |
| mTOR | 0.899 | N.S. | 21.86 | <0.0001 | 0.682 | N.S. |
| p-mTOR | 11.27 | 0.002 | 4.800 | 0.016 | 2.187 | N.S. |
| p/T-mTOR | 13.59 | 0.0009 | 6.801 | 0.0037 | 2.854 | 0.073 |
| P70S6K | 0.137 | N.S. | 9.740 | 0.0006 | 0.192 | N.S. |
| p-P70S6K | 0.72 | N.S. | 1.337 | N.S. | 0.872 | N.S. |
| p/T-P70S6K | 3.361 | 0.077 | 8.609 | 0.0011 | 0.368 | N.S. |
| RPS6 | 0.407 | N.S. | 9.917 | 0.0005 | 0.189 | N.S. |
| p-RPS6 | 0.763 | N.S. | 9.538 | 0.0002 | 0.354 | N.S. |
| p/T-RPS6 | 0.587 | N.S. | 8.952 | 0.0009 | 0.549 | N.S. |
| Antibody | Source | Type | Stock | Final Concentration | Commercial Source | RRID# |
|---|---|---|---|---|---|---|
| Myelin-associated glycoprotein (MAG) | Mouse | Monoclonal | 0.5 mg/mL | 0.25 µg/mL | Abcam Biotechnology, Waltham, MA, USA | AB_2042411 |
| Myelin Oligodendrocyte Glycoprotein (MOG) | Rabbit | Polyclonal | 1.0 mg/mL | 1.25 µg/mL | Abcam Biotechnology, Waltham, MA, USA | AB_2145529 |
| Myelin Basic Protein (MBP) | Rabbit | Polyclonal | 1.0 mg/mL | 5 µg/mL | Sigma-Aldrich, St. Louis, MO, USA | AB_1841021 |
| Proteolipid Protein (PLP) | Rabbit | Polyclonal | Purified serum | 1:2000 | Abcam Biotechnology, Waltham, MA, USA | AB_776593 |
| Galactosylceramidase (GALC) | Rabbit | Polyclonal | 1.0 mg/ml | 2 µg/mL | Abcam Biotechnology, Waltham, MA, USA | AB_2108528 |
| Platelet-Derived Growth Factor Receptor-Alpha (PDGFR-α) | Rabbit | Polyclonal | 1.0 mg/mL | 1 µg/mL | Abcam Biotechnology, Waltham, MA, USA | AB_2162341 |
| Glial Fibrillary Acidic Protein (GFAP) | Mouse | Monoclonal | 1.0 mg/mL | 2.5 µg/mL | Invitrogen (Life Technologies), Waltham, MA, USA | AB_2535827 |
| Ubiquitin (UBQ) | Rabbit | Polyclonal | 0.25 mg/mL | 0.5 µg/mL | Abcam Biotechnology, Waltham, MA, USA | AB_306069 |
| 8-Hydroxyguanosine (8-OHdG) | Mouse | Monoclonal | 1.0 mg/mL | 0.2 µg/mL | Abcam Biotechnology, Waltham, MA, USA | AB_867461 |
| 4-Hydroxynonenal (4-HNE) | Goat | Polyclonal | 0.8 mg/mL | 1.0 µg/mL | Abcam Biotechnology, Waltham, MA, USA | AB_722493 |
| Large acidic ribosomal protein (RPLPO) | Mouse | Monoclonal | 0.1 mg/mL | 0.1 µg/mL | Santa Cruz, Dallas, TX, USA | [176,177,178,179] |
Disclaimer/Publisher’s Note: The statements, opinions and data contained in all publications are solely those of the individual author(s) and contributor(s) and not of MDPI and/or the editor(s). MDPI and/or the editor(s) disclaim responsibility for any injury to people or property resulting from any ideas, methods, instructions or products referred to in the content. |
© 2023 by the authors. Licensee MDPI, Basel, Switzerland. This article is an open access article distributed under the terms and conditions of the Creative Commons Attribution (CC BY) license (https://creativecommons.org/licenses/by/4.0/).
Share and Cite
de la Monte, S.M.; Tong, M.; Delikkaya, B. Differential Early Mechanistic Frontal Lobe Responses to Choline Chloride and Soy Isoflavones in an Experimental Model of Fetal Alcohol Spectrum Disorder. Int. J. Mol. Sci. 2023, 24, 7595. https://doi.org/10.3390/ijms24087595
de la Monte SM, Tong M, Delikkaya B. Differential Early Mechanistic Frontal Lobe Responses to Choline Chloride and Soy Isoflavones in an Experimental Model of Fetal Alcohol Spectrum Disorder. International Journal of Molecular Sciences. 2023; 24(8):7595. https://doi.org/10.3390/ijms24087595
Chicago/Turabian Stylede la Monte, Suzanne M., Ming Tong, and Busra Delikkaya. 2023. "Differential Early Mechanistic Frontal Lobe Responses to Choline Chloride and Soy Isoflavones in an Experimental Model of Fetal Alcohol Spectrum Disorder" International Journal of Molecular Sciences 24, no. 8: 7595. https://doi.org/10.3390/ijms24087595
APA Stylede la Monte, S. M., Tong, M., & Delikkaya, B. (2023). Differential Early Mechanistic Frontal Lobe Responses to Choline Chloride and Soy Isoflavones in an Experimental Model of Fetal Alcohol Spectrum Disorder. International Journal of Molecular Sciences, 24(8), 7595. https://doi.org/10.3390/ijms24087595