
Upregulation of APAF1 and CSF1R in Peripheral Blood Mononuclear Cells of Parkinson’s Disease
 , , and
Abstract
1. Introduction
2. Results
2.1. Expression Profiles of Peripheral Blood Mononuclear Cells in the Discovery Cohort for PD
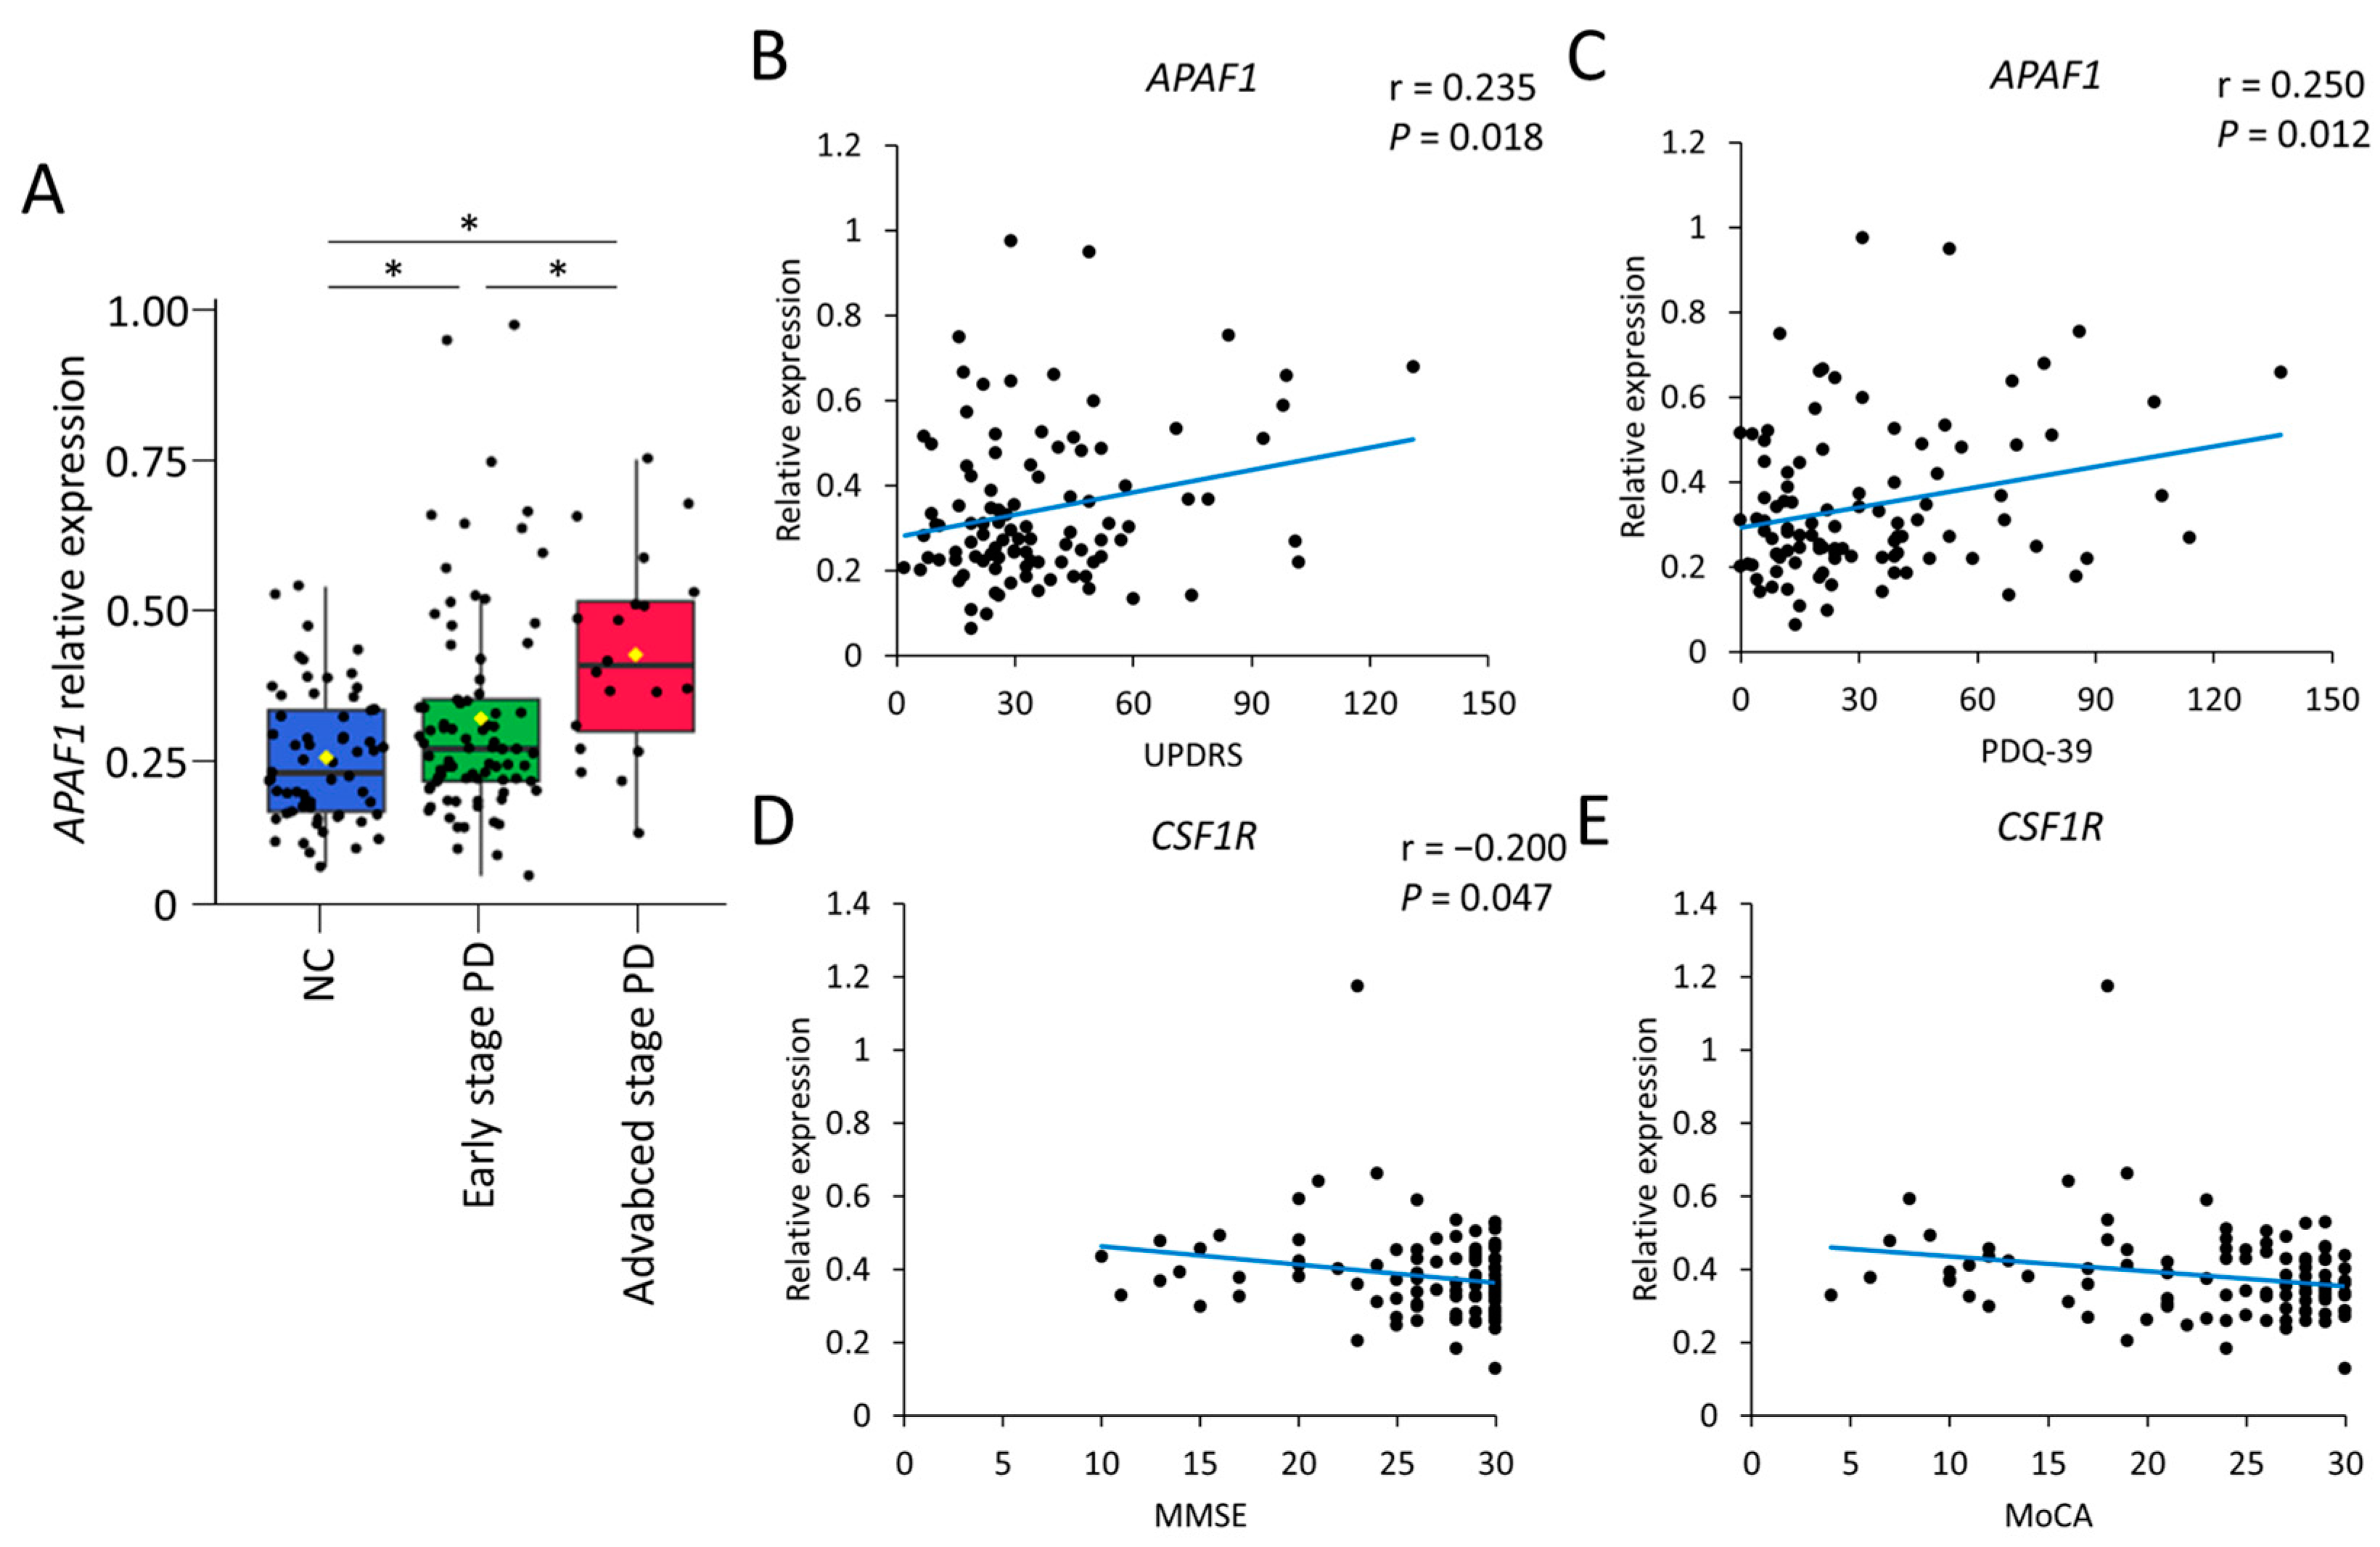
2.2. Validation of Candidate Gene Expression Markers in a Validation Cohort
3. Discussion
4. Materials and Methods
4.1. Patient Recruitment
4.2. Measurement of α-Synuclein in Plasma
4.3. Profiling of Relevant Gene Expression Related to Reactive Oxygen Species (ROS) and Inflammation Using a Quantitative Polymerase Chain Reaction (q-PCR) Array
4.4. Statistical Analysis
Author Contributions
Funding
Institutional Review Board Statement
Informed Consent Statement
Data Availability Statement
Acknowledgments
Conflicts of Interest
References
- Lang, A.E.; Lozano, A.M. Parkinson’s disease. First of two parts. N. Engl. J. Med. 1998, 339, 1044–1053. [Google Scholar] [CrossRef]
- von Bohlen und Halbach, O.; Schober, A.; Krieglstein, K. Genes, proteins, and neurotoxins involved in Parkinson’s disease. Prog. Neurobiol. 2004, 73, 151–177. [Google Scholar] [CrossRef]
- Jenner, P. Oxidative stress in Parkinson’s disease. Ann. Neurol. 2003, 53 (Suppl. S3), S26–S36; discussion S36–S28. [Google Scholar] [CrossRef]
- Chang, K.H.; Chen, C.M. The Role of Oxidative Stress in Parkinson’s Disease. Antioxidants 2020, 9, 597. [Google Scholar] [CrossRef]
- Gutteridge, J.M.; Halliwell, B. Iron toxicity and oxygen radicals. Baillieres Clin. Haematol. 1989, 2, 195–256. [Google Scholar] [CrossRef]
- Schapira, A.H. Mitochondria in the aetiology and pathogenesis of Parkinson’s disease. Lancet Neurol. 2008, 7, 97–109. [Google Scholar] [CrossRef]
- McGeer, P.L.; Itagaki, S.; Boyes, B.E.; McGeer, E.G. Reactive microglia are positive for HLA-DR in the substantia nigra of Parkinson’s and Alzheimer’s disease brains. Neurology 1988, 38, 1285–1291. [Google Scholar] [CrossRef]
- Sian, J.; Dexter, D.T.; Lees, A.J.; Daniel, S.; Agid, Y.; Javoy-Agid, F.; Jenner, P.; Marsden, C.D. Alterations in glutathione levels in Parkinson’s disease and other neurodegenerative disorders affecting basal ganglia. Ann. Neurol. 1994, 36, 348–355. [Google Scholar] [CrossRef]
- Banerjee, R.; Starkov, A.A.; Beal, M.F.; Thomas, B. Mitochondrial dysfunction in the limelight of Parkinson’s disease pathogenesis. Biochim. Biophys. Acta 2009, 1792, 651–663. [Google Scholar] [CrossRef] [PubMed]
- Irizarry, M.C.; Gurol, M.E.; Raju, S.; Diaz-Arrastia, R.; Locascio, J.J.; Tennis, M.; Hyman, B.T.; Growdon, J.H.; Greenberg, S.M.; Bottiglieri, T. Association of homocysteine with plasma amyloid beta protein in aging and neurodegenerative disease. Neurology 2005, 65, 1402–1408. [Google Scholar] [CrossRef] [PubMed]
- Bhattacharjee, N.; Paul, R.; Giri, A.; Borah, A. Chronic exposure of homocysteine in mice contributes to dopamine loss by enhancing oxidative stress in nigrostriatum and produces behavioral phenotypes of Parkinson’s disease. Biochem. Biophys. Rep. 2016, 6, 47–53. [Google Scholar] [CrossRef]
- Chen, C.M.; Liu, J.L.; Wu, Y.R.; Chen, Y.C.; Cheng, H.S.; Cheng, M.L.; Chiu, D.T. Increased oxidative damage in peripheral blood correlates with severity of Parkinson’s disease. Neurobiol. Dis. 2009, 33, 429–435. [Google Scholar] [CrossRef] [PubMed]
- de Farias, C.C.; Maes, M.; Bonifacio, K.L.; Bortolasci, C.C.; de Souza Nogueira, A.; Brinholi, F.F.; Matsumoto, A.K.; do Nascimento, M.A.; de Melo, L.B.; Nixdorf, S.L.; et al. Highly specific changes in antioxidant levels and lipid peroxidation in Parkinson’s disease and its progression: Disease and staging biomarkers and new drug targets. Neurosci. Lett. 2016, 617, 66–71. [Google Scholar] [CrossRef] [PubMed]
- Sanyal, J.; Bandyopadhyay, S.K.; Banerjee, T.K.; Mukherjee, S.C.; Chakraborty, D.P.; Ray, B.C.; Rao, V.R. Plasma levels of lipid peroxides in patients with Parkinson’s disease. Eur. Rev. Med. Pharmacol. Sci. 2009, 13, 129–132. [Google Scholar] [PubMed]
- Sharma, A.; Kaur, P.; Kumar, B.; Prabhakar, S.; Gill, K.D. Plasma lipid peroxidation and antioxidant status of Parkinson’s disease patients in the Indian population. Park. Relat. Disord. 2008, 14, 52–57. [Google Scholar] [CrossRef] [PubMed]
- Bogdanov, M.; Matson, W.R.; Wang, L.; Matson, T.; Saunders-Pullman, R.; Bressman, S.S.; Flint Beal, M. Metabolomic profiling to develop blood biomarkers for Parkinson’s disease. Brain 2008, 131, 389–396. [Google Scholar] [CrossRef]
- Kikuchi, A.; Takeda, A.; Onodera, H.; Kimpara, T.; Hisanaga, K.; Sato, N.; Nunomura, A.; Castellani, R.J.; Perry, G.; Smith, M.A.; et al. Systemic increase of oxidative nucleic acid damage in Parkinson’s disease and multiple system atrophy. Neurobiol. Dis. 2002, 9, 244–248. [Google Scholar] [CrossRef]
- Wei, Z.; Li, X.; Li, X.; Liu, Q.; Cheng, Y. Oxidative Stress in Parkinson’s Disease: A Systematic Review and Meta-Analysis. Front. Mol. Neurosci. 2018, 11, 236. [Google Scholar] [CrossRef]
- Wei, P.C.; Lee-Chen, G.J.; Chen, C.M.; Wu, Y.R.; Chen, Y.J.; Lin, J.L.; Lo, Y.S.; Yao, C.F.; Chang, K.H. Neuroprotection of Indole-Derivative Compound NC001-8 by the Regulation of the NRF2 Pathway in Parkinson’s Disease Cell Models. Oxid. Med. Cell. Longev. 2019, 2019, 5074367. [Google Scholar] [CrossRef]
- Jakel, R.J.; Townsend, J.A.; Kraft, A.D.; Johnson, J.A. Nrf2-mediated protection against 6-hydroxydopamine. Brain Res. 2007, 1144, 192–201. [Google Scholar] [CrossRef]
- Petrillo, S.; Schirinzi, T.; Di Lazzaro, G.; D’Amico, J.; Colona, V.L.; Bertini, E.; Pierantozzi, M.; Mari, L.; Mercuri, N.B.; Piemonte, F.; et al. Systemic activation of Nrf2 pathway in Parkinson’s disease. Mov. Disord. 2020, 35, 180–184. [Google Scholar] [CrossRef] [PubMed]
- Mogi, M.; Kondo, T.; Mizuno, Y.; Nagatsu, T. p53 protein, interferon-gamma, and NF-kappaB levels are elevated in the parkinsonian brain. Neurosci. Lett. 2007, 414, 94–97. [Google Scholar] [CrossRef] [PubMed]
- Durrenberger, P.F.; Grunblatt, E.; Fernando, F.S.; Monoranu, C.M.; Evans, J.; Riederer, P.; Reynolds, R.; Dexter, D.T. Inflammatory Pathways in Parkinson’s Disease; A BNE Microarray Study. Park. Dis. 2012, 2012, 214714. [Google Scholar] [CrossRef] [PubMed]
- Brodacki, B.; Staszewski, J.; Toczylowska, B.; Kozlowska, E.; Drela, N.; Chalimoniuk, M.; Stepien, A. Serum interleukin (IL-2, IL-10, IL-6, IL-4), TNFalpha, and INFgamma concentrations are elevated in patients with atypical and idiopathic parkinsonism. Neurosci. Lett. 2008, 441, 158–162. [Google Scholar] [CrossRef] [PubMed]
- Scalzo, P.; Kummer, A.; Cardoso, F.; Teixeira, A.L. Increased serum levels of soluble tumor necrosis factor-alpha receptor-1 in patients with Parkinson’s disease. J. Neuroimmunol. 2009, 216, 122–125. [Google Scholar] [CrossRef]
- Reale, M.; Iarlori, C.; Thomas, A.; Gambi, D.; Perfetti, B.; Di Nicola, M.; Onofrj, M. Peripheral cytokines profile in Parkinson’s disease. Brain Behav. Immun. 2009, 23, 55–63. [Google Scholar] [CrossRef]
- Scherzer, C.R.; Eklund, A.C.; Morse, L.J.; Liao, Z.; Locascio, J.J.; Fefer, D.; Schwarzschild, M.A.; Schlossmacher, M.G.; Hauser, M.A.; Vance, J.M.; et al. Molecular markers of early Parkinson’s disease based on gene expression in blood. Proc. Natl. Acad. Sci. USA 2007, 104, 955–960. [Google Scholar] [CrossRef]
- Soreq, L.; Israel, Z.; Bergman, H.; Soreq, H. Advanced microarray analysis highlights modified neuro-immune signaling in nucleated blood cells from Parkinson’s disease patients. J. Neuroimmunol. 2008, 201–202, 227–236. [Google Scholar] [CrossRef]
- Grunblatt, E.; Zehetmayer, S.; Jacob, C.P.; Muller, T.; Jost, W.H.; Riederer, P. Pilot study: Peripheral biomarkers for diagnosing sporadic Parkinson’s disease. J. Neural Transm. 2010, 117, 1387–1393. [Google Scholar] [CrossRef]
- Shehadeh, L.A.; Yu, K.; Wang, L.; Guevara, A.; Singer, C.; Vance, J.; Papapetropoulos, S. SRRM2, a potential blood biomarker revealing high alternative splicing in Parkinson’s disease. PLoS ONE 2010, 5, e9104. [Google Scholar] [CrossRef]
- Molochnikov, L.; Rabey, J.M.; Dobronevsky, E.; Bonucelli, U.; Ceravolo, R.; Frosini, D.; Grunblatt, E.; Riederer, P.; Jacob, C.; Aharon-Peretz, J.; et al. A molecular signature in blood identifies early Parkinson’s disease. Mol. Neurodegener. 2012, 7, 26. [Google Scholar] [CrossRef] [PubMed]
- Karlsson, M.K.; Sharma, P.; Aasly, J.; Toft, M.; Skogar, O.; Saebo, S.; Lonneborg, A. Found in transcription: Accurate Parkinson’s disease classification in peripheral blood. J. Park. Dis. 2013, 3, 19–29. [Google Scholar] [CrossRef] [PubMed]
- Chikina, M.D.; Gerald, C.P.; Li, X.; Ge, Y.; Pincas, H.; Nair, V.D.; Wong, A.K.; Krishnan, A.; Troyanskaya, O.G.; Raymond, D.; et al. Low-variance RNAs identify Parkinson’s disease molecular signature in blood. Mov. Disord. 2015, 30, 813–821. [Google Scholar] [CrossRef] [PubMed]
- Shakeri, R.; Kheirollahi, A.; Davoodi, J. Apaf-1: Regulation and function in cell death. Biochimie 2017, 135, 111–125. [Google Scholar] [CrossRef] [PubMed]
- Shinoura, N.; Sakurai, S.; Asai, A.; Kirino, T.; Hamada, H. Over-expression of APAF-1 and caspase-9 augments radiation-induced apoptosis in U-373MG glioma cells. Int. J. Cancer 2001, 93, 252–261. [Google Scholar] [CrossRef] [PubMed]
- Perkins, C.; Kim, C.N.; Fang, G.; Bhalla, K.N. Overexpression of Apaf-1 promotes apoptosis of untreated and paclitaxel- or etoposide-treated HL-60 cells. Cancer Res. 1998, 58, 4561–4566. [Google Scholar]
- Kawamoto, Y.; Ito, H.; Ayaki, T.; Takahashi, R. Immunohistochemical localization of apoptosome-related proteins in Lewy bodies in Parkinson’s disease and dementia with Lewy bodies. Brain Res. 2014, 1571, 39–48. [Google Scholar] [CrossRef]
- Mochizuki, H.; Hayakawa, H.; Migita, M.; Shibata, M.; Tanaka, R.; Suzuki, A.; Shimo-Nakanishi, Y.; Urabe, T.; Yamada, M.; Tamayose, K.; et al. An AAV-derived Apaf-1 dominant negative inhibitor prevents MPTP toxicity as antiapoptotic gene therapy for Parkinson’s disease. Proc. Natl. Acad. Sci. USA 2001, 98, 10918–10923. [Google Scholar] [CrossRef]
- Wang, Y.; Yu, X.; Zhang, P.; Ma, Y.; Wang, L.; Xu, H.; Sui, D. Neuroprotective effects of pramipexole transdermal patch in the MPTP-induced mouse model of Parkinson’s disease. J. Pharmacol. Sci. 2018, 138, 31–37. [Google Scholar] [CrossRef]
- Iaccarino, C.; Crosio, C.; Vitale, C.; Sanna, G.; Carri, M.T.; Barone, P. Apoptotic mechanisms in mutant LRRK2-mediated cell death. Hum. Mol. Genet. 2007, 16, 1319–1326. [Google Scholar] [CrossRef]
- Chitu, V.; Biundo, F.; Shlager, G.G.L.; Park, E.S.; Wang, P.; Gulinello, M.E.; Gokhan, S.; Ketchum, H.C.; Saha, K.; DeTure, M.A.; et al. Microglial Homeostasis Requires Balanced CSF-1/CSF-2 Receptor Signaling. Cell Rep. 2020, 30, 3004–3019.e5. [Google Scholar] [CrossRef] [PubMed]
- Stanley, E.R.; Chitu, V. CSF-1 receptor signaling in myeloid cells. Cold Spring Harb. Perspect. Biol. 2014, 6, a021857. [Google Scholar] [CrossRef]
- Keshvari, S.; Caruso, M.; Teakle, N.; Batoon, L.; Sehgal, A.; Patkar, O.L.; Ferrari-Cestari, M.; Snell, C.E.; Chen, C.; Stevenson, A.; et al. CSF1R-dependent macrophages control postnatal somatic growth and organ maturation. PLoS Genet. 2021, 17, e1009605. [Google Scholar] [CrossRef] [PubMed]
- Kondo, Y.; Duncan, I.D. Selective reduction in microglia density and function in the white matter of colony-stimulating factor-1-deficient mice. J. Neurosci. Res. 2009, 87, 2686–2695. [Google Scholar] [CrossRef] [PubMed]
- Mitrasinovic, O.M.; Perez, G.V.; Zhao, F.; Lee, Y.L.; Poon, C.; Murphy, G.M., Jr. Overexpression of macrophage colony-stimulating factor receptor on microglial cells induces an inflammatory response. J. Biol. Chem. 2001, 276, 30142–30149. [Google Scholar] [CrossRef]
- Simpson, D.S.A.; Oliver, P.L. ROS Generation in Microglia: Understanding Oxidative Stress and Inflammation in Neurodegenerative Disease. Antioxidants 2020, 9, 743. [Google Scholar] [CrossRef]
- Neal, M.L.; Fleming, S.M.; Budge, K.M.; Boyle, A.M.; Kim, C.; Alam, G.; Beier, E.E.; Wu, L.J.; Richardson, J.R. Pharmacological inhibition of CSF1R by GW2580 reduces microglial proliferation and is protective against neuroinflammation and dopaminergic neurodegeneration. FASEB J. 2020, 34, 1679–1694. [Google Scholar] [CrossRef]
- Chang, K.H.; Wu, Y.R.; Chen, Y.C.; Wu, H.C.; Chen, C.M. Association between CSF1 and CSF1R Polymorphisms and Parkinson’s Disease in Taiwan. J. Clin. Med. 2019, 8, 1529. [Google Scholar] [CrossRef]
- Akiyama, H.; Nishimura, T.; Kondo, H.; Ikeda, K.; Hayashi, Y.; McGeer, P.L. Expression of the receptor for macrophage colony stimulating factor by brain microglia and its upregulation in brains of patients with Alzheimer’s disease and amyotrophic lateral sclerosis. Brain Res. 1994, 639, 171–174. [Google Scholar] [CrossRef]
- Pons, V.; Levesque, P.; Plante, M.M.; Rivest, S. Conditional genetic deletion of CSF1 receptor in microglia ameliorates the physiopathology of Alzheimer’s disease. Alzheimers Res. Ther. 2021, 13, 8. [Google Scholar] [CrossRef]
- Hughes, A.J.; Daniel, S.E.; Kilford, L.; Lees, A.J. Accuracy of clinical diagnosis of idiopathic Parkinson’s disease: A clinico-pathological study of 100 cases. J. Neurol. Neurosurg. Psychiatry 1992, 55, 181–184. [Google Scholar] [CrossRef] [PubMed]
- Movement Disorder Society Task Force on Rating Scales for Parkinson’s Disease. The Unified Parkinson’s Disease Rating Scale (UPDRS): Status and recommendations. Mov. Disord. 2003, 18, 738–750. [Google Scholar] [CrossRef] [PubMed]
- Hoehn, M.M.; Yahr, M.D. Parkinsonism: Onset, progression and mortality. Neurology 1967, 17, 427–442. [Google Scholar] [CrossRef]
- Schwab, R.; England, A.; Schwab, Z. Projection Technique for Evaluating Surgery in Parkinson’s Disease; E&S Livingstone: Edinburgh, UK, 1969. [Google Scholar]
- Jenkinson, C.; Peto, V.; Fitzpatrick, R.; Greenhall, R.; Hyman, N. Self-reported functioning and well-being in patients with Parkinson’s disease: Comparison of the short-form health survey (SF-36) and the Parkinson’s Disease Questionnaire (PDQ-39). Age Ageing 1995, 24, 505–509. [Google Scholar] [CrossRef] [PubMed]
- Morris, J.C. The Clinical Dementia Rating (CDR): Current version and scoring rules. Neurology 1993, 43, 2412–2414. [Google Scholar] [CrossRef]
- Tombaugh, T.N.; McIntyre, N.J. The mini-mental state examination: A comprehensive review. J. Am. Geriatr. Soc. 1992, 40, 922–935. [Google Scholar] [CrossRef]
- Nasreddine, Z.S.; Phillips, N.A.; Bedirian, V.; Charbonneau, S.; Whitehead, V.; Collin, I.; Cummings, J.L.; Chertkow, H. The Montreal Cognitive Assessment, MoCA: A brief screening tool for mild cognitive impairment. J. Am. Geriatr. Soc. 2005, 53, 695–699. [Google Scholar] [CrossRef]
- Cummings, J.L. The Neuropsychiatric Inventory: Assessing psychopathology in dementia patients. Neurology 1997, 48, S10–S16. [Google Scholar] [CrossRef]
- Beck, A.T.; Steer, R.A.; Brown, G.K. Beck Depression Inventory-II; Pearson: San Antonio, TX, USA, 1996. [Google Scholar]
- Hamilton, M. Rating depressive patients. J. Clin. Psychiatry 1980, 41, 21–24. [Google Scholar]
- Yang, S.Y.; Chiu, M.J.; Lin, C.H.; Horng, H.E.; Yang, C.C.; Chieh, J.J.; Chen, H.H.; Liu, B.H. Development of an ultra-high sensitive immunoassay with plasma biomarker for differentiating Parkinson disease dementia from Parkinson disease using antibody functionalized magnetic nanoparticles. J. Nanobiotechnol. 2016, 14, 41. [Google Scholar] [CrossRef]


| Control (n = 25) | PD (n = 48) | |
|---|---|---|
| Age (years) | 66.33 ± 8.56 | 68.58 ± 10.79 |
| Male (%) | 155 (60.00) | 30 (62.50) |
| Hoehn and Yahr stage | 2.14 ± 0.95 | |
| LEDD (mg) | 849.28 ± 616.80 | |
| UPDRS | ||
| Total | 1.12 ± 1.88 | 53.38 ± 31.25 * |
| Part III | 0.16 ± 0.78 | 32.56 ± 19.60 * |
| Gene | Control (N = 25) | PD (N = 48) | p Value |
|---|---|---|---|
| ALDH1A1 | 0.053 ± 0.017 | 0.063 ± 0.023 | 0.047 |
| CR1 | 0.054 ± 0.033 | 0.073 ± 0.031 | 0.026 |
| CSF1R | 0.325 ± 0.096 | 0.375 ± 0.084 | 0.032 |
| APAF1 | 0.354 ± 0.084 | 0.459 ± 0.190 | 0.002 |
| HIP2 | 0.043 ± 0.014 | 0.046 ± 0.012 | 0.408 |
| EGF | 0.009 ± 0.010 | 0.006 ± 0.003 | 0.153 |
| HSPB8 | 0.003 ± 0.005 | 0.001 ± 0.001 | 0.128 |
| PSMA7 | 0.580 ± 0.126 | 0.564 ± 0.149 | 0.639 |
| BCL11B | 0.148 ± 0.067 | 0.144 ± 0.057 | 0.818 |
| ST13 | 1.075 ± 0.319 | 1.053 ± 0.519 | 0.821 |
| C3 | 0.010 ± 0.003 | 0.011 ± 0.004 | 0.117 |
| CSF1 | 0.080 ± 0.038 | 0.092 ± 0.070 | 0.349 |
| APOA1 | 0.001 ± 0.000 | 0.001 ± 0.000 | 0.808 |
| FAS | 0.018 ± 0.010 | 0.021 ± 0.013 | 0.330 |
| CR2 | 0.007 ± 0.003 | 0.006 ± 0.004 | 0.309 |
| C3AR1 | 0.152 ± 0.087 | 0.144 ± 0.075 | 0.680 |
| NLRP1 | 0.527 ± 0.137 | 0.548 ± 0.200 | 0.601 |
| NLRP3 | 0.074 ± 0.026 | 0.087 ± 0.038 | 0.116 |
| Nrf2 | 0.596 ± 0.136 | 0.650 ± 0.222 | 0.200 |
| HMOX1 | 0.248 ± 0.082 | 0.264 ± 0.084 | 0.435 |
| HMOX2 | 0.112 ± 0.040 | 0.094 ± 0.031 | 0.058 |
| GCLM | 0.016 ± 0.009 | 0.018 ± 0.013 | 0.326 |
| BAD | 0.020 ± 0.007 | 0.018 ± 0.007 | 0.323 |
| NQO1 | 0.014 ± 0.016 | 0.014 ± 0.025 | 0.888 |
| LRPPRC | 0.007 ± 0.010 | 0.006 ± 0.010 | 0.684 |
| PSMA2 | 0.006 ± 0.004 | 0.007 ± 0.004 | 0.414 |
| PPARGC1A | 0.005 ± 0.010 | 0.004 ± 0.013 | 0.771 |
| C4A | 0.007 ± 0.003 | 0.007 ± 0.004 | 0.680 |
| C4B | 0.103 ± 0.168 | 0.103 ± 0.181 | 0.998 |
| C1qA | 0.026 ± 0.014 | 0.026 ± 0.016 | 0.986 |
| C5AR1 | 3.929 ± 1.122 | 4.022 ± 2.105 | 0.807 |
| CASP1 | 0.475 ± 0.179 | 0.570 ± 0.253 | 0.067 |
| IL-1beta | 0.347 ± 0.208 | 0.399 ± 0.258 | 0.352 |
| CASP3 | 0.092 ± 0.043 | 0.096 ± 0.038 | 0.723 |
| CASP6 | 1.178 ± 5.757 | 0.024 ± 0.013 | 0.326 |
| HSF1 | 0.167 ± 0.041 | 0.162 ± 0.055 | 0.683 |
| HSP90AA1 | 0.274 ± 0.129 | 0.270 ± 0.118 | 0.914 |
| OPA1 | 0.022 ± 0.012 | 0.022 ± 0.010 | 0.820 |
| MFN1 | 0.037 ± 0.024 | 0.040 ± 0.018 | 0.557 |
| MFN2 | 0.069 ± 0.028 | 0.081 ± 0.033 | 0.115 |
| HSPA5 | 0.047 ± 0.032 | 0.057 ± 0.060 | 0.334 |
| HSPB1 | 0.227 ± 0.098 | 0.211 ± 0.119 | 0.542 |
| HSPD1 | 0.229 ± 0.085 | 0.200 ± 0.085 | 0.181 |
| DNM1L | 0.019 ± 0.010 | 0.020 ± 0.008 | 0.588 |
| BCL2 | 0.071 ± 0.034 | 0.069 ± 0.034 | 0.796 |
| BID | 0.490 ± 0.303 | 0.478 ± 0.156 | 0.849 |
| GSS | 0.049 ± 0.009 | 0.047 ± 0.012 | 0.688 |
| GSR | 0.180 ± 0.055 | 0.188 ± 0.053 | 0.550 |
| IKBKB | 0.100 ± 0.030 | 0.088 ± 0.028 | 0.122 |
| CASP9 | 0.046 ± 0.023 | 0.045 ± 0.022 | 0.857 |
| DNAJB1 | 0.250 ± 0.078 | 0.257 ± 0.087 | 0.749 |
| NRF1 | 0.011 ± 0.005 | 0.012 ± 0.004 | 0.825 |
| Control (n = 61) | PD | |||
|---|---|---|---|---|
| Early Stage (n = 81) | Advanced Stage (n = 20) | Total (n = 101) | ||
| Age, year | 67.18 ± 8.06 | 65.31 ± 10.72 | 73.00 ± 9.18 b,c | 66.83 ± 10.87 |
| Male, No (%) | 30 (49.18 %) | 42 (51.86%) | 11 (55.00%) | 53 (52.48%) |
| Age at onset | 61.78 ±15.83 | 61.05 ± 13.78 | 61.63 ±15.45 | |
| Duration of PD | 5.47 ± 7.94 | 12.31 ± 6.23 | 6.83 ± 8.10 | |
| BMI | 24.14 ± 3.04 | 24.51 ± 3.45 | 23.67 ± 3.39 | 24.35 ± 3.45 |
| Pre-prandial Glucose, mg/dL | 99.32 ± 11.16 | 105.40 ± 22.67 | 99.35 ± 19.59 | 104.20 ± 22.22 |
| Glycohemoglobin, % | 5.87 ± 0.42 | 6.00 ± 0.66 | 5.81 ± 0.37 | 5.96 ± 0.62 |
| Albumin, mg/dL | 4.43 ± 0.20 | 4.46 ± 0.22 | 4.24 ± 0.25 | 4.42 ± 0.24 |
| Total cholesterol, mg/dL | 184.14 ± 28.94 | 177.05 ± 35.36 | 166.70 ± 29.19 | 175.00 ± 34.47 |
| LDL-C, mg/dL | 107.84 ± 27.71 | 104.35 ± 31.09 | 95.15 ± 30.32 | 102.52 ± 31.75 |
| HDL-C, mg/dL | 55.13 ± 13.99 | 53.19 ± 15.53 | 53.50 ± 12.73 | 53.25 ± 15.02 |
| Triglyceride, mg/dL | 103.87 ± 63.02 | 112.74 ± 60.98 | 89.35 ± 37.45 | 108.11 ± 57.86 |
| Creatinine, mg/dL | 0.78 ± 0.22 | 0.89 ± 0.38 | 0.79 ± 0.24 | 0.87 ± 0.36 |
| MMSE | 29.51 ± 0.88 | 27.47 ± 3.69 b | 21.75 ± 6.50 b,c | 26.34 ± 4.95 a |
| MoCA | 27.56 ± 4.26 | 24.59 ± 5.54 b | 17.70 ± 8.33 b,c | 23.23 ± 6.77 a |
| CDR | 0.20 ± 0.24 | 0.31 ± 0.24 b | 0.68 ± 0.36 b,c | 0.39 ± 0.31 a |
| BDI-II | 1.64 ± 2.86 | 6.26 ± 1.89 b | 15.40 ± 7.64 b,c | 8.07 ± 6.63 a |
| HAM-D | 1.61 ± 2.68 | 5.15 ± 3.68 b | 10.35 ± 6.52 b,c | 6.18 ± 4.86 a |
| ADL | 98.11 ± 10.79 | 99.69 ± 1.44 | 71.00 ± 27.18 b.c | 94.01 ± 16.69 |
| PDQ-39 | 5.72 ± 8.15 | 23.09 ± 18.22 b | 66.95 ± 32.36 b,c | 31.77 ± 27.92 a |
| NPI | 0.52 ± 1.68 | 1.98 ± 2.83 | 7.20 ± 7.28 b,c | 3.01 ± 4.61 a |
| UPDRS | ||||
| Total | 1.54 ± 2.17 | 28.46 ± 13.26 | 70.45 ± 25.15 b,c | 36.68 ± 23.94 a |
| Part III | 0.38 ± 1.20 | 17.63 ± 9.26 | 42.42 ± 15.19 b,c | 22.44 ± 14.49 a |
| LEDD | 445.91 ± 429.28 | 1306.55 ± 65.57 d | 616.34 ± 592.05 | |
| α-Synuclein (Femtomolar) | 110.70 ± 65.78 | 186.22 ± 157.41 b | 205.64 ± 166.69 b | 190.07 ± 159.53 a |
| Relative gene expression | ||||
| APAF1 | 0.26 ± 0.11 | 0.32 ± 0.18 b | 0.43 ± 0.16 b,c | 0.34 ± 0.18 a |
| CR1 | 0.10 ± 0.06 | 0.12 ± 0.08 | 0.10 ± 0.06 | 0.12 ± 0.07 |
| CSF1R | 0.33 ± 0.10 | 0.38 ± 0.13 b | 0.37 ± 0.08 b | 0.38 ± 0.12 a |
| ALDH1A1 | 0.08 ± 0.03 | 0.10 ± 0.09 | 0.8 ± 0.04 | 0.10 ± 0.08 |
| Gene Symbol | Gene Primer (5’→3’) | |
|---|---|---|
| ALDH1A1 | aldehyde dehydrogenase 1 family member A1 | F-gttgtcaaaccagcagagca R-caagtcggcatcagctaaca |
| CR1 | complement C3b/C4b receptor 1 | F-cccgaactctgcaaacaaat R-gtttagcacgaggcagaagg |
| CSF1R | colony-stimulating factor 1 receptor | F-aaggtggctgtgaagatgct R-ccttccttcgcagaaagttg |
| APAF1 | apoptotic peptidase activating factor 1 | F-tggccttcagcagttctttt R-gggagcaggaatagtgtcca |
| HIP2 | ubiquitin-conjugating enzyme E2 K(UBE2K) | F-ggtgtggcacagtttgtcag R-caccacaacaaagcaccatc |
| EGF | epidermal growth factor | F-tagctcagtgcagcctcaaa R-gcaccatggctaatgcctat |
| HSPB8 | heat shock protein family B (small) member 8 | F-acagccaggaagtcacctgt R-ggcctaacacaaccaagcat |
| PSMA7 | proteasome 20S subunit alpha 7 | F-tgatggcactcctaggctct R-gcctcatgacagcaagttca |
| BCL11B | BCL11 transcription factor B | F-ggagggaatgggagagaaag R-ggatcatctgcttccgtgtt |
| ST13 | ST13 Hsp70 interacting protein | F-ctggaatgcctggactcaat R-aggttgcttttccttcagca |
| C3 | complement C3 | F-ggaaaaggaggatggaaagc R-caatggccatgatgtactcg |
| CSF1 | colony-stimulating factor 1 | F-ggagacctcgtgccaaatta R-ggccttgtcatgctcttcat |
| APOA1 | apolipoprotein A1 | F-tggatgtgctcaaagacagc R-tcacctcctccagatccttg |
| FAS | Fas cell surface death receptor | F-gccacctttcttttctgcaa R-actggagagcagacagcaca |
| CR2 | complement C3d receptor 2 | F-caaggcacaattccttggtt R-ctccaggtgcctctttcttg |
| C3AR1 | complement C3a receptor 1 | F-tcccttcctttatgccctct R-gtttttgaagtccgctgctc |
| NLRP1 | NLR family pyrin domain containing 1 | F-ccagaaacctgaaggagctg R-tgagcacattgaagctcagg |
| NLRP3 | NLR family pyrin domain containing 3 | F-aaaggaagtggactgcgaga R-ctggtttaccaggccaaaga |
| Nrf2 | NFE2 like bZIP transcription factor 2(NFE2L2) | F-catgccctcacctgctactt R-tgttctggtgatgccacact |
| HMOX1 | heme oxygenase 1 | F-tccgatgggtccttacactc R-taaggaagccagccaagaga |
| HMOX2 | heme oxygenase 2 | F-tccggtagtccctgtttttg R-ttctgggtgagagggatgag |
| GCLM | glutamate-cysteine ligase modifier subunit | F-tcctacctgcaccctcaact R-tgtgaacatcagcctggaaa |
| BAD | BCL2 associated agonist of cell death | F-caggcctatgcaaaaagagg R-taaacctggctcgcgactta |
| NQO1 | NAD(P)H quinone dehydrogenase 1 | F-ttactatgggatggggtcca R-tttcaatgcaccacaagagg |
| LRPPRC | leucine-rich pentatricopeptide repeat containing | F-cttggcccagtggacatagt R-gaggctgaggcacaagaatc |
| PSMA2 | proteasome 20S subunit alpha 2 | F-gccctcttcgctatcagatg R-accaacaggaaccagcaaac |
| PPARGC1A | PPARG coactivator 1 alpha | F-tttccttttgccatggaatc R-gaaagaaccgctgaacaagc |
| C4A | complement C4A (Rodgers blood group) | F-cccaatatgatccctgatgg R-ccactgctctgtcttgtcca |
| C4B | complement C4B (Chido blood group) | F-acggcttccaggttaaggtt R-ctcctcgatccagctattcg |
| C1qA | complement C1q A chain | F-gaaatctgcctgtccatcgt R-gcagatgggaagatgaggaa |
| C5AR1 | complement C5a receptor 1 | F-atgccatctggttcctcaac R-caggaaggagggtatggtca |
| CASP1 | caspase 1 | F-tgttcctgtgatgtggagga R-tgcccacagacattcatacag |
| IL-1beta | interleukin 1 beta | F-ttcgacacatgggataacga R-tctttcaacacgcaggacag |
| CASP3 | caspase 3 | F-tttttcagaggggatcgttg R-cggcctccactggtatttta |
| CASP6 | caspase 6 | F-gaagcaggttccctgttttg R-ctcccaaagtgctgggatta |
| HSF1 | heat shock transcription factor 1 | F-gacataaagatccgccagga R-ctgcaccagtgagatcagga |
| HSP90AA1 | heat shock protein 90kDa alpha family class A member 1 | F-ggcagaggctgataagaacg R-ttcttccatgcgtgatgtgt |
| OPA1 | OPA1, mitochondrial dynamin-like GTPase | F-ccacagatttctcccaagga R-attactgtggggcatggaga |
| MFN1 | mitofusin 1 | F-tggggctgtgagctcttaat R-acactccttggtggttccag |
| MFN2 | mitofusin 2 | F-tgttggctcagtgcttcatc R-aagtccctccttgtcccagt |
| HSPA5 | heat shock protein family A (Hsp70) member 5 | F-tttcacagtgcccaagagtg R-tgatcactcactccccatca |
| HSPB1 | heat shock protein family B (small) member 1 | F-acgagatcaccatcccagtc R-tttgacaggtggttgctttg |
| HSPD1 | heat shock protein family D (Hsp60) member 1 | F-ttcaggttgtggcagtcaag R-tggtcacaatgacctctcca |
| DNM1L | dynamin 1-like | F-cagtgtgccaaaggcagtaa R-gatgagtctcccggatttca |
| BCL2 | B-cell CLL/lymphoma 2 | F-aagattgatgggatcgttgc R-gcggaacacttgattctggt |
| BID | BH3 interacting domain death agonist | F-gcaggcctaccctagagaca R-tccatcccatttctggctaa |
| GSS | glutathione synthetase | F-accgctcgtctctttgacat R-ttgccagcttctttggtctt |
| GSR | glutathione reductase | F-agtgggactcacggaagatg R-ttcactgcaacagcaaaacc |
| IKBKB | inhibitor of nuclear factor kappa B kinase subunit beta | F-agcatgaatgcctctcgact R-gccgtgaaactctggtcttg |
| CASP9 | caspase 9 | F-ttccctcattttgctccaac R-tggtgcacgcctgtagtaag |
| DNAJB1 | DnaJ heat shock protein family (Hsp40) member B1 | F-acagtgaacgtccccactct R-agtccttggggagctcagat |
| NRF1 | nuclear respiratory factor 1 | F-gtggcaggacttctttctgc R-taattccatgcgggtttcat |
| GAPDH | gyceraldehyde-3-phosphate dehydrogenase | F-cgagatccctccaaaatcaa R-ttcacacccatgacgaacat |
Disclaimer/Publisher’s Note: The statements, opinions and data contained in all publications are solely those of the individual author(s) and contributor(s) and not of MDPI and/or the editor(s). MDPI and/or the editor(s) disclaim responsibility for any injury to people or property resulting from any ideas, methods, instructions or products referred to in the content. |
© 2023 by the authors. Licensee MDPI, Basel, Switzerland. This article is an open access article distributed under the terms and conditions of the Creative Commons Attribution (CC BY) license (https://creativecommons.org/licenses/by/4.0/).
Share and Cite
Chang, K.-H.; Liu, C.-H.; Wang, Y.-R.; Lo, Y.-S.; Chang, C.-W.; Wu, H.-C.; Chen, C.-M. Upregulation of APAF1 and CSF1R in Peripheral Blood Mononuclear Cells of Parkinson’s Disease. Int. J. Mol. Sci. 2023, 24, 7095. https://doi.org/10.3390/ijms24087095
Chang K-H, Liu C-H, Wang Y-R, Lo Y-S, Chang C-W, Wu H-C, Chen C-M. Upregulation of APAF1 and CSF1R in Peripheral Blood Mononuclear Cells of Parkinson’s Disease. International Journal of Molecular Sciences. 2023; 24(8):7095. https://doi.org/10.3390/ijms24087095
Chicago/Turabian StyleChang, Kuo-Hsuan, Chia-Hsin Liu, Yi-Ru Wang, Yen-Shi Lo, Chun-Wei Chang, Hsiu-Chuan Wu, and Chiung-Mei Chen. 2023. "Upregulation of APAF1 and CSF1R in Peripheral Blood Mononuclear Cells of Parkinson’s Disease" International Journal of Molecular Sciences 24, no. 8: 7095. https://doi.org/10.3390/ijms24087095
APA StyleChang, K.-H., Liu, C.-H., Wang, Y.-R., Lo, Y.-S., Chang, C.-W., Wu, H.-C., & Chen, C.-M. (2023). Upregulation of APAF1 and CSF1R in Peripheral Blood Mononuclear Cells of Parkinson’s Disease. International Journal of Molecular Sciences, 24(8), 7095. https://doi.org/10.3390/ijms24087095