

A Guide to Perform 3D Histology of Biological Tissues with Fluorescence Microscopy

 , , ,
, , ,  , , and
Abstract
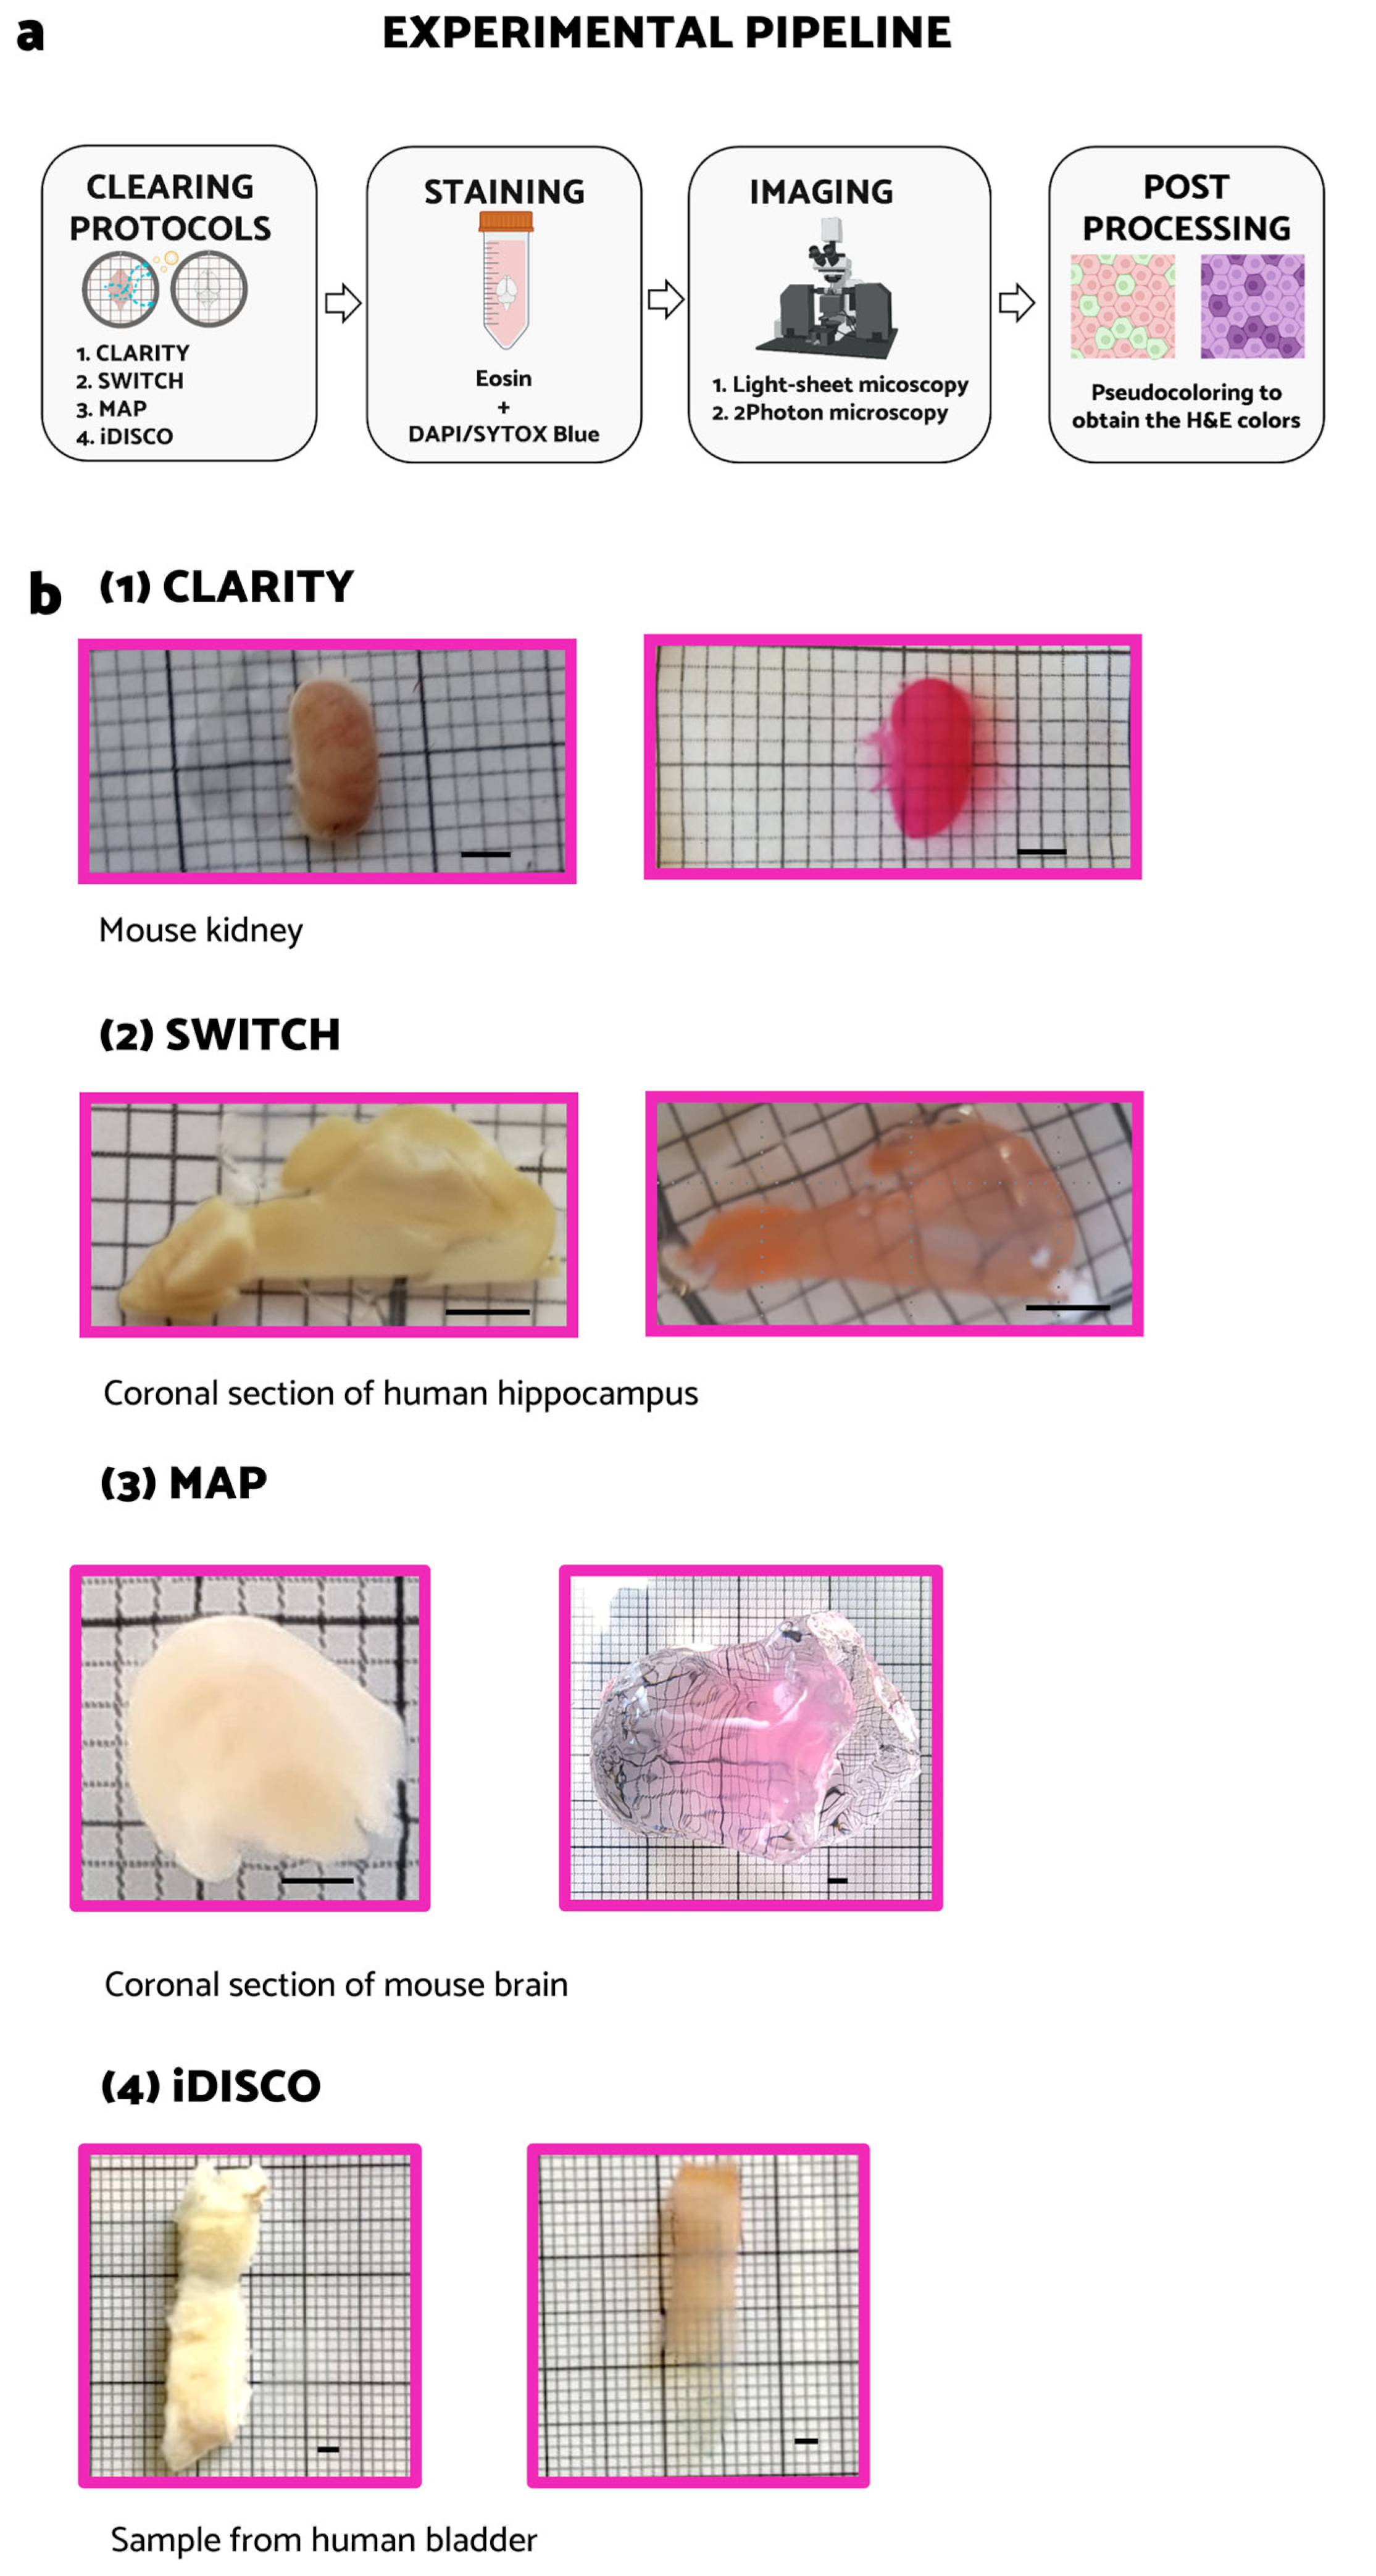
1. Introduction
Literature Review
2. Results
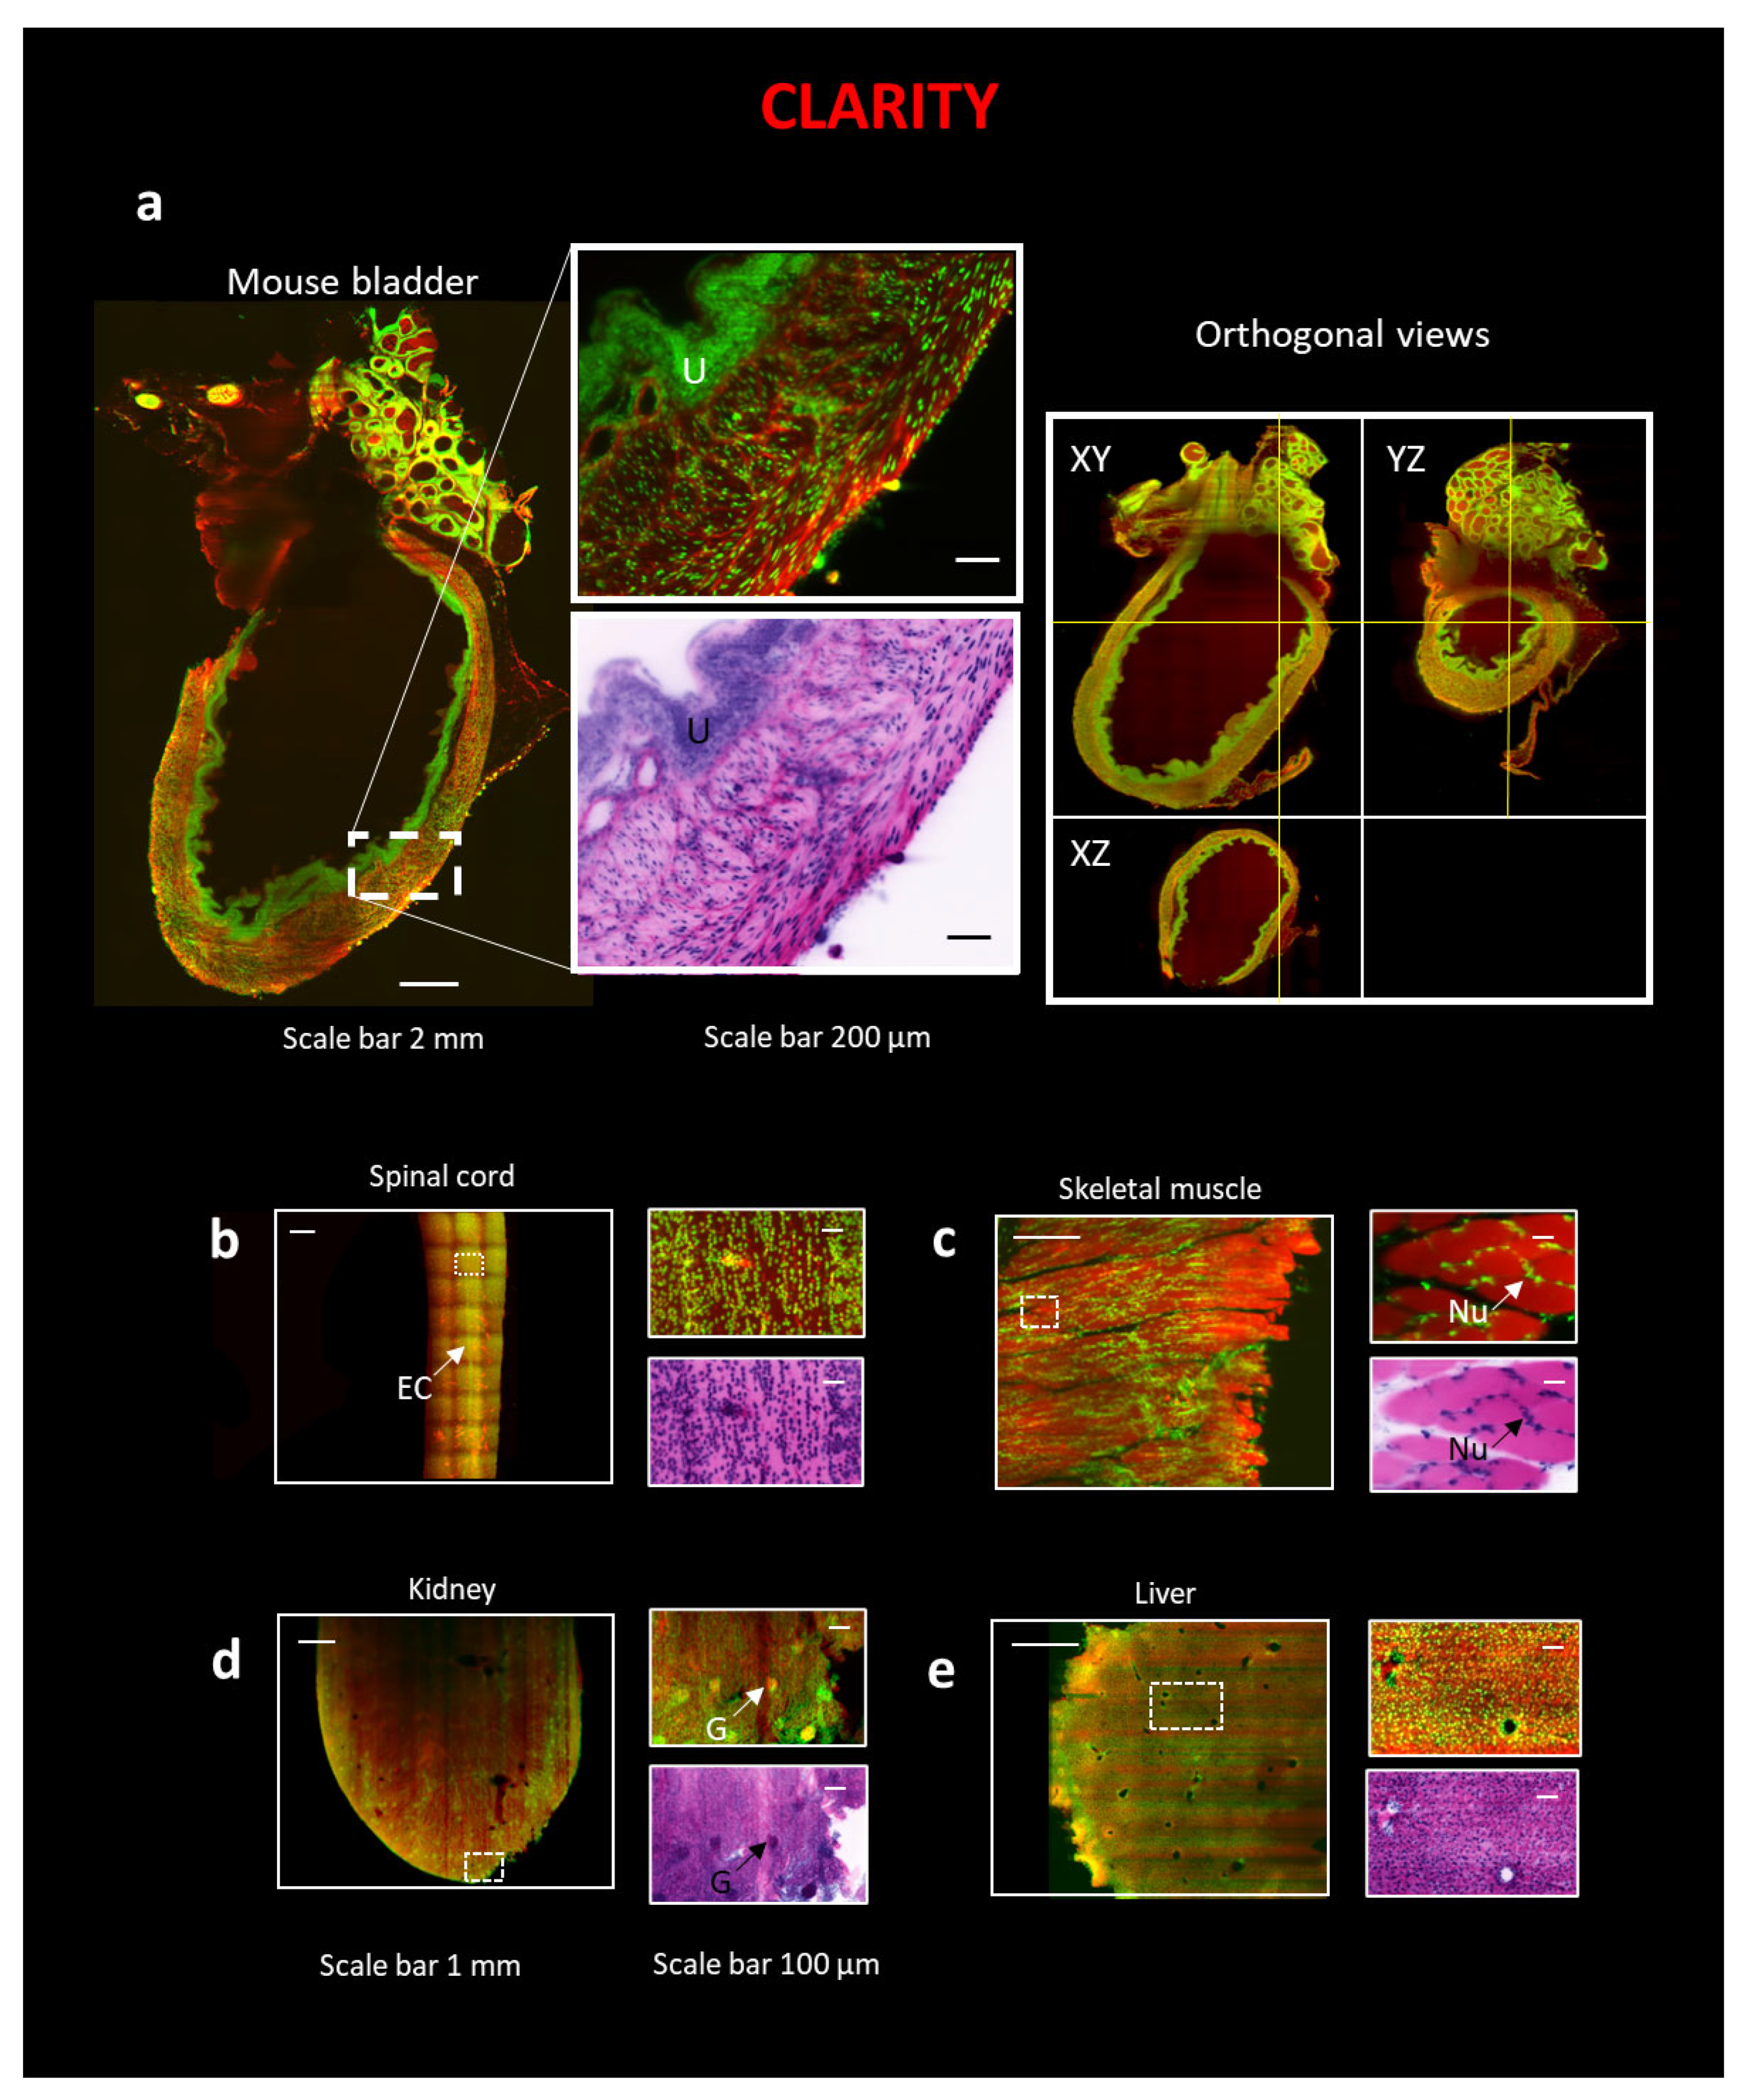
2.1. Eosin/SYTOX Blue Staining on CLARITY-Processed Samples
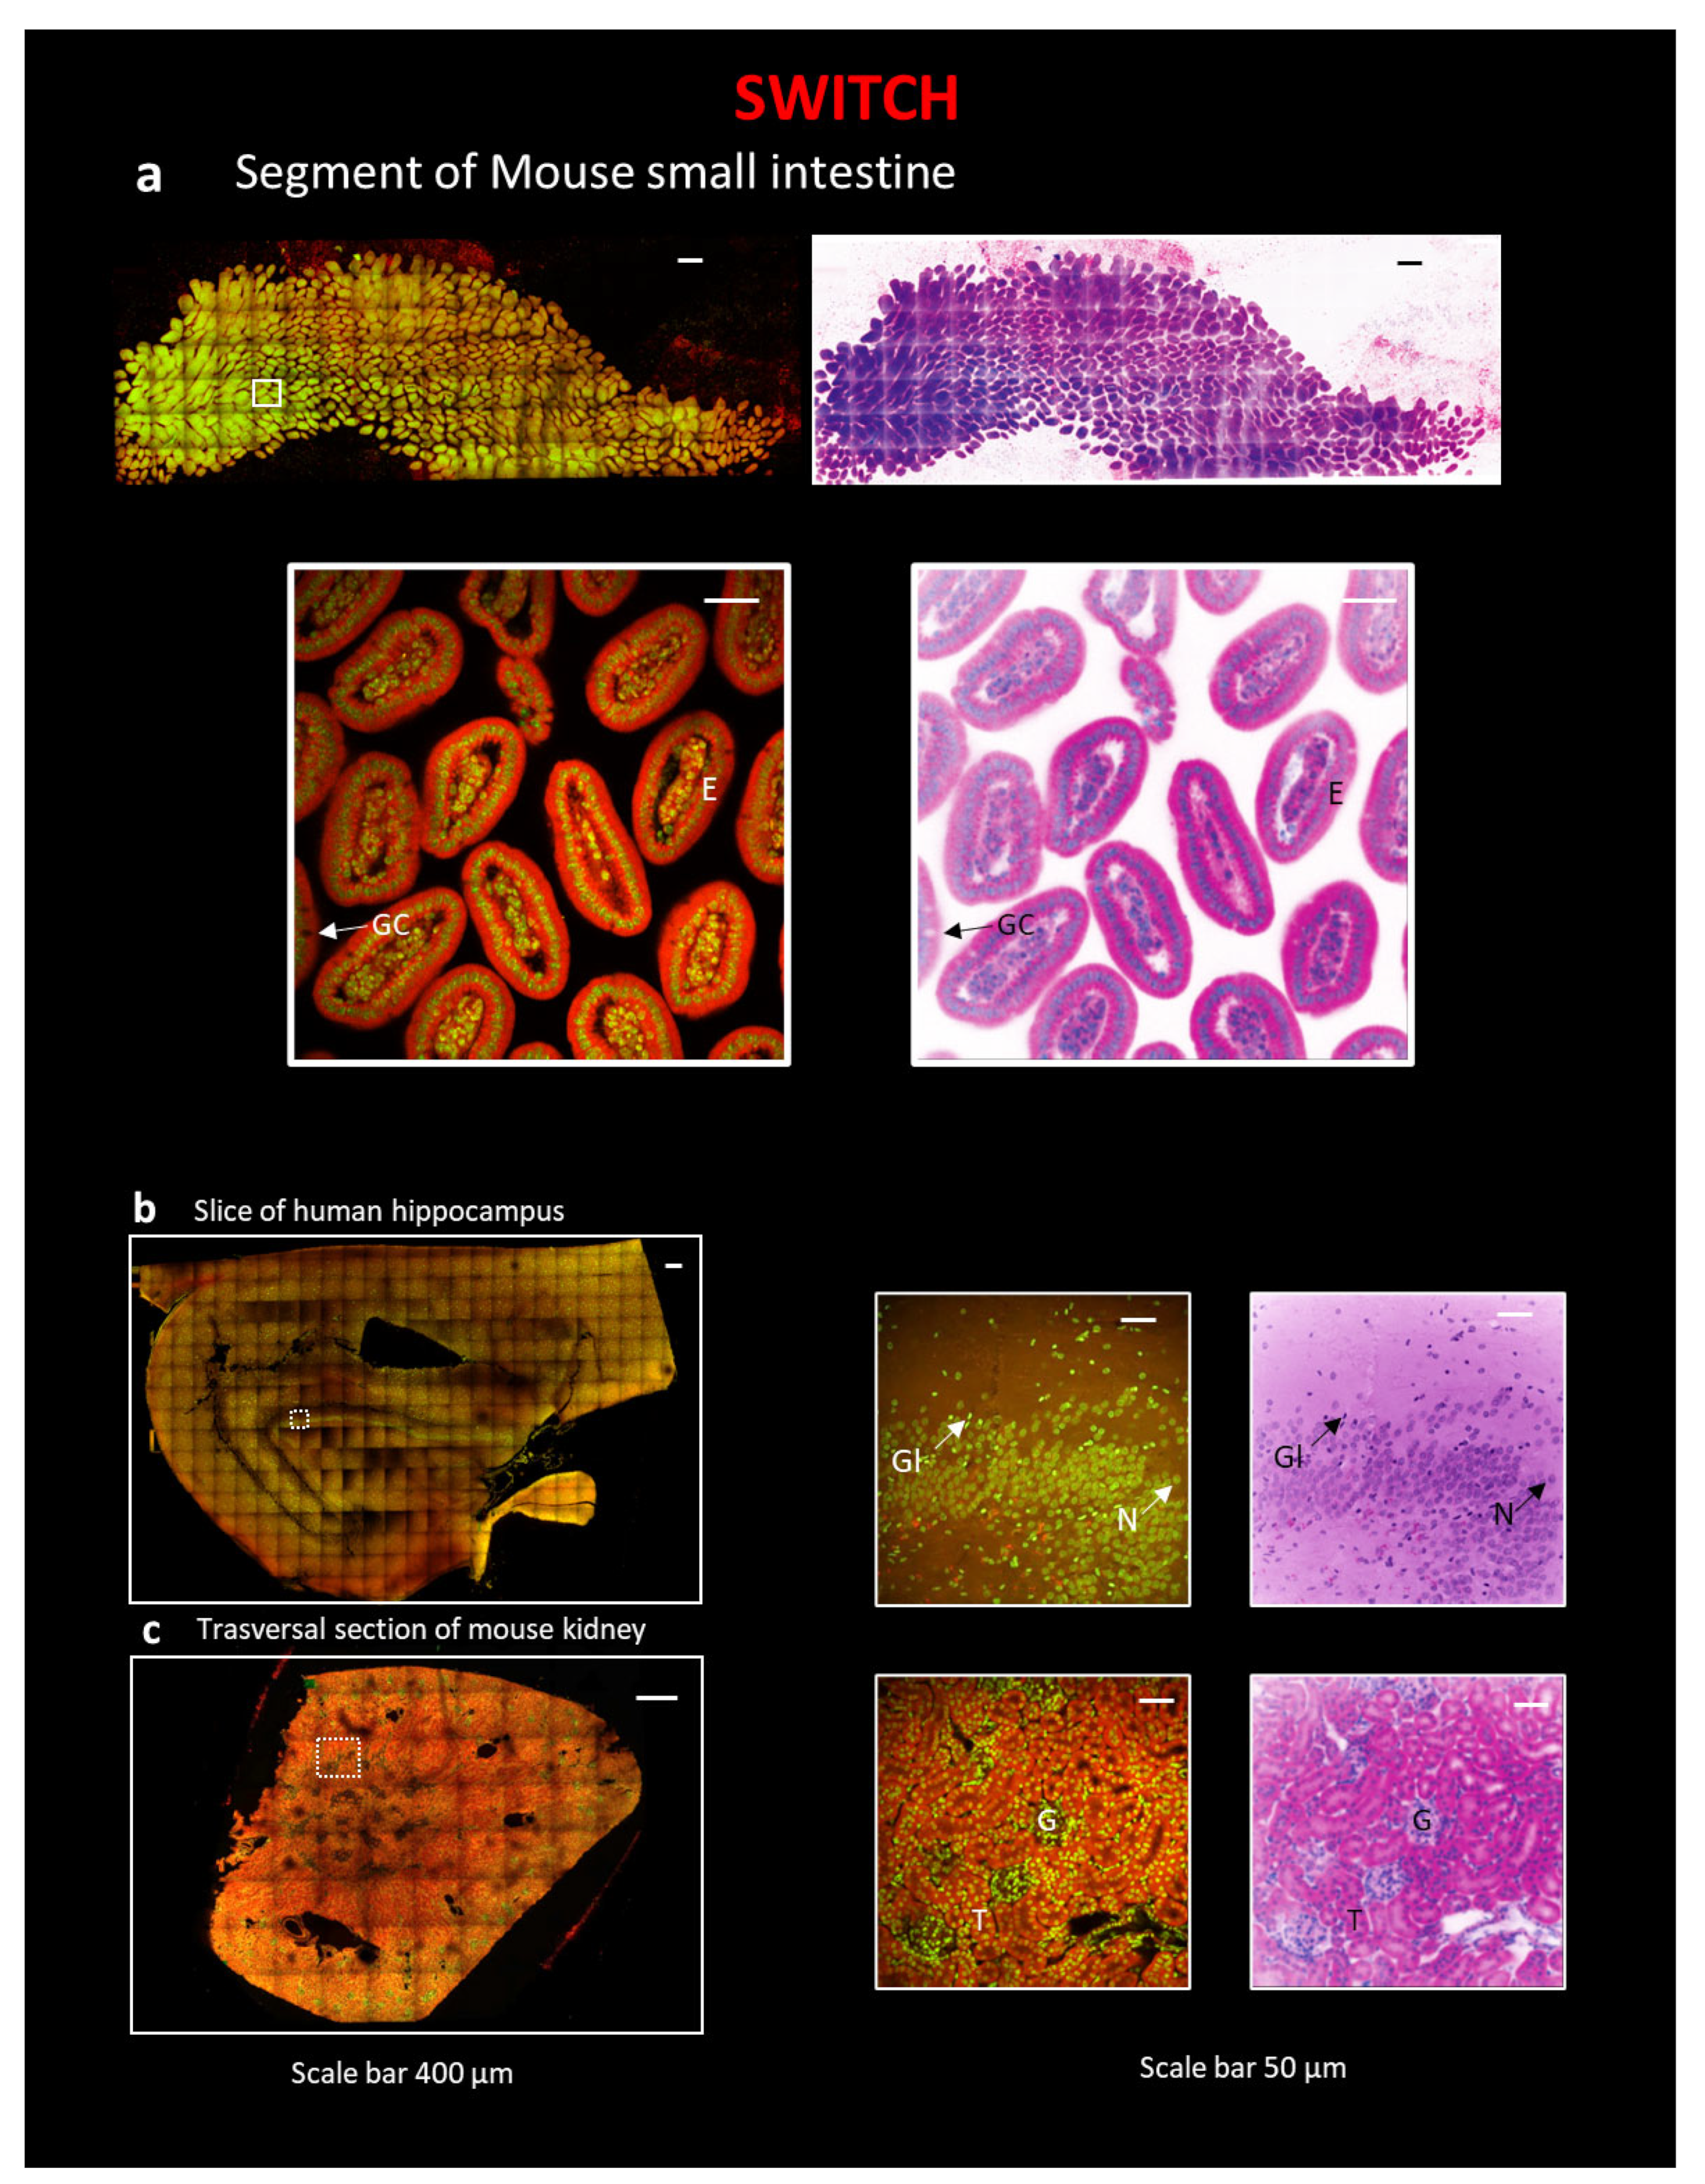
2.2. Eosin/DAPI Staining on SWITCH-Processed Sample
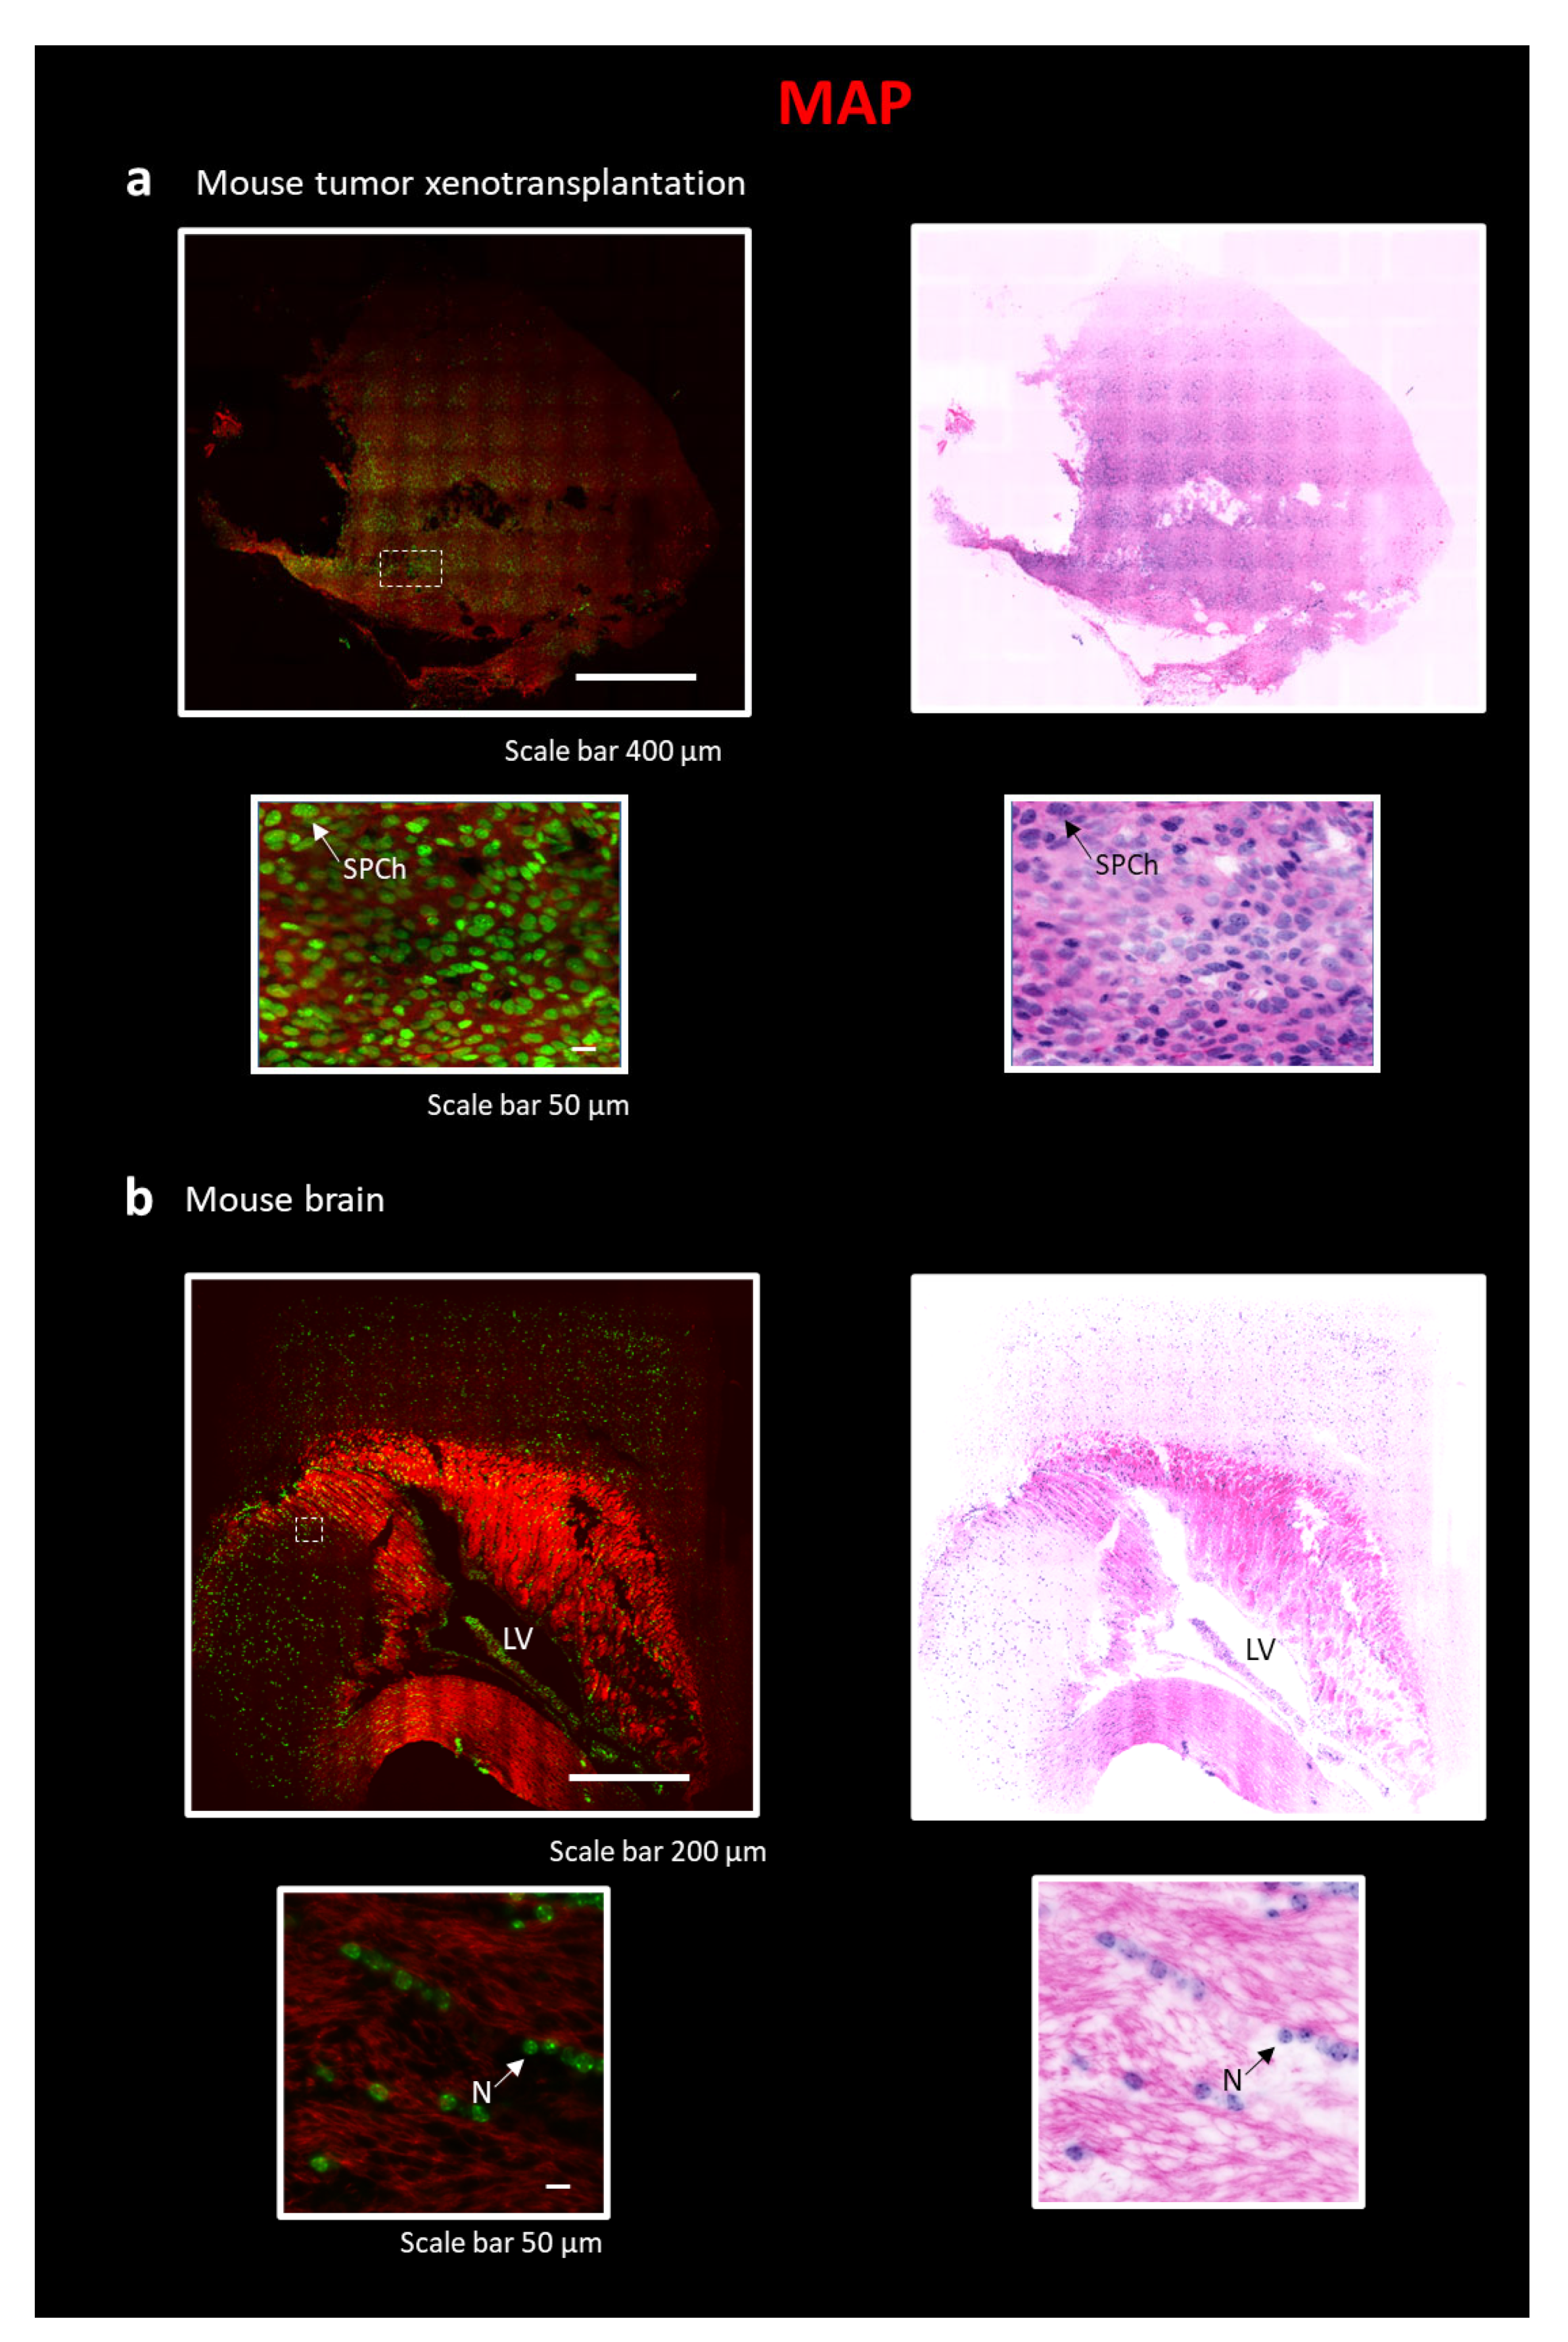
2.3. Eosin/SYTOX Blue Staining on MAP-Processed Sample
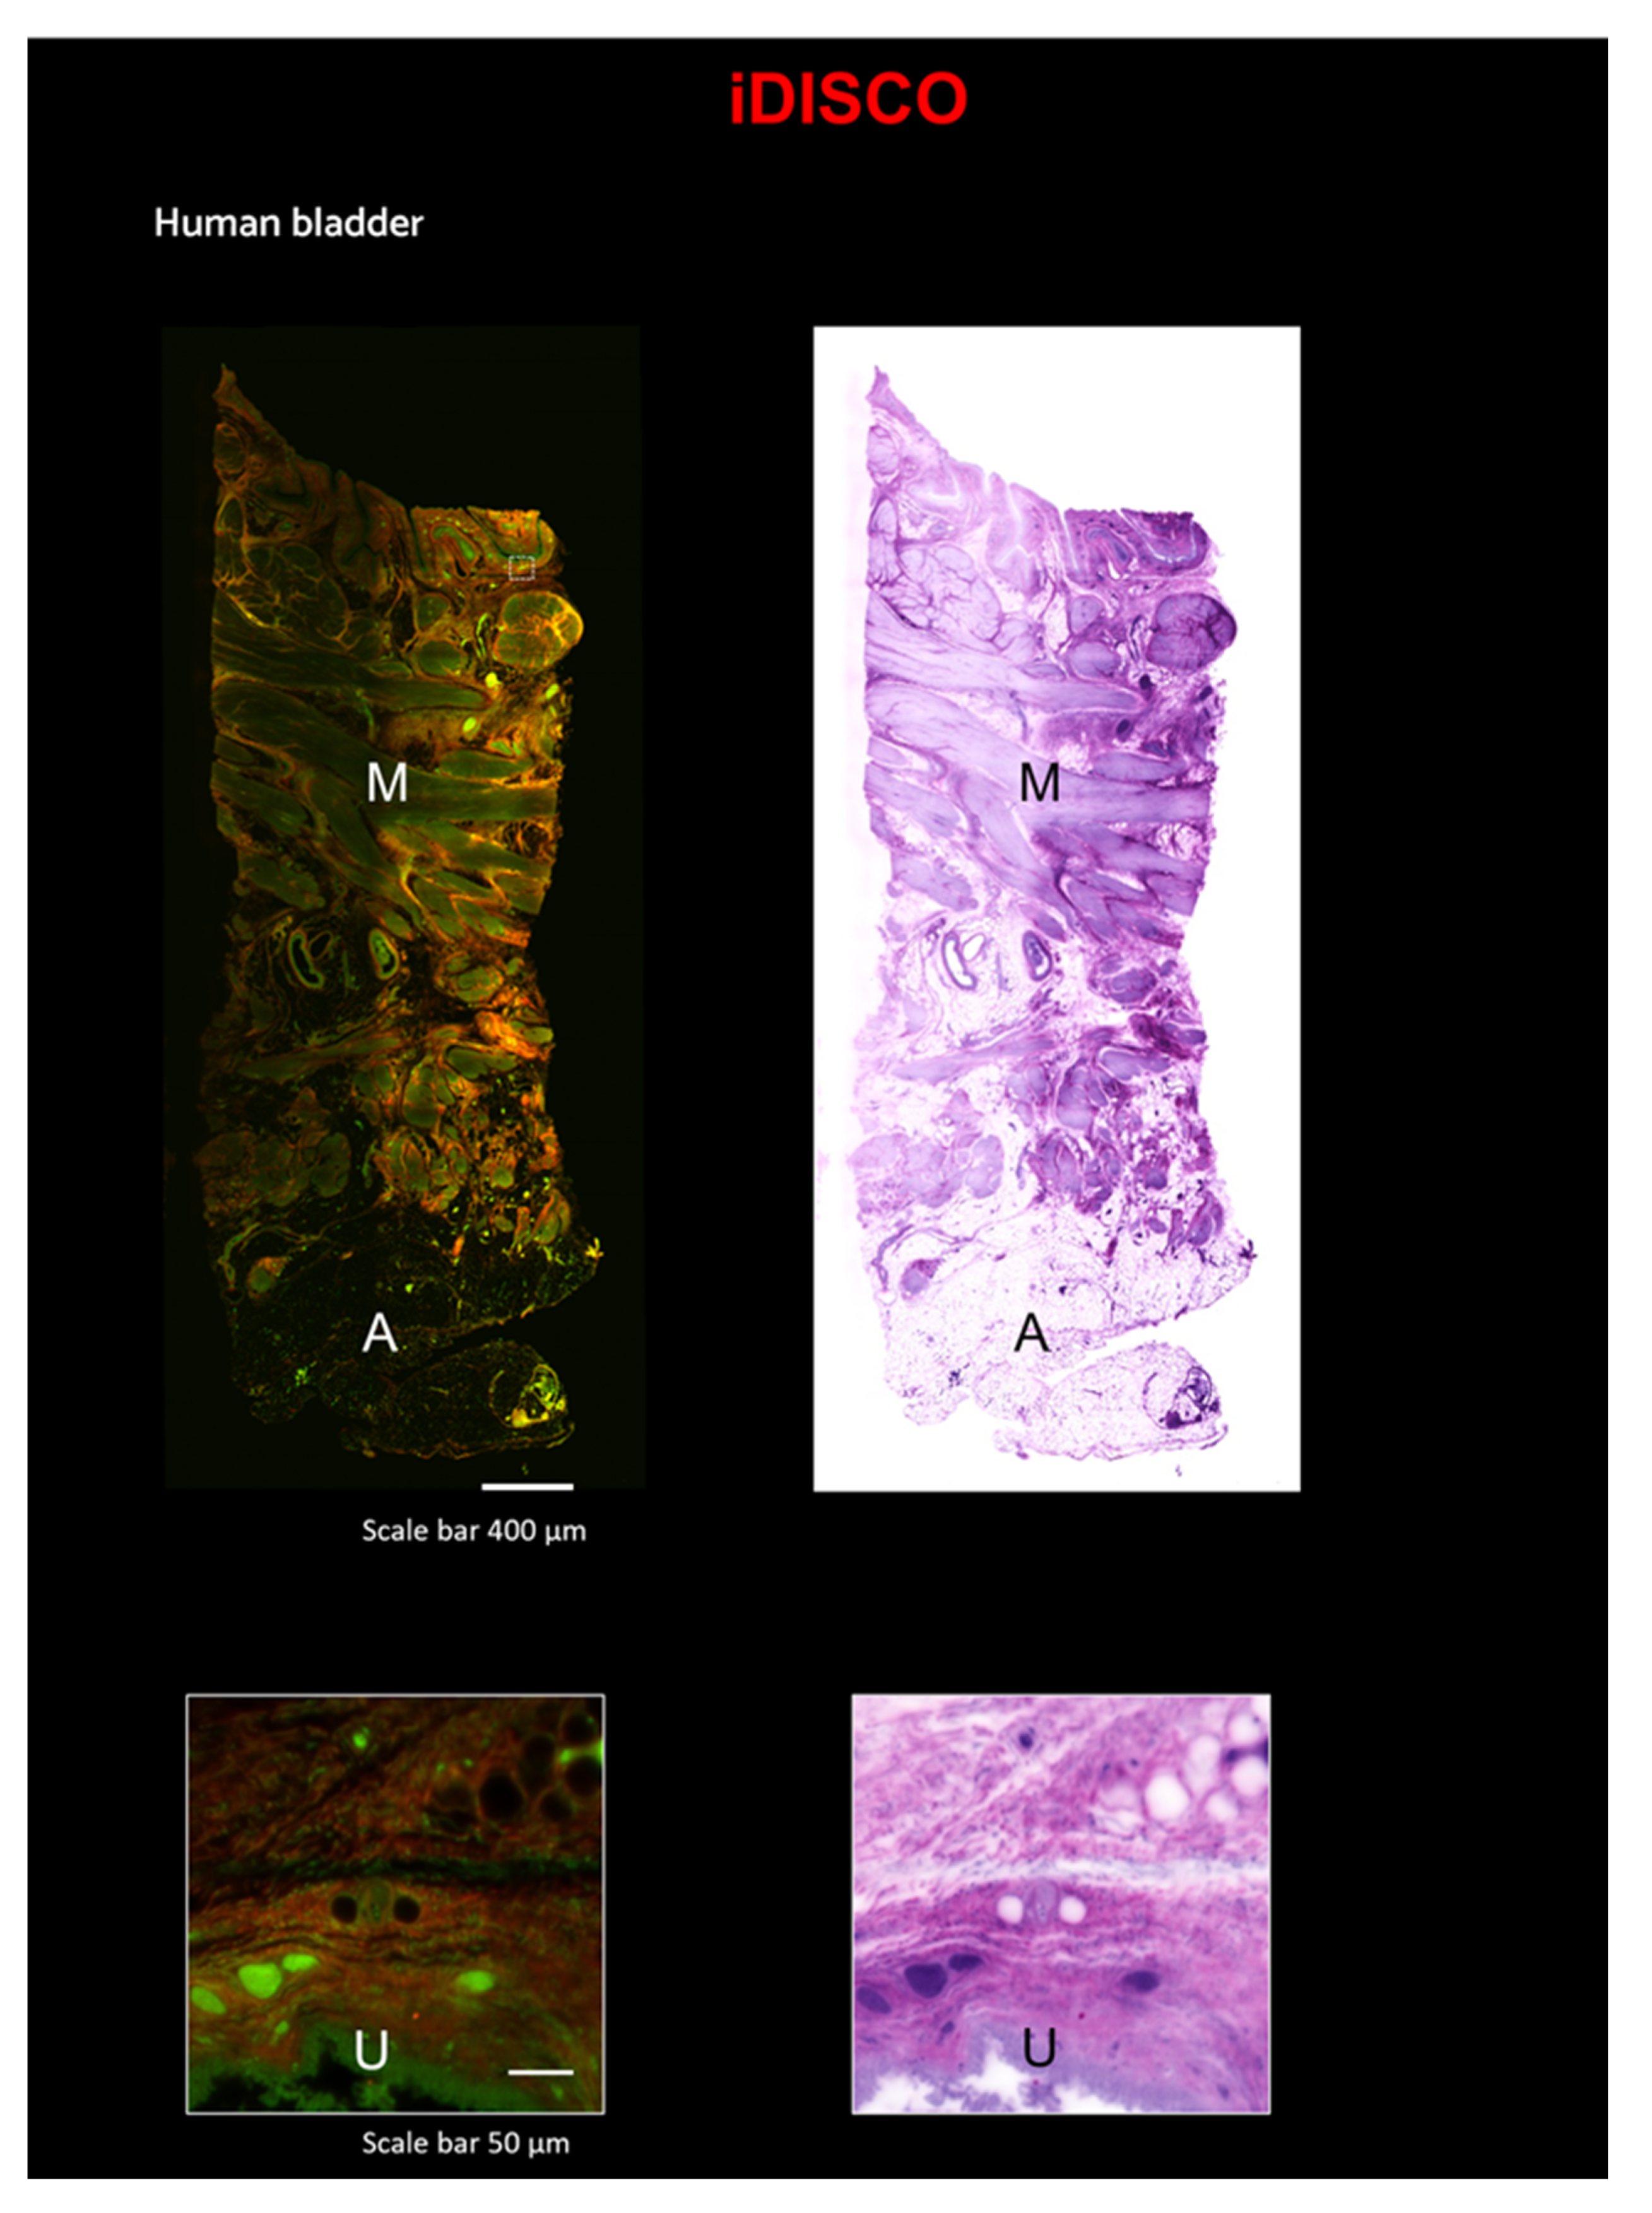
2.4. Eosin/SYTOX Blue Staining on iDISCO-Processed Sample
3. Discussion
4. Materials and Methods
4.1. Specimens Collection
4.2. Animals Tissue Preparation
4.3. CLARITY Clearing Protocol
4.4. Human Brain and Mouse Slices Preparation for SWITCH
4.5. Deparaffinization from Formalin-Fixed Paraffin-Embedded (FFPE) Tissue
4.6. MAP
4.7. iDISCO Clearing Protocol
4.8. Light Sheet Microscopy
4.9. Two Photon Fluorescence Microscope
4.10. Stitching and Pseudocoloring
Supplementary Materials
Author Contributions
Funding
Institutional Review Board Statement
Informed Consent Statement
Data Availability Statement
Acknowledgments
Conflicts of Interest
References
- Liu, J.T.C.; Glaser, A.K.; Bera, K.; True, L.D.; Reder, N.P.; Eliceiri, K.W.; Madabhushi, A. Harnessing non-destructive 3D pathology. Nat. Biomed. Eng. 2021, 5, 203–218. [Google Scholar] [CrossRef] [PubMed]
- Kiemen, A.L.; Damanakis, A.I.; Braxton, A.M.; He, J.; Laheru, D.; Fishman, E.K.; Chames, P.; Pérez, C.A.; Wu, P.H.; Wirtz, D.; et al. Tissue clearing and 3D reconstruction of digitized, serially sectioned slides provide novel insights into pancreatic cancer. Med 2023, 4, 75–91. [Google Scholar] [CrossRef] [PubMed]
- Franceschini, A.; Costantini, I.; Pavone, F.S.; Silvestri, L. Dissecting Neuronal Activation on a Brain-Wide Scale with Immediate Early Genes. Front. Neurosci. 2020, 14, 569517. [Google Scholar] [CrossRef] [PubMed]
- Carlson, R.O.; Amirahmadi, F.; Hernandez, J.S. A primer on the cost of quality for improvement of laboratory and pathology specimen processes. Am. J. Clin. Pathol. 2012, 138, 347–354. [Google Scholar] [CrossRef]
- Silvestri, L.; Costantini, I.; Sacconi, L.; Pavone, F.S. Clearing of fixed tissue: A review from a microscopist’s perspective. J. Biomed. Opt. 2016, 21, 081205. [Google Scholar] [CrossRef] [PubMed]
- Costantini, I.; Cicchi, R.; Silvestri, L.; Vanzi, F.; Pavone, F.S. In-vivo and ex-vivo optical clearing methods for biological tissues: Review. Biomed. Opt. Express 2019, 10, 5251–5267. [Google Scholar] [CrossRef]
- Matryba, P.; Kaczmarek, L.; Gołąb, J. Advances in Ex Situ Tissue Optical Clearing. Laser Photonics Rev. 2019, 13, 1800292. [Google Scholar] [CrossRef]
- Scardigli, M.; Pesce, L.; Brady, N.; Mazzamuto, G.; Gavryusev, V.; Silvestri, L.; Hof, P.R.; Destrieux, C.; Costantini, I.; Pavone, F.S. Comparison of Different Tissue Clearing Methods for Three-Dimensional Reconstruction of Human Brain Cellular Anatomy Using Advanced Imaging Techniques. Front. Neuroanat. 2021, 15, 752234. [Google Scholar] [CrossRef]
- Ueda, H.R.; Ertürk, A.; Chung, K.; Gradinaru, V.; Chédotal, A.; Tomancak, P.; Keller, P.J. Tissue clearing and its applications in neuroscience. Nat. Rev. Neurosci. 2020, 21, 61–79. [Google Scholar] [CrossRef]
- Pesce, L.; Scardigli, M.; Gavryusev, V.; Laurino, A.; Mazzamuto, G.; Brady, N.; Sancataldo, G.; Silvestri, L.; Destrieux, C.; Hof, P.R.; et al. 3D molecular phenotyping of cleared human brain tissues with light-sheet fluorescence microscopy. Commun. Biol. 2022, 5, 447. [Google Scholar] [CrossRef]
- Chung, K.; Wallace, J.; Kim, S.Y.; Kalyanasundaram, S.; Andalman, A.S.; Davidson, T.J.; Mirzabekov, J.J.; Zalocusky, K.A.; Mattis, J.; Denisin, A.K.; et al. Structural and molecular interrogation of intact biological systems. Nature 2013, 497, 332–337. [Google Scholar] [CrossRef]
- Murray, E.; Cho, J.H.; Goodwin, D.; Ku, T.; Swaney, J.; Kim, S.Y.; Choi, H.; Park, Y.G.; Park, J.Y.; Hubbert, A.; et al. Simple, Scalable Proteomic Imaging for High-Dimensional Profiling of Intact Systems. Cell 2015, 163, 1500–1514. [Google Scholar] [CrossRef]
- Ku, T.; Swaney, J.; Park, J.Y.; Albanese, A.; Murray, E.; Cho, J.H.; Park, Y.G.; Mangena, V.; Chen, J.; Chung, K. Multiplexed and scalable super-resolution imaging of three-dimensional protein localization in size-adjustable tissues. Nat. Biotechnol. 2016, 34, 973–981. [Google Scholar] [CrossRef]
- Renier, N.; Wu, Z.; Simon, D.J.; Yang, J.; Ariel, P.; Tessier-Lavigne, M. iDISCO: A simple, rapid method to immunolabel large tissue samples for volume imaging. Cell 2014, 159, 896–910. [Google Scholar] [CrossRef]
- Glaser, A.K.; Reder, N.P.; Chen, Y.; McCarty, E.F.; Yin, C.; Wei, L.; Wang, Y.; True, L.D.; Liu, J.T.C. Light-sheet microscopy for slide-free non-destructive pathology of large clinical specimens. Nat. Biomed. Eng. 2017, 1, 0084. [Google Scholar] [CrossRef]
- Kim, H.J.; Kim, J.; Choi, J.; Sun, W. Chemical fluorescence-based dye staining for 3-dimensional histopathology analysis. Anim. Cells. Syst. 2022, 26, 45–51. [Google Scholar] [CrossRef]
- Barner, L.A.; Glaser, A.K.; Mao, C.; Susaki, E.A.; Vaughan, J.C.; Dintzis, S.M.; Liu, J.T.C. Multiresolution nondestructive 3D pathology of whole lymph nodes for breast cancer staging. J. Biomed. Opt. 2022, 27, 036501. [Google Scholar] [CrossRef]
- Fereidouni, F.; Harmany, Z.T.; Tian, M.; Todd, A.; Kintner, J.A.; McPherson, J.D.; Borowsky, A.D.; Bishop, J.; Lechpammer, M.; Demos, S.G.; et al. Microscopy with ultraviolet surface excitation for rapid slide-free histology. Nat. Biomed. Eng. 2017, 1, 957–966. [Google Scholar] [CrossRef]
- Sabdyusheva Litschauer, I.; Becker, K.; Saghafi, S.; Ballke, S.; Bollwein, C.; Foroughipour, M.; Gaugeler, J.; Foroughipour, M.; Schavelová, V.; László, V.; et al. 3D histopathology of human tumours by fast clearing and ultramicroscopy. Sci. Rep. 2020, 10, 17619. [Google Scholar] [CrossRef]
- Nojima, S.; Susaki, E.A.; Yoshida, K.; Takemoto, H.; Tsujimura, N.; Iijima, S.; Takachi, K.; Nakahara, Y.; Tahara, S.; Ohshima, K.; et al. CUBIC pathology: Three-dimensional imaging for pathological diagnosis. Sci. Rep. 2017, 7, 9269. [Google Scholar] [CrossRef]
- Reder, N.P.; Glaser, A.K.; McCarty, E.F.; Chen, Y.; True, L.D.; Liu, J.T.C. Open-Top Light-Sheet Microscopy Image Atlas of Prostate Core Needle Biopsies. Arch. Pathol. Lab. Med. 2019, 143, 1069–1075. [Google Scholar] [CrossRef] [PubMed]
- Tanaka, N.; Kanatani, S.; Tomer, R.; Sahlgren, C.; Kronqvist, P.; Kaczynska, D.; Louhivuori, L.; Kis, L.; Lindh, C.; Mitura, P.; et al. Whole-tissue biopsy phenotyping of three-dimensional tumours reveals patterns of cancer heterogeneity. Nat. Biomed. Eng. 2017, 1, 796–806. [Google Scholar] [CrossRef] [PubMed]
- Xie, W.; Reder, N.P.; Koyuncu, C.; Leo, P.; Hawley, S.; Huang, H.; Mao, C.; Postupna, N.; Kang, S.; Serafin, R.; et al. Prostate Cancer Risk Stratification via Nondestructive 3D Pathology with Deep Learning-Assisted Gland Analysis. Cancer Res. 2022, 82, 334–345. [Google Scholar] [CrossRef] [PubMed]
- Olson, E.; Levene, M.J.; Torres, R. Multiphoton microscopy with clearing for three dimensional histology of kidney biopsies. Biomed. Opt. Express 2016, 7, 3089–3096. [Google Scholar] [CrossRef]
- Yang, B.; Treweek, J.B.; Kulkarni, R.P.; Deverman, B.E.; Chen, C.K.; Lubeck, E.; Shah, S.; Cai, L.; Gradinaru, V. Single-cell phenotyping within transparent intact tissue through whole-body clearing. Cell 2014, 158, 945–958. [Google Scholar] [CrossRef]
- Neckel, P.H.; Mattheus, U.; Hirt, B.; Just, L.; Mack, A.F. Large-scale tissue clearing (PACT): Technical evaluation and new perspectives in immunofluorescence, histology, and ultrastructure. Sci. Rep. 2016, 6, 34331. [Google Scholar] [CrossRef]
- Xu, N.; Tamadon, A.; Liu, Y.; Ma, T.; Leak, R.K.; Chen, J.; Gao, Y.; Feng, Y. Fast free-of-acrylamide clearing tissue (FACT)-an optimized new protocol for rapid, high-resolution imaging of three-dimensional brain tissue. Sci. Rep. 2017, 7, 9895. [Google Scholar] [CrossRef]
- Mohammad Rezazadeh, F.; Saedi, S.; Rahmanifar, F.; Namavar, M.R.; Dianatpour, M.; Tanideh, N.; Akhlaghi, A.; Niazi, A.; Arabi Monfared, A.; Tsutsui, K.; et al. Fast free of acrylamide clearing tissue (FACT) for clearing, immunolabelling and three-dimensional imaging of partridge tissues. Microsc. Res. Tech. 2018, 81, 1374–1382. [Google Scholar] [CrossRef]
- Hildebrand, S.; Schueth, A.; Herrler, A.; Galuske, R.; Roebroeck, A. Scalable Labeling for Cytoarchitectonic Characterization of Large Optically Cleared Human Neocortex Samples. Sci. Rep. 2019, 9, 10880. [Google Scholar] [CrossRef]
- Schueth, A.; Hildebrand, S.; Samarska, I.; Sengupta, S.; Kiessling, A.; Herrler, A.; Zur Hausen, A.; Capalbo, M.; Roebroeck, A. Efficient 3D light-sheet imaging of very large-scale optically cleared human brain and prostate tissue samples. Commun. Biol. 2023, 6, 170. [Google Scholar] [CrossRef]
- Elfer, K.N.; Sholl, A.B.; Wang, M.; Tulman, D.B.; Mandava, S.H.; Lee, B.R.; Brown, J.Q. DRAQ5 and Eosin (‘D&E’) as an Analog to Hematoxylin and Eosin for Rapid Fluorescence Histology of Fresh Tissues. PLoS ONE 2016, 11, e0165530. [Google Scholar] [CrossRef]
- Costantini, I.; Ghobril, J.P.; Di Giovanna, A.P.; Allegra Mascaro, A.L.; Silvestri, L.; Müllenbroich, M.C.; Onofri, L.; Conti, V.; Vanzi, F.; Sacconi, L.; et al. A versatile clearing agent for multi-modal brain imaging. Sci. Rep. 2015, 5, 9808. [Google Scholar] [CrossRef]
- Müllenbroich, M.C.; Silvestri, L.; Di Giovanna, A.P.; Mazzamuto, G.; Costantini, I.; Sacconi, L.; Pavone, F.S. High-Fidelity Imaging in Brain-Wide Structural Studies Using Light-Sheet Microscopy. Eneuro 2018, 5, ENEURO.0124-18.2018. [Google Scholar] [CrossRef]
- Torres, R.; Vesuna, S.; Levene, M.J. High-resolution, 2- and 3-dimensional imaging of uncut, unembedded tissue biopsy samples. Arch. Pathol. Lab. Med. 2014, 138, 395–402. [Google Scholar] [CrossRef]
- Costantini, I.; Mazzamuto, G.; Roffilli, M.; Laurino, A.; Maria Castelli, F.; Neri, M.; Lughi, G.; Simonetto, A.; Lazzeri, E.; Pesce, L.; et al. Large-scale, cell-resolution volumetric mapping allows layer-specific investigation of human brain cytoarchitecture. Biomed. Opt. Express 2021, 12, 3684–3699. [Google Scholar] [CrossRef]
- Pesce, L.; Laurino, A.; Scardigli, M.; Yang, J.; Boas, D.A.; Hof, P.R.; Destrieux, C.; Costantini, I.; Pavone, F.S. Exploring the human cerebral cortex using confocal microscopy. Prog. Biophys Mol. Biol. 2022, 168, 3–9. [Google Scholar] [CrossRef]
- Zhao, Y.; Bucur, O.; Irshad, H.; Chen, F.; Weins, A.; Stancu, A.L.; Oh, E.Y.; DiStasio, M.; Torous, V.; Glass, B.; et al. Nanoscale imaging of clinical specimens using pathology-optimized expansion microscopy. Nat. Biotechnol. 2017, 35, 757–764. [Google Scholar] [CrossRef]
- Bucur, O.; Fu, F.; Calderon, M.; Mylvaganam, G.H.; Ly, N.L.; Day, J.; Watkin, S.; Walker, B.D.; Boyden, E.S.; Zhao, Y. Nanoscale imaging of clinical specimens using conventional and rapid-expansion pathology. Nat. Protoc. 2020, 15, 1649–1672. [Google Scholar] [CrossRef]
- Bigagli, E.; Luceri, C.; De Angioletti, M.; Chegaev, K.; D’Ambrosio, M.; Riganti, C.; Gazzano, E.; Saponara, S.; Longini, M.; Luceri, F.; et al. New NO- and H2S-releasing doxorubicins as targeted therapy against chemoresistance in castration-resistant prostate cancer: In vitro and in vivo evaluations. Invest. New Drugs. 2018, 36, 985–998. [Google Scholar] [CrossRef]
- Spalteholz, W. Über das Durchsichtigmachen von Menschlichen und Tierischen Präparaten und Seine Theoretischen Bedingungen, Nebst Anhang: Über Knochenfärbung; S. Hirzel: North Andover, MA, USA, 1914. [Google Scholar]
- Dodt, H.U.; Leischner, U.; Schierloh, A.; Jährling, N.; Mauch, C.P.; Deininger, K.; Deussing, J.M.; Eder, M.; Zieglgänsberger, W.; Becker, K. Ultramicroscopy: Three-dimensional visualization of neuronal networks in the whole mouse brain. Nat. Methods 2007, 4, 331–336. [Google Scholar] [CrossRef]
- Becker, K.; Jährling, N.; Saghafi, S.; Weiler, R.; Dodt, H.U. Chemical clearing and dehydration of GFP expressing mouse brains. PLoS ONE 2012, 7, e33916. [Google Scholar] [CrossRef]
- Ertürk, A.; Becker, K.; Jährling, N.; Mauch, C.P.; Hojer, C.D.; Egen, J.G.; Hellal, F.; Bradke, F.; Sheng, M.; Dodt, H.U. Three-dimensional imaging of solvent-cleared organs using 3DISCO. Nat. Protoc. 2012, 7, 1983–1995. [Google Scholar] [CrossRef] [PubMed]
- Wang, T.; Shen, F.; Deng, H.; Cai, F.; Chen, S. Smartphone imaging spectrometer for egg/meat freshness monitoring. Anal. Methods 2022, 14, 508–517. [Google Scholar] [CrossRef] [PubMed]
- Shen, F.; Deng, H.; Yu, L.; Cai, F. Open-source mobile multispectral imaging system and its applications in biological sample sensing. Spectrochim. Acta Part A: Mol. Biomol. Spectrosc. 2022, 280, 121504. [Google Scholar] [CrossRef] [PubMed]
- Lagarto, J.L.; Villa, F.; Tisa, S.; Zappa, F.; Shcheslavskiy, V.; Pavone, F.S.; Cicchi, R. Real-time multispectral fluorescence lifetime imaging using Single Photon Avalanche Diode arrays. Sci. Rep. 2020, 10, 8116. [Google Scholar] [CrossRef]
- Krafft, C.; Schmitt, M.; Schie, I.W.; Cialla-May, D.; Matthäus, C.; Bocklitz, T.; Popp, J. Label-Free Molecular Imaging of Biological Cells and Tissues by Linear and Nonlinear Raman Spectroscopic Approaches. Angew. Chem. Int. Ed. 2017, 56, 4392–4430. [Google Scholar] [CrossRef]
- Audier, X.; Forget, N.; Rigneault, H. High-speed chemical imaging of dynamic and histological samples with stimulated Raman micro-spectroscopy. Opt. Express 2020, 28, 15505–15514. [Google Scholar] [CrossRef]
- Cicchi, R.; Matthäus, C.; Meyer, T.; Lattermann, A.; Dietzek, B.; Brehm, B.R.; Popp, J.; Pavone, F.S. Characterization of collagen and cholesterol deposition in atherosclerotic arterial tissue using non-linear microscopy. J. Biophotonics. 2014, 7, 135–143. [Google Scholar] [CrossRef]
- Sun, Y.; You, S.; Du, X.; Spaulding, A.; Liu, Z.G.; Chaney, E.J.; Spillman, D.R., Jr.; Marjanovic, M.; Tu, H.; Boppart, S.A. Real-time three-dimensional histology-like imaging by label-free nonlinear optical microscopy. Quant. Imaging Med. Surg. 2020, 10, 2177–2190. [Google Scholar] [CrossRef]
- Chung, K.; Deisseroth, K. CLARITY for mapping the nervous system. Nat. Methods 2013, 10, 508–513. [Google Scholar] [CrossRef]
- Silvestri, L.; Müllenbroich, M.C.; Costantini, I.; Di Giovanna, A.P.; Mazzamuto, G.; Franceschini, A.; Kutra, D.; Kreshuk, A.; Checcucci, C.; Toresano, L.O.; et al. Universal autofocus for quantitative volumetric microscopy of whole mouse brains. Nat. Methods 2021, 18, 953–958. [Google Scholar] [CrossRef]
- Ricci, P.; Gavryusev, V.; Müllenbroich, C.; Turrini, L.; de Vito, G.; Silvestri, L.; Sancataldo, G.; Pavone, F.S. Removing striping artifacts in light-sheet fluorescence microscopy: A review. Prog. Biophys Mol. Biol. 2022, 168, 52–65. [Google Scholar] [CrossRef]
- Guenthner, C.J.; Miyamichi, K.; Yang, H.H.; Heller, H.C.; Luo, L. Permanent genetic access to transiently active neurons via TRAP: Targeted recombination in active populations. Neuron 2013, 78, 773–784. [Google Scholar] [CrossRef]
- Di Giovanna, A.P.; Credi, C.; Franceschini, A.; Müllenbroich, M.C.; Silvestri, L.; Pavone, F.S. Tailored Sample Mounting for Light-Sheet Fluorescence Microscopy of Clarified Specimens by Polydimethylsiloxane Casting. Front. Neuroanat. 2019, 13, 35. [Google Scholar] [CrossRef]
- Mazzamuto, G. ZetaStitcher: A Python Package for Volumetric Stitching of Large Datasets. Available online: https://github.com/lens-biophotonics/ZetaStitcher/ (accessed on 1 March 2023).


| Human Tissue | Mouse Tissue | TPFM | LSM | Large Scale | Small Details | |
|---|---|---|---|---|---|---|
| CLARITY | + [15] | +++ | + | +++ [15] | +++ | + |
| SWITCH | +++ | +++ | +++ | ++ | + | +++ |
| MAP | +++ | +++ | ++ | +++ | + | +++ |
| iDISCO | +++ [19,21,23] | +++ | ++ | +++ [21,23] | +++ | ++ |
Disclaimer/Publisher’s Note: The statements, opinions and data contained in all publications are solely those of the individual author(s) and contributor(s) and not of MDPI and/or the editor(s). MDPI and/or the editor(s) disclaim responsibility for any injury to people or property resulting from any ideas, methods, instructions or products referred to in the content. |
© 2023 by the authors. Licensee MDPI, Basel, Switzerland. This article is an open access article distributed under the terms and conditions of the Creative Commons Attribution (CC BY) license (https://creativecommons.org/licenses/by/4.0/).
Share and Cite
Laurino, A.; Franceschini, A.; Pesce, L.; Cinci, L.; Montalbano, A.; Mazzamuto, G.; Sancataldo, G.; Nesi, G.; Costantini, I.; Silvestri, L.; et al. A Guide to Perform 3D Histology of Biological Tissues with Fluorescence Microscopy. Int. J. Mol. Sci. 2023, 24, 6747. https://doi.org/10.3390/ijms24076747
Laurino A, Franceschini A, Pesce L, Cinci L, Montalbano A, Mazzamuto G, Sancataldo G, Nesi G, Costantini I, Silvestri L, et al. A Guide to Perform 3D Histology of Biological Tissues with Fluorescence Microscopy. International Journal of Molecular Sciences. 2023; 24(7):6747. https://doi.org/10.3390/ijms24076747
Chicago/Turabian StyleLaurino, Annunziatina, Alessandra Franceschini, Luca Pesce, Lorenzo Cinci, Alberto Montalbano, Giacomo Mazzamuto, Giuseppe Sancataldo, Gabriella Nesi, Irene Costantini, Ludovico Silvestri, and et al. 2023. "A Guide to Perform 3D Histology of Biological Tissues with Fluorescence Microscopy" International Journal of Molecular Sciences 24, no. 7: 6747. https://doi.org/10.3390/ijms24076747
APA StyleLaurino, A., Franceschini, A., Pesce, L., Cinci, L., Montalbano, A., Mazzamuto, G., Sancataldo, G., Nesi, G., Costantini, I., Silvestri, L., & Pavone, F. S. (2023). A Guide to Perform 3D Histology of Biological Tissues with Fluorescence Microscopy. International Journal of Molecular Sciences, 24(7), 6747. https://doi.org/10.3390/ijms24076747