Article

In Situ Raman Analysis of Biofilm Exopolysaccharides Formed in Streptococcus mutans and Streptococcus sanguinis Commensal Cultures

1
Ceramic Physics Laboratory, Kyoto Institute of Technology, Sakyo-ku, Matsugasaki, Kyoto 606-8585, Japan
2
Department of Immunology, Graduate School of Medical Science, Kyoto Prefectural University of Medicine, Kamigyo-ku, 465 Kajii-cho, Kyoto 602-8566, Japan
3
Department of Orthopedic Surgery, Tokyo Medical University, 6-7-1 Nishi-Shinjuku, Shinjuku-ku, Tokyo 160-0023, Japan
4
Department of Dental Medicine, Graduate School of Medical Science, Kyoto Prefectural University of Medicine, Kamigyo-ku, Kyoto 602-8566, Japan
5
Department of Applied Science and Technology, Politecnico di Torino, Corso Duca degli Abruzzi 24, 10129 Torino, Italy
6
Department of Molecular Science and Nanosystems, Ca’ Foscari University of Venice, Via Torino 155, 30172 Venice, Italy
7
Department of Biomaterial Sciences, Graduate School of Agricultural and Life Sciences, The University of Tokyo, 1-1-1 Yayoi, Bunkyo-ku, Tokyo 113-8657, Japan
8
Department of Biological Endodontics, Graduate School of Biomedical and Health Sciences, Hiroshima University, 1-2-3 Kasumi, Minami-ku, Hiroshima 734-8553, Japan
9
Department of Periodontal Medicine, Graduate School of Biomedical and Health Sciences, Hiroshima University, 1-2-3 Kasumi, Minami-ku, Hiroshima 734-8553, Japan
10
Faculty of Fiber Science and Engineering, Kyoto Institute of Technology, Sakyo-ku, Matsugasaki, Kyoto 606-8585, Japan
11
Department of Oral Science and Translational Research, College of Dental Medicine, Nova Southeastern University, 3301 College Ave, Fort Lauderdale, FL 33314, USA
*
Author to whom correspondence should be addressed.
Int. J. Mol. Sci. 2023, 24(7), 6694; https://doi.org/10.3390/ijms24076694
Submission received: 17 February 2023 / Revised: 23 March 2023 / Accepted: 27 March 2023 / Published: 3 April 2023
(This article belongs to the Special Issue Advances in Dental Bio-Nanomaterials (II))

Abstract

:
This study probed in vitro the mechanisms of competition/coexistence between Streptococcus sanguinis (known for being correlated with health in the oral cavity) and Streptococcus mutans (responsible for aciduric oral environment and formation of caries) by means of quantitative Raman spectroscopy and imaging. In situ Raman assessments of live bacterial culture/coculture focusing on biofilm exopolysaccharides supported the hypothesis that both species engaged in antagonistic interactions. Experiments of simultaneous colonization always resulted in coexistence, but they also revealed fundamental alterations of the biofilm with respect to their water-insoluble glucan structure. Raman spectra (collected at fixed time but different bacterial ratios) showed clear changes in chemical bonds in glucans, which pointed to an action by Streptococcus sanguinis to discontinue the impermeability of the biofilm constructed by Streptococcus mutans. The concurrent effects of glycosidic bond cleavage in water-insoluble α − 1,3–glucan and oxidation at various sites in glucans’ molecular chains supported the hypothesis that secretion of oxygen radicals was the main “chemical weapon” used by Streptococcus sanguinis in coculture.

1. Introduction

The concurrent effects of repeated subsistence/starvation cycles and sudden environmental pH fluctuations make the human oral cavity an environment of fierce bacterial competition [1]. In such a competitive environment, dental biofilm features a number of key interspecies interactions, which might suddenly alter oral microbiome homeostasis and cause diseases. Dictated by environmental conditions, typified by a high biodiversity and cellular density [2,3,4,5], and affected by a defenseless accessibility from external sources [6], biofilm is the chaotic arena of multiple and concurrent interspecies interactions leading to bacterial competition and coexistence. Oral biofilms are pathogenic in nature, and their excessive formation, in combination with a deregulated immune response, leads to intraoral diseases, such as dental caries, gingivitis, and periodontitis.
An important case of interspecies interaction taking place on the enamel surface is the antagonism between streptococcal bacteria [7]. Among supragingival streptococcal species, Streptococcus sanguinis (S. sanguinis) pioneers the colonization of symbiotic bacteria and is associated with oral health while Streptococcus mutans (S. mutans) is a major pathogen causing human dental caries and promoting the development of an acidogenic and aciduric environment that enhances pathogenicity from other organisms in the oral cavity. The concentration ratio of these two species has been regarded as an indicator of oral health [8,9]. The antagonism between S. mutans and S. sanguinis at the ecological level is long known [8,10], and a number of studies have phenomenologically featured the interaction between the two streptococcal bacteria as a function of time, inoculation sequence, and reciprocal concentrations [11,12,13]. The antagonistic interaction referred to as “competitive exclusion” between S. mutans and S. sanguinis was early demonstrated by altering the sequence of inoculation in germ-free rats [10]. Kreth et al. [11] showed that, upon inoculating bacteria in sequence, the early species inoculated inhibits growth of the later inoculated one while simultaneous inoculation of both species always led to coexistence. An important discovery of the above study was that each bacterial species attempted to repress the antagonist by using a “chemical weapon”: S. sanguinis produced hydrogen peroxide (H2O2) while S. mutans synthesized mutacin (a polycyclic peptide containing thioether amino acids). These findings were later supported by both clinical research and in silico analyses [14,15]. However, the machineries of mutual inhibition are not completely understood yet, and the environmental conditions affecting the ability of S. sanguinis to maintain an ecologically balanced biofilm in the oral cavity is awaiting further clarifications. Therefore, establishing a suitable method of molecular-scale visualization is essential in order to clarify interspecies interaction for this important bacterial duality. Visualizing and rationalizing the mechanisms behind interspecies interaction at the molecular level could open new paths toward the development of novel methods of diagnosing/curing oral biofilm formation.
Several authors have used vibrational spectroscopic techniques to characterize bacterial species and biofilm structures at the molecular level [16,17,18,19]. Infrared and Raman spectroscopies can both be used to acquire molecular-scale information on bacterial biofilms by exploiting bond vibrational fingerprints. The former technique is indeed widely used for this purpose, but interference with signals from water bonds (–OH) disturbs the scatter from key biofilm molecules, thus limiting its use to dehydrated biofilm samples [20]. On the other hand, Raman spectra (excited with visible light) are not affected by water signals and equally provide clear fingerprints of biological molecules with micrometric spatial resolution [21,22,23]. Since no dehydration or stain/markers are needed to obtain Raman spectra, Raman measurements can be performed in situ with a procedure compatible with bacterial life. In previous studies [23,24,25,26,27,28,29], we have performed Raman spectroscopic analyses of cells, bacteria, pathogenic yeasts, and viruses upon exploiting a machine-learning algorithm linked to a library of Raman spectra from elementary molecules. The analytical approach followed in this study is in line with those previous studies and represents a first attempt to their further extension to the analysis of bacterial biofilms.
In this study, we examined in vitro formed dental biofilm in S. mutans and S. sanguinis in separate cultures and in coculture, upon their simultaneous in vitro inoculations with intermediate fractional populations. Raman spectra were systematically collected on cocultures at a fixed time and processed through a deconvolution-based machine-learning algorithm to analyze and compare live biofilm metabolomics. Important new details could be unveiled regarding interspecies interactions picturing their coexistence under severe competition. The insight gained through in vitro Raman experimentation could become a guide in future clinical studies of patient samples.

2. Results

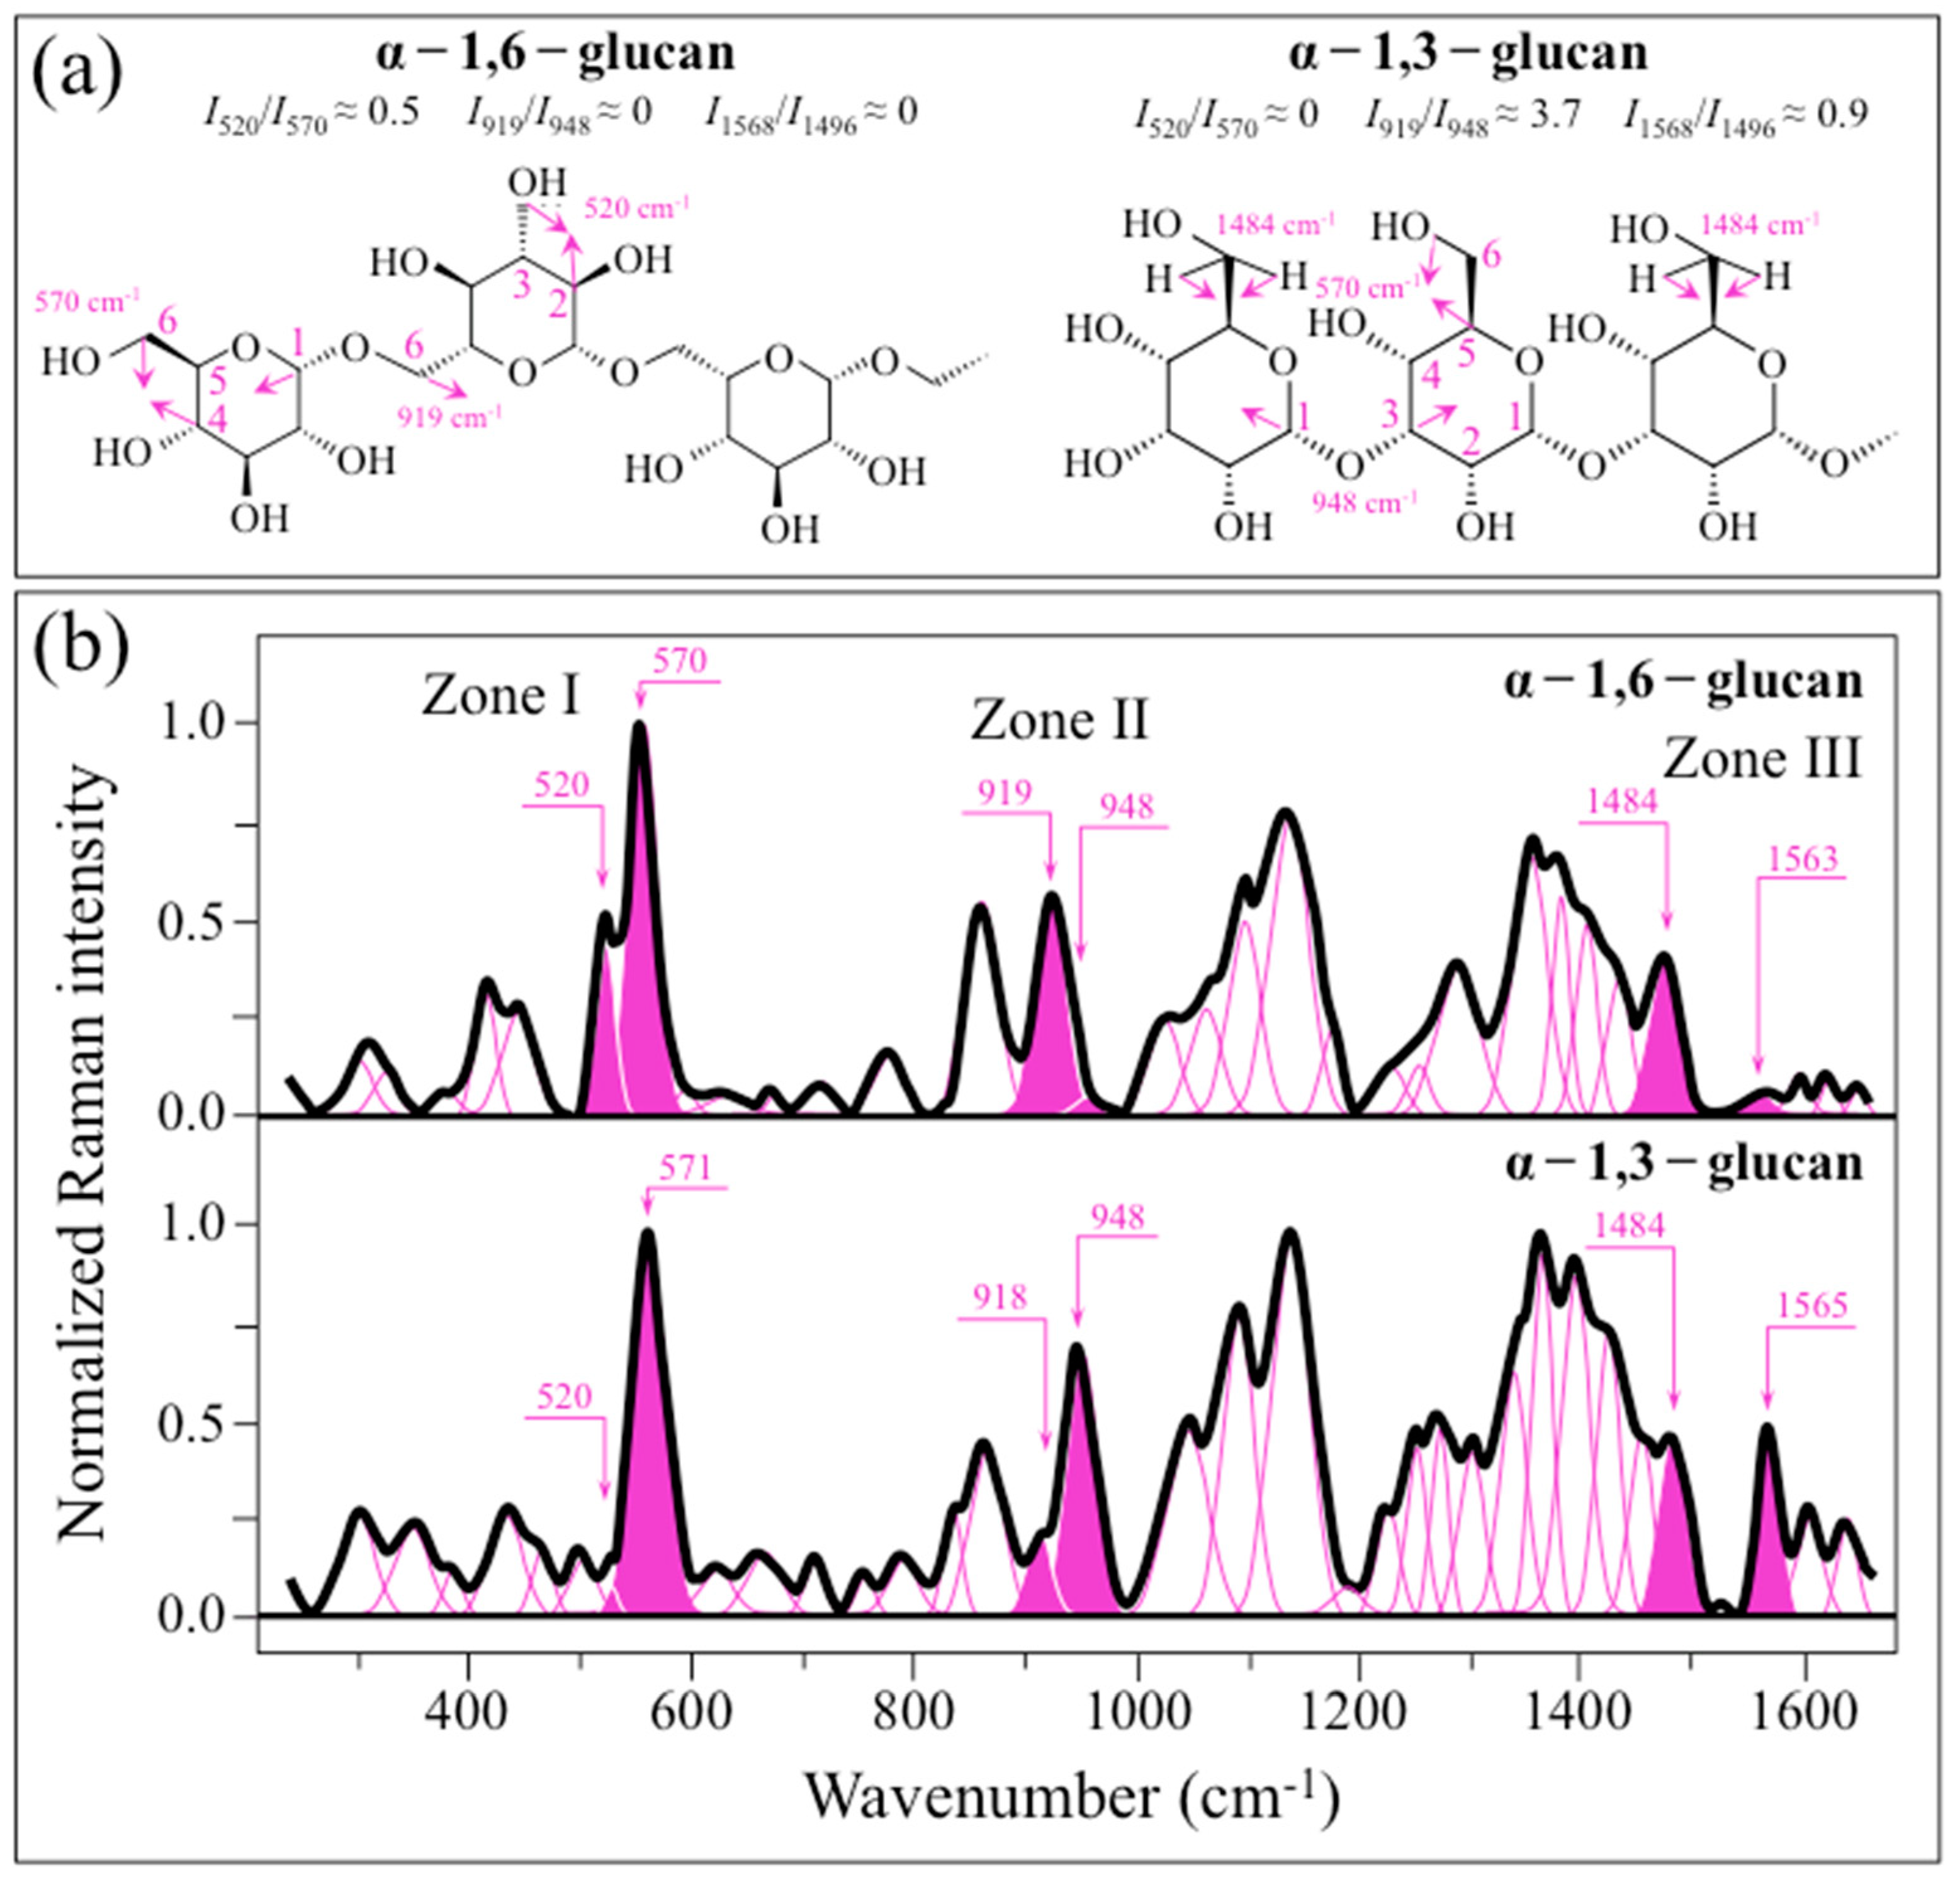
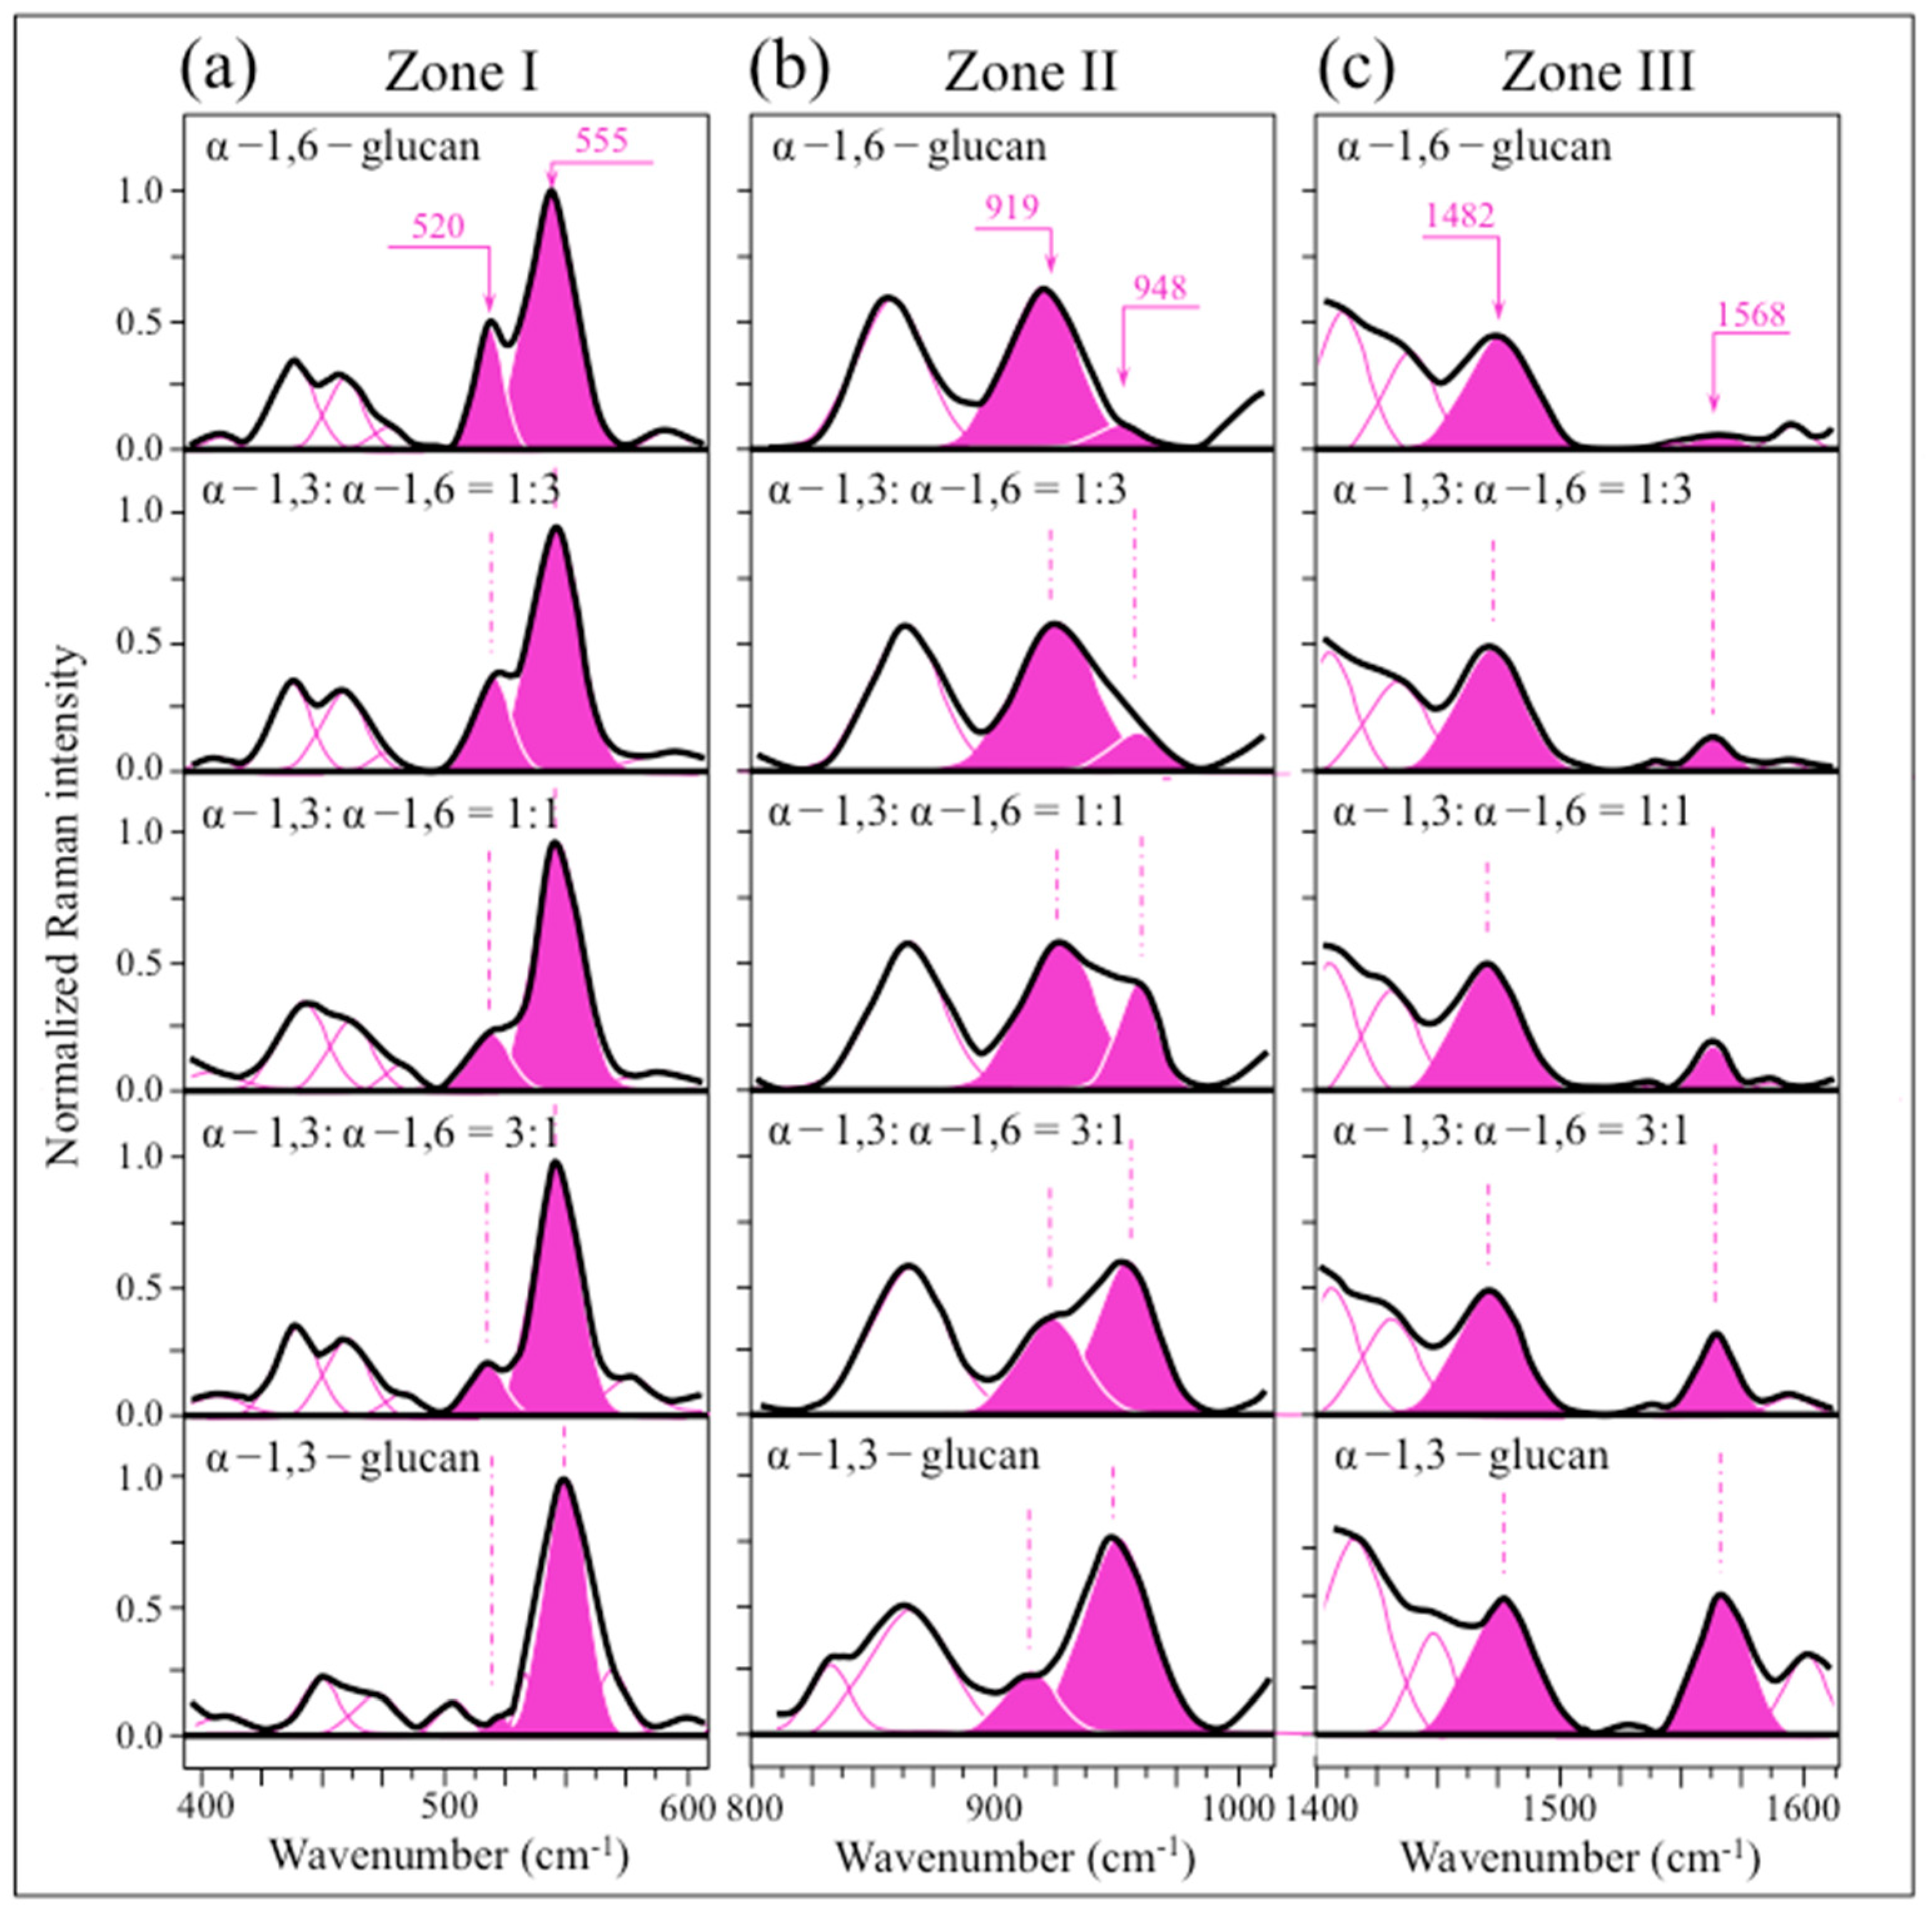
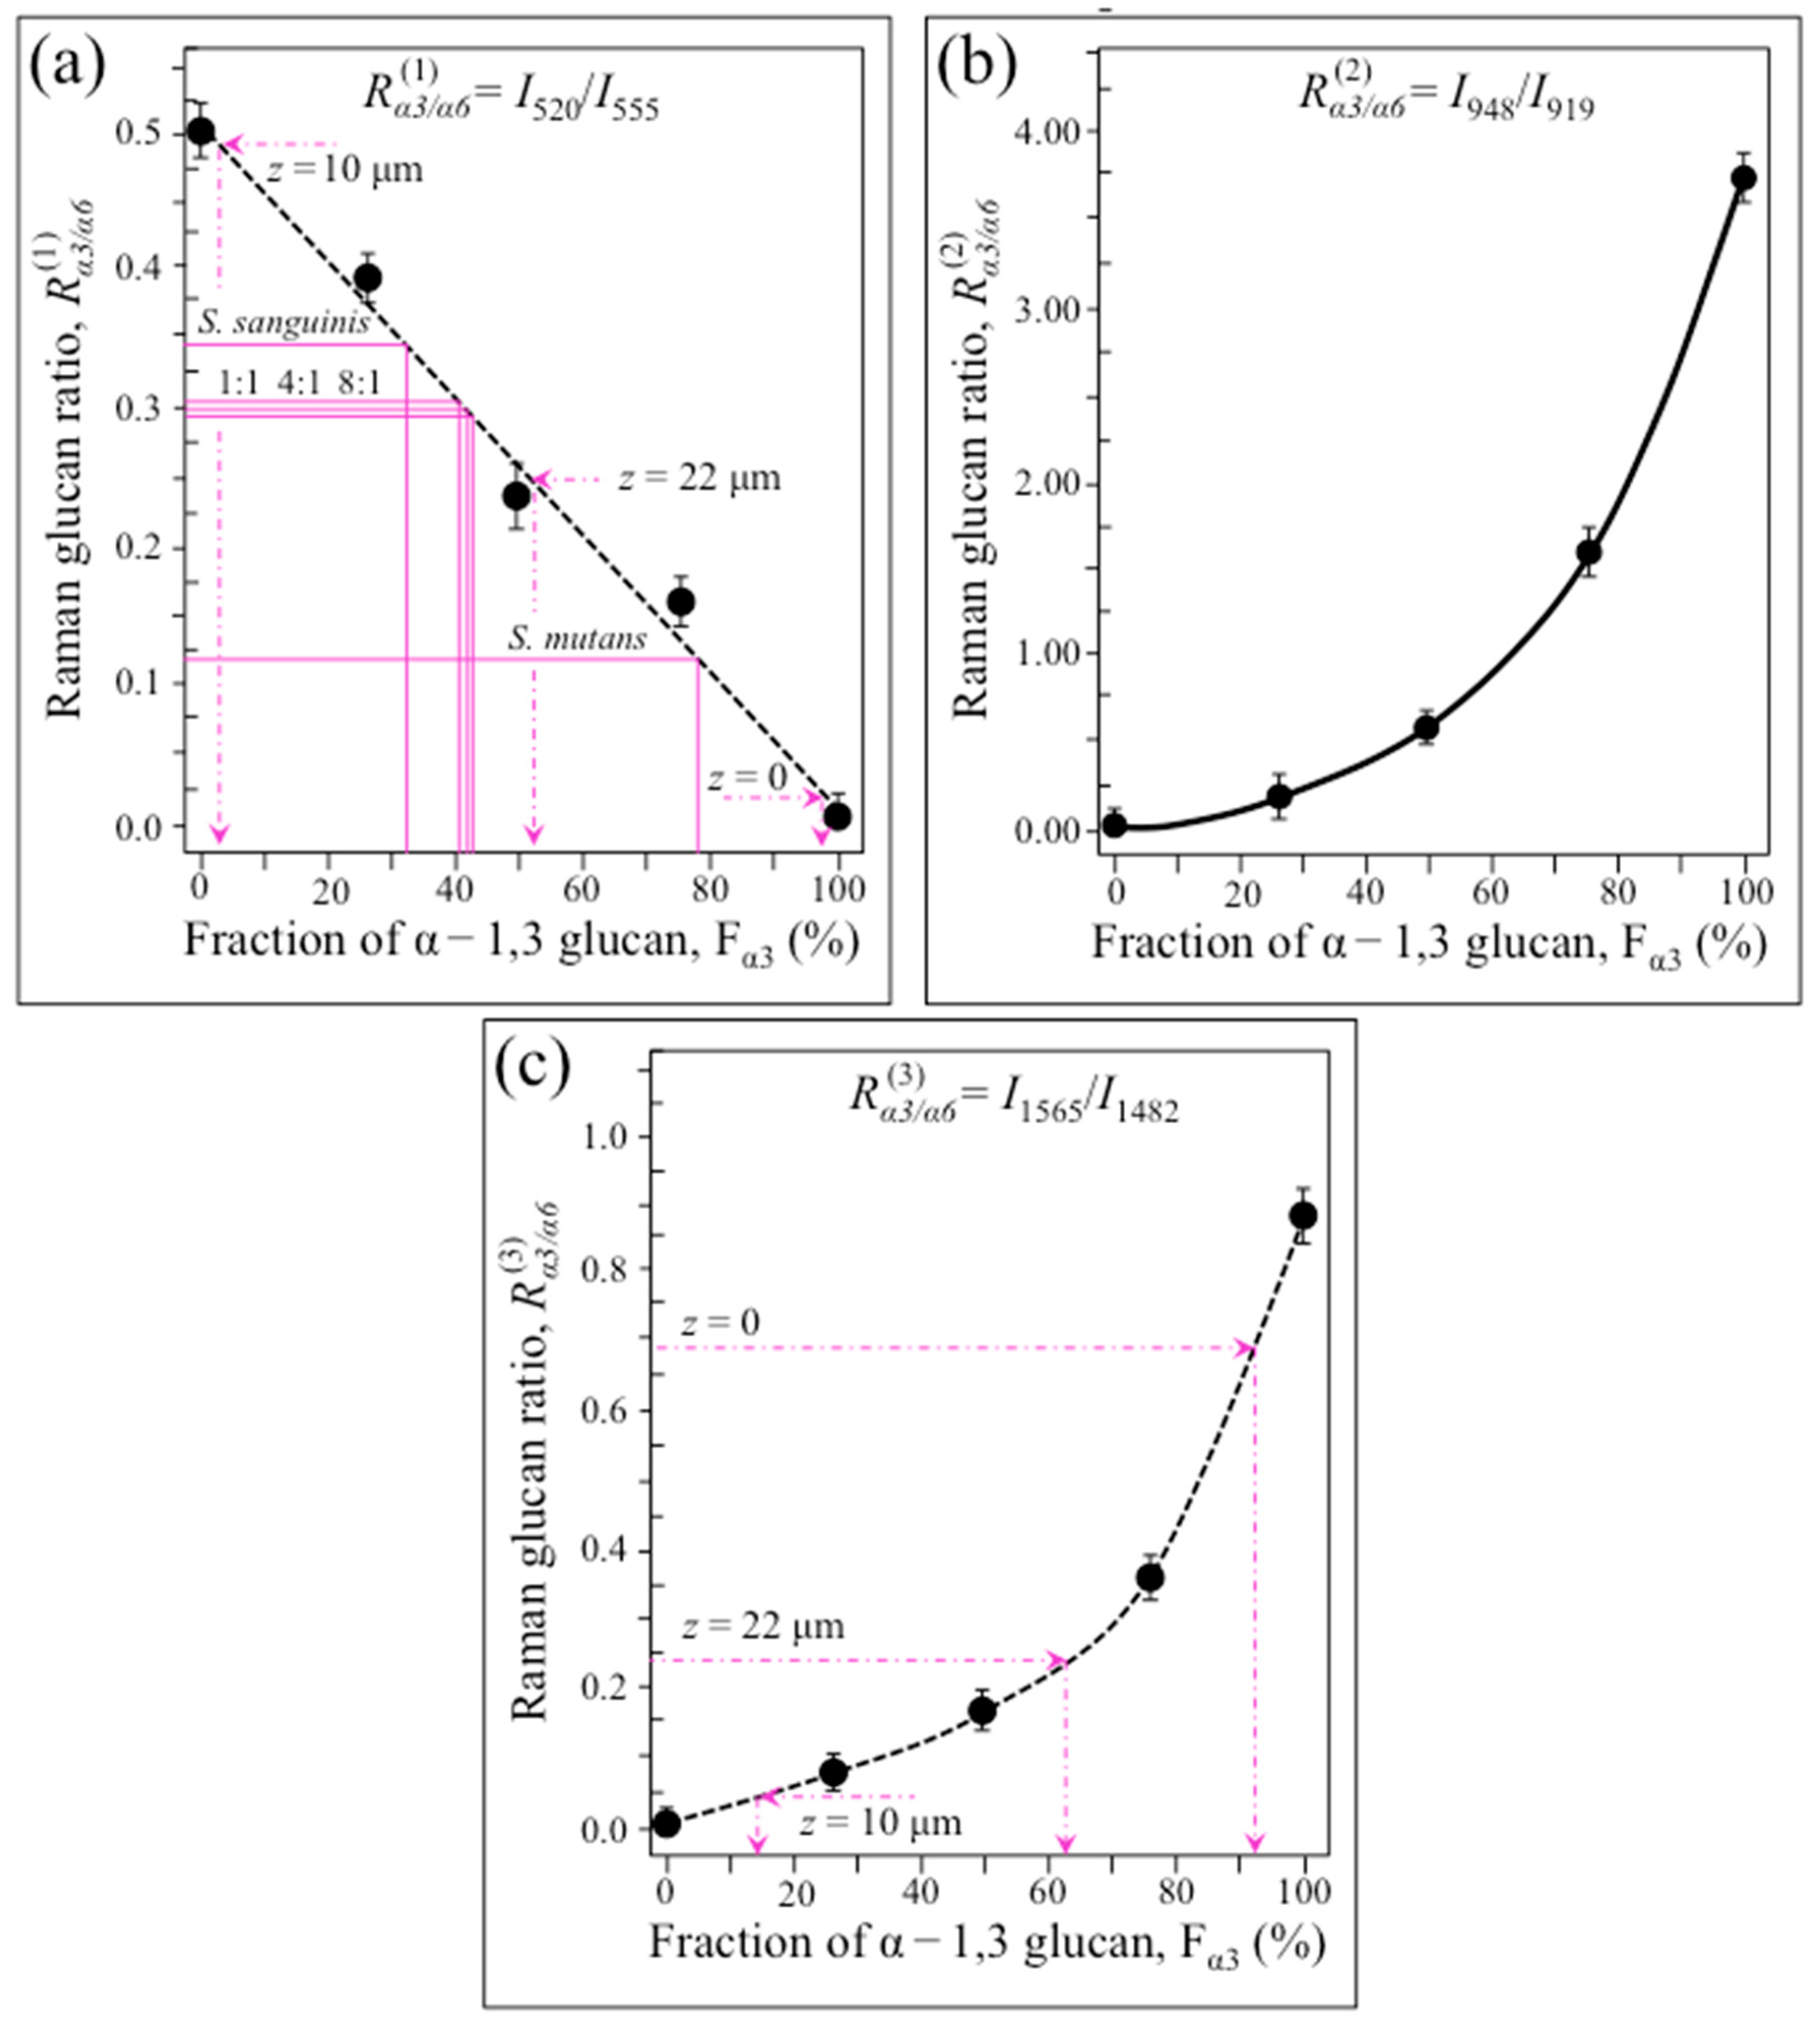
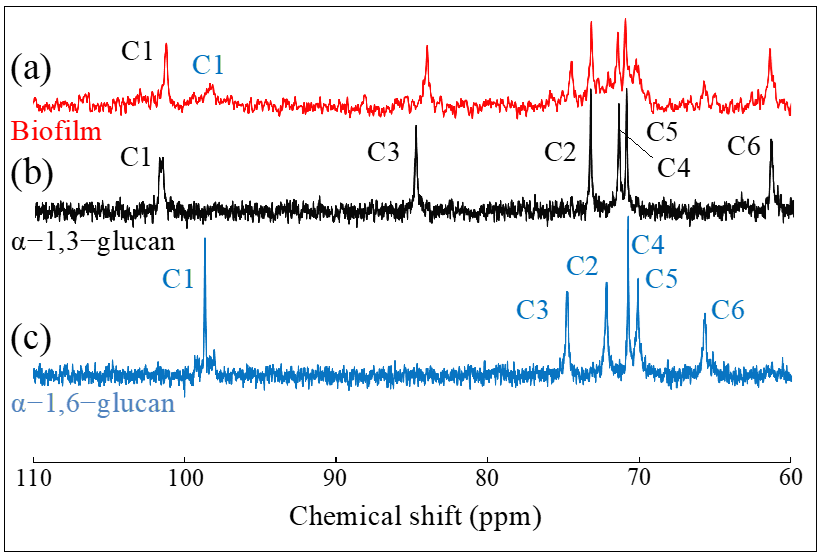
2.1. Raman Calibrations of Water-Insoluble Exopolysaccharides

An important preliminary step in the present investigation resided in quantitatively calibrating the dependence of the Raman spectrum of α–glucan on the structure of its O-glycosidic bonds. Figure 1a shows the structures and fingerprint Raman vibrational modes of α − 1,6– and α − 1,3–glucans, while (b) gives the respective spectra collected on pure compounds (cf. labels in inset; cf. band assignments as summarized in Table S1 of the Supplementary Information).
The spectra differ regarding several important details, which relate to specific features in the respective bond structures. In particular, three spectral areas can be envisaged in Figure 1b, namely at 500~600 cm−1 (Zone I, henceforth), 900~950 cm−1 (Zone II), and 1450~1570 cm−1 (Zone III), which correspond to vibrational modes of C–C–O(H) deformation, C–O–C stretching, and partly to H–C–OH bending, respectively (cf. Figure 1a). Raman spectra collected on mixtures of elementary compounds with different fractions (α − 1,3– to α − 1,6–glucans ratios equal 0:1, 1:3, 1:2, 3:1, and 1:0) were compared in Zone I~III (Figure 2a–c, respectively). In Zone I (Figure 2a), the band located at ~555 cm−1 (C2–C1–O) is common to both α − 1,3– to α − 1,6–glucan structures, while the band located at ~520 cm−1 (C2–C3–OH) should only appear in the α − 1,6–glucan structure (cf. Figure 1a). Zone II (Figure 2b) includes bands at 919 and 948 cm−1, which are fingerprints of glycosidic C–O–C stretching peculiar to α − 1,6– and α − 1,3–glucan structures (i.e., C1–O–C6 and C1–O–C3, respectively) (cf. Figure 1a). In Zone III (Figure 2c), the band at ~1484 cm−1 is common to both α − 1,3– and α − 1,6–glucan structures (H–C6–H bending; cf. Figure 1a), while the band at 1568 cm−1 is only seen in the spectrum of α − 1,3–glucan. However, the presence of a band at ~1568 cm−1 is extrinsic to the glucan structure and cannot be explained without considering the presence of ring C=C bonds [30]. The presence of such bonds could be related to residues of glucansucrase enzyme used by S. mutans to synthesize the α − 1,3–glucan structure. This point will be discussed in more detail in a later section.
Variations of the Raman intensity ratios, R(1)α3/α6 = I520/I555, R(2)α3/α6 = I948/I919, and R(3)α3/α6 = I1568/I1482, are plotted as a function of sample compositions in Figure 3a–c, respectively. The obtained dependencies represent calibration plots that, in principle, enable us to independently quantify the α − 1,3– to α − 1,6–glucans ratio from Raman spectra collected in samples of unknown composition. The survivorship of these three different Raman methods for assessing the glucan structure of live biofilm will be tested in later sections. The fraction of α − 1,3–glucans, Fα3, represents an important structural parameter because it links to the impermeability of the biofilm, as discussed later. An application of the Raman parameter, R(2)α3/α6 = I948/I919, to the quantification of the α − 1,3–glucan fraction in Candida auris biofilm has been described elsewhere [31].

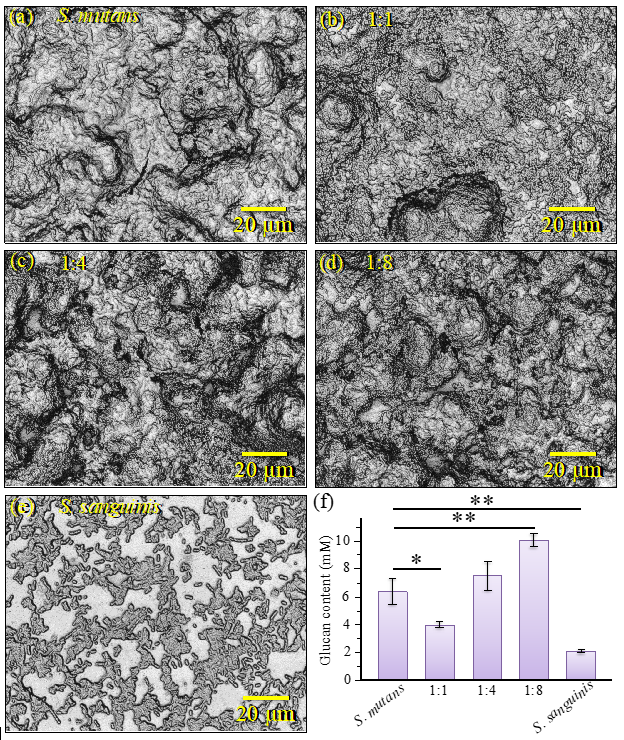
2.2. Morphological and Structural Characterizations of Biofilms

Figure 4a–e show optical micrographs of concurrently inoculated cocultures (at 24 h) with S. mutans– to –S. sanguinis ratios of 1:0, 1:1, 1:4, 1:8, and 0:1, respectively. The micrographs show abundant biofilm formation whatever the initial bacterial fraction except for the culture of S. sanguinis alone, which showed a negligible amount of biofilm. OD values collected on different cocultures are shown in Figure 4f.
The OD data, which are collected on solutions in which both soluble and insoluble glucans were completely dissolved, represent a measure of the amount of biofilm formed. The data reveal an interesting trend by showing that the amount of biofilm developed by S. sanguinis alone was the lowest detected in this study (i.e., in agreement with microscopic observation) while the one formed in the 1:8 coculture (i.e., the richest in S. sanguinis fraction) was the highest as a result of an increasing trend with increasing fraction of S. sanguinis population. Note that the S. sanguinis ability to form biofilm greatly depends on growth medium [32,33], and the scarce ability of S. sanguinis to form biofilm in BHI medium, which is the case here, has already been reported by other authors [33]. It has also been suggested that S. sanguinis adheres to the extracellular glucan produced by other streptococci via putative glucan-binding proteins [34,35]. Although we cannot completely rule out the hypothesis that S. mutans (in its smallest fraction in coculture) could produce the most abundant amount of biofilm, the present data might rather suggest that S. sanguinis exploits environment/metabolites related to the presence of other streptococci to produce copious amounts of a biofilm suitable for its survivorship. In this context, note that the OD value only reveals the amount of biofilm formed while it gives no information about its chemical structure. This important point will be clarified in the next section.
Nuclear magnetic resonance (NMR) was applied to determine the chemical structure of the glucan in the biofilm of the S. mutans culture and to calculate the ratio of each glucan component (Figure 5). The NMR spectra of glucans in the biofilm are shown in Figure 5a while the reference spectra of α − 1,3–glucan and α − 1,6–glucan are given in Figure 5b and Figure 5c, respectively. Comparison of these results suggests that the glucan in the biofilm is composed of both α − 1,6–glucan and α − 1,3–glucan. Then, the ratio of the integrals of the C1 peak was calculated to estimate the component ratio of α − 1,6–glucan to α − 1,3–glucan in the biofilm. The ratio of the area subtended by the α − 1,3–glucan -derived peak to that of the α − 1,6–glucan-derived one was 1:0.27. Therefore, the glucan in the biofilm of the S. mutans culture is proved to be α − 1,3-rich.
An additional characterization with Wide-Angle X-ray Diffraction (WAXD) (shown in Figure S1 of the Supplementary Information) confirmed the presence of a significant fraction of α − 1,3–glucans in the biofilm of the S. mutans culture. WAXD data also revealed a lower crystallinity for biofilm α − 1,3–glucans as compared to a synthetic α − 1,3–glucan sample [30]. However, WAXD also confirmed that a conspicuous crystalline fraction resisted Sodium Dodecyl Sulfate (SDS) treatment.
Figure 6a shows a Raman map of the S. mutans biofilm along the in-depth z-axis. The thickness of the biofilm was ~22 μm. The map, which was non-destructively taken in confocal mode with a spatial resolution of 670 nm and focal plane displacements of ~100 nm, revealed the internal structure of the biofilm. In (b), (c), and (d), average Raman spectra are shown in the interval 400~600 cm−1 as collected along the line at z = 0, 10, and 22 μm, respectively. Similarly, average spectra in the interval 1400~1600 cm−1 are shown in (e), (f), and (g), respectively. From the intensity ratios, R(1)α3/α6 = I520/I555 and R(3)α3/α6 = I1568/I1482, the fractions of α − 1,3–glucans, Fα3, were calculated according to calibration plots in Figure 3a,c, respectively. Along the biofilm z-axis, the fractions of α − 1,3–glucans were clearly more abundant in both the outermost layer (z = 0~5 μm; >90%) and in the zone of contact with the substrate (z = 15~22 μm; 50~60%). Conversely, in the central zone of the biofilm (z = 5~15 μm), Fα3 values were the lowest (~3% and 15% according to R(1)α3/α6 and R(3)α3/α6, respectively). The agreement between the two Raman methods of Fα3 measurement was good (cf. values in inset) except for the middle zone. An explanation for this discrepancy could reside in the overlap of C=C ring signals from different molecules. For example, tryptophan possesses a strong signal from ring C=C stretching at around 1560 cm−1 [36]. Tryptophan is contained in cells proteins and also in the glucansucrase enzyme produced by S. mutans to synthesize α − 1,3–glucans [37]. Therefore, its contribution to the 1568 cm−1 band could be more prominent in the middle zone of the biofilm, which, unlike external biofilm zones, is congested with S. mutans cells.
The layered architecture of the biofilm, as proved by confocal Raman spectroscopy, is clearly linked to the need of a complete isolation with respect to infiltration of foreign molecules from the environment. S. mutans is indeed known to possess the unique ability to convert sucrose into extracellular insoluble glucans, which support bacterial adhesion/cohesion forming the exopolysaccharide matrix [38]. In the oral cavity, such a matrix enables localized acidification within biofilms by impeding buffering by saliva and alkaline environment while allowing diffusion of dietary sugars that provide new “energy” to rejuvenate the biofilm environment [39,40,41]. The present in-depth mapping data by high-resolution confocal Raman spectroscopy fit with the generally accepted model of exopolysaccharide envelope that modifies the diffusion properties of the biofilm, thus creating and preserving an acidic microenvironment.

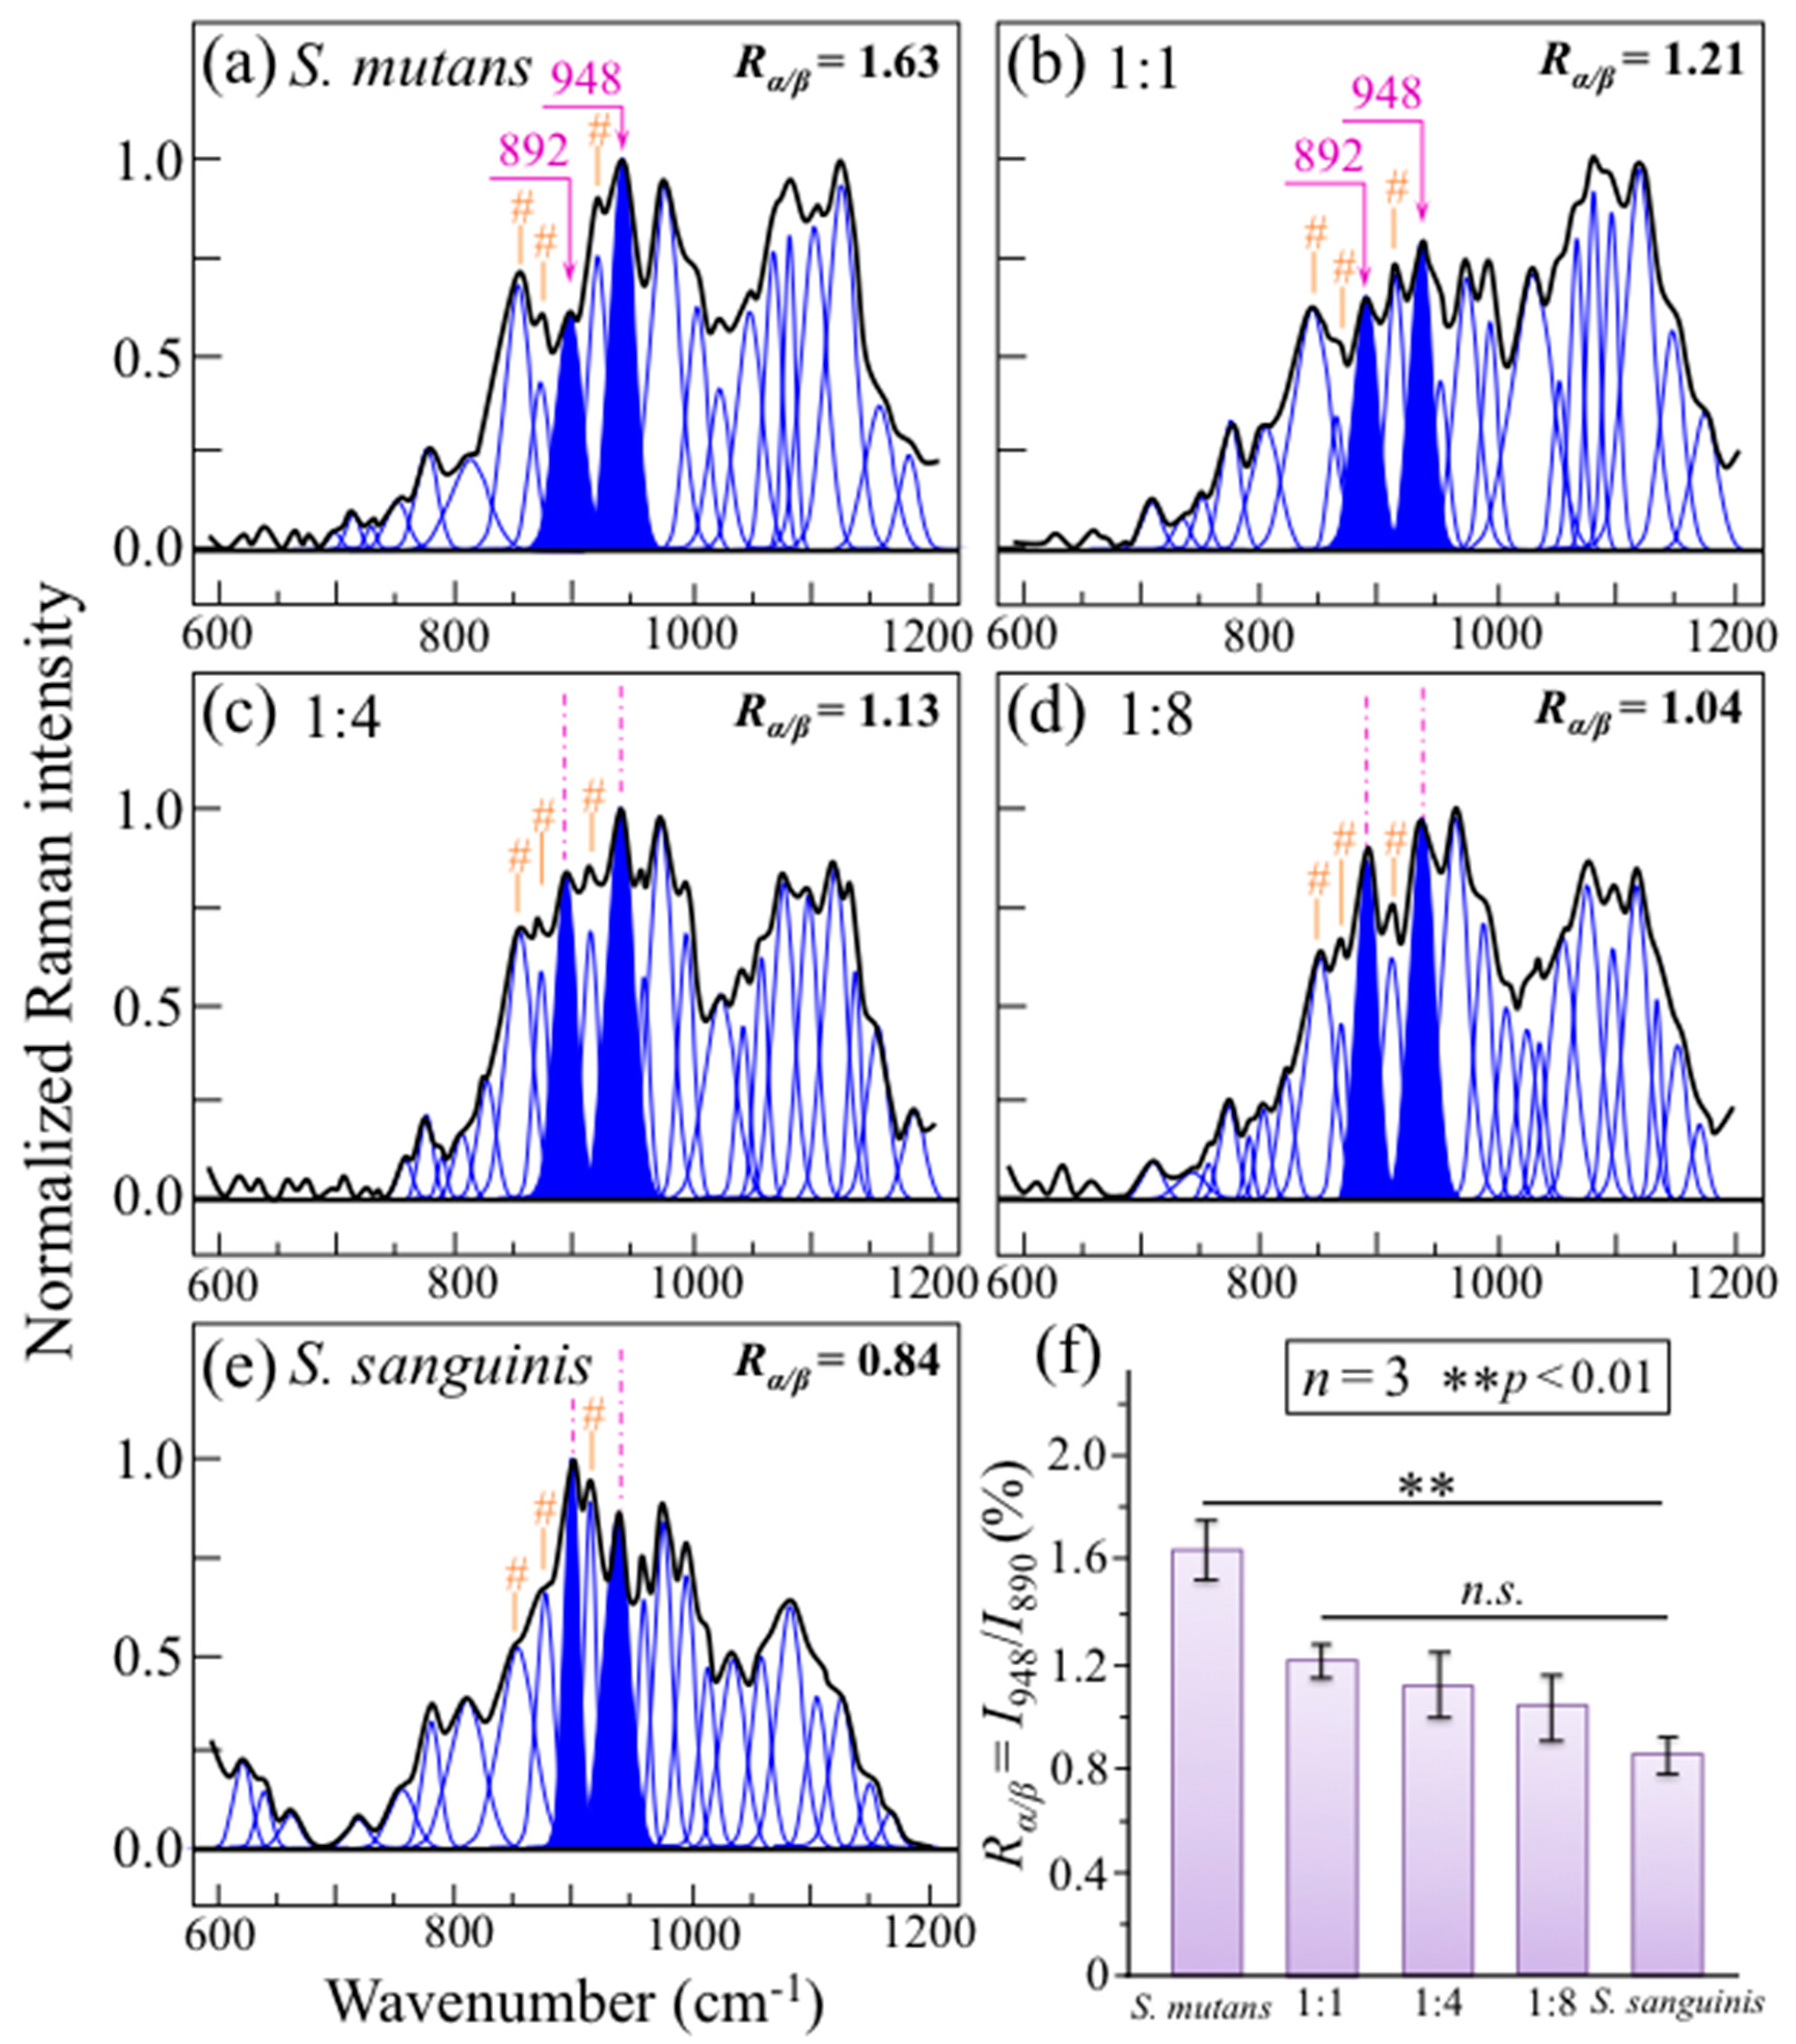
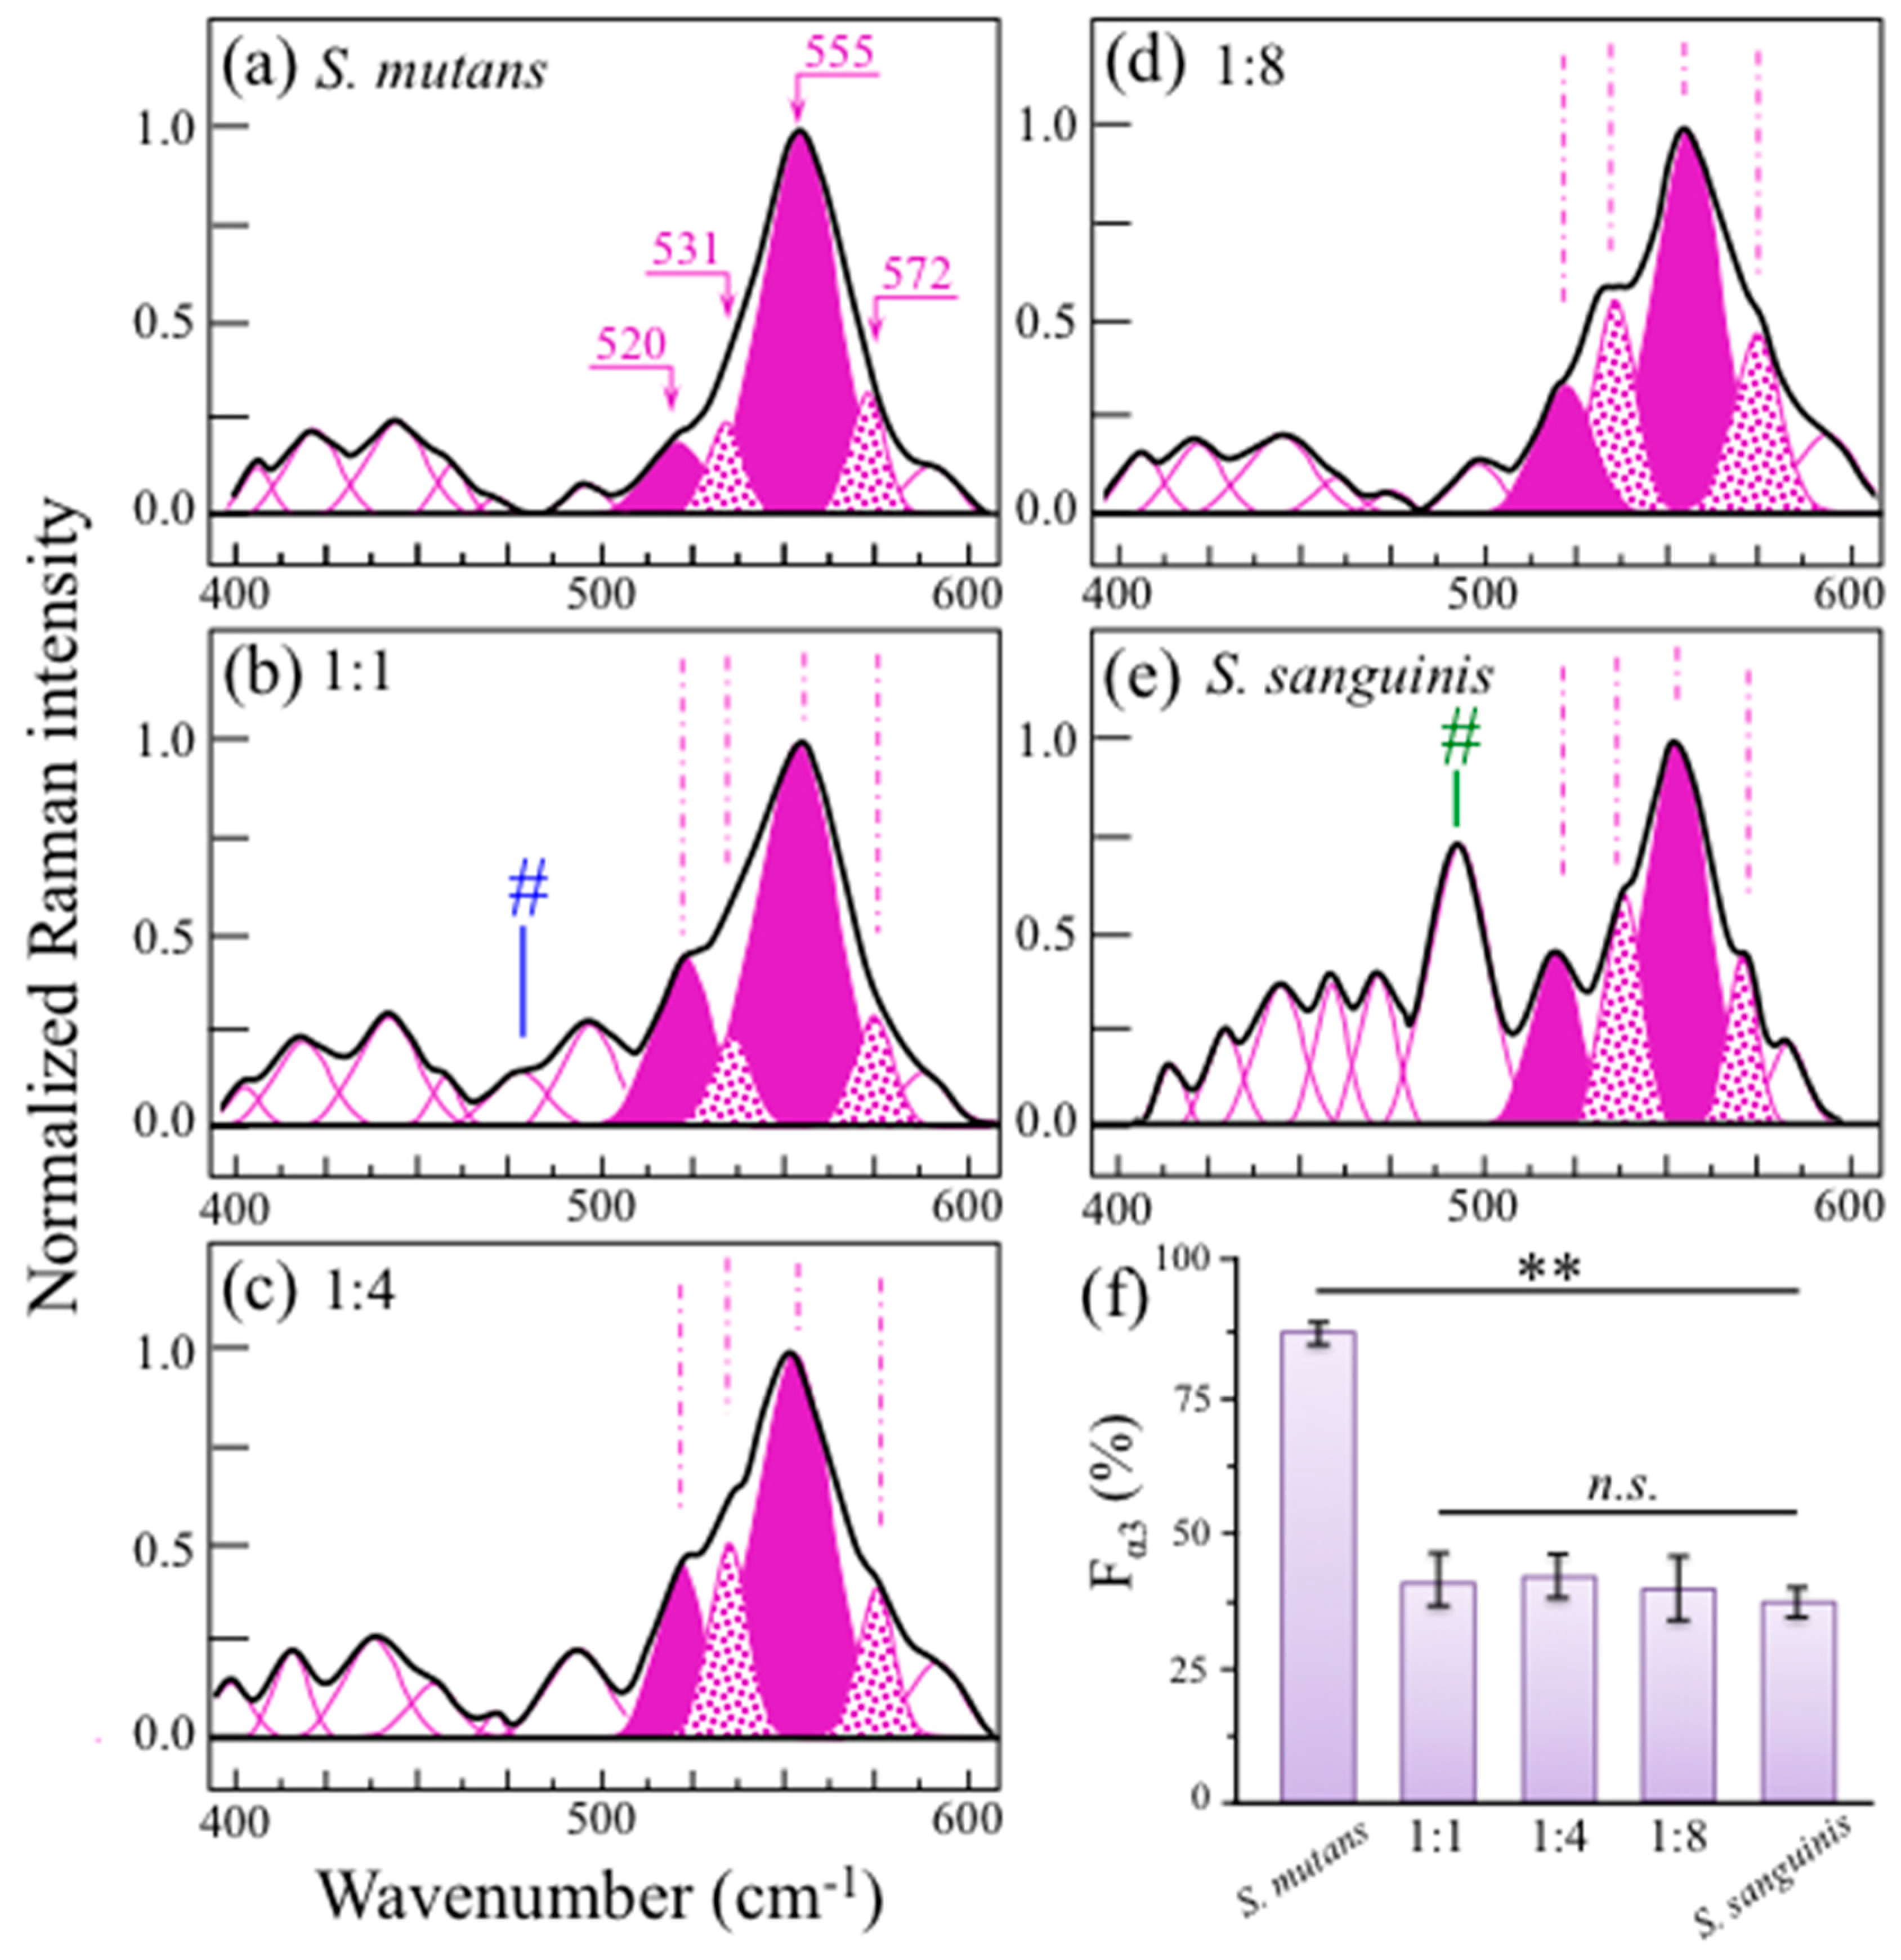
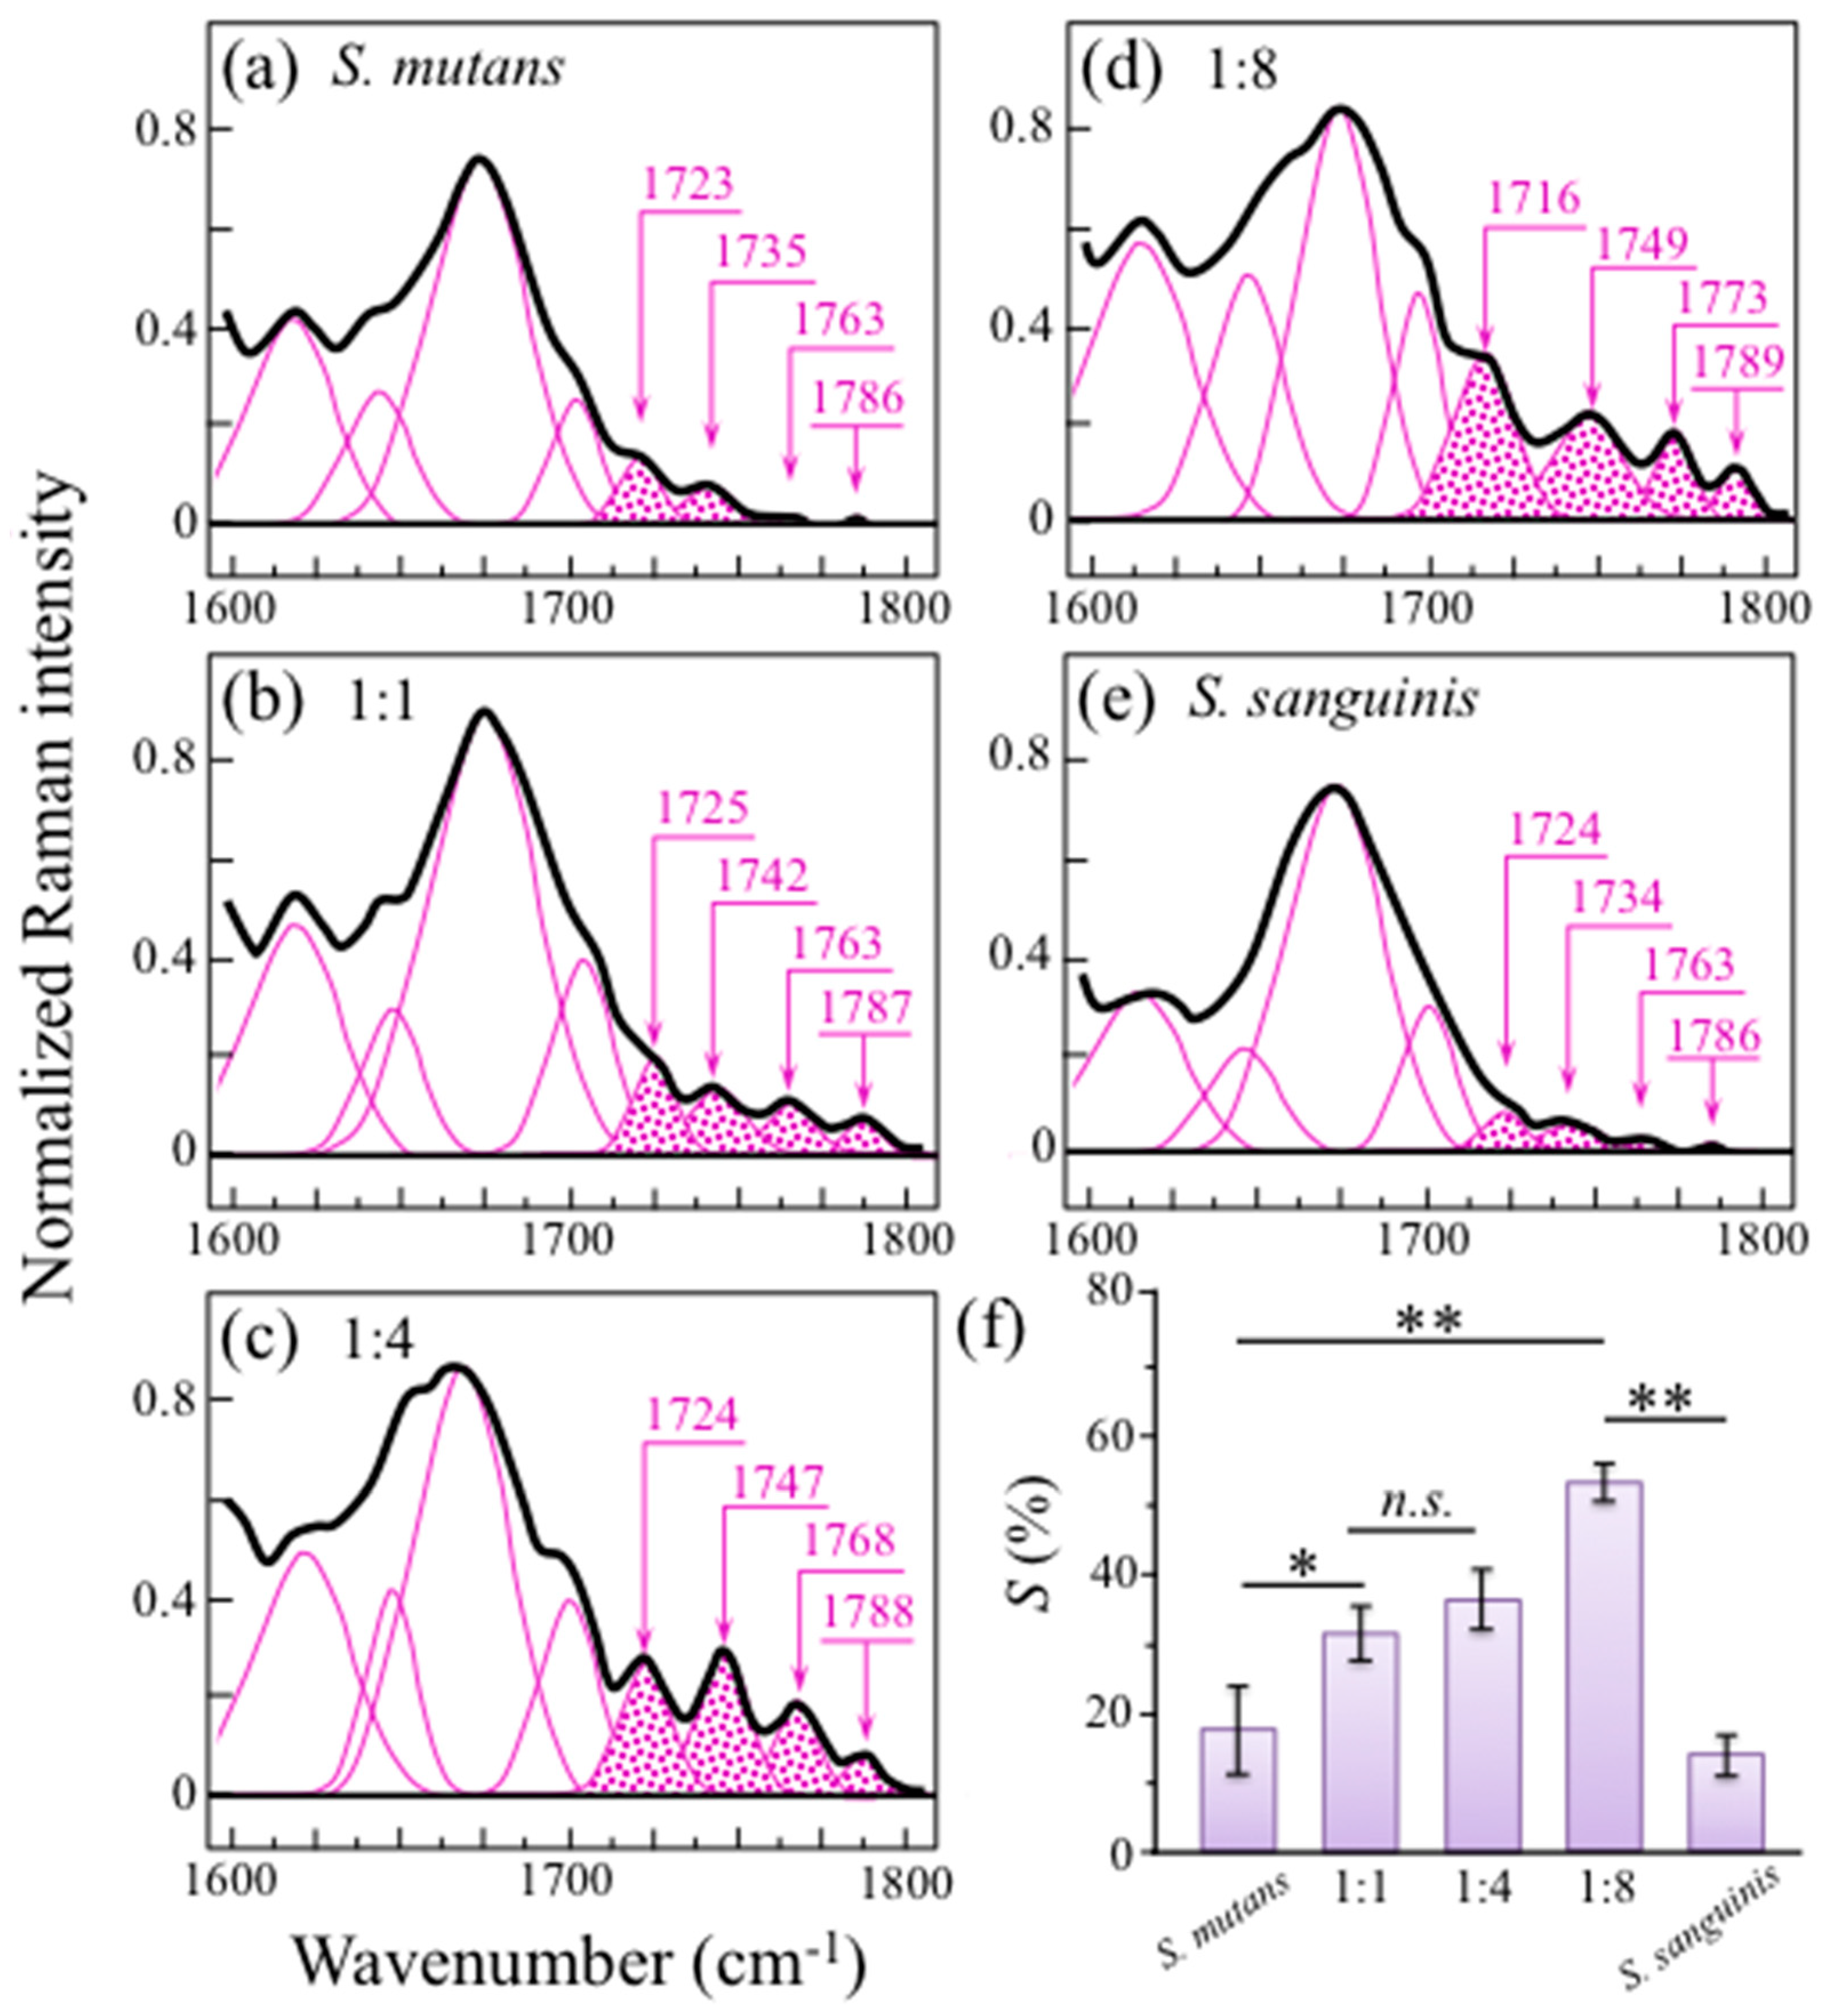
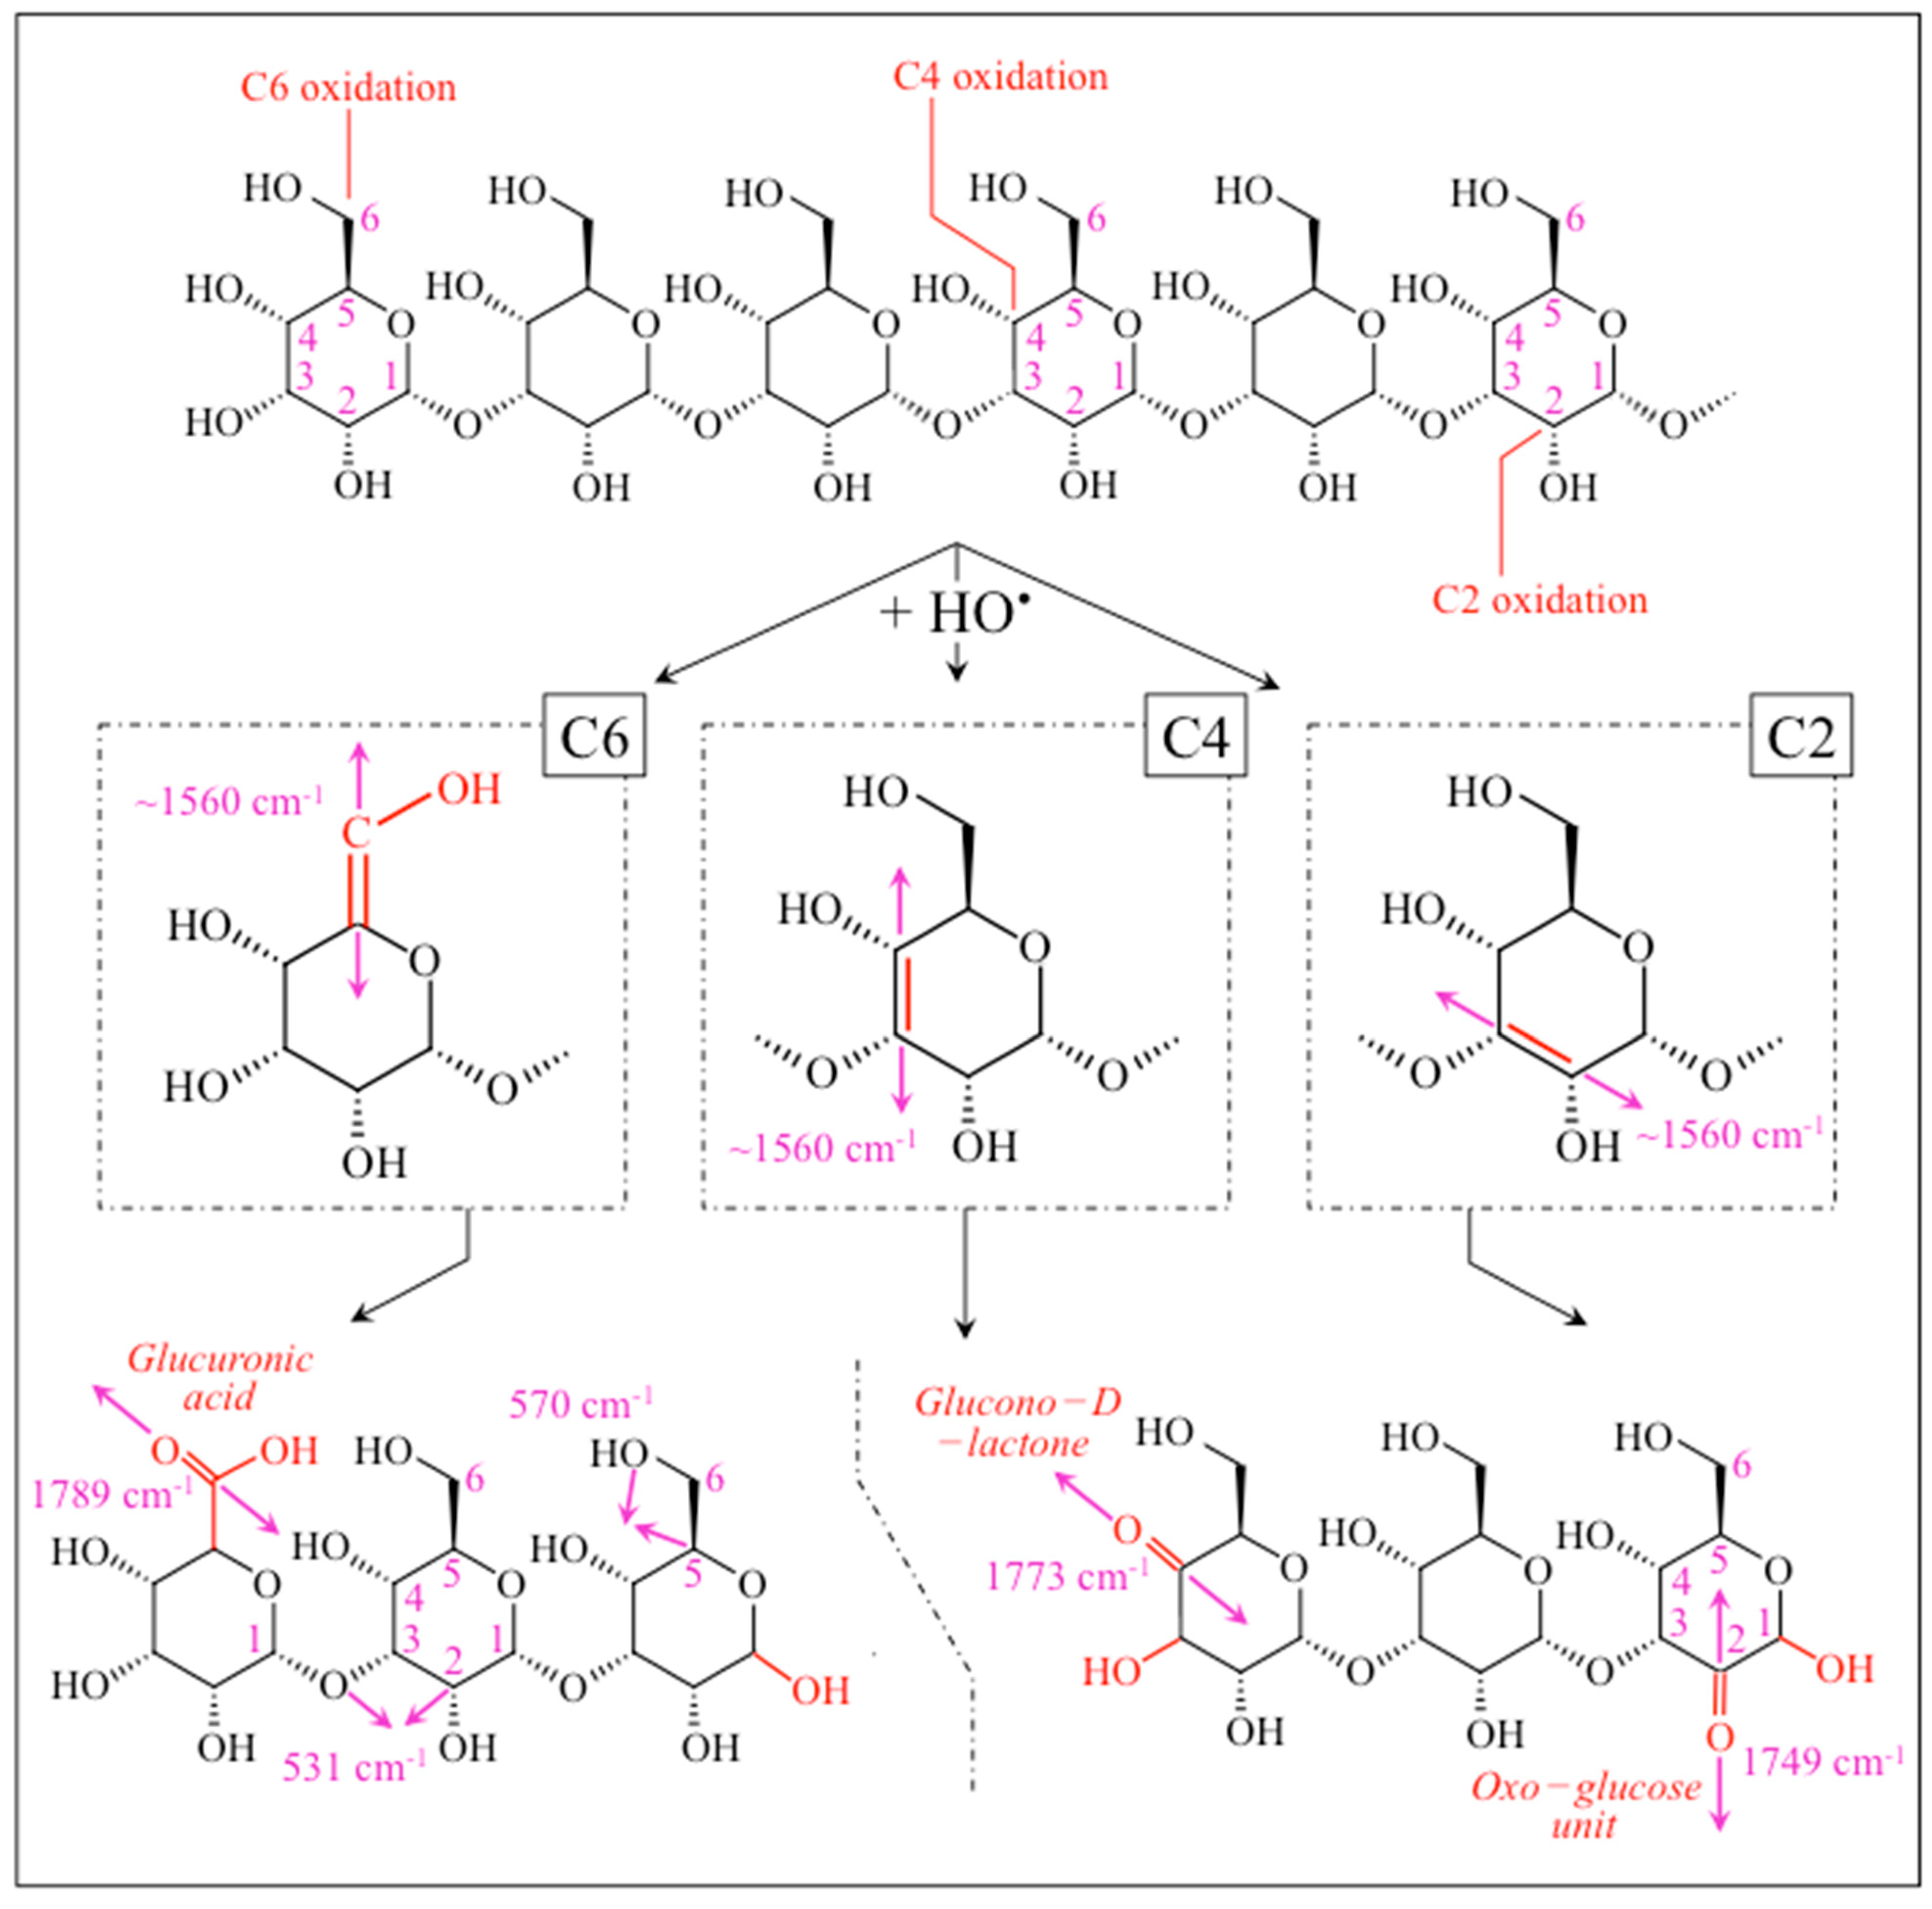
2.3. Raman Markers of Cocultures’ Biofilm Exopolysaccharides

Figure 7 shows Raman spectra collected in the wavenumber interval 600~1200 cm−1 for S. mutans and S. sanguinis individual cultures and cocultures at 24 h (cf. labels in inset). In this spectral zone, Raman markers for α– and β–glucans can be found at 948 and 892 cm−1, respectively. The ratio between these two Raman signals, Rα/β, thus links to the volumetric fraction of α– to β–glucans [42,43]. The Rα/β ratios computed for the set of culture/coculture investigated are given in inset to each spectrum in Figure 7a–e and comparatively plotted in Figure 7f with related statistics (cf. labels in inset).
This latter plot shows a gradual decreasing in α–glucan fraction with decreasing S. mutans population in coculture, reaching a minimum value for the culture of S. sanguinis alone (~50% that of the culture of S. mutans alone). This difference could be attributed to a decreasing trend for the fraction of α − 1,3–glucans, which can only be synthesized by S. mutans [38]. According to the calibration plot in Figure 3b, the ratio R(2)α3/α6 = I948/I919 could, in principle, be used to quantitatively evaluate the fraction of α − 1,3–glucans, Fα3. In the spectra of Figure 7a–e, the signal at 919 cm−1 appears as an intermediate band between those at 948 and 892 cm−1. However, this approach, which was successfully used in previous assessments of biofilms in Candida species [26,31], cannot be applied to biofilm produced by dental bacteria because, unlike the case of culturing Candida species, sucrose is externally added to bacterial cultures of streptococci (cf. forthcoming Section 4.1). Sucrose molecules present strong Raman signals in the C–C stretching region at 851, 872, and 922 cm−1, this latter band strongly overlaps the α − 1,6–glucan fingerprint at 919 cm−1 (cf. sucrose-related bands labeled with sharps in Figure 7a–e). The impossibility to deconvolute the contributions from α − 1,6–glucans and externally added sucrose to this signal impedes the application of the R(2)α3/α6 = I948/I919 Raman algorithm.
High spectrally resolved Raman spectra in Zone I (400~600 cm−1) are shown in Figure 8a–e for cultures and cocultures (at 24 h) with S. mutans to S. sanguinis ratios of 1:0, 1:1, 1:4, 1:8, and 0:1, respectively. The trend of the two C–C–OH deformation bands, appearing at 555 and 520 cm−1 (cf. vibrational modes and Raman intensity ratio, R(1)α3/α6 = I520/I555, in Figure 1a and Figure 2a, respectively), was used to quantitatively determine the fraction, Fα3, of α − 1,3–glucans contained in the biofilms according to the master plot shown in Figure 3a. The obtained Fα3 data are displayed in the plot in Figure 3a and replotted in Figure 8f with their statistical significance. As seen, the presence of S. sanguinis in coculture at any fraction ≥50% reduced the content of α − 1,3–glucans in the biofilms to less than a half (i.e., from ~87% to ~38%) with no statistical significance among different cultures except for comparisons with the culture of S. mutans only. There were also additionally important details by which the spectra of different cocultures differed in the 400~600 cm−1 spectral interval. They can be summarized in the following three items (cf. Figure 8a–e and band assignments in Table S1 of the Supplementary Information): (i) Two additional bands were found at 531 and 572 cm−1, whose relative intensity increased with increasing initial S. sanguinis population; (ii) a clear signal at ~478 cm−1 was detected only in the Raman spectrum of the 1:1 coculture (labeled with a blue sharp in Figure 8b); and (iii) a relatively strong signal was detected at ~493 cm−1 only in the culture of S. sanguinis alone (labeled with a green sharp in Figure 8e). Regarding the above item (i), the mentioned two bands correspond to C2–C3–O(–C1) (531 cm−1) and C5–C6–O(–H) (572 cm−1) bond deformation, and are both expected in α − 1,3–glucans. Their enhancement could be ascribed to the formation of shortened oligomers, to the presence of glucofuran rings, and/or to C–C–C bending or C–O torsion in glycogen (α − 1,4 glycosidic bonding) [44]. This point will be further considered in the forthcoming discussion section. The above item (ii), which is a signal only observed in the 1:1 coculture (cf. Figure 8b), corresponds to a wavenumber characteristic of S–S bond stretching in a ring structure [45].
This molecular feature is not intrinsic to the biofilm polysaccharide structure and its origin should be traced back to the competitive strategy of S. mutans, as discussed in the forthcoming Section 3.2. Finally, regarding the above item (iii), the 490 cm−1 signal, peculiar to the S. sanguinis culture, is characteristic of C–C–C bending in glycogen molecules [44,46,47]. When cultured in the presence of oxygen, which is the case here, S. sanguinis is known to accumulate large amounts of intracellular polysaccharide with prevalence of glycogen molecules [48]. Compared with other Streptococcus species, S. sanguinis exhibited the highest rate of glycogen synthesis and intracellular storage [49]. Moreover, under conditions of carbohydrate starvation, S. sanguinis was found to strongly prevail above S. mutans at least partly because of the intracellular possession of glycogen as energy source [50]. Upon matching the microscopic observation in Figure 4e with the Raman data in Figure 8e, it is suggested that, under the present culture conditions, S. sanguinis preferred to accumulate intracellular glycogen in addition to spending energy in building up a biofilm structure.
An additional spectral zone of interest with respect to the metabolism of bacteria in a coculture could be located in the wavenumber interval 1600~1800 cm−1. High spectrally resolved Raman assessments in this wavenumber zone are shown in Figure 9a–e for cultures/cocultures at 24 h with S. mutans to S. sanguinis ratios of 1:0, 1:1, 1:4, 1:8, and 0:1, respectively. This spectral zone, which is dominated by stretching vibrations of the carbonyl C=O bonds, presented four distinct bands at ~1723, 1735, 1763, and 1786 cm−1 (cf. band assignments as summarized in Table S1 in the Supplementary Information).
The presence of several different wavenumbers for the C=O bands indicates a variety of locations in which the carbonyl unit has formed as a result of environmentally assisted biofilm processes. Note, however, that some of the above band components displayed a quite weak intensity, comparable with the noise level. Therefore, it is difficult to use these bands to draw final conclusions on their specific meaning. An important hint for the interpretation of C=O stretching signals is the observation that their intensity, comparatively weak in single-cultured bacteria (cf. Figure 9a,e), becomes gradually enhanced with increasing initial fraction of S. sanguinis in coculture (cf. Figure 9b–d). This trend might suggest that the gradual enhancement of carbonyl groups is associated to the competitive strategy adopted by both S. sanguinis (i.e., its ability to produce hydrogen peroxide) [11]. This point is further discussed in the forthcoming Section 3.2.
Phillips et al. [51] developed calibration plots using the ratio between the 1730 and the 941 cm−1 bands for a quantitative determination of the degree of substitution of carbonyl units, S, in a number of different carbohydrate structures. These researchers found that all plots were linear with nearly the same slope. Using that calibration slope for the intensity ratio of the 1725 to the 949 cm−1 bands in the present spectra, one could compute an increasing amount of carbonyls with increasing fraction of S. sanguinis in coculture up to more than 50% (cf. Figure 9f).

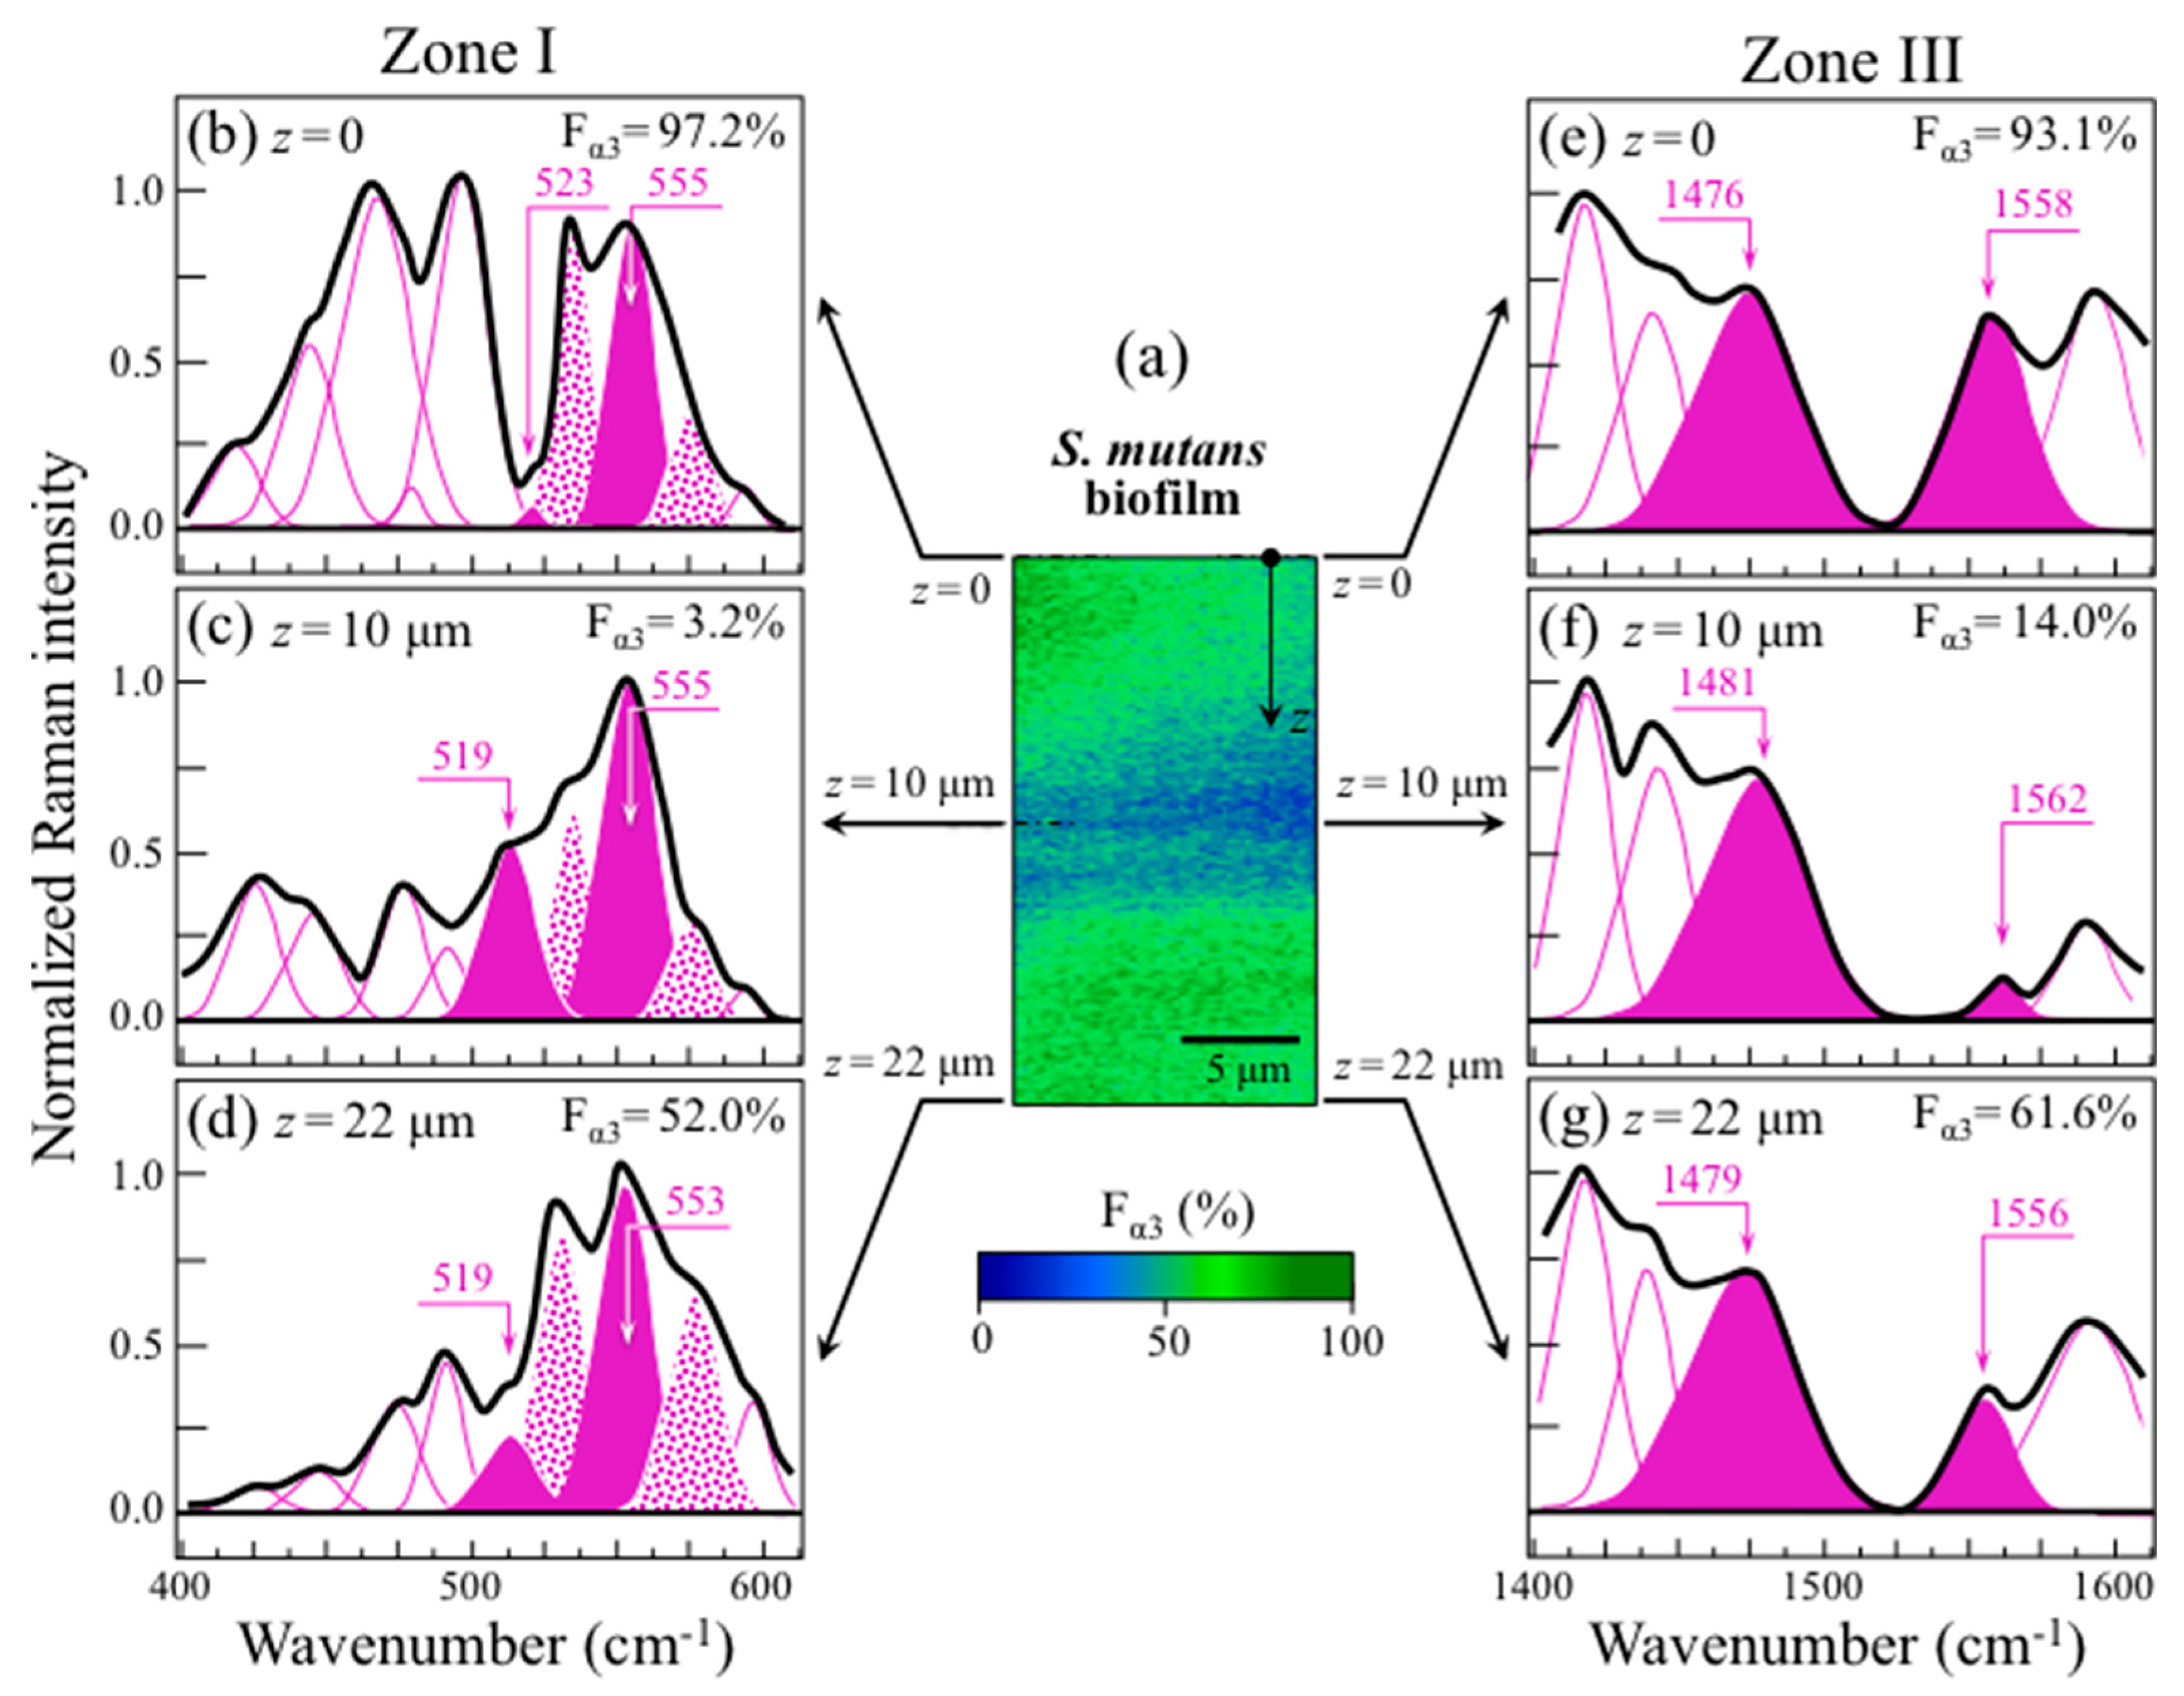
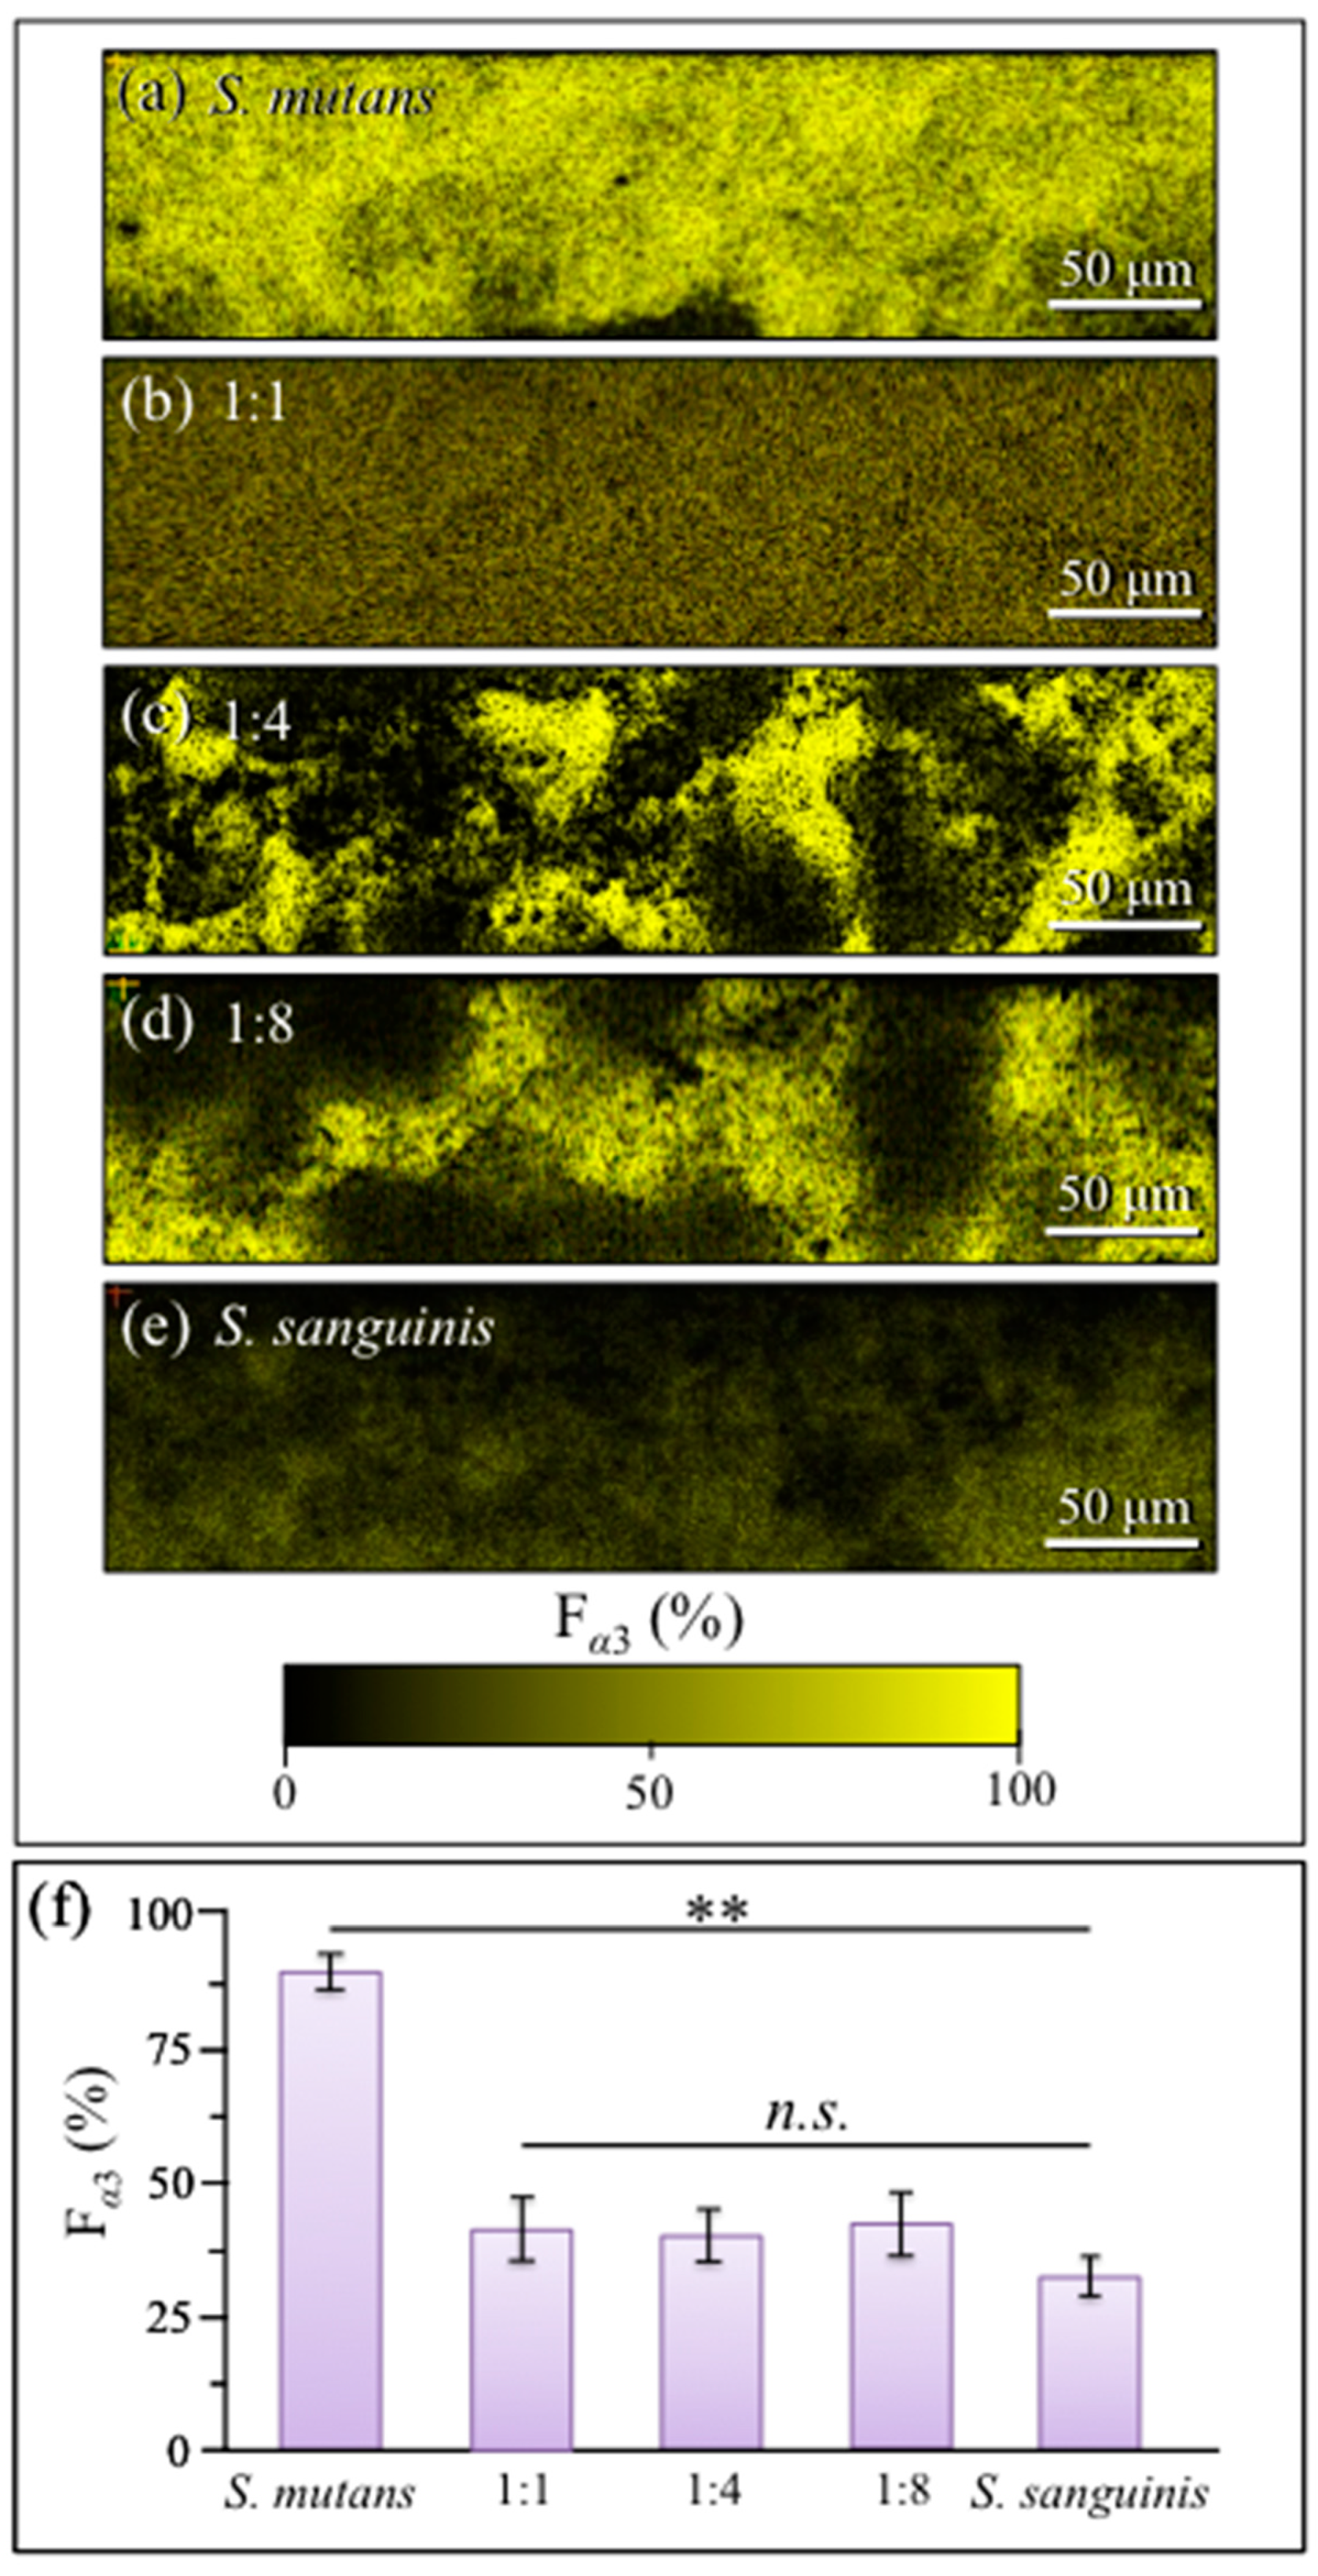
2.4. Raman Imaging of Water-Insoluble Exopolysaccharides Fractions

In order to spatially visualize the locations of α − 1,3–glucan metabolites within culture/cocultures of S. mutans and S. sanguinis, Raman images were collected with sub-micrometric spatial resolution (Figure 10a–e; cf. labels in inset). This procedure made it available a large number of spectra (in the order of 106 per each map), which also served to confirm the statistical validity of trends recorded on average spectra (i.e., as described in the previous sections). In this perspective, Raman imaging could be considered as complementary to the Raman approach based on averaging over spectra collected with a relatively low-magnification optical probe (20×) (i.e., Figure 8). Figure 10f shows average values of α − 1,3–glucan fractions, Fα3, as computed by averaging R(1)α3/α6 = I520/I555 ratios over the entire Raman images (n = 3 for each culture/coculture), according to the calibration plot in Figure 3a. Fα3 values from the two different data-collection procedures (i.e., average spectra on large areas in Figure 8f vs. average of a large number of spectra from images in Figure 10f) showed agreement within ±10%, thus statistically validating the obtained data.
In addition to strengthening statistical validation, the Raman visualization of α − 1,3–glucans’ distribution in live biofilms provided us with vivid snapshots of the competition between the two antagonist streptococci. The morphology of α − 1,3–glucan distribution in the S. mutans culture was that of a dense and continuous “blanket” (Figure 10a), while no such Raman signals could be observed in the S. sanguinis culture (Figure 10e). Even amounts of streptococci (i.e., the 1:1 coculture) led to a continuous but conspicuously less dense α − 1,3–glucan distribution (Figure 10b) while higher fractions of S. sanguinis (i.e., 1:4 and 1:8) discontinued the α − 1,3–glucan “blanket”, but yet they displayed regions of its high density (Figure 10c,d, respectively). The spatial architecture of the biofilm formed in S. mutans/S. sanguinis cultures/cocultures is an important feature since it visualizes biofilm impermeability. This point will be discussed in detail in the next section.

3. Discussion

3.1. Biofilm Vibrational Markers and Competition/Coexistence Strategies

In a spectroscopic probe of competitive mechanisms between different streptococcal species coexisting in the same ecological niche, we confirmed here that S. mutans and S. sanguinis engage in reciprocal antagonistic interactions to gain spatial supremacy and documented new details of their interactions. Coexistence of the concurrently inoculated streptococci in various fractions involved fundamental alterations of the exopolysaccharide glucans’ structure of the formed biofilm. Data from Figure 7 demonstrated a gradual reduction (down to ~50%) in the α– to β–glucans ratio, Rα/β, with the volume fraction of water-insoluble α − 1,3–glucan molecules also being reduced by ~50% for any fraction of S. sanguinis added in coculture (cf. Figure 8 and Figure 10). Raman imaging then confirmed that only S. mutans creates abundant α − 1,3–glucan molecules in the biofilm and unveiled the spatial dependence of biofilm structure on S. sanguinis fraction (Figure 10).
The percentage of α − 1,3–glucans in biofilm reduced to more than half at any fraction of S. sanguinis ≥50% in coculture, but spatial homogeneity in the biofilm structure was only preserved for the 50% fraction (cf. Figure 10b). Concurrently, oxidation at various sites in the glucans’ molecular chain was detected, as proved by a series of C=O carbonyl stretching bands located in the narrow spectral region 1720~1790 cm−1 (Figure 9). The origination of short oligomers and their subsequent oxidation can cause the formation mid-chain glucuronic acids (at C6 position), carbonyls at C2 to form oxo–glucose units, as well as carbonyls at the non-reducing end from lytic C4 oxidation (glucono–D–lactone units) [52]. However, breakage of glucan chains and subsequent formation of carbonyl bonds at various molecular sites necessarily involve interactions with oxygen radicals to form shorter oligomers as a consequence of glycosydic bond cleavage [52,53]. It should be noted that contributions to the detected esters from lipid metabolites from bacteria could not be completely ruled out. Nevertheless, the observed progressive increase in such signals in cocultures increasingly rich in S. sanguinis (cf. Figure 9), while significantly weaker in both S. mutans and S. sanguinis single cultures, supports the hypothesis that the main contribution to ester bands is a consequence of the interaction between the two bacterial species.
Possible mechanisms for the action of oxygen radicals are discussed later in this section. Figure 11 shows a draft of possibly oxidized carbonyl sites (compiled according to Ref. [52]) as positioned in a glucan chain cleaved by HO• radicals; the respective (guessed) Raman frequencies are given in inset. The draft also envisages the possible formation of transient C=C bonds, which could contribute the intensity of the observed ~1560 cm−1 band. Indeed, the R(3)α3/α6 = I1568/I1482 ratio increased from 0.08 to 0.13 with increasing S. sanguinis fraction in coculture (cf. Figure S2 in the Supplementary Information). According to the calibration plot in Figure 3c, such an increase apparently indicates a nearly doubled α − 1,3–glucan fraction, Fα3 (from ~20 to 40%), while one would expect a decrease in the α − 1,3–glucan metabolite with decreasing fraction of S. mutans in coculture (cf. Figure 8f and Figure 10f). This trend confirms that the C=C signal at 1560 cm−1 is contributed by different molecules; not only the transient oxidation products of biofilm α − 1,3–glucans (and related glucansucrase enzymatic molecules) as produced by S. mutans, but also cells proteins (i.e., tryptophan ring vibrations) present in any of the two bacteria. Note that this circumstance rules out the possibility to use the R(3)α3/α6 Raman ratio for calibrating the α − 1,3–glucan fraction in live biofilm, but yet allows reasonably estimating α − 1,3–glucan fractions at specific locations lacking bacterial cells (e.g., upper and lower layers of biofilm cross sections; cf. Figure 6).
While micrographs in Figure 4 showed a thick and continuous biofilm even in the culture initially inoculated with a quite minor fraction of S. mutans (i.e., 1:8; cf. Figure 4d), Raman data suggest that the formed biofilms were quite altered with respect to the structure of their exopolysaccharides for both 1:4 and 1:8 inoculation fractions of S. mutans. Regarding the three-dimensional structure of S. mutans’ biofilm (Figure 6a), in-depth confocal Raman map revealed strong gradients in glucan structure, with top and bottom layers ~1/3 of the biofilm thickness containing high fractions of α − 1,3–glucans (i.e., >90% and 50~60%, respectively). The conspicuous elimination of α − 1,3–glucan molecules, as observed in coculture including S. sanguinis, should render the biofilm much less impermeable to the external environment (a situation preferred by S. sanguinis).
This is evident in the α − 1,3–glucan-free domain-like structure at prevalent fractions of S. sanguinis (cf. Figure 10c,d) while the uniform reduction in α − 1,3–glucan (and biofilm impermeability) at 1:1 initial fraction could be the result of a yet somewhat “chaotic” bacterial distribution within the biofilm (cf. Figure 10b).
The origin of a consistent reduction in α − 1,3–glucan content with increasing fraction of S. sanguinis in coculture agrees with the linkage analyses by Kopec et al. [32], which showed that glucans in S. sanguinis biofilm are predominantly α − 1,6 –linked and have only a small amount of α − 1,3–linked glucose. However, the observed trend could also be contributed by the capacity of this species to produce H2O2 [11]. The hypothesis of a “radical-chemistry effect” is supported by the finding of Raman fingerprints for oxidation of shortened oligomers (cf. Figure 9). As mentioned above, cleavage of glycosidic bonds can only occur by the effect of HO• radicals in a reaction system of hydrolysis (glycoside hydrolase) [52,53,54]. Hydrogen peroxide is well known to possess a low but stable reactivity capable of generating reactive oxygen radicals that efficiently degrade polysaccharides [53]. It is also established, through accurate genomic analyses, that, unlike S. mutans, S. sanguinis can only produce one type of glucosyltransferase, which synthesizes soluble glucans [55,56,57,58]. This, together with the low attitude of S. sanguinis to form biofilm in BHI medium [33], explains why a culture of only S. sanguinis showed a negligible amount of biofilm (cf. Figure 4e). However, we also observed large amounts of biofilm in cocultures with predominant fractions of S. sanguinis, which confirms that this bacterium is capable of exploiting metabolites produced by S. mutans. Zhu and Kreth [59] have described in detail the antagonistic effect of H2O2 on the oral biofilm developed by S. sanguinis. Although the main effort of S. sanguinis is that of eliminating competitors with the goal of promoting the integration of H2O2-compatible species in the biofilm, the production of H2O2 also causes the release of extracellular DNA into the environment, which is used to promote biofilm formation (as it is observed here) and to support adaptation processes. S. sanguinis is known to produce alpha-hemolysis on blood agar; a characteristic linked to the ability of streptococci to oxidize hemoglobin in erythrocytes by secretion of oxygen peroxide [60]. S. sanguinis genes related to the generation of H2O2 are essential in repressing S. mutans [61,62]. Conversely, S. mutans, in order to protect itself against H2O2 damage, has genetically built up an efficient H2O2-resistance system [63,64]. Superoxide dismutase and eukaryotic-type serine/threonine protein kinase also boost up the ability of S. mutans to deal with damages from reactive oxygen species in order to coexist with S. sanguinis [65]. This chemical machinery is essential for the survival of S. mutans in healthy oral flora, in which S. sanguinis prevails. The present data indeed confirm this understanding by showing that S. mutans is capable to survive even under conditions of striking minority (cf. Figure 10d).
As mentioned above, independently existing unpaired electrons from reactive hydroxyl radicals, HO•, are required for the occurrence of glycosidic bond-cleavage [52,53,54]. In human oral environment, HO• formation from the non-radical H2O2 molecules generated by S. sanguinis entails the occurrence of a catalytic cycle triggered by two concurrent chemical circumstances: (i) the pro-oxidant activity of a reducing agent (e.g., ascorbic acid directly produced by bacteria or from the diet), and (ii) the reduction of intrinsic iron by superoxide ions O2 to produce O2 (by auto-oxidation) and Fe2+ ions. These latter ions then react with H2O2 to produce HO• according to Fenton reaction [53,61]. In the present in vitro experiments, environmental pH in the cocultures was set at homeostatic value (pH = 7.2 ± 0.2); iron ions were present in the BHI broth (16.85 μM) [66] and most likely were effectively sequestered by S. sanguinis [67]. The above metabolic machineries enabled S. sanguinis to open a significant amount of permeable domains in the biofilm built by S. mutans by both disrupting the α − 1,3–glucan structure and scavenging extracellular DNA to promote its own biofilm formation. These actions supported penetration of environmental water and newly dissolved O2 molecules, which trigger the formation of new radicals, promoted further hydrolysis and additional domain opening, and ultimately allowed S. sanguinis to proliferate.

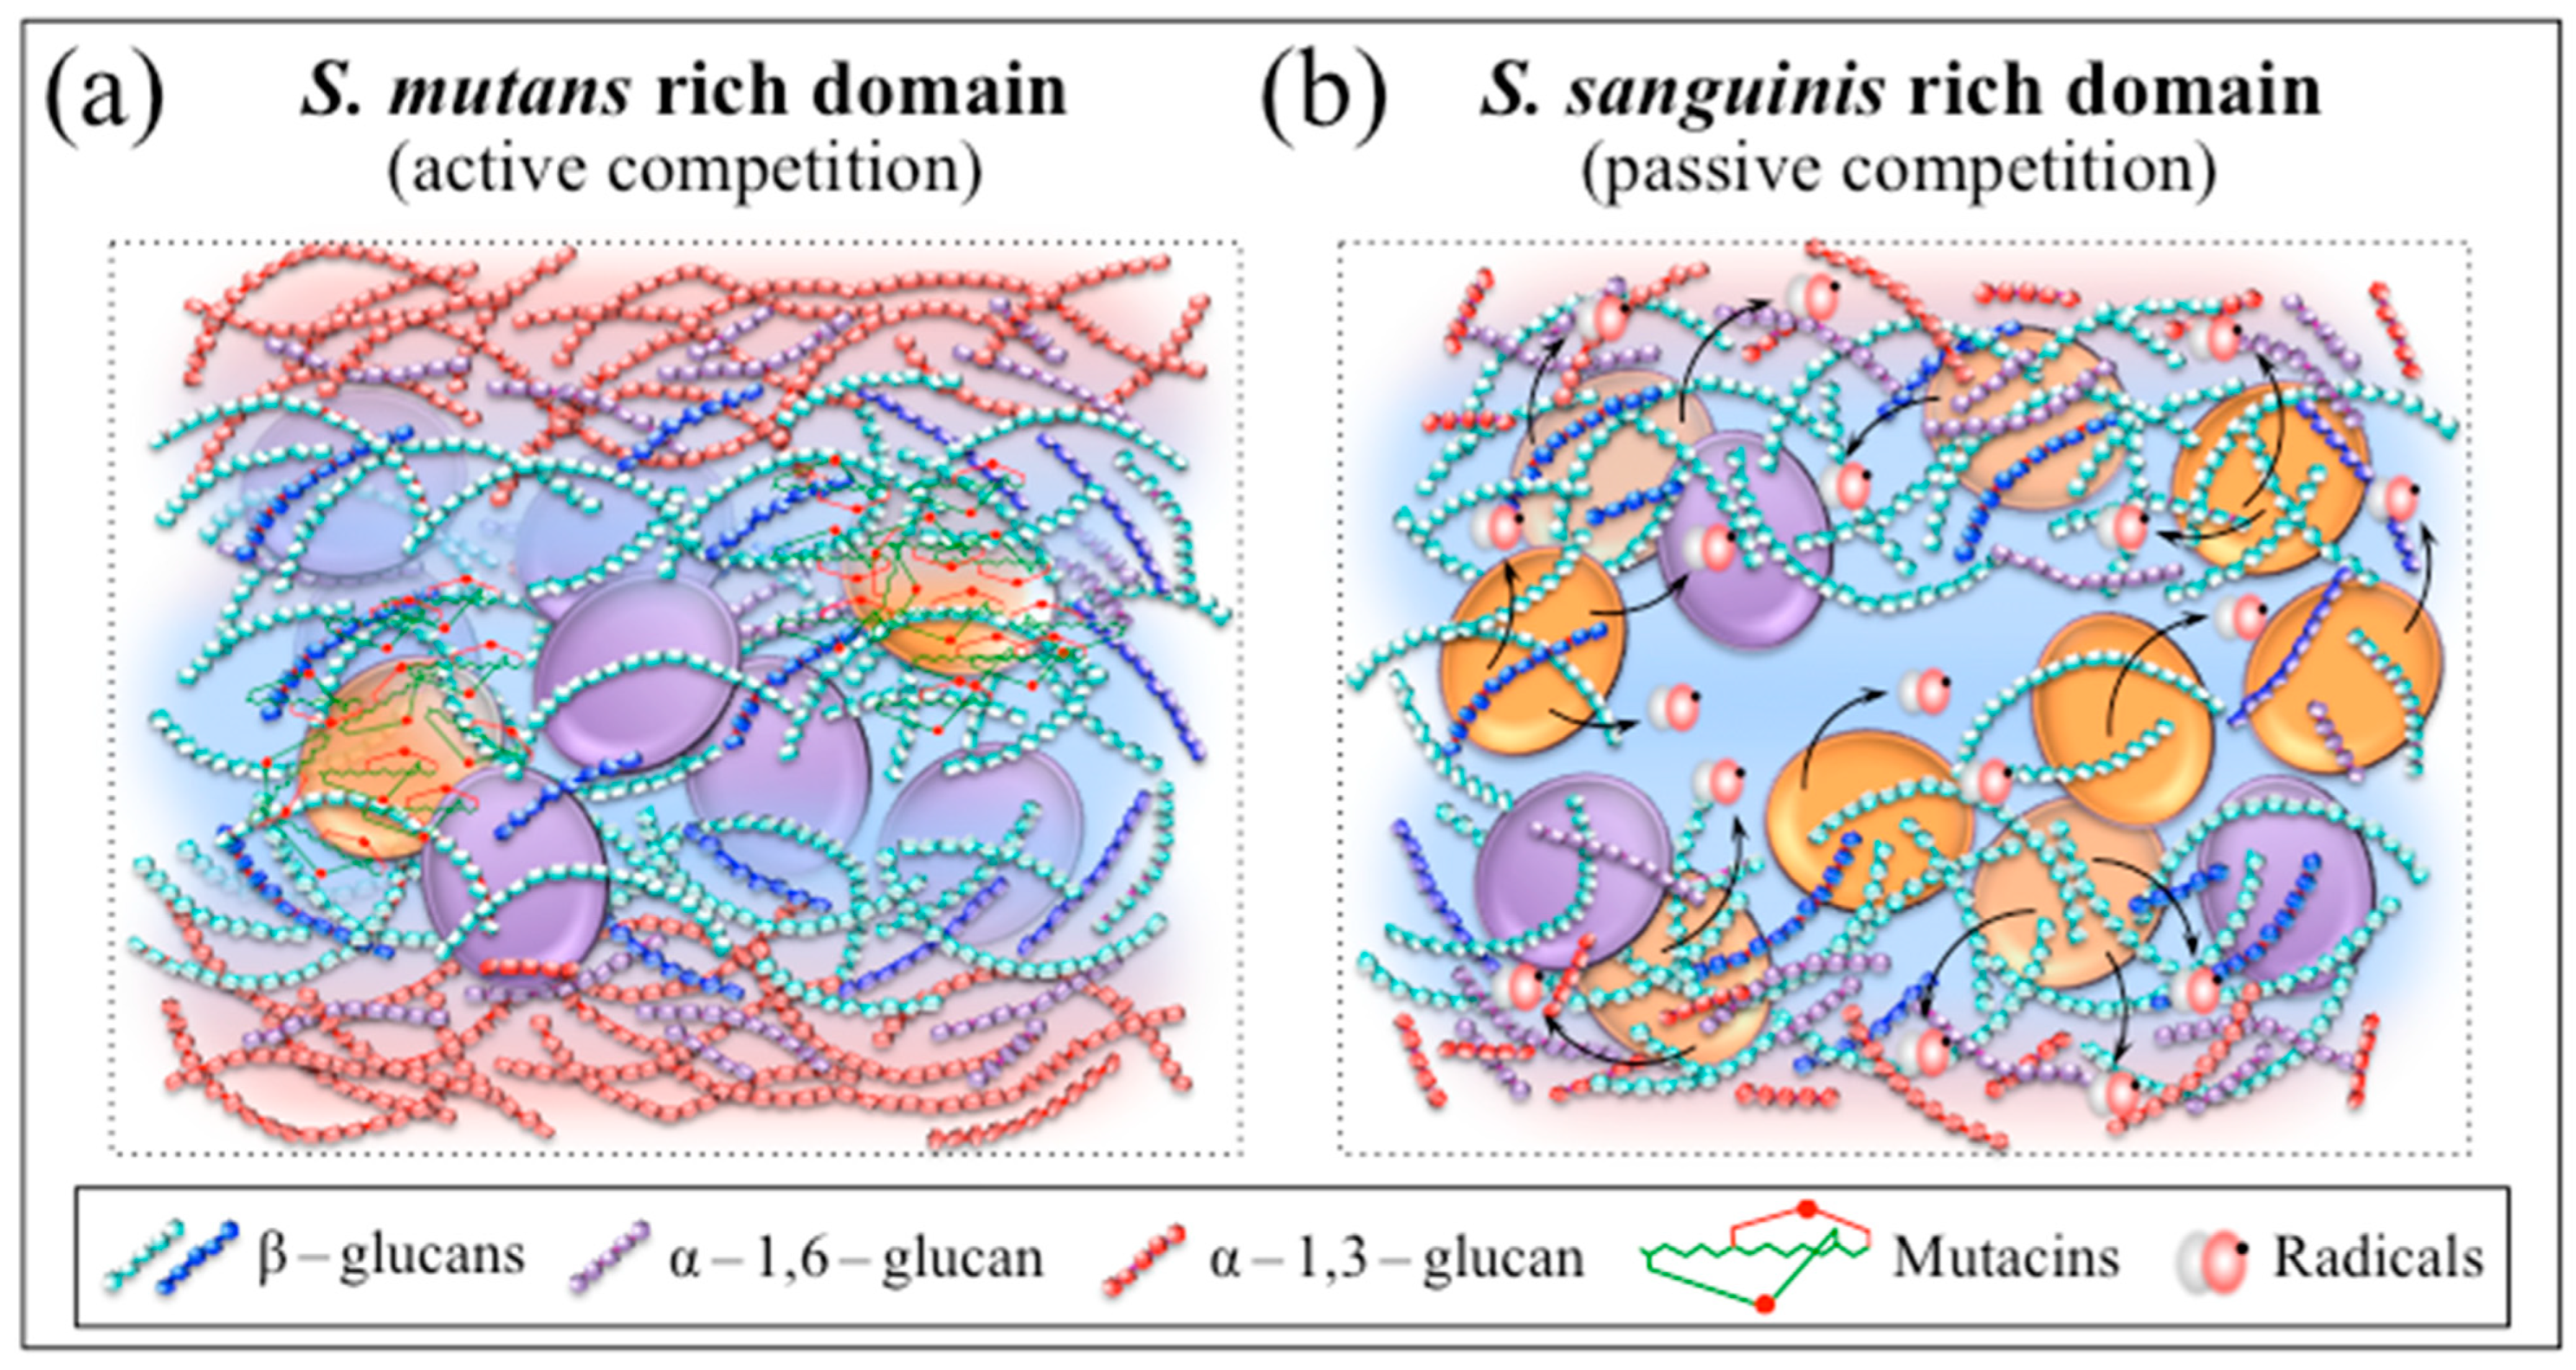
3.2. “Chemical Weapons” in Active and Passive Competitive Exclusion

Genetic and biochemical analyses by Kreth et al. [11] demonstrated that diffusible substances produced by S. mutans and S. sanguinis (more specifically, mutacin and H2O2, respectively) were responsible for the antagonistic interactions ultimately leading to the observed mechanism of competitive exclusion. In that study, competition assays performed on biofilms showed that mutual exclusion by such inhibitory substances only occurred when the two species were inoculated in sequence (with the early inoculated one prevailing). Conversely, no competition occurred when both species were inoculated at the same time, thus leading to coexistence. This indeed was also the case of the present experiments, in which concurrent inoculation always led to coexistence whatever the fraction of S. sanguinis up to 87.5% (cf. biofilm micrographs in Figure 4). However, Raman imaging (Figure 10) revealed new details of the “chemical” competition strategy developed by S. sanguinis according to the mechanisms described in the previous section.
Since a bacterial strain is considered to be competitive if it causes a fitness decrease in a competitor strain [68], the present study confirmed that both the investigated streptococcal bacteria presented competitive characteristics. However, the competitive action by S. sanguinis resulted to be passive in nature since the production of inhibitory substances (oxygen radicals) only indirectly created environmental disadvantage to the competing species (i.e., rather than directly inducing rival cell damage or lysis). Classifications in the frame of passive competition usually foresee several different strategies. Bacteria might secrete digestive enzymes [69,70] or siderophores [71,72] to restrict competitor’s access to nutrients or alter metabolic regulation to enhance their own nutrient utilization [72]. In alternative, some strains have been reported to reduce the expression of costly genes upon exploiting expression products from other strains (i.e., the so-called “cheating effect”) [69,71,73,74]. Finally, passively competitive strains might produce specific molecules that impact space structure and enable space gain (e.g., surfactants or rhamnolipids) [75,76,77,78,79]. This latter was definitely the case of S. sanguinis in the present study. As first demonstrated here, this bacterium acted to locally discontinue the network of water-insoluble biofilm exopolysaccharides built by S. mutans in order to create niches of permeable biofilm in which it could more likely dominate.
Regarding the competitive strategy of S. mutans, in situ Raman experiments confirmed the secretion of polycyclic peptides containing thioether amino acids (cf. increase in the intensity of S–S band in the low-frequency spectrum of Figure 8b), but only in the 1:1 coculture. Unlike the case of S. sanguinis, the nature and the effect(s) of such competitive strategy could not be clearly visualized by Raman imaging. However, since lantibiotics, when synthesized by ribosomes and post-translationally modified to their biologically active forms, generally possess antimicrobial properties, the competitive strategy of S. mutans should be considered as active in nature [80]. A number of differently structured mutacins (i.e., classified as lantibiotic and nonlantibiotic structures) are active against at least 11 species of streptococci by docking receptor on the cell membrane, forming disrupting pores on it, and/or directly interfering with cell wall biosynthesis [81]. Lantibiotic mutacins, which possess a wider spectrum of activity than nonlantibiotic, contain post translationally modified peptides, including either lanthionine or methyllanthionine ring structures in addition to dehydrated amino acids [82]. According to Merritt and Qi [80], the bactericidal activity of specific mutacin lantibiotics (i.e., of Type A) features lipids as docking molecules for simultaneous pore formation and inhibition of cell wall synthesis. Conversely, Hossain and Biswas [83] reported about two specific nonlantibiotic mutacins (mutacins IV and V) produced by S. mutans, which synergistically act to inhibit the growth of other bacteria. S. sanguinis attempts to reduce mutacin production by inactivating the S. mutans competence-stimulating peptide, a quorum sensing signal inducing mutacin gene expression [84]. Nonlantibiotics (most active against closely related species) are unmodified peptides including one or two separate molecules [85,86], which accumulate intracellularly and interact with membrane receptors leading to competitors’ lysis. The present analyses of Raman spectra did not enable an exact discrimination of the lantibiotic or nonlantibiotic nature, neither to draw the chemical structure of the mutacins active against S. sanguinis. However, the signal from a sulfane–sulfur bond detected ~478 cm−1 (only in the 1:1 coculture; cf. blue sharp in Figure 8b) hinted to an S–S bond stretching in ring structures (i.e., present in lantibiotic molecules as lanthionine) while the short polymeric sulfur chains of nonlantibiotics are expected to produce a broader signal at ~10 cm−1 lower wavenumbers (not observed here given the perfectly symmetric morphology of the 478 cm−1 signal; cf. Figure 8b) [87,88,89,90]. This spectroscopic characteristic seems to confirm that S. mutans produces mutacins to kill peroxigenic streptococci [91]. Despite a lack of specificity for the S–S Raman signal, the availability of a Raman fingerprint for mutacins could be key in directly monitoring in situ and in time lapse of the level of S. mutans competitive activity in the presence of other bacterial species. This point deserves a more specific experimental approach in future studies. Provided that vibrational aspects of the chemical mechanisms behind the competitive behavior of S. mutans strains could further be clarified, novel functions could be discovered and a potential diagnostic approach could become available for and real-time on-site assessments of oral biofilm pathogenicity.
In summarizing the present findings, Figure 12a,b schematically depict biofilm zones in which S. mutans and S. sanguinis populations prevail, respectively. In the former case, which foresees a biofilm rich in water-insoluble (and impermeable) exopolysaccharides, S. mutans uses mutacins in the attempt to directly exterminate the S. sanguinis competitor according to an active competition strategy. In the latter case, S. sanguinis adopts a passive competition strategy and eliminates water-insoluble exopolysaccharides by producing oxygen radicals that open water-permeable “holes” in the biofilm structure. In these oxygen-rich zones, the S. mutans competitor could hardly dominate. In summary, Raman spectroscopy enabled us to retrieve and image so far unknown molecular-scale details about the sophisticated interspecies interactions that balance competition/coexistence within S. mutans/S. sanguinis microbial communities.

3.3. Raman Technology in Oral Health and Limitations of the Present Study

Oral diseases represent a major global public health issue with dental caries covering a prevalent economic burden and being responsible for a significant degradation of the patients’ quality of life [92]. Control of composition and metabolism of the oral flora is key in preventing oral diseases, but these factors can hardly be monitored with sufficient precision within the limited time of a clinical session. Raman spectroscopy has the potential to become a unique chairside technology to sensitively and rapidly detect changes at the molecular level both in tissue and oral flora. However, quantitative Raman analyses require the construction of detailed and comprehensive algorithms, which in turn necessitate the construction of complex biochemical and vibrational database.
In previous Raman studies of enamel and dentine tissue demineralization [93,94,95,96], imaging algorithms for estimating the risk of caries have been proposed, which utilize the totally symmetric stretching mode of phosphorous tetrahedra as a sensor of calcium vacancy concentration. Raman signals arising from the internal vibrations of the phosphate ion (PO43−) are quite strong and dominate the experimental spectrum of enamel, which makes this Raman procedure so far the closest to an actual clinical use. Unlike the relatively straightforward algorithms for Raman analyses of demineralization in hard tissues, Raman analyses of pathogenic flora inhabiting the oral cavity require massive vibrational information from elementary organic molecules and precise interpretations of pronounced band overlap [26]. In order to reverse the spectral features into useful biochemical information at the molecular level in such complex systems, bioinformatics, statistics, and machine-learning algorithms should be constructed that enable physically sound spectral deconvolutions empowering the Raman method. A widely adopted method to assist Raman diagnosis and prognostic assessments of pathogenic oral flora relies on principal component analyses (PCA)-based chemometrics [23,97,98,99,100]. In case of speciation deficiencies by the PCA method, Raman barcoding has been proposed, which allows obtaining a greater depth in capturing structural details than merely comparing spectral morphologies as done in PCA analyses [26,27,29].
The present Raman analysis of streptococcal cocultures involved several molecules of difficult identification whose elementary spectra are yet conspicuously unknown (i.e., mutacin lantibiotics and nonlantibiotics). This circumstance made a complete spectral deconvolution by machine-learning algorithms (and related barcodes) of difficult application. Accordingly, only selected spectral areas could be analyzed. Specifically, we focused on distinct biomarkers that are associated with fingerprint bonds of key molecules: C–O–C glycosydic bonds in exopolysaccharides and S–S bonds in ring-structured mutacins. While an advantage of this partial approach is given by the straightforward data analysis and the relatively good discrimination efficiency, its main limitation resides in the fact that a wealth of important biochemical details yet remains buried in the unexplored spectral regions. The possibility of performing reliable real-time routine assessments of the stage of active competition of S. mutans in patients’ oral plaque would certainly represent a significant step forward for human clinical purposes. From this viewpoint, the Raman analyses presented here, although yet incomplete, demonstrate that signals from selected exopolysaccharides directly link to the state of antagonistic interactions between coexisting bacterial populations. This unique biochemical circumstance holds promise specifically for real-time quantitative analyses of oral plaque specimens and calls for further investigations on ex vivo samples.

4. Materials and Methods

4.1. Bacterial Strains and Culture Conditions

S. sanguinis strain ATCC10556 (serotype c) and S. mutans strain ATCC 700610 were purchased from American Type Culture Collection (ATCC; Manassas, VA, USA). Both strains were expanded in BHI broth (Nissui Pharmaceutical, Co. Ltd., Tokyo, Japan) at 37 °C and then cultured individually or at S. sanguinis-to-S. mutans concentration ratios of 1:1, 1:4, and 1:8 in 1.5 mL BHI broth (pH = 7.2 ± 0.2) with 0.5% sucrose (Nacalai Tesque, Inc., Kyoto, Japan) containing 0.5 mL human saliva (Normal Saliva, Single Human Donor; Lee Biosolutions, Maryland Heights, MO, USA) under anaerobic conditions (AnaeroPack®, Mitsubishi Gas Chemical Co., Tokyo, Japan). Human saliva samples were sterilized by membrane filtration through a sterile 0.22-μm filter (Dismic® Membrane Filters, 0.22-μm pore size, Advantech Toyo Kaisha, Ltd., Tokyo, Japan). Cocultures were observed with a laser microscope (VK-x200 series, Keyence Co. Ltd., Osaka, Japan).
Biofilms were washed in phosphate-buffered saline solution in order to remove the planktonic bacteria. The biofilms were then incubated in 1 mL of 0.5 M sodium hydroxide solutions (Nacalai Tesque, Inc., Kyoto, Japan) for 15 min and vortex-agitated for 15 s in order to detach the adhered biofilms from the plate and to dissolve water-insoluble glucans. The solution was then centrifuged at 5000 rpm for 10 min in order to separate the dissolved glucans from the bacteria embedded in the biofilms [101,102]. The amount of glucans was measured by phenol-H2SO4 (phenol-sulfuric acid method) at an absorbance of 490 nm and displayed as OD values. After this procedure, 200 µL of each of the resulting solutions was pipetted into separate wells of a 96-well flat-bottom microplate to measure the amount of glucans (Total Carbohydrate; mM) with the plate reader. To obtain a standard curve, 0, 0.063, 0.125, 0.25, 0.5, 1.0, 2.0, and 4.0 mM of carbohydrate standard was titrated using the Total Carbohydrate Assay Kit (Cell Biolabs, Inc., San Diego, CA, USA).

4.2. Nuclear Magnetic Resonance Analyses

Biofilms of S. mutans culture were washed in distilled water by centrifugation at 5000 rpm several times, then the biofilm precipitates were freeze dried. The reference α-1,3-glucan was synthesized by enzymatic polymerization as described in a previous paper [103]. In brief, recombinant GtfJ enzyme was incubated for two weeks at 30 °C in 50 mM citrate buffer (pH 5.5) containing 0.5 M sucrose and 0.01% NaN3. After incubation, the reaction mixture was centrifuged at 5000 rpm to separate insoluble product, then the precipitate was re-dispersed in distilled water followed by centrifugation several times, then freeze-dried. The reference α-1,6-glucan (Dextran 150,000) was purchased from FUJIFILM Wako Chemicals (Japan). The dried biofilms and reference α-glucans were dissolved in 2% NaOD in D2O at a concentration of 40 mg/mL containing 3.5 mg NaBD4, 13C NMR measurement were performed using a JNM-A500 FT-NMR system (500 MHz, JEOL Ltd., Tokyo, Japan).

4.3. Raman Library, In Situ Raman Spectroscopy, and Raman Imaging

A library of reference Raman spectra was built up, which contained more than 40 elementary compounds and including polysaccharides (chitin, β-1,3-glucans, β-1,6-glucans, α–1, 3–glucans, α–1, 6–glucans), mono- and disaccharides (trehalose, β-D-glucose, D-dextrose), anionic lipids (phosphatidylglycerol, phosphatidylethanolamine, cardiolipin), and other key metabolites such as adenine and other nucleic acids. The reference α-1,3-glucan samples were provided by Tokyo University [104]. The library was compiled with high spectrally resolved Raman spectra collected with a triple-monochromator device (T-64000; Jobin-Ivon/Horiba Group, Kyoto, Japan) equipped with a nitrogen-cooled charge-coupled device detector (CCD-3500V, Jobin-Ivon/Horiba Group, Kyoto, Japan). The excitation source was the 514 nm line of an Ar-ion laser operating with a nominal power of 20 mW. The spectral resolution was better than 1 cm−1.
High spectrally resolved Raman spectra were collected in situ on bacterial cocultures using a spectrometer specially designed for measurements on biological samples (LabRAM HR800, Horiba/Jobin-Yvon, Kyoto, Japan). An optical circuit set in confocal mode with a 20× objective lens and employing a holographic notch filter concurrently enabled high signal efficiency and high spectral resolution. The wavelength of the incoming light was a 532 nm emitted by a solid-state laser source operating at 10 mW. The Raman scattered light was monitored by means of a single monochromator interfaced with an air-cooled charge-coupled device (CCD) detector (Andor DV420-OE322; 1024 × 256 pixels). The acquisition time for a single spectrum was typically 10 s. A spectral resolution of better than 1 cm−1 was achieved by concurrently collecting (at each measurement) an internal reference signal from a selected neon lamp to calibrate the spectrometer. Twenty spectra collected at different locations (over a total area of ~2 mm2) were obtained for each bacterial culture/coculture and averaged in order to obtain representative spectra. All presented Raman spectra were recorded on samples collected after 24 h in culture under exactly the same conditions.
Raman imaging was recorded with a dedicated Raman device (RAMANtouch, Nanophoton Co., Minoo, Osaka, Japan) operating in microscopic measurement mode (100× lens; numerical aperture, NA = 0.9) with confocal imaging capability in two dimensions. This equipment was capable of achieving an in-plane spatial resolution up to 300 nm by exploiting a specially designed spectrograph with completely compensated aberration, which greatly improves spatial resolution of the optical objective. A dedicated confocal optics also enabled high spatial resolution (~670 nm) along the out-of-plane z-direction, as previously calibrated using a preliminary line-scan along the z-axis to find signals from a calibration substrate. As an additional peculiarity, this Raman microscope was capable to achieve ultra-fast simultaneous image acquisition of up to 400 spectra, which greatly reduced the laser irradiation time and rendered the Raman measurements compatible with life. The excitation source was a 532 nm solid-state laser with highly precise operation (TEM00 beam quality). The spectral resolution was ~2 cm−1 (spectral pixel resolution equal to 0.3 cm−1/pixel) with an accuracy in laser spot spatial location of 100 nm, as achieved by the special optical arrangement developed by Nanophoton Co. and peculiar to this instrument. Raman hyperspectral images were generated using commercially available software (Raman Viewer, Nanophoton Co., Minoo, Osaka, Japan). Raman images were generated using intensity ratios from normalized spectra. In order to minimize errors related to spectral resolution and possible shifts in band position, the average intensity of the pixels at the band nominal location ± 3 pixels was used instead of single-pixel intensity. Lateral displacement steps of 500 nm were adopted for the laser focal point in scanning selected areas of the samples.

4.4. Machine Learning Algorithm for Spectral Deconvolution

Experimental Raman spectra were subjected to polynomial baseline subtraction and deconvolution into a series of Gaussian-Lorentzian band components. The baseline subtraction procedure was performed using options available in commercial software (LabSpec 4.02, Horiba/Jobin-Yvon, Kyoto, Japan) with fixed criteria for all collected spectra. All spectra were analyzed after intensity normalization to the strongest signal in the collected spectral interval. Detailed descriptions of spectral deconvolution criteria have been reported in previously published papers [23,24]. An automatic solver exploiting a linear polynomial expression of Gaussian-Lorentzian functions was iteratively run to match average experimental spectra for minimum scatter (better than 95% confidence interval). Sub-bands for deconvolution were selected according to a computer program picking from spectra of pre-selected compounds belonging to the aforementioned library. Upon pre-selection of elementary molecules from the library, the algorithm located the best-fitting combination of the experimental spectra by preserving relative intensities, spectral positions, and full-width at half-maximum values from each elementary compound (i.e., within ±3 cm−1; a boundary value selected by considering the resolution of the spectrometer and the possibility of slight alterations in molecular structure). Those mathematical constraints allowed univocal deconvolution of the experimental spectra. An important difference with previous studies was that, in the case of biofilm analyses, the Raman library of elementary molecules missed several key molecules (i.e., mutacin lantibiotics and nonlantibiotics). Accordingly, only specific spectral regions could properly be deconvoluted and analyzed.

4.5. Statistical Analysis

The statistical relevance of the experimental data was analyzed by computing mean values and standard deviations. Statistical validity was evaluated by applying the ANOVA analysis of variance [105]. Depending on sample, values p < 0.05 or <0.01 were considered as statistically significant and labeled with one and two asterisks, respectively.

5. Conclusions

In this study, we used a combined Raman approach of average spectra and high-resolution imaging to explore in vitro biofilm interactions between S. sanguinis, a benign bacterium supporting oral homeostasis and health, and S. mutans, a major pathogen causing human tooth decay. The Raman analyses clarified how the two species interacted by competing for space as a function of their relative population fractions in concurrently inoculated cocultures. Whatever the initial bacterial fraction in coculture, we always observed a continuous biofilm structure, never completely dismantled by S. sanguinis. However, Raman quantification of glucan metabolites in live biofilms indicated that S. sanguinis followed a passive path for securing space competition by releasing oxygen radicals in the biofilm environment. These radicals disrupted the network of water-insoluble α − 1,3 −glucans by glycosydic bond cleavage and subsequent oxidation of the shortened oligomers, thus yielding to “roof leakage” inside the biofilm from the external environment. On the other hand, S. mutans adopted an active competitive strategy by secreting mutacins to directly inhibit of S. sanguinis growth. Raman biomarkers for these two different strategies were: (i) the intensity ratio between the 520 and 570 cm−1 Raman bands (i.e., the only surviving approach of three different Raman proposed ones), which was quantitatively linked to the volumetric ratio between α − 1,3– and α − 1,6–glucans, and (ii) the 478 cm−1 signal from S–S bonds in ring lantibiotic structures.
In summary, this paper shows how Raman spectroscopy could be used in promptly identifying biofilm composition, in understanding molecular dynamics in the chaotic environment of oral biofilms, and in clarifying competitive bacterial interactions in the details of their complexity. Further developments of quantitative Raman algorithm and portable Raman instrumentation will provide researchers and medical practitioners with a unique tool to monitor in real time biofilm structures and bacterial metabolism in oral health and disease.

Supplementary Materials

The following supporting information can be downloaded at: https://www.mdpi.com/article/10.3390/ijms24076694/s1.

Author Contributions

Conceptualization, G.P., T.A. (Tetsuya Adachi), T.Y., S.K., T.K. and O.M.; methodology, T.A. (Tetsuya Adachi), E.O., T.I., H.S. and K.O.; software, E.M. and W.Z.; validation, E.M., W.Z. and T.A. (Takashi Aoki); formal analysis, G.P., E.M., E.O. and W.Z.; investigation, S.O., H.I. and A.T.; resources, T.A. (Tetsuya Adachi), N.K., O.M. and G.P.; data curation, E.M., W.Z., A.T. and T.A. (Tetsuya Adachi); writing—original draft preparation, G.P.; writing—review and editing, G.P., T.A. (Takashi Aoki), E.M., W.Z., A.T., S.K., H.S., T.A. (Tetsuya Adachi) and T.K.; visualization, G.P.; supervision, G.P., O.M., N.K., H.S., T.I., K.O. and T.K.; project administration, G.P., T.A. (Tetsuya Adachi) and T.K.; funding acquisition, G.P., T.A. (Tetsuya Adachi), T.Y., O.M. and N.K. All authors have read and agreed to the published version of the manuscript.

Funding

This work was supported by the Grant-in-Aid for Scientific Research (C) number 23K09196 (GP), the Young Scientists at Kyoto Prefectural Public University Corporation (T.A. (Tetsuya Adachi), 2021), the Strategic Foundational Technology Improvement Support Operation 2019 of the Japanese Government, and the Japanese Association for Dental Science, sponsored research 2022-A-2. This study was also partly supported by the NIH NIDCR grants DE-027851, DE-028715, and DE-029709.

Institutional Review Board Statement

Not applicable.

Informed Consent Statement

Not applicable.

Data Availability Statement

Authors agree to make data and materials supporting the results or analyses presented in their paper available upon reasonable request.

Acknowledgments

We gratefully thank Naohiro Tomari from Kyoto Municipal Institute of Industrial Technology and Culture (Shimogyo-ku, Kyoto, Japan) for experimental help with the Raman measurement procedures.

Conflicts of Interest

The authors declare no conflict of interest.

References

  1. Harper, D.S.; Loesche, W.J. Growth and acid tolerance of human dental plaque bacteria. Arch. Oral Biol. 1984, 29, 843–848. [Google Scholar] [CrossRef] [Green Version]
  2. Kroes, I.; Lepp, P.W.; Relman, D.A. Bacterial diversity within the human subgingival crevice. Proc. Natl. Acad. Sci. USA 1999, 96, 14547–14552. [Google Scholar] [CrossRef] [PubMed] [Green Version]
  3. Moore, W.E.; Moore, L.V. The bacteria of periodontal diseases. Periodontol. 2000 1994, 5, 66–77. [Google Scholar] [CrossRef]
  4. Paster, B.J.; Boches, S.K.; Galvin, J.L.; Ericson, R.E.; Lau, C.N.; Levanos, V.A.; Sahasrabudhe, A.; Dewhirst, F.E. Bacterial diversity in human subgingival plaque. J. Bacteriol. 2001, 183, 3770–3783. [Google Scholar] [CrossRef] [PubMed] [Green Version]
  5. Hamilton, I.A. Ecological basis for dental caries. In Oral Bacterial Ecology; Kuramitsu, H.K., Ellen, R.P., Eds.; Horizon Scientific Press: Wymondham, Norfolk, UK, 2000; pp. 219–275. [Google Scholar]
  6. Palmer, R.J., Jr.; Wu, R.; Gordon, S.; Bloomquist, C.G.; Liljemark, W.F.; Kilian, M.; Kolenbrander, P.E. Retrieval of biofilms from the oral cavity. Methods Enzymol. 2001, 337, 393–403. [Google Scholar] [PubMed]
  7. Socransky, S.S.; Manganiello, S.D. The oral microbiota of man from birth to senility. J. Periodontol. 1971, 42, 484–494. [Google Scholar] [CrossRef]
  8. Marsh, P.D. Microbiologic aspects of dental plaque and dental caries. Cariology 1999, 43, 599–614. [Google Scholar] [CrossRef]
  9. Zhu, B.; Macleod, L.C.; Kitten, T.; Xu, P. Streptococcus sanguinis biofilm formation & interaction with oral pathogens. Future Microbiol. 2018, 13, 915–932. [Google Scholar]
  10. Mikx, F.H.M.; Vanderhoeven, J.S.; Plasschaert, A.J.M.; Konig, K.G. Establishment and symbiosis of Actinomyces viscosus, Streptococcus sanguis and Streptococcus mutans in germfree Osborne-Mendel rats. Caries Res. 1976, 10, 123–132. [Google Scholar] [CrossRef]
  11. Kreth, J.; Merritt, J.; Shi, W.; Qi, F. Competition and coexistence between Streptococcus mutans and Streptococcus sanguinis in the dental biofilm. J. Bacteriol. 2005, 187, 7193–7203. [Google Scholar] [CrossRef] [Green Version]
  12. Sun, Y.; Pan, Y.; Sun, Y.; Li, M.; Huang, S.; Qiu, W.; Tu, H.; Zhang, K. Effects of norspermidine on dual-species biofilms composed of Streptococcus mutans and Streptococcus sanguinis. Biomed. Res. Int. 2019, 2019, 1950790. [Google Scholar] [CrossRef] [PubMed] [Green Version]
  13. Kreth, J.; Zhang, Y.; Herzberg, M.C. Streptococcal antagonism in oral biofilms: Streptococcus sanguinis and Streptococcus gordonii interference with Streptococcus mutans. J. Bacteriol. 2008, 190, 4632–4640. [Google Scholar] [CrossRef] [PubMed] [Green Version]
  14. Giacaman, R.A.; Torres, S.; Gomez, Y.; Munoz-Sandoval, C.; Kreth, J. Correlation of Streptococcus mutans and Streptococcus sanguinis colonization and ex vivo hydrogen peroxide production in carious lesion-free and high caries adults. Arch. Oral Biol. 2015, 60, 154–159. [Google Scholar] [CrossRef] [PubMed]
  15. Valdebenito, B.; Tullume-Vergara, P.O.; Gonzalez, W.; Kreth, J.; Giacaman, R.A. In silico analysis of the competition between Streptococcus sanguinis and Streptococcus mutans in the dental biofilm. Mol. Oral Microbiol. 2017, 33, 168–180. [Google Scholar] [CrossRef]
  16. Zhu, Q.; Quivey, R.G., Jr.; Berger, A.J. Raman spectroscopic measurement of relative concentrations in mixtures of oral bacteria. Appl. Spectrosc. 2007, 61, 1233–1237. [Google Scholar] [CrossRef]
  17. Kelestemur, S.; Avci, E.; Culha, M. Raman and surface-enhanced Raman scattering for biofilm characterization. Chemosensors 2018, 6, 5. [Google Scholar] [CrossRef] [Green Version]
  18. Efeoglu, E.; Culha, M. In situ-monitoring of biofilm formation by using surface-enhanced Raman scattering. Appl. Spectrosc. 2013, 67, 498–505. [Google Scholar] [CrossRef]
  19. Sandt, C.; Smith-Palmer, T.; Pink, J.; Brennan, L.; Pink, D. Confocal Raman microspectroscopy as a tool for studying the chemical heterogeneities of biofilms in situ. J. Appl. Microbiol. 2007, 103, 1808–1820. [Google Scholar] [CrossRef]
  20. Suci, P.; Siedlecki, K.; Palmer, R.; White, D.; Geesey, G. Combined light microscopy and attenuated total reflection Fourier transform infrared spectroscopy for integration of biofilm structure, distribution, and chemistry at solid-liquid interfaces. Appl. Environ. Microbiol. 1997, 63, 4600–4603. [Google Scholar] [CrossRef] [Green Version]
  21. Lohumi, S.; Kim, M.S.; Qin, J.; Cho, B.-K. Raman imaging from microscopy to macroscopy: Quality and safety control of biological materials. TrAC Trends Anal. Chem. 2017, 93, 183–198. [Google Scholar] [CrossRef]
  22. Rae, A.; Stosch, R.; Klapetek, P.; Walker, A.R.H.; Roy, D. State of the art Raman techniques for biological applications. Methods 2014, 68, 338–347. [Google Scholar] [CrossRef] [PubMed]
  23. Pezzotti, G. Raman spectroscopy in cell biology and microbiology. J. Raman Spectrosc. 2021, 52, 2348–2443. [Google Scholar] [CrossRef]
  24. Pezzotti, G.; Kobara, M.; Asai, T.; Nakaya, T.; Miyamoto, N.; Adachi, T.; Yamamoto, T.; Kanamura, N.; Ohgitani, E.; Marin, E.; et al. Raman imaging of pathogenic Candida auris: Visualization of structural characteristics and machine-learning identification. Front. Microbiol. 2021, 12, 769597. [Google Scholar] [CrossRef]
  25. Pezzotti, G.; Kobara, M.; Nakaya, T.; Asai, T.; Miyamoto, N.; Adachi, T.; Yamamoto, T.; Kanamura, N.; Ohgitani, E.; Marin, E.; et al. Raman study of pathogenic Candida auris: Imaging metabolic machineries in reaction to antifungal drugs. Front. Microbiol. 2022, 13, 896359. [Google Scholar] [CrossRef]
  26. Pezzotti, G.; Kobara, M.; Nakaya, T.; Imamura, H.; Miyamoto, N.; Adachi, T.; Yamamoto, T.; Kanamura, N.; Ohgitani, E.; Marin, E.; et al. Raman spectroscopy of oral Candida species: Molecular-scale analyses, chemometrics, and barcode identification. Int. J. Mol. Sci. 2022, 23, 5359. [Google Scholar] [CrossRef]
  27. Pezzotti, G.; Boschetto, F.; Ohgitani, E.; Fujita, Y.; Shin-Ya, M.; Adachi, T.; Yamamoto, T.; Kanamura, N.; Marin, E.; Zhu, W.; et al. Raman molecular fingerprints of SARS-CoV-2 British variant and the concept of Raman barcode. Adv. Sci. 2021, 2021, 2103287. [Google Scholar] [CrossRef] [PubMed]
  28. Pezzotti, G.; Boschetto, F.; Ohgitani, E.; Fujita, Y.; Shin-Ya, M.; Adachi, T.; Yamamoto, T.; Kanamura, N.; Marin, E.; Zhu, W.; et al. Mechanisms of instantaneous inactivation of SARS-CoV-2 by silicon nitride bioceramic. Mater. Today Bio 2021, 12, 100144. [Google Scholar] [CrossRef] [PubMed]
  29. Pezzotti, G.; Ohgitani, E.; Fujita, Y.; Imamura, H.; Shin-Ya, M.; Adachi, T.; Yamamoto, T.; Kanamura, N.; Marin, E.; Zhu, W.; et al. Raman fingerprints of the SARS-CoV-2 Delta variant and mechanisms of its instantaneous inactivation by silicon nitride bioceramics. ACS Infect. Dis. 2022, 8, 1563–1581. [Google Scholar] [CrossRef]
  30. Hori, Y.; Enomoto, Y.; Kimura, S.; Iwata, T. Synthesis of α − 1,3 – and β-1,6-glucan esters with carbon-carbon double bonds and their surface modification. Polym. Int. 2021, 70, 573–581. [Google Scholar] [CrossRef]
  31. Pezzotti, G.; Kobara, M.; Nakaya, T.; Imamura, H.; Fujii, T.; Miyamoto, N.; Adachi, T.; Yamamoto, T.; Kanamura, N.; Ohgitani, E.; et al. Raman metabolomics of Candida auris clades: Profiling and barcode identification. Int. J. Mol. Sci. 2022, 23, 11736. [Google Scholar] [CrossRef]
  32. Kopec, L.K.; Vacca, A.M.; Lindang-Evans, S.D.; Bowen, W.H. Properties of Streptococcus sanguinis glucans formed under various conditions. Caries Res. 2001, 35, 67–74. [Google Scholar] [PubMed]
  33. Ge, X.; Kitten, T.; Chen, Z.; Lee, S.P.; Munro, C.L.; Xu, P. Identification of Streptococcus sanguinis genes required for biofilm formation and examination of their role in endocarditis virulence. Infect. Immun. 2008, 76, 2551–2559. [Google Scholar] [CrossRef] [PubMed] [Green Version]
  34. Moraes, J.J.; Stipp, R.N.; Harth-Chu, E.N.; Camargo, T.M.; Hofling, J.F.; Mattos-Graner, R.O. Two-component system VicRK regulates functions associated with establishment of Streptococcus sanguinis in biofilms. Infect. Immun. 2014, 82, 4941–4951. [Google Scholar] [CrossRef] [Green Version]
  35. Kreth, J.; Giacaman, R.A.; Raghavan, R.; Merritt, J. The road less traveled–defining molecular commensalism with Streptococcus sanguinis. Mol. Oral Microbiol. 2017, 32, 181–196. [Google Scholar] [CrossRef]
  36. Lai, C.W.; Schwab, M.; Hill, S.C.; Santarpia, J.; Pan, Y.-L. Raman scattering and red fluorescence in the photochemical transformation of dry tryptophan particles. Opt. Express 2016, 24, 11654–11667. [Google Scholar] [CrossRef] [PubMed]
  37. Van Hijum, S.; Kralj, S.; Ozimek, L.; Dijkhuizen, L.; Geel-Schutten, I. Structure-function relationships of glucansucrase and fructansucrase enzymes from lactic acid bacteria. Microbiol. Mol. Biol. Rev. 2006, 70, 157–176. [Google Scholar] [CrossRef] [PubMed] [Green Version]
  38. Bowen, W.H.; Koo, H. Biology of Streptococcus mutans-derived glucosyltransferases: Role in extracellular matrix formation of cariogenic biofilms. Caries Res. 2011, 45, 69–86. [Google Scholar] [CrossRef]
  39. Koo H, H.; Falsetta, M.L.; Klein, M.I. The exopolysaccharide matrix: A virulence determinant of cariogenic biofilm. J. Dent Res. 2013, 92, 1065–1073. [Google Scholar] [CrossRef] [Green Version]
  40. Hwang, G.; Liu, Y.; Kim, D.; Sun, V.; Aviles-Reyes, A.; Kajfasz, J.K.; Lemos, J.A.; Koo, H. Simultaneous spatiotemporal mapping of in situ pH and bacterial activity within an intact 3D microcolony structure. Sci. Rep. 2016, 6, 32841. [Google Scholar] [CrossRef]
  41. Guo, L.; McLean, J.S.; Lux, R.; He, X.; Shi, W. The well-coordinated linkage between acidogenicity and aciduricity via insoluble glucans on the surface of Streptococcus mutans. Sci. Rep. 2015, 5, 18015. [Google Scholar] [CrossRef] [Green Version]
  42. Mikkelsen, M.S.; Jespersen, B.M.; Moller, B.L.; Laerke, H.N.; Larsen, F.H.; Engelsen, S.B. Comparative spectroscopic and rheological studies on crude and purified soluble barley and oat β-glucan preparations. Food Res. Int. 2010, 43, 2417–2424. [Google Scholar] [CrossRef]
  43. Synytsya, A.; Mickova, K.; Synytsya, A.; Jablonsky, I.; Spevacek, J.; Erban, V.; Kovarikova, E.; Copikova, J. Glucans from fruit bodies of cultivated mushrooms Pleurotus ostreatus and Pleurotus eryngii: Structure and potential prebiotic activity. Carbohydr. Polym. 2009, 76, 548–556. [Google Scholar] [CrossRef]
  44. Wiercigroch, E.; Szafraniec, E.; Szafraniec, K.; Czamara, K.; Pacia, M.Z.; Majzner, K.; Kochan, K.; Kaczor, A.; Baranska, M.; Malek, K. Raman and infrared spectroscopy of carbohydrates: A review. Spectrochim. Acta Part A Mol. Biomol. Spectrosc. 2017, 185, 317–335. [Google Scholar] [CrossRef] [PubMed]
  45. Trofimov, B.A.; Sinegovskaya, L.M.; Gusarova, N.K. Vibrations of the S–S bond in elemental sulfur and organic polysulfides: A structural guide. J. Sulfur Chem. 2009, 30, 518–554. [Google Scholar] [CrossRef]
  46. Stone, N.; Kendall, C.; Shepherd, N.; Crow, P.; Barr, H. Near-infrared Raman spectroscopy for the classification of epithelial pre-cancers and cancers. J. Raman Spectrosc. 2002, 33, 564–573. [Google Scholar] [CrossRef]
  47. Moreno, M.; Raniero, L.; Arisawa, E.Â.L.; Santo, A.M.E.; Santos, E.A.P.; Bitar, R.A.; Martin, A.A. Raman spectroscopy study of breast disease. Theor. Chem. Accounts 2009, 125, 329–334. [Google Scholar] [CrossRef]
  48. Eisenberg, R.J.; Elchisak, M.; Lai, C. Glycogen accumulation by pleomorphic cells of Streptococcus sanguis. Biochem. Biophys. Res. Commun. 1974, 57, 959–966. [Google Scholar] [CrossRef] [PubMed]
  49. Van der Hoeven, J.S.; De Jong, M.H.; Camp, P.J.M.; Van den Kieboom, C.W.A. Competition between oral Streptococcus species in the chemostat under alternating conditions of glucose limitation and excess. FEMS Microbiol. Ecol. 1985, 31, 373–379. [Google Scholar]
  50. De Stoppelaar, J.D.; Van Houte, J.; Dirks, O.B. The effect of carbohydrate restriction on the presence of Streptococcus mutans, Streptococcus sanguis and iodophilic polysaccharide-producing bacteria in human dental plaque. Caries Res. 1970, 4, 114–123. [Google Scholar] [CrossRef]
  51. Phillips, D.L.; Xing, J.; Chong, C.K.; Liu, H.; Corke, H. Determination of the degree of succinylation in diverse modified starches by Raman spectroscopy. J. Acric. Food Chem. 2000, 48, 5105–5108. [Google Scholar] [CrossRef]
  52. Boulos, S.; Nystroem, L. Complementary sample preparation strategies for analysis of cereal β-glucan oxidation products by UPLC-MS/MS. Front. Chem. 2017, 5, 90. [Google Scholar] [CrossRef] [PubMed] [Green Version]
  53. Ofoedu, C.E.; You, L.; Osuji, C.M.; Iwouno, J.O.; Kabuo, N.O.; Ojukwu, M.; Agunwah, I.M.; Chacha, J.S.; Muobike, O.P.; Agunbiade, A.O.; et al. Hydrogen peroxide effects on natural-sourced polysaccharides: Free radical formation/production, degradation process, and reaction mechanism–a critical synopsis. Foods 2021, 10, 699. [Google Scholar] [CrossRef] [PubMed]
  54. Henrissat, B.; Davies, G. Structures and mechanisms of glycosyl hydrolases. Structure 1995, 3, 853–859. [Google Scholar]
  55. Vickerman, M.M.; Sulavik, M.C.; Nowak, J.D.; Gardner, N.M.; Jones, G.W.; Clewell, D.B. Nucleotide sequence analysis of the Streptococcus gordonii glucosyltransferase gene, gtfG. DNA Seq. 1997, 7, 83–95. [Google Scholar] [CrossRef] [PubMed]
  56. Smith, A.M.V.; Ng-Evans, L.; Wunder, D.; Bowen, W.H. Studies concerning the glucosyltransferase of Streptococcus sanguis. Caries Res. 2000, 34, 295–302. [Google Scholar] [CrossRef] [PubMed]
  57. Fujiwara, T.; Hoshino, T.; Ooshima, T.; Sobue, S.; Hamada, S. Purification, characterization, and molecular analysis of the gene encoding glucosyltransferase from Streptococcus oralis. Infect. Immun. 2000, 68, 2475–2483. [Google Scholar] [CrossRef] [Green Version]
  58. Xu, P.; Alves, J.M.; Kitten, T.; Brown, A.; Chen, Z.; Ozaki, L.S.; Manque, P.; Ge, X.; Serrano, M.G.; Puiu, D.; et al. Genome of the opportunistic pathogen Streptococcus sanguinis. J. Bacteriol. 2007, 189, 3166–3175. [Google Scholar] [CrossRef] [Green Version]
  59. Zhu, L.; Kreth, J. The Role of Hydrogen Peroxide in Environmental Adaptation of Oral Microbial Communities. Oxid. Med. Cell. Longev. 2012, 2012, 717843. [Google Scholar] [CrossRef] [Green Version]
  60. Barnard, J.P.; Stinson, M.W. The alpha-hemolysin of Streptococcus gordonii is hydrogen peroxide. Infect. Immun. 1996, 64, 3853–3857. [Google Scholar] [CrossRef] [Green Version]
  61. Michels, A.J.; Frei, B. Myths, artifacts, and fatal flaws: Identifying limitations and opportunities in vitamin C research. Nutrients 2013, 5, 5161–5192. [Google Scholar] [CrossRef] [Green Version]
  62. Chen, L.; Ge, X.; Dou, Y.; Wang, X.; Patel, J.R.; Xu, P. Identification of hydrogen peroxide production-related genes in Streptococcus sanguinis and their functional relationship with pyruvate oxidase. Microbiology 2011, 157, 13–20. [Google Scholar] [CrossRef] [PubMed] [Green Version]
  63. Chen, L.; Ge, X.; Wang, X.; Patel, J.R.; Xu, P. SpxA1 involved in hydrogen peroxide production, stress tolerance and endocarditis virulence in Streptococcus sanguinis. PLoS ONE 2012, 7, e40034. [Google Scholar] [CrossRef] [PubMed]
  64. Yoshida, A.; Niki, M.; Yamamoto, Y.; Yasunaga, A.; Ansai, T. Proteome analysis identifies the Dpr protein of Streptococcus mutans as an important factor in the presence of early streptococcal colonizers of tooth surfaces. PLoS ONE 2015, 10, e0121176. [Google Scholar] [CrossRef] [PubMed]
  65. Fujishima, K.; Kawada-Matsuo, M.; Oogai, Y.; Tokuda, M.; Torii, M.; Komatsuzawa, H. dpr and sod in Streptococcus mutans are involved in coexistence with Streptococcus sanguinis, and PerR is associated with resistance to H2O2. Appl. Environ. Microbiol. 2013, 79, 1436–1443. [Google Scholar] [CrossRef] [Green Version]
  66. Ghoul, M.; Mitri, S. The ecology and evolution of microbial competition. Trends Microbiol. 2016, 24, 833–845. [Google Scholar] [CrossRef]
  67. Lim, Y.; Shin, S.H.; Lee, S.I.; Kim, I.S.; Rhee, J.H. Iron repressibility of siderophore and transferrin-binding protein in Staphylococcus aureus. FEMS Microbiol. Lett. 1998, 163, 19–24. [Google Scholar] [CrossRef] [Green Version]
  68. Murgas, C.J.; Green, S.P.; Forney, A.K.; Korba, R.M.; An, S.-S.; Kitten, T.; Lucas, H.R. Intracellular metal speciation in Streptococcus sanguinis establishes SsaACB as critical for redox maintenance. ACS Infect. Dis. 1998, 6, 1906–1921. [Google Scholar] [CrossRef]
  69. Diggle, S.P.; Griffin, A.S.; Campbell, G.S.; West, S.A. Cooperation and conflict in quorum-sensing bacterial populations. Nature 2007, 450, 411–414. [Google Scholar] [CrossRef]
  70. Rendueles, O.; Ghigo, J. Multi-species biofilms: How to avoid unfriendly neighbors. FEMS Microbiol. Rev. 2012, 36, 972–989. [Google Scholar] [CrossRef]
  71. Griffin, A.S.; West, S.A.; Buckling, A. Cooperation and competition in pathogenic bacteria. Nature 2004, 430, 1024–1027. [Google Scholar] [CrossRef] [Green Version]
  72. Scholz, R.L.; Greenberg, E.P. Sociality in Escherichia coli: Enterochelin is a private good at low cell density and can be shared at high cell density. J. Bacteriol. 2015, 197, 2122–2128. [Google Scholar] [CrossRef] [PubMed]
  73. Ackermann, M. A functional perspective on phenotypic heterogeneity in microorganisms. Nature Rev. Microbiol. 2015, 13, 497–508. [Google Scholar] [CrossRef] [PubMed]
  74. Gore, J.; Youk, H.; Van Oudenaarden, A. Snowdrift game dynamics and facultative cheating in yeast. Nature 2009, 459, 253–256. [Google Scholar] [CrossRef] [Green Version]
  75. An, D.; Danhorn, T.; Fuqua, C.; Parsek, M.R. Quorum sensing and motility mediate interactions between Pseudomonas aeruginosa and Agrobacterium tumefaciens in biofilm cocultures. Proc. Natl. Acad. Sci. USA 2006, 103, 3828–3833. [Google Scholar] [CrossRef] [PubMed] [Green Version]
  76. Kim, W.; Racimo, F.; Schluter, J.; Levy, S.B.; Foster, K.R. Importance of positioning for microbial evolution. Proc. Natl. Acad. Sci. USA 2014, 111, E1639–E1647. [Google Scholar] [CrossRef] [Green Version]
  77. Nadell, C.D.; Bassler, B.L. A fitness trade-off between local competition and dispersal in Vibrio cholerae biofilms. Proc. Natl. Acad. Sci. USA 2011, 108, 14181–14185. [Google Scholar] [CrossRef] [Green Version]
  78. Schluter, J.; Nadell, C.D.; Bassler, B.L.; Foster, K.R. Adhesion as a weapon in microbial competition. ISME J. 2014, 9, 139–149. [Google Scholar] [CrossRef]
  79. Mignot, T.; Noellmann, M. New insights into the function of a versatile class of membrane molecular motors from studies of Myxococcus xanthus surface (gliding) motility. Microb. Cell 2017, 4, 98–100. [Google Scholar] [CrossRef] [Green Version]
  80. Merritt, J.; Qi, F. The mutacins of Streptococcus mutans: Regulation and ecology. Mol. Oral Microbiol. 2012, 27, 57–69. [Google Scholar] [CrossRef]
  81. Islam, M.R.; Nagao, J.-I.; Zendo, T.; Sonomoto, K. Antimicrobial mechanism of lantibiotics. Biochem. Soc. Trans. 2012, 40, 1528–1533. [Google Scholar] [CrossRef]
  82. Willey, J.M.; Van der Donk, W.A. Lantibiotics: Peptides of diverse structure and function. Annu. Rev. Microbiol. 2007, 61, 477–501. [Google Scholar] [CrossRef] [PubMed]
  83. Hossain, M.S.; Biswas, I. Mutacins from Streptococcus mutans UA159 are active against multiple streptococcal species. Appl. Environ. Microbiol. 2011, 77, 2428–2434. [Google Scholar] [CrossRef] [PubMed] [Green Version]
  84. Wang, B.-Y.; Kuramitsu, H.K. Interactions between oral bacteria: Inhibition of Streptococcus mutans bacteriocin production by Streptococcus 
gordonii. Appl. Environ. Microbiol. 2005, 71, 354–362. [Google Scholar] [CrossRef] [PubMed] [Green Version]
  85. Nissen-Meyer, J.; Rogne, P.; Oppegard, C.; Haugen, H.S.; Kristiansen, P.E. Structure-function relationships of the non-lanthionine-containing peptide (class II) bacteriocins produced by gram-positive bacteria. Curr. Pharm. Biotechnol. 2009, 10, 19–37. [Google Scholar] [CrossRef]
  86. Van Belkum, M.J.; Stiles, M.E. Nonlantibiotic antibacterial peptides from lactic acid bacteria. Nat. Prod. Rep. 2000, 17, 323–335. [Google Scholar] [CrossRef] [PubMed]
  87. Harvey, P.D.; Butler, I.S. Raman spectra of orthorhombic sulfur at 40 K. J. Raman Spectrosc. 1986, 17, 329–334. [Google Scholar] [CrossRef]
  88. Barletta, R.E.; Gros, B.N.; Herring, M.P. Analysis of marine biogenic sulfur compounds using Raman spectroscopy: Dimethyl sulfide and methane sulfonic acid. J. Raman Spectrosc. 2009, 40, 972–981. [Google Scholar] [CrossRef]
  89. Andrikopoulos, K.S.; Kalampounias, A.G.; Falgara, O.; Yannopoulos, S.N. The glassy and supercooled state of elemental sulfur: Vibrational modes, structure metastability, and polymer content. J. Chem. Phys. 2013, 139, 124501. [Google Scholar] [CrossRef]
  90. Nims, C.; Cron, B.; Wetherington, M.; Macalady, J.; Cosmidis, J. Low frequency Raman spectroscopy for micron scale and in vivo characterization of elemental sulfur in microbial samples. Sci. Rep. 2019, 9, 7971. [Google Scholar] [CrossRef] [Green Version]
  91. Lemos, J.A.; Palmer, S.R.; Zeng, L.; Wen, Z.T.; Kajfasz, J.K.; Freires, I.A.; Abranches, J.; Brady, L.J. The biology of Streptococcus mutans. Microbiol. Spectrum 2019, 7, GPP3-0051-2018. [Google Scholar] [CrossRef]
  92. Peres, M.A.; Macpherson, L.M.D.; Weyant, R.J.; Daly, B.; Venturelli, R.; Mathur, M.R.; Listl, S.; Celeste, R.K.; Guarnizo-Herreno, C.C.; Kearns, C.; et al. Oral diseases: A global public health challenge. Lancet 2019, 394, 249–260. [Google Scholar] [CrossRef] [PubMed]
  93. Pezzotti, G.; Zhu, W.; Boffelli, M.; Adachi, T.; Ichioka, H.; Yamamoto, T.; Kanamura, N. Vibrational algorithms for quantitative crystallographic analyses of hydroxyapatite-based biomaterials: I, theoretical foundations. Anal. Bioanal. Chem. 2015, 407, 3325–3342. [Google Scholar] [CrossRef]
  94. Adachi, T.; Pezzotti, G.; Yamamoto, T.; Ichioka, H.; Boffelli, M.; Zhu, W.; Kanamura, N. Vibrational algorithms for quantitative crystallographic analyses of hydroxyapatite-based biomaterials: II, application to decayed human teeth. Anal. Bioanal. Chem. 2015, 407, 3343–3356. [Google Scholar] [CrossRef] [PubMed]
  95. Pezzotti, G.; Adachi, T.; Gasparutti, I.; Vincini, G.; Zhu, W.; Boffelli, M.; Rondinella, A.; Marin, E.; Ichioka, H.; Yamamoto, T.; et al. Vibrational monitor of early demineralization in tooth enamel after in vitro exposure to phosphoridic liquid, Spectrochim. Acta A Mol. Bomol. Spectrosc. 2017, 173, 19–33. [Google Scholar] [CrossRef]
  96. Miyamoto, N.; Adachi, T.; Boschetto, F.; Zanocco, M.; Yamamoto, T.; Marin, E.; Somekawa, S.; Ashida, R.; Zhu, W.; Kanamura, N.; et al. Molecular fingerprint imaging to identify dental caries using Raman spectroscopy. Materials 2020, 13, 4900. [Google Scholar] [CrossRef] [PubMed]
  97. Zhang, Y.; Ren, L.; Wang, Q.; Wen, Z.; Liu, C.; Ding, Y. Raman spectroscopy: A potential diagnostic tool for oral diseases. Front. Cell. Infect. Microbiol. 2022, 12, 775236. [Google Scholar] [CrossRef]
  98. Kriem, L.S.; Wright, K.; Ccahuana-Vasquez, R.A.; Rupp, S. Mapping of a subgingival dual-species biofilm model using confocal Raman microscopy. Front. Microbiol. 2021, 12, 729720. [Google Scholar] [CrossRef]
  99. Ramirez-Mora, T.; Davila-Perez, C.; Torres-Mendez, F.; Valle-Bourrouet, G. Raman spectroscopic characterization of endodontic biofilm matrices. J. Spectrosc. 2019, 2019, 1307397. [Google Scholar] [CrossRef] [Green Version]
  100. Hlaing, M.M.; Dunn, M.; Stoddart, P.R.; McArthur, S.L. Raman spectroscopic identification of single bacterial cells at different stages of their lifecycle. Vibr. Spectrosc. 2016, 86, 81–89. [Google Scholar] [CrossRef]
  101. Gyo, M.; Nikaido, T.; Okada, K.; Yamauchi, J.; Tagami, J.; Matin, K. Surface response of fluorine polymer-incorporated resin composites to cariogenic biofilm adherence. Appl. Environ. Microbiol. 2008, 74, 1428–1435. [Google Scholar] [CrossRef] [Green Version]
  102. Ikeda, M.; Matin, K.; Nikaido, T.; Foxton, R.M.; Tagami, J. Effect of surface characteristics on adherence of S. mutans biofilms to indirect resin composites. Dent. Mater. J. 2007, 26, 915–923. [Google Scholar] [CrossRef] [PubMed] [Green Version]
  103. Puanglek, S.; Kimura, S.; Enomoto-Rogers, Y.; Kabe, T.; Yoshida, M.; Wada, M.; Iwata, T. In vitro synthesis of linear α-1,3-glucan and chemical modification to ester derivatives exhibiting outstanding thermal properties. Sci. Rep. 2016, 6, 30479. [Google Scholar] [CrossRef] [PubMed] [Green Version]
  104. Togo, A.; Suzuki, S.; Kimura, S.; Iwata, T. High tensile strength regenerated α–1,3–glucan fiber and crystal transition. ACS Omega 2021, 6, 20361–20368. [Google Scholar] [CrossRef]
  105. Guo, B.; Yuan, Y. A comparative review of methods for comparing means using partially paired data. Stat. Methods Med. Res. 2017, 26, 1323–1340. [Google Scholar] [CrossRef] [PubMed]
Figure 1. (a) Structures and fingerprint Raman vibrational modes of α − 1,6– and α − 1,3–glucans and (b) their respective spectra as collected on pure compounds are pictured; three spectral zones are specified in inset as Zones I, II, and III, which correspond to vibrational modes of C–C–O(H) deformation, C–O–C stretching, and H–C–OH bending, respectively. The band at 1563 cm−1 represents C=C ring bonds and arises from the residual presence of glucansucrase enzymatic molecules used in the preparation of the α − 1,3–glucan structure. The numbers in inset to the spectra represent peak positions and are given in cm−1.
Ijms 24 06694 g001
Figure 2. Raman spectra collected on mixtures of elementary compounds in different fractions of α − 1,3– to α − 1,6–glucans: 0:1, 1:3, 1:2, 3:1, and 1:0 (cf. labels) in spectral region (a) Zone I, (b) Zone II, and (c) Zone III. Wavenumber fingerprint Raman signals (in cm−1) in each zone are labeled in inset.
Ijms 24 06694 g002
Figure 3. Dependence of Raman intensity ratios: (a) R(1)α3/α6 = I520/I555, (b) R(2)α3/α6 = I948/I919, and (c) R(3)α3/α6 = I1568/I1482 are plotted as a function of α − 1,3– to α − 1,6–glucans fraction, Fα3. All plots could, in principle, be used to evaluate the glucan structure of live biofilm, but their suitability for this purpose differs, as discussed in the text. Scatters in the plot represent standard deviations.
Ijms 24 06694 g003
Figure 4. Optical micrographs of concurrently inoculated cocultures (at 24 h) with different S. mutans– to –S. sanguinis ratios: (a) 1:0, (b) 1:1, (c) 1:4, (d) 1:8, and (e) 0:1. Abundant biofilm formation is observed at any bacterial fraction except for the culture of S. sanguinis alone, which showed a negligible amount of biofilm. In (f), the amount of glucans is shown as collected on solutions of completely dissolved (soluble and insoluble) glucans (n = 3; * → p < 0.05; ** → p < 0.01).
Ijms 24 06694 g004
Figure 5. 13C-NMR spectrum of biofilm in S. mutans culture (a), α − 1,3–glucans (b), and α − 1,6–glucan (c).
Ijms 24 06694 g005
Figure 6. (a) Map of S. mutans biofilm along the in-depth z-axis as non-destructively collected by confocal Raman spectroscopy; average Raman spectra are shown for spectral Zone I (400~600 cm−1; (bd)) and Zone III (1400~1600 cm−1; (eg)) as line averages at in-depth abscissas z = 0, 10, and 22 μm, respectively (cf. labels in inset). Fractions of α − 1,3–glucans, Fα3 (shown in inset to each spectrum), were calculated from the intensity ratios, R(1)α3/α6 = I520/I555 and R(3)α3/α6 = I1568/I1482, according to the calibration plots in Figure 3a and Figure 3c, respectively.
Ijms 24 06694 g006
Figure 7. Raman spectra in the wavenumber interval 600~1200 cm−1 for S. mutans and S. sanguinis cultures/cocultures at 24 h (focal plane of the Raman probe on the sample surface): (a) 1:0, (b) 1:1, (c) 1:4, (d) 1:8, and (e) 0:1; the computed intensity ratios, Rα/β, between Raman markers for α– and β–glucans (at 948 and 892 cm−1, respectively) are shown in inset to each figure and comparatively plotted in (f) with related statistics (cf. labels in inset). The signals at ~851, 972, and 919 cm−1 (labeled with orange sharps in (ae)) are strongly contributed by signals from the sucrose externally added for culturing bacteria. n.s. = non significant.
Ijms 24 06694 g007
Figure 8. Raman spectra (probe focal plane on the sample surface) in Zone I (400~600 cm−1) as collected on cultures/cocultures (at 24 h) with S. mutans to S. sanguinis ratios of: (a) 1:0, (b) 1:1, (c) 1:4, (d) 1:8, and (e) 0:1; two C–C–OH deformation bands, appearing at 555 and 520 cm−1 (cf. labels) were used to compute the Raman intensity ratio, R(1)α3/α6 = I520/I555, from which the fractions, Fα3, of α − 1,3–glucans contained in the biofilms were computed according to the plot in Figure 3a. Computed Fα3 values are displayed in (f) together with their statistical significance (n = 3; ** → p < 0.01; n.s. = non-significant). Bond deformation bands at 531 cm−1 (C2–C3–O(–C1)) and 572 cm−1 (C5–C6–O(–H)) (cf. labels in inset) are only expected in α − 1,3–glucans. Bands labeled with blue and green sharps represent S–S bond stretching in ring structures and C–C–C bending in glycogen molecules, respectively.
Ijms 24 06694 g008
Figure 9. Raman spectra in the wavenumber zone 1600~1800 cm−1 as collected (probe focal plane on the sample surface) on cultures/cocultures (at 24 h) with S. mutans to S. sanguinis ratios of: (a) 1:0, (b) 1:1, (c) 1:4, (d) 1:8, and (e) 0:1; this spectral zone is dominated by stretching vibrations of the carbonyl C=O bonds and the four distinct bands at ~1723, 1735, 1763, and 1786 cm−1 indicate a variety of molecular locations in which the carbonyl unit has formed as a result of environmentally assisted biofilm processes. Using the intensity ratio of the 1725 to the 949 cm−1 bands the fraction of carbonyls, S, as a function of S. sanguinis fraction in coculture is given in (f), as computed according to the calibration procedures reported by Phillips et al. [51] and with statistical validation (n = 3; * → p < 0.05; ** → p < 0.01; n.s. = non-significant.
Ijms 24 06694 g009
Figure 10. Raman maps of α − 1,3–glucan distribution in culture/cocultures of S. mutans and S. sanguinis with ratios of: (a) 1:0, (b) 1:1, (c) 1:4, (d) 1:8, and (e) 0:1; each map is comprehensive of ~106 spectra collected with sub-micrometric spatial resolution. In (f), average values of α − 1,3–glucan fractions, Fα3, are computed by averaging R(1)α3/α6 = I520/I555 ratios over entire Raman images (n = 3 for each culture/coculture), according to the calibration plot in Figure 3a. Fα3 values showed agreement within ±10% with data in Figure 8f computed with the same algorithm (cf. also statistical validation; n = 3; ** → p < 0.01; n.s. = non significant). Raman maps were collected with focal plane on the sample surface.
Ijms 24 06694 g010
Figure 11. Draft of oxidized carbonyl sites (compiled according to Ref. [52]) as positioned in a glucan chain cleaved by HO• radicals; the respective (guessed) Raman frequencies are given in inset. The draft also envisages the possible formation of transient C=C bonds, which could contribute the intensity of the observed ~1560 cm−1 band.
Ijms 24 06694 g011
Figure 12. Schematic drafts of biofilm zones dominated by (a) S. mutans and (b) S. sanguinis. In the former case, the biofilm is rich in water-insoluble exopolysaccharides and S. mutans uses mutacins in the attempt to directly exterminate the S. sanguinis; in the latter case, S. sanguinis disrupts water-insoluble exopolysaccharides using oxygen radicals.
Ijms 24 06694 g012
Disclaimer/Publisher’s Note: The statements, opinions and data contained in all publications are solely those of the individual author(s) and contributor(s) and not of MDPI and/or the editor(s). MDPI and/or the editor(s) disclaim responsibility for any injury to people or property resulting from any ideas, methods, instructions or products referred to in the content.

