
Microwave Irradiation vs. Structural, Physicochemical, and Biological Features of Porous Environmentally Active Silver–Silica Nanocomposites

 ,
,  , , , , ,
  ,
,  and
and 
Abstract
1. Introduction
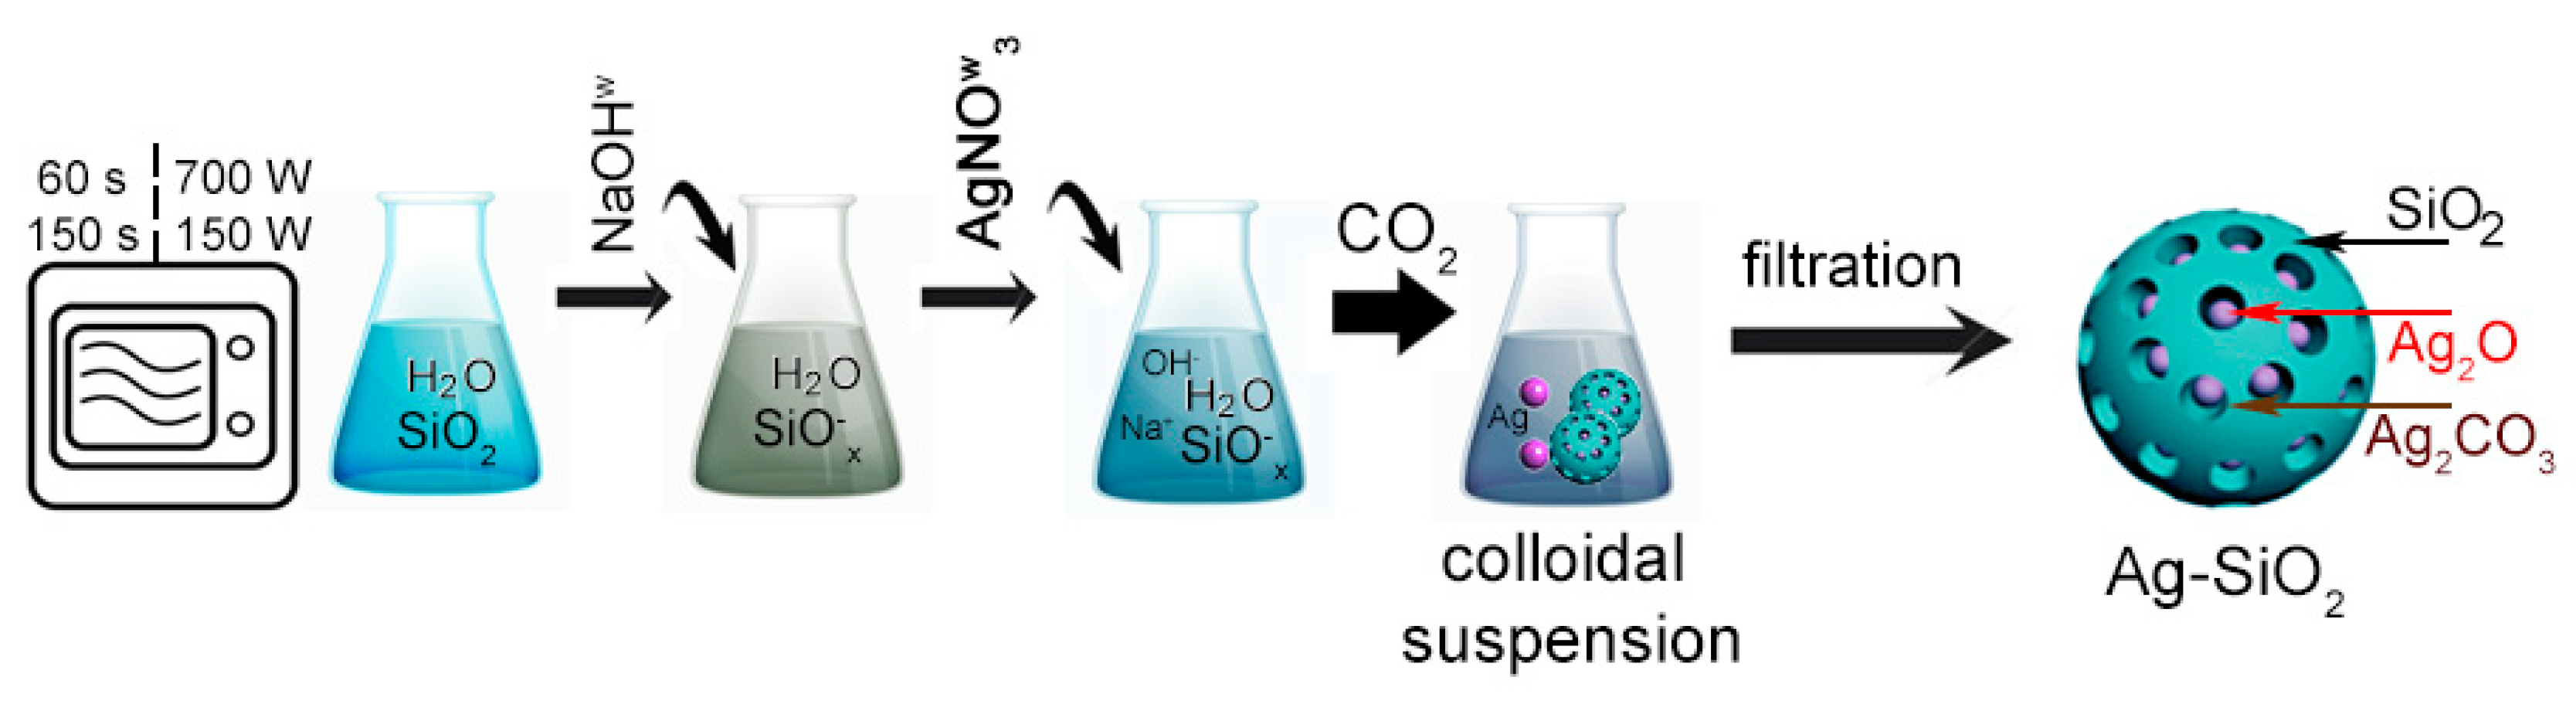
2. Synthesis
3. Results and Discussion
3.1. Morphology, Surface Parameters, and Particle Analysis
3.2. Structural Analysis
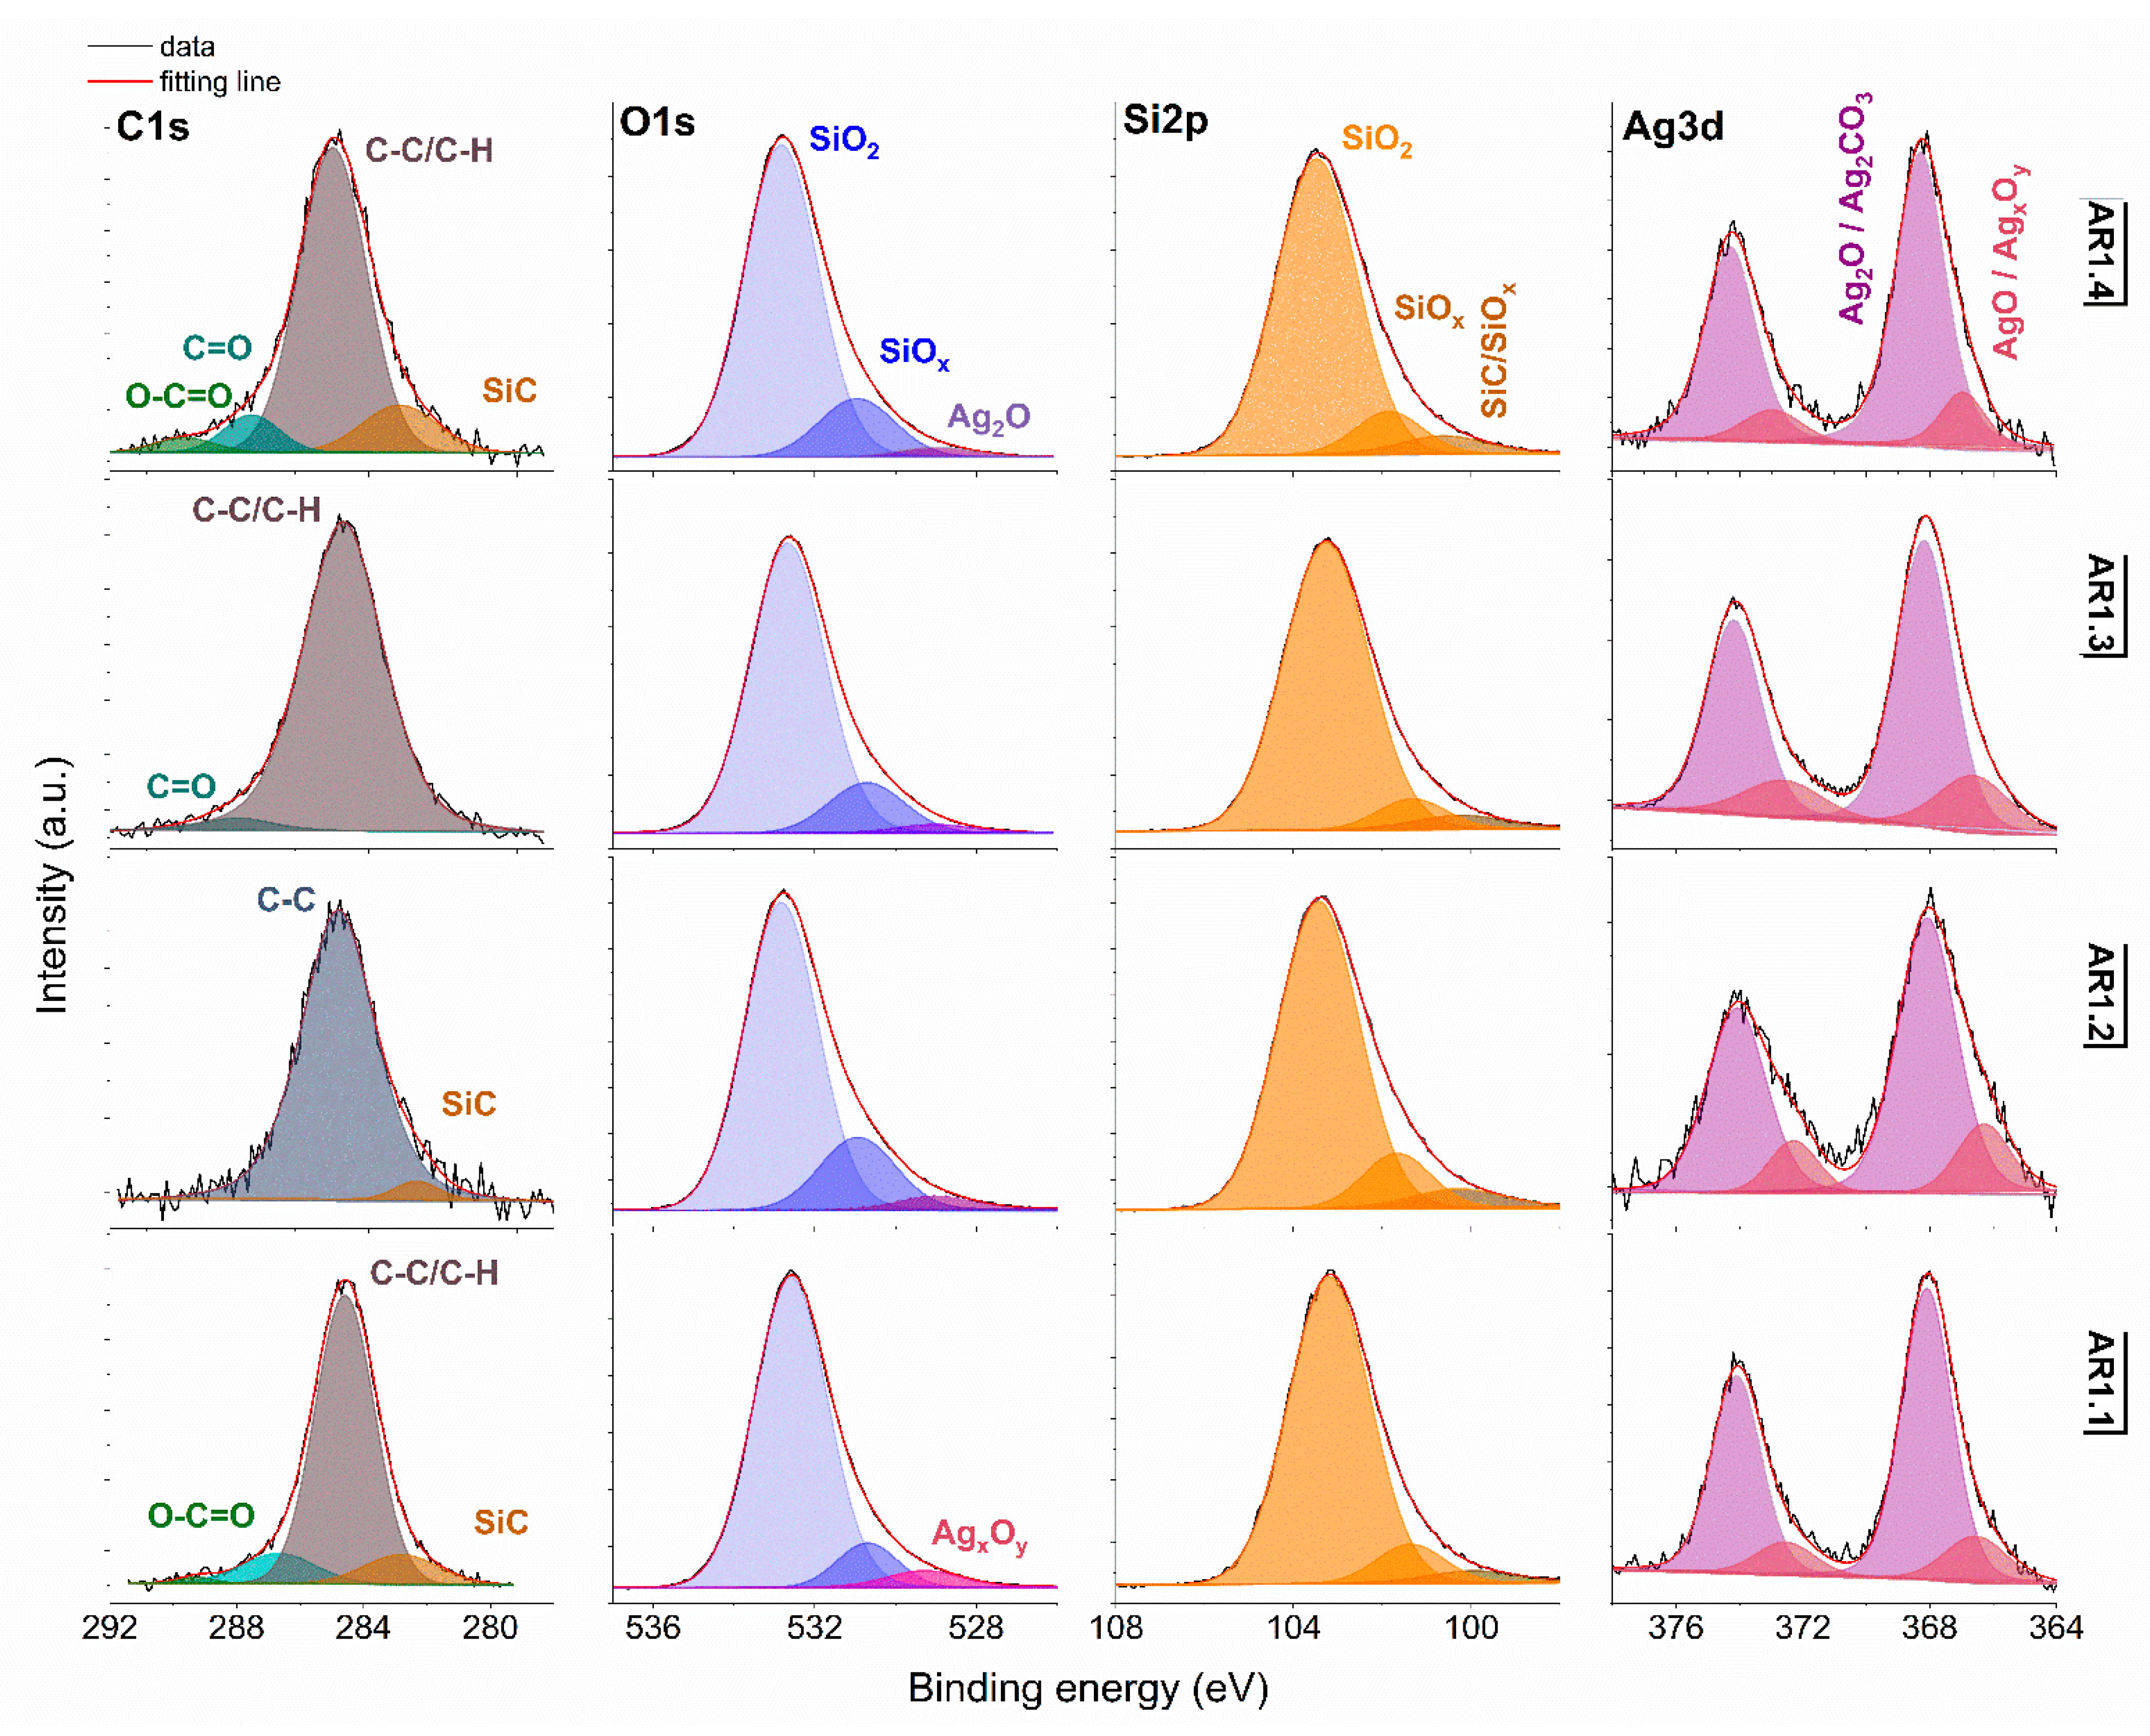
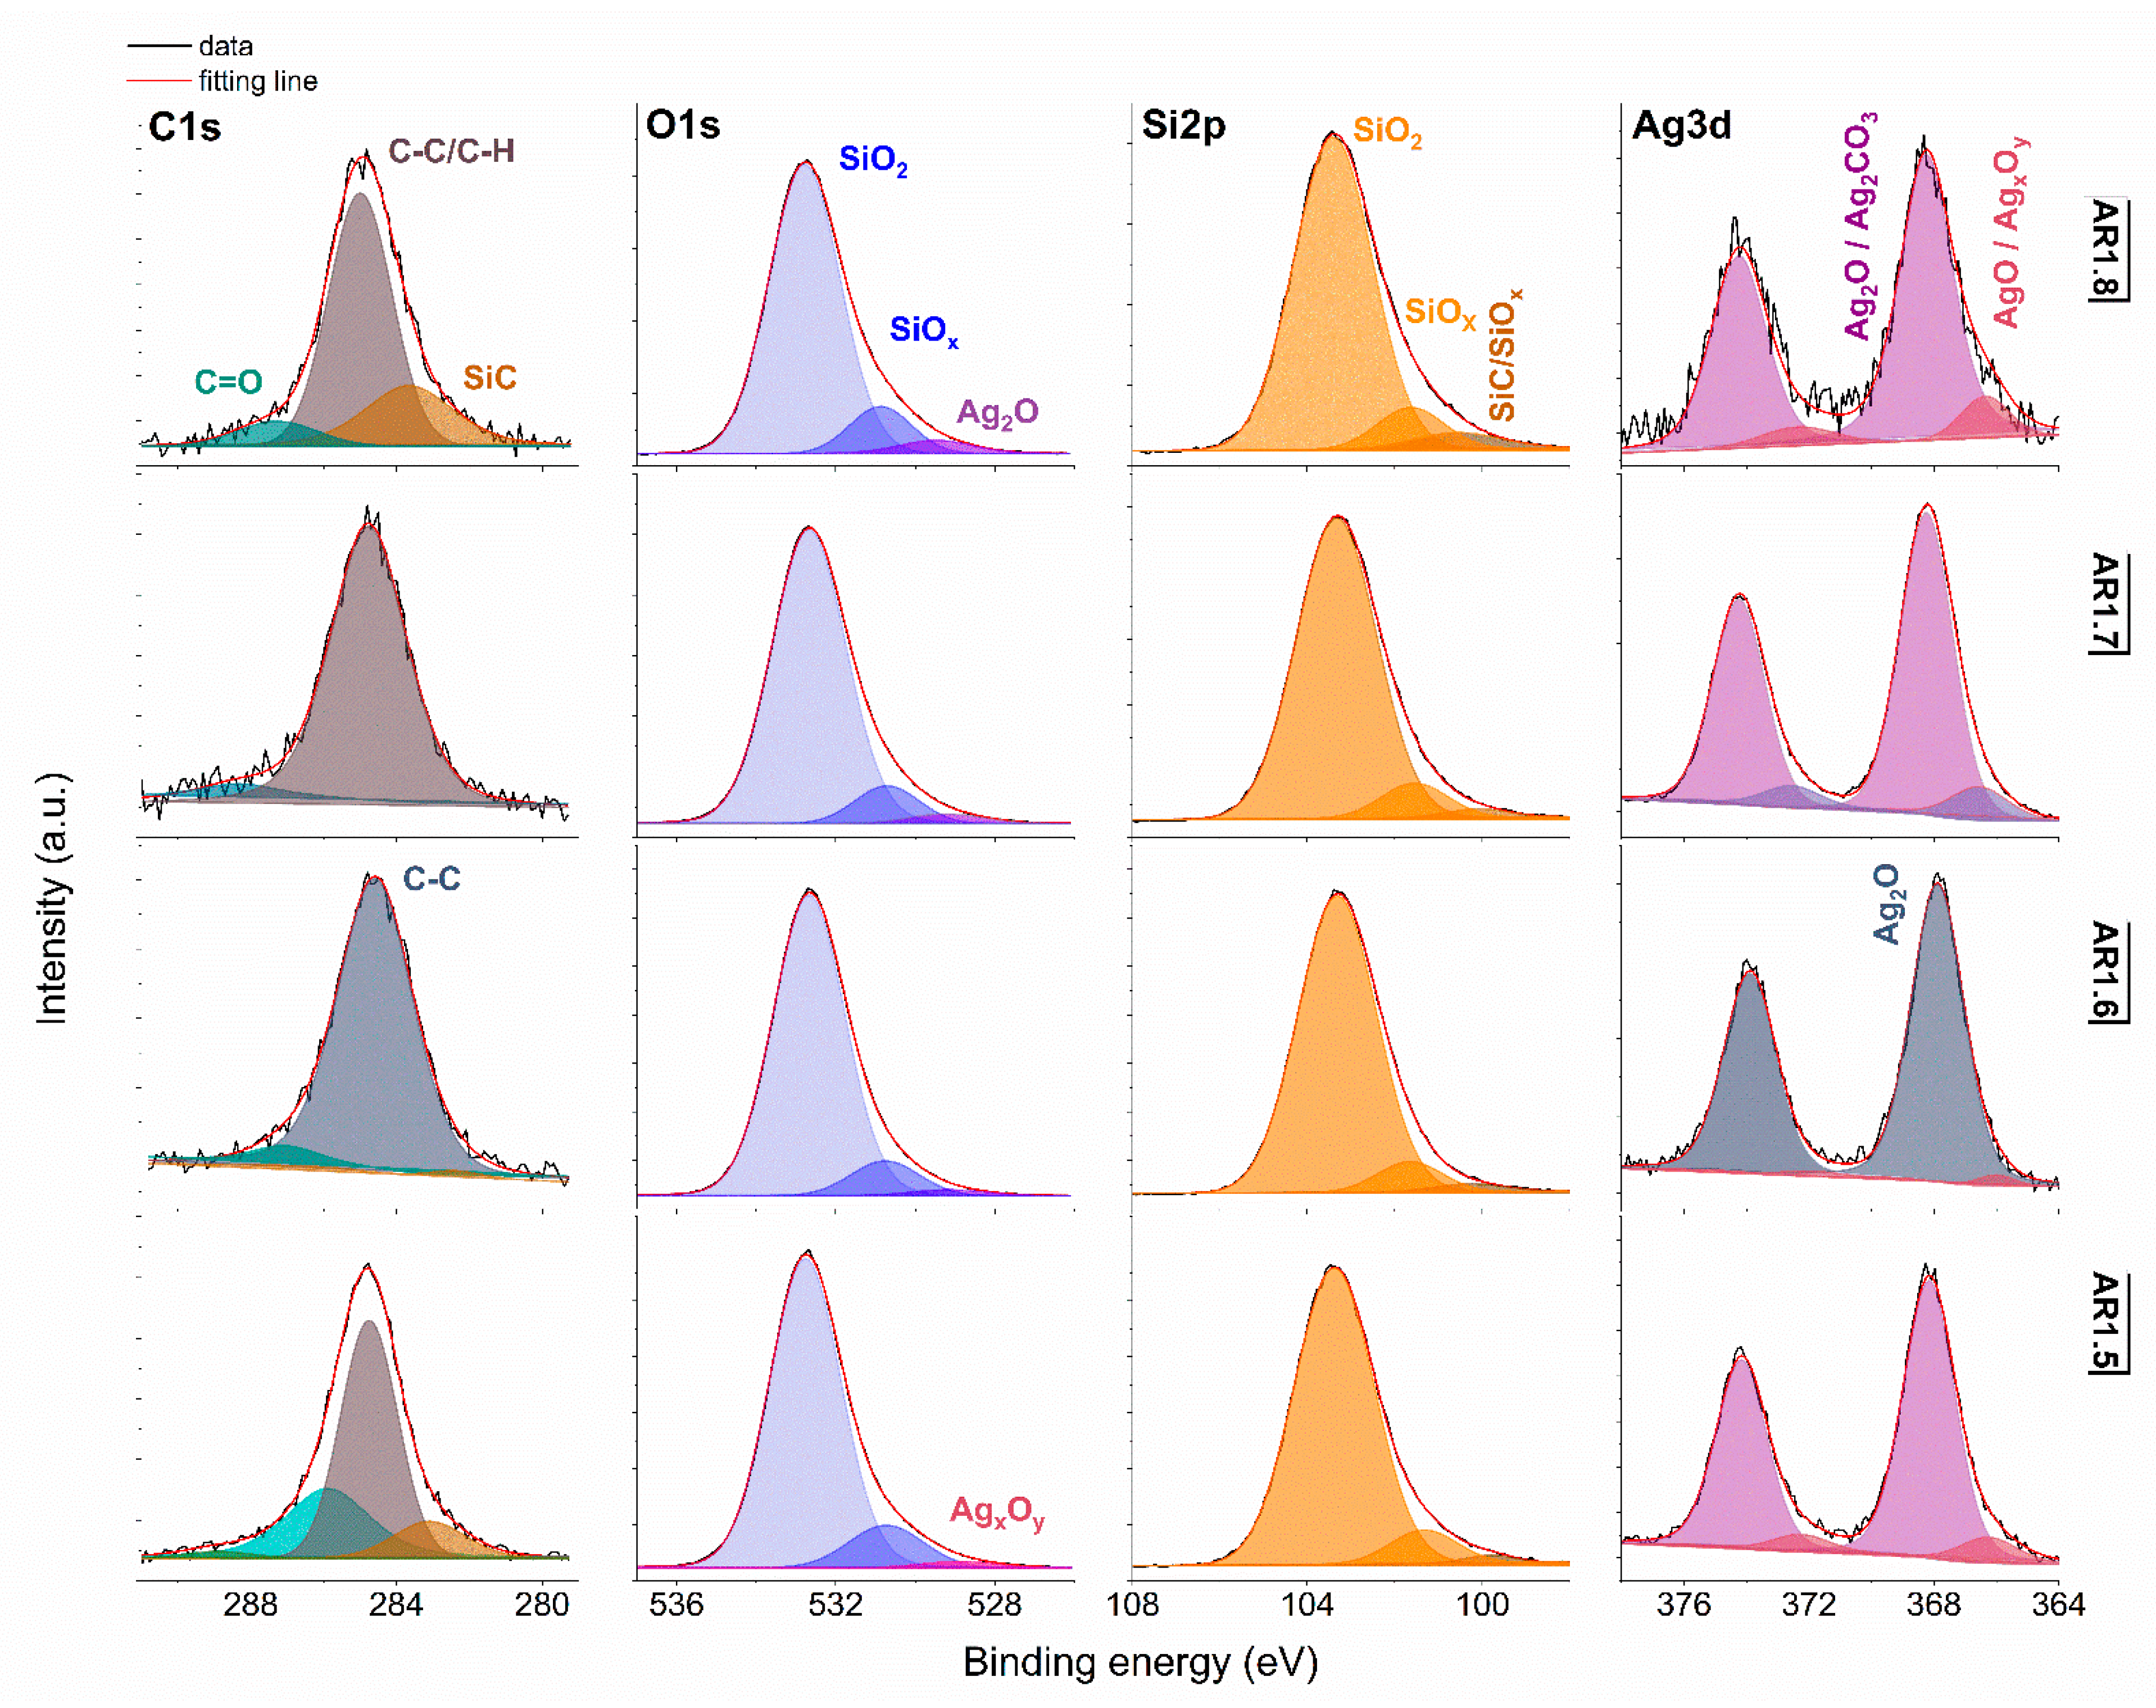
3.3. Surface Chemical Studies
4. Biological Studies
4.1. Microbial Activity of Newly Synthesized NCs
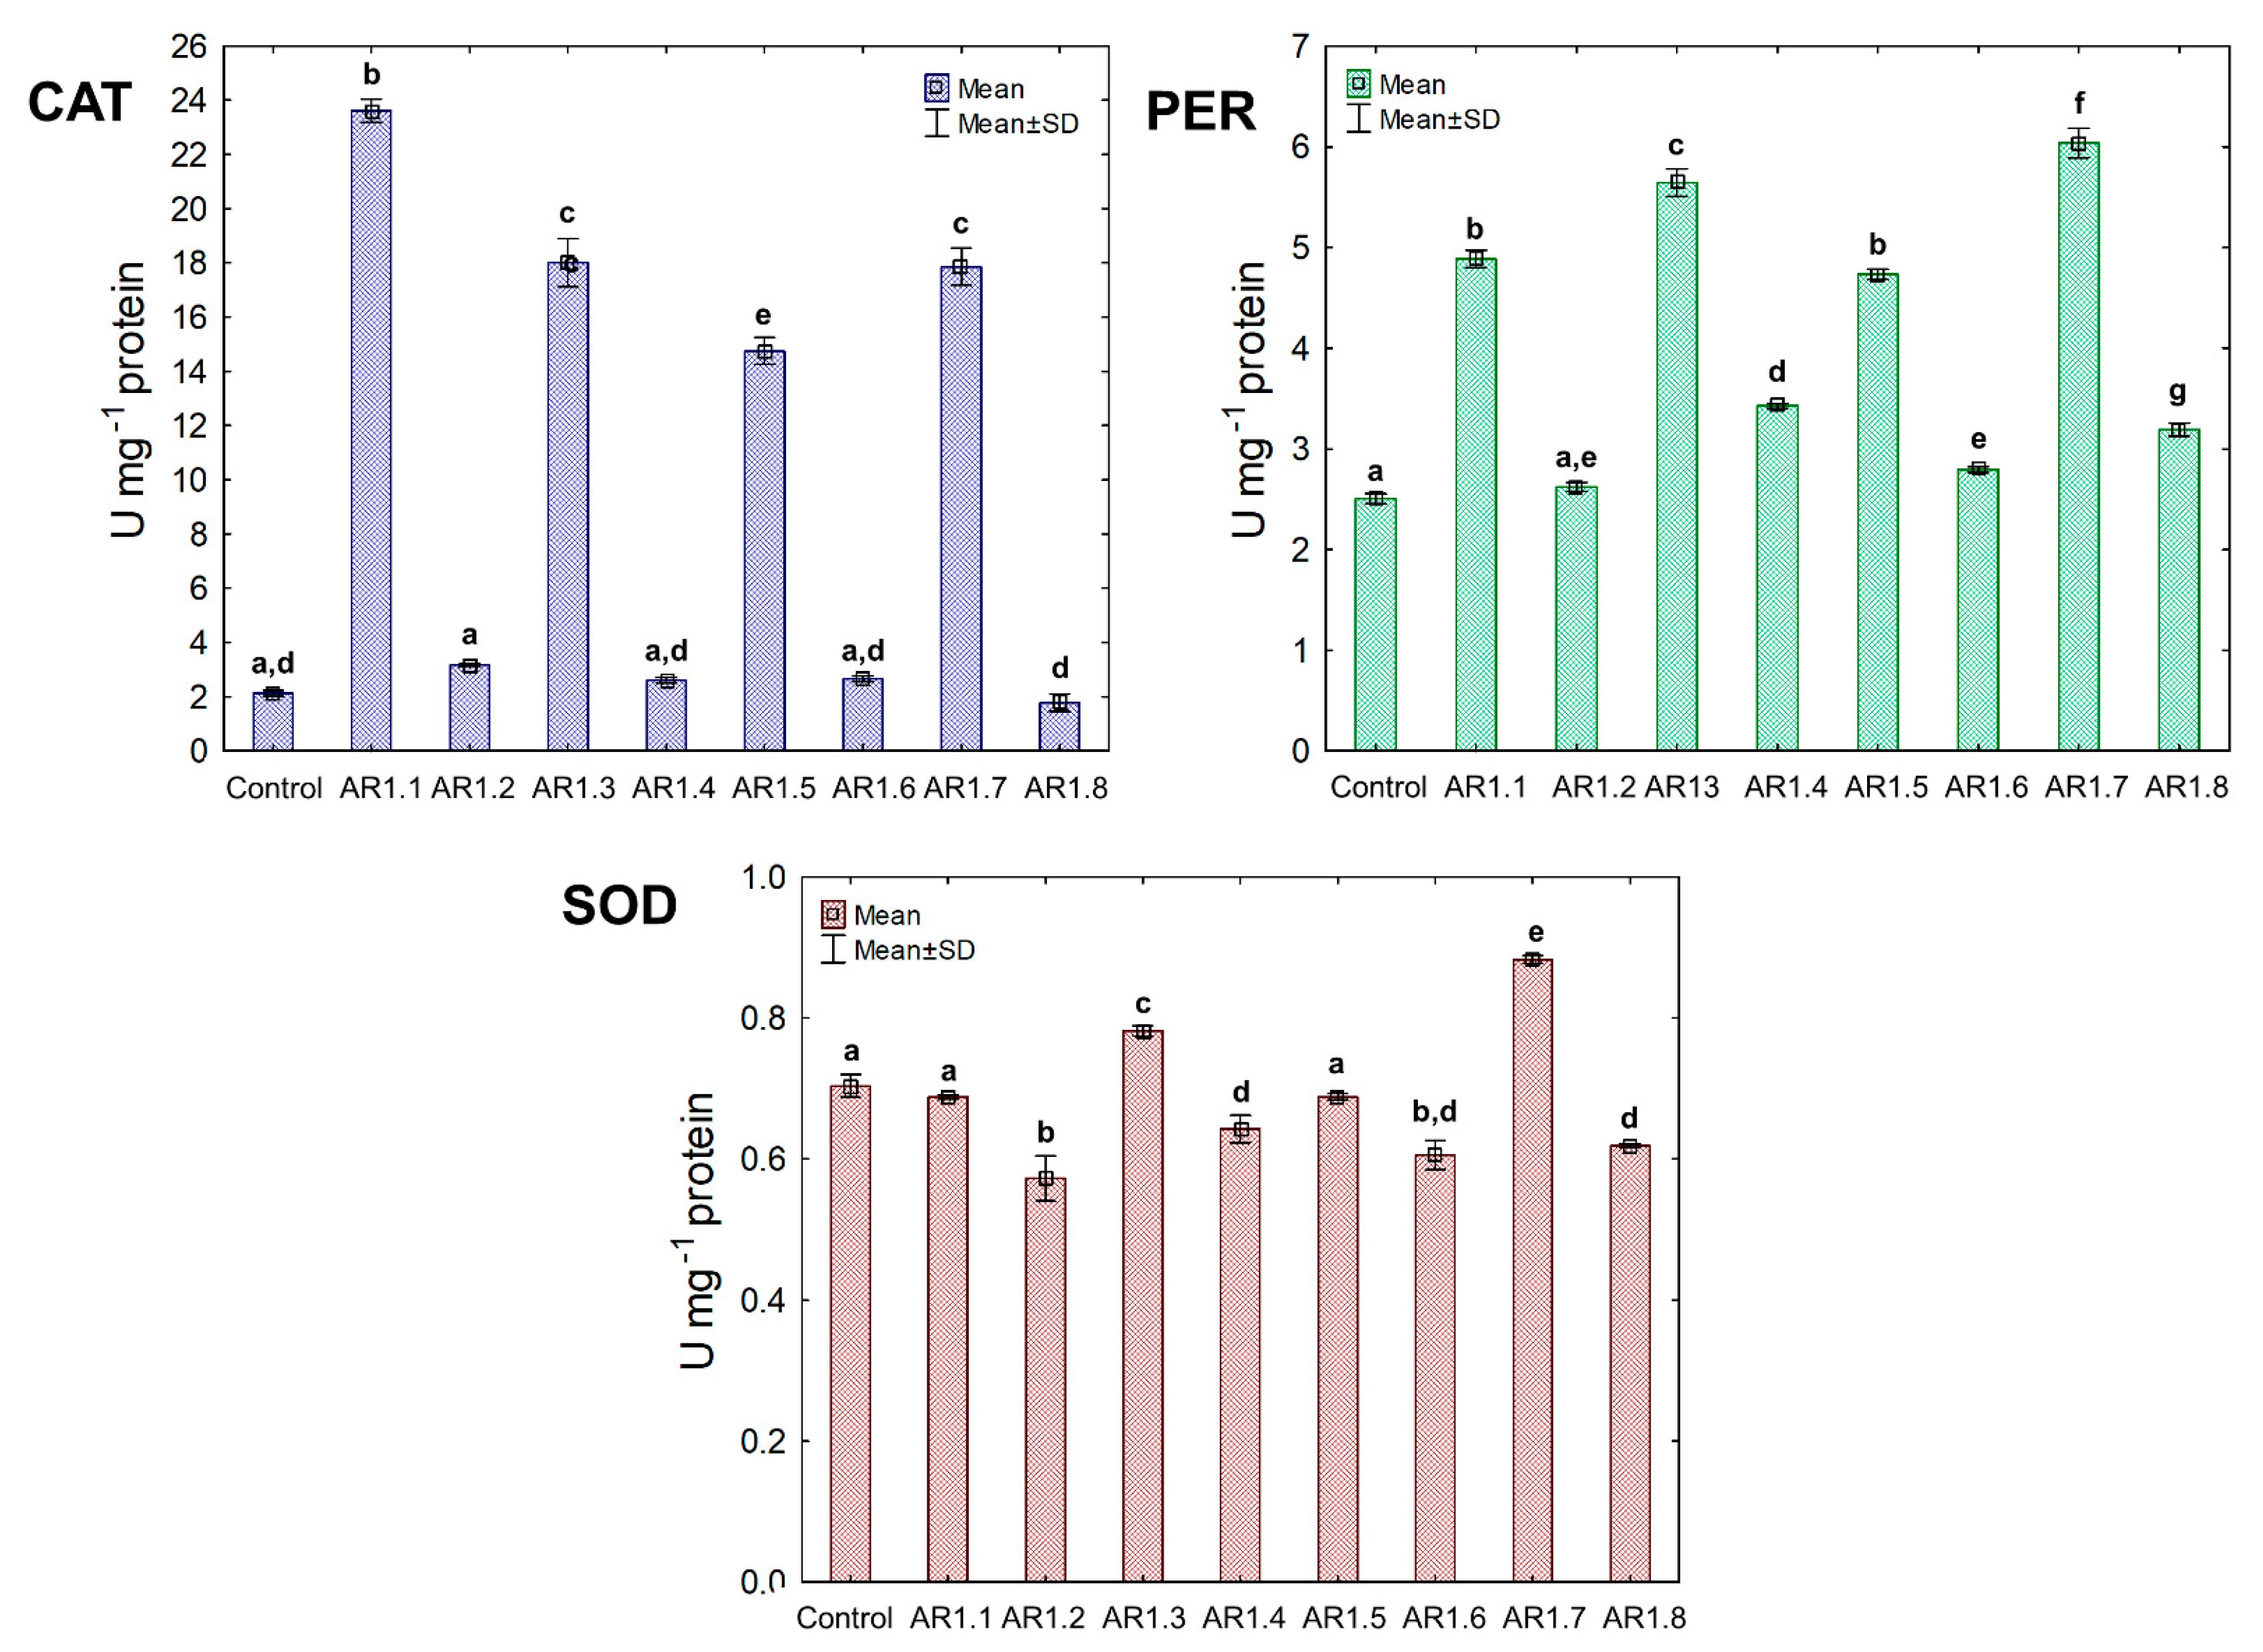
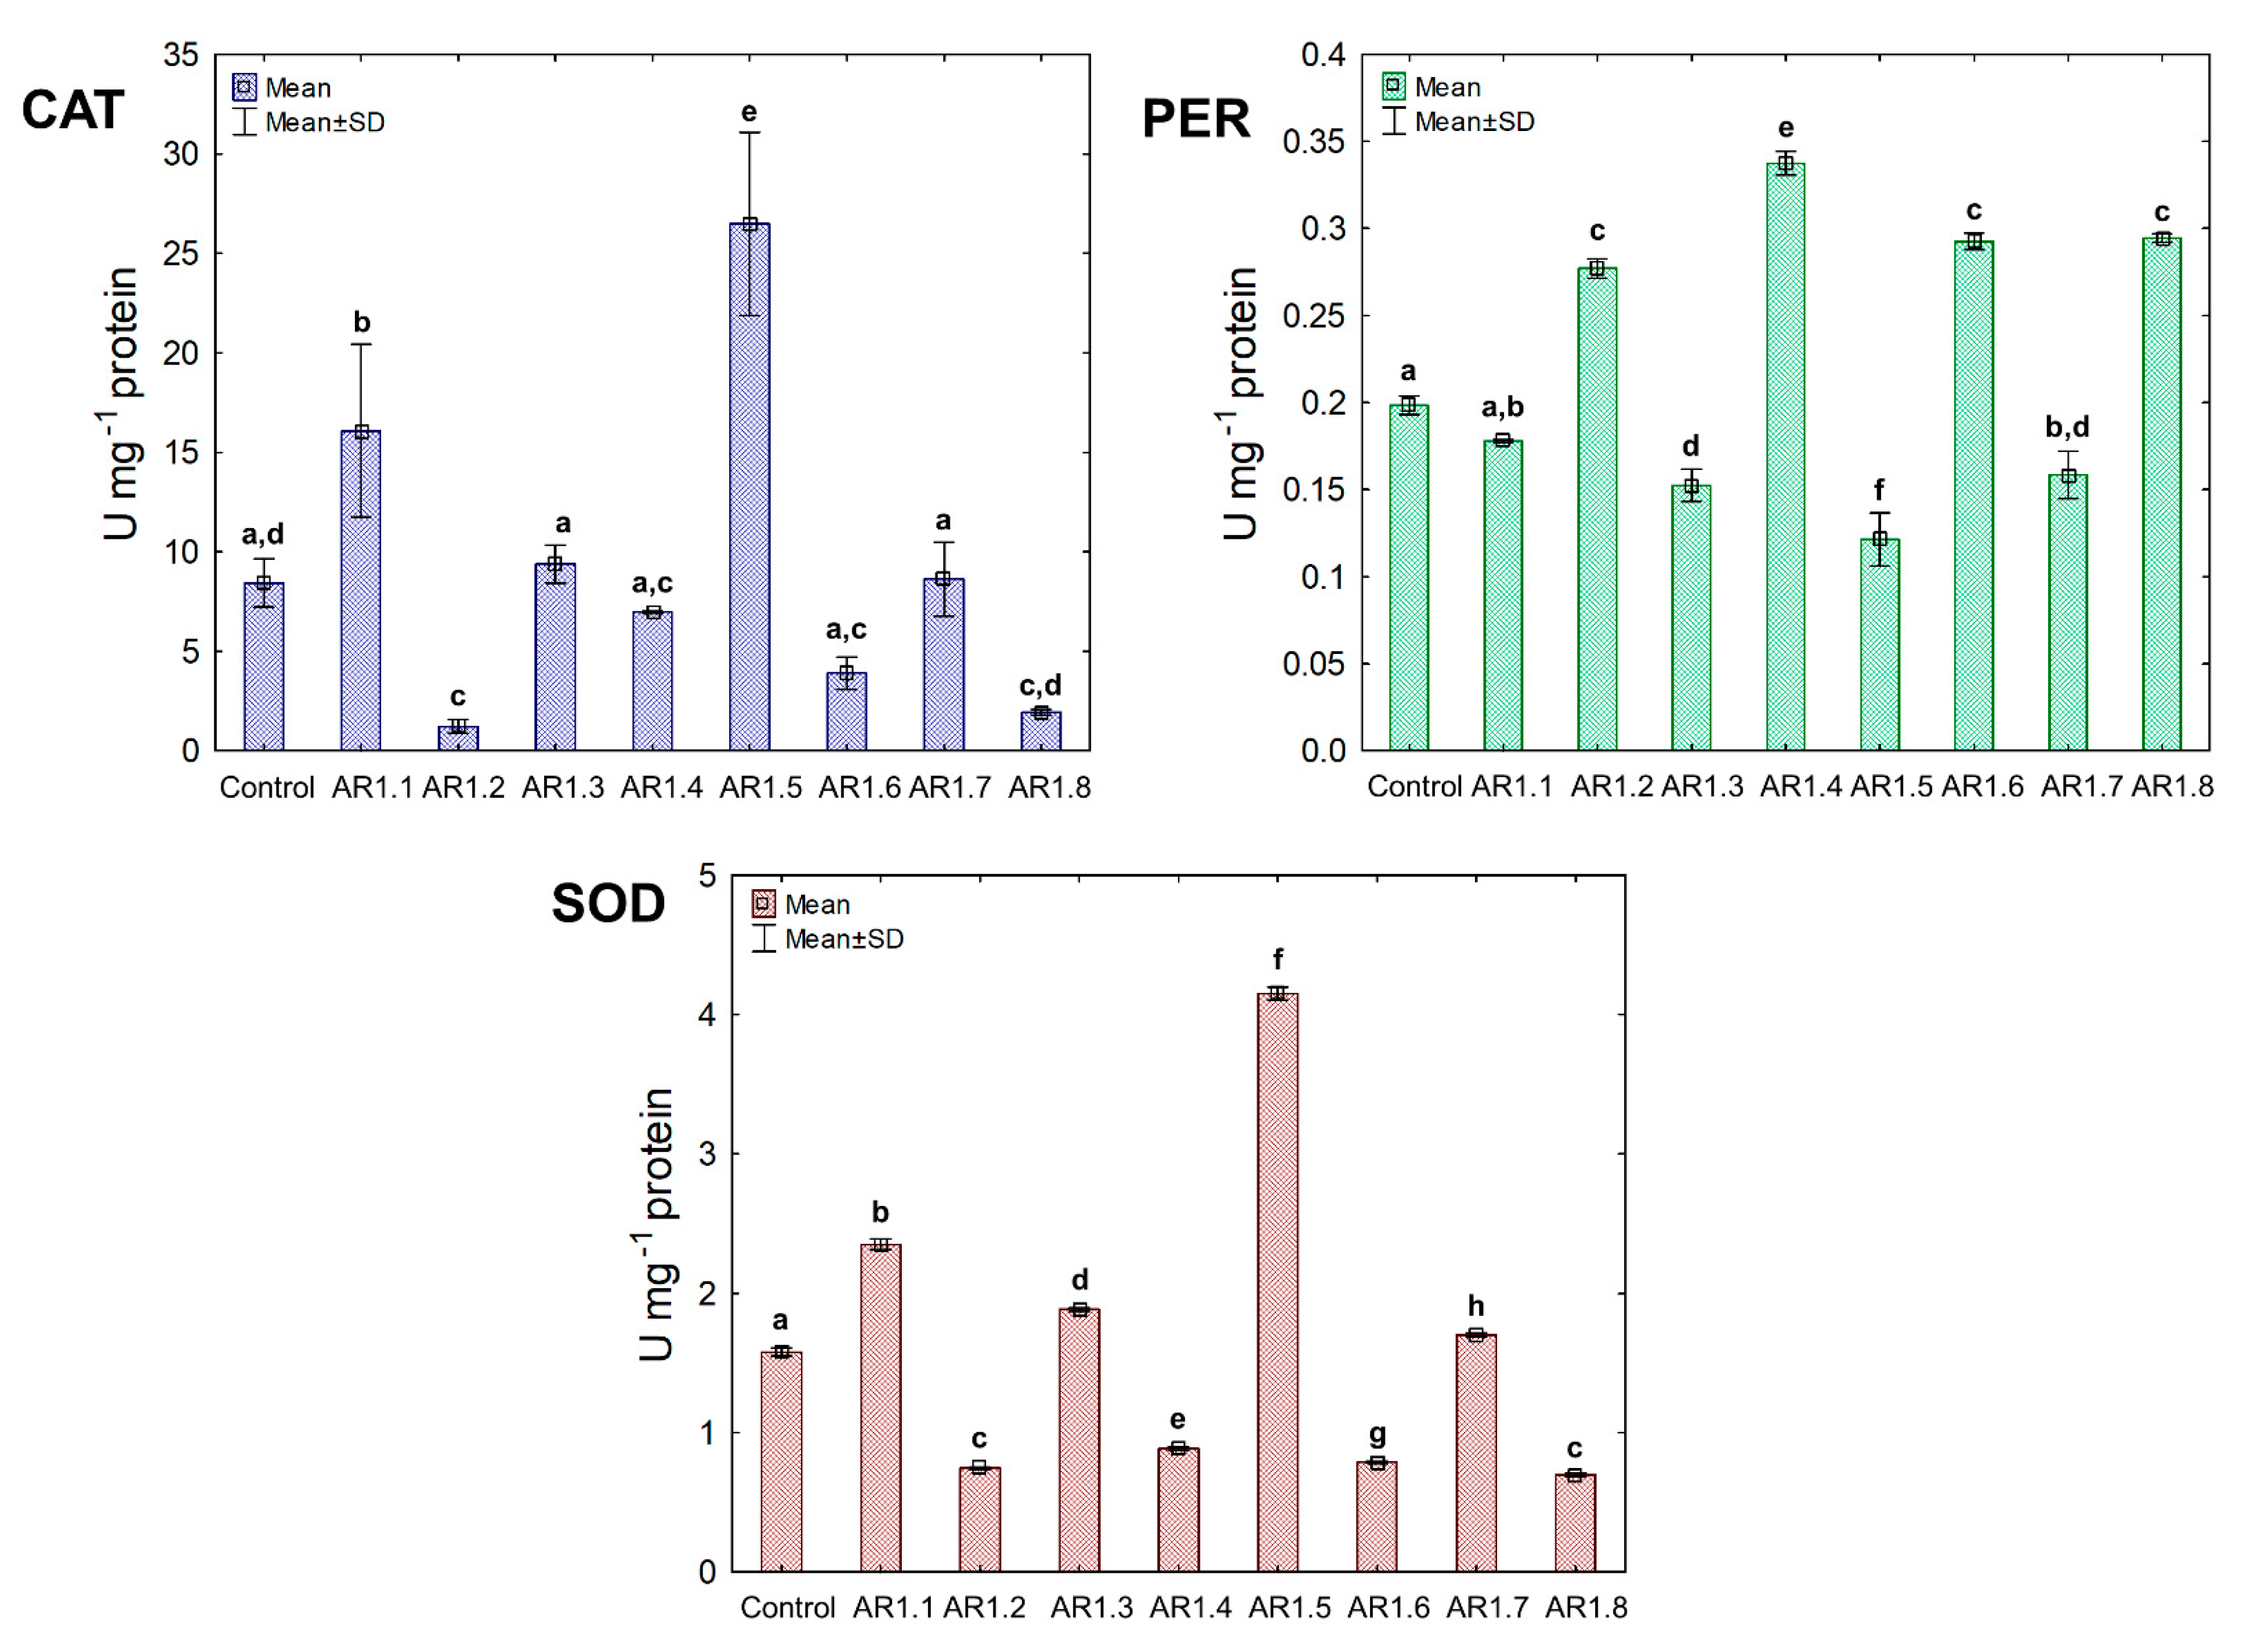
4.2. Antioxidant Enzymes Activity in Response to NC Stress
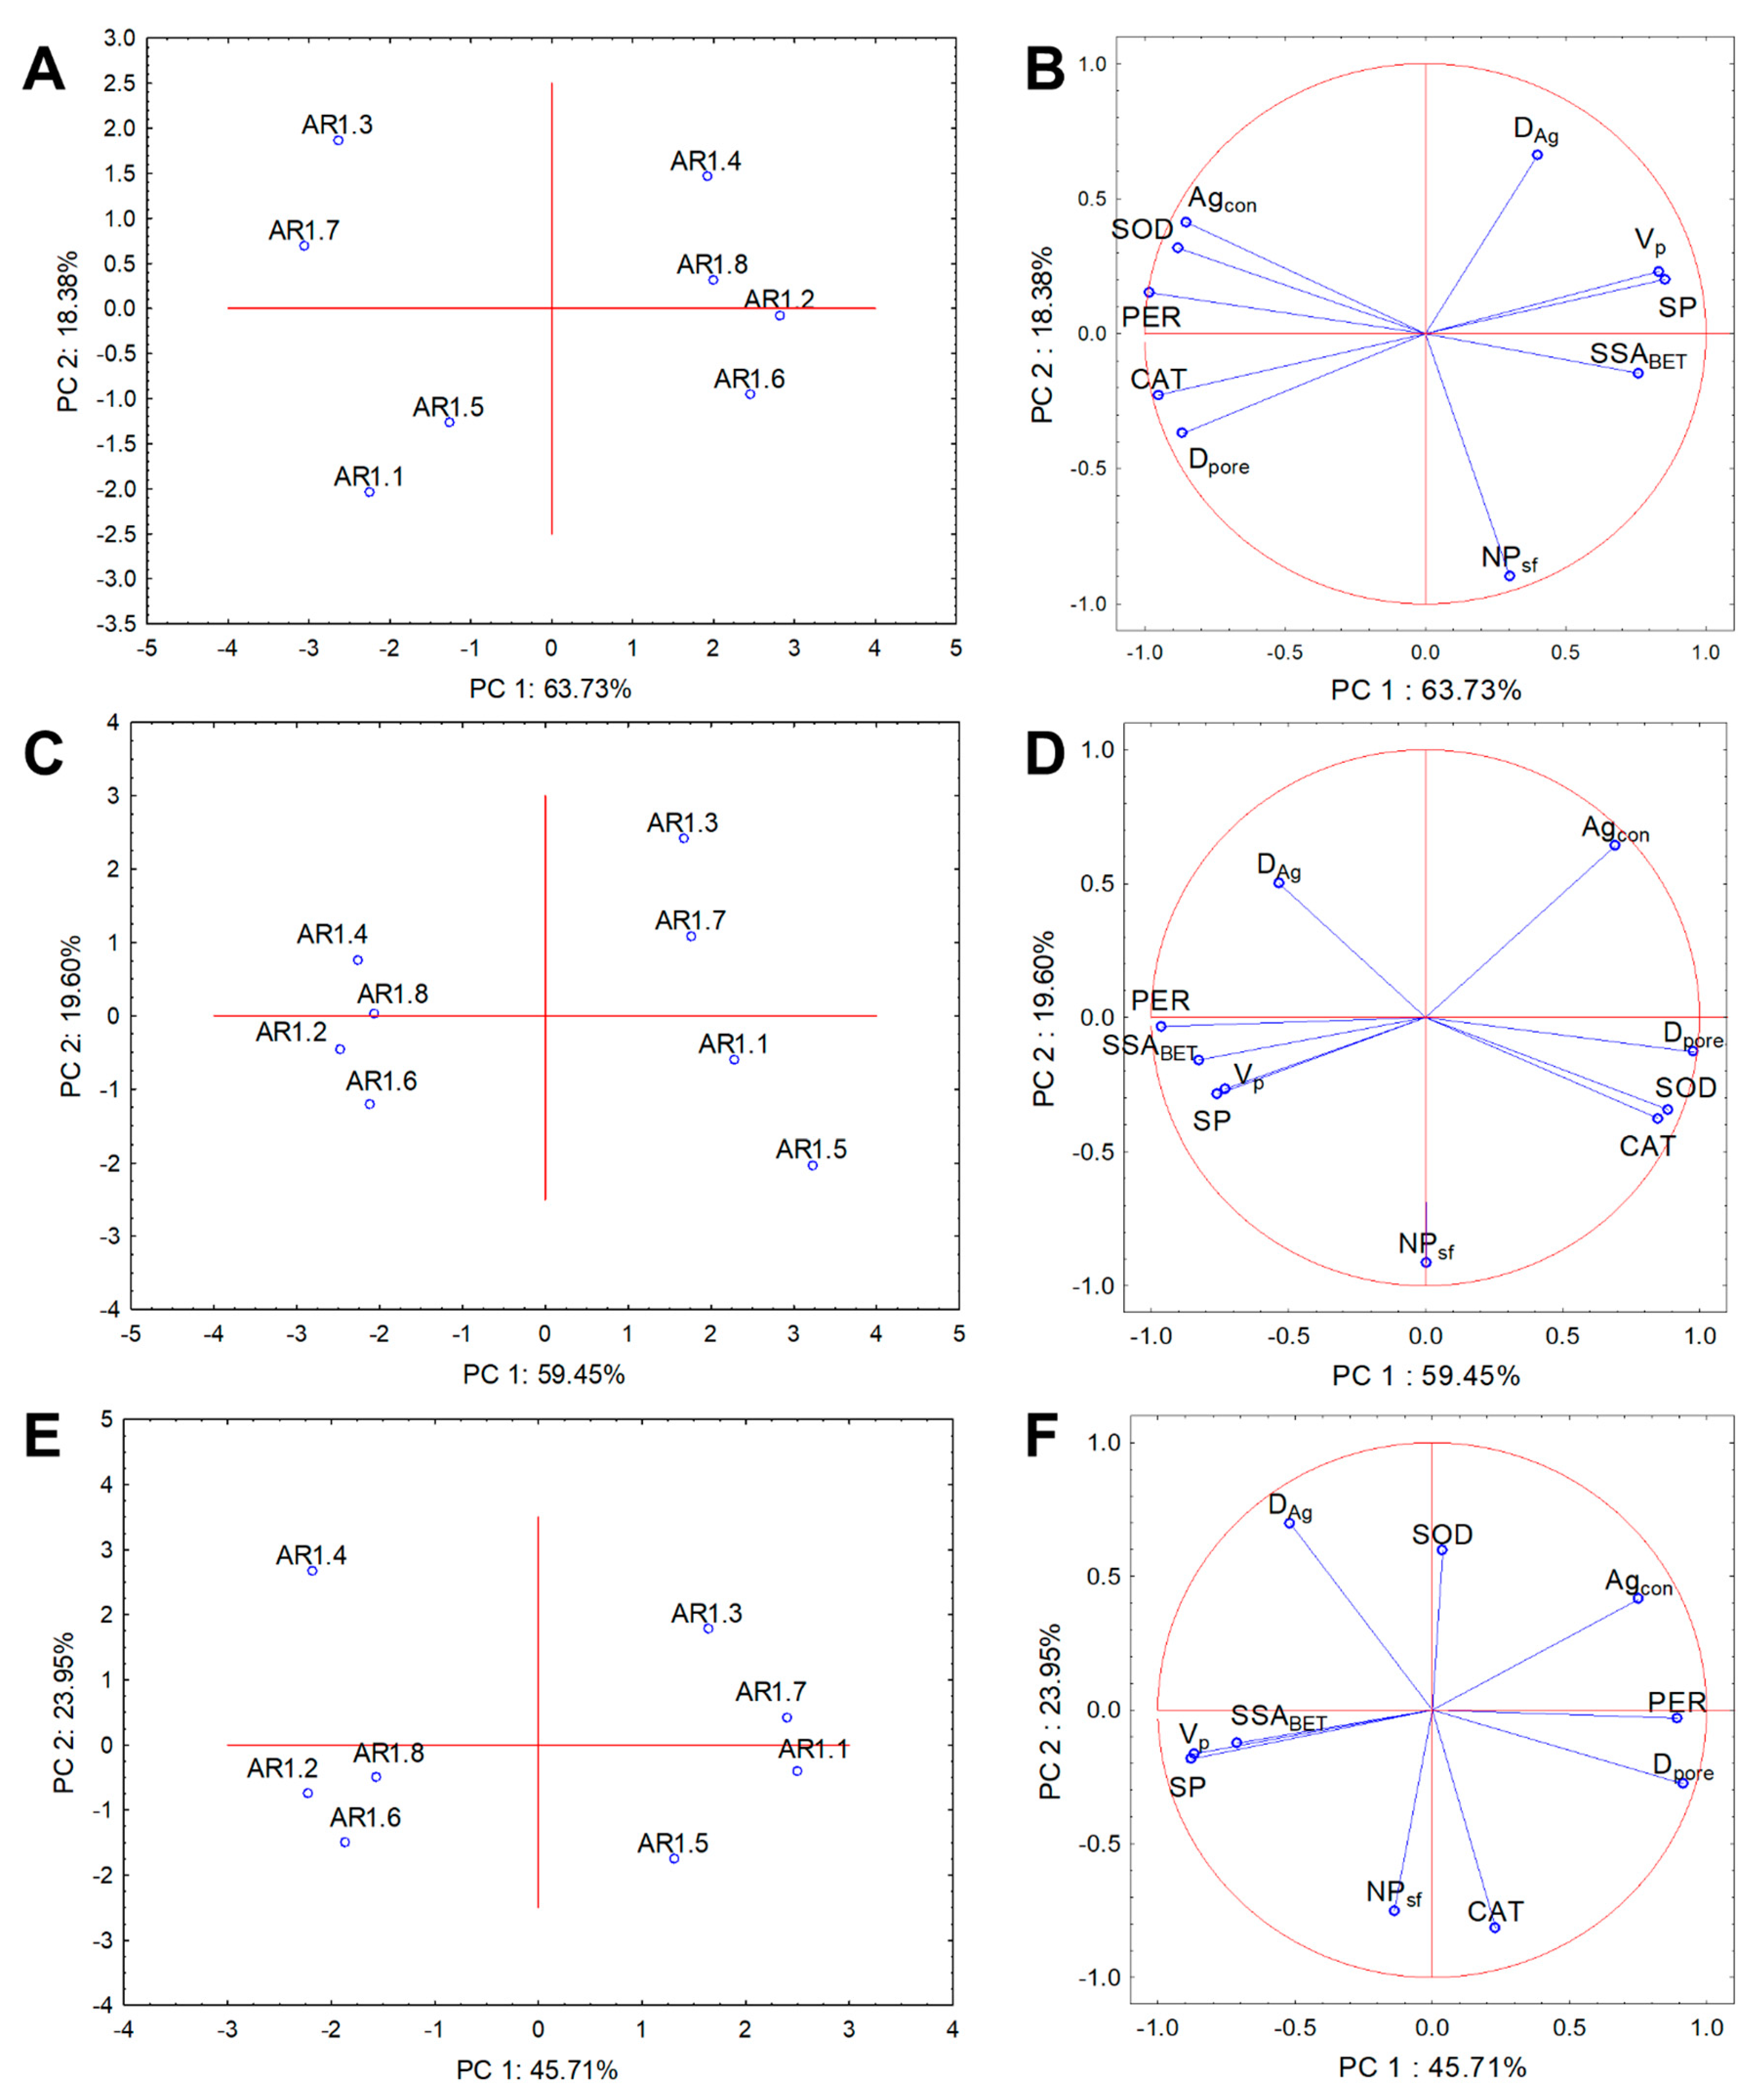
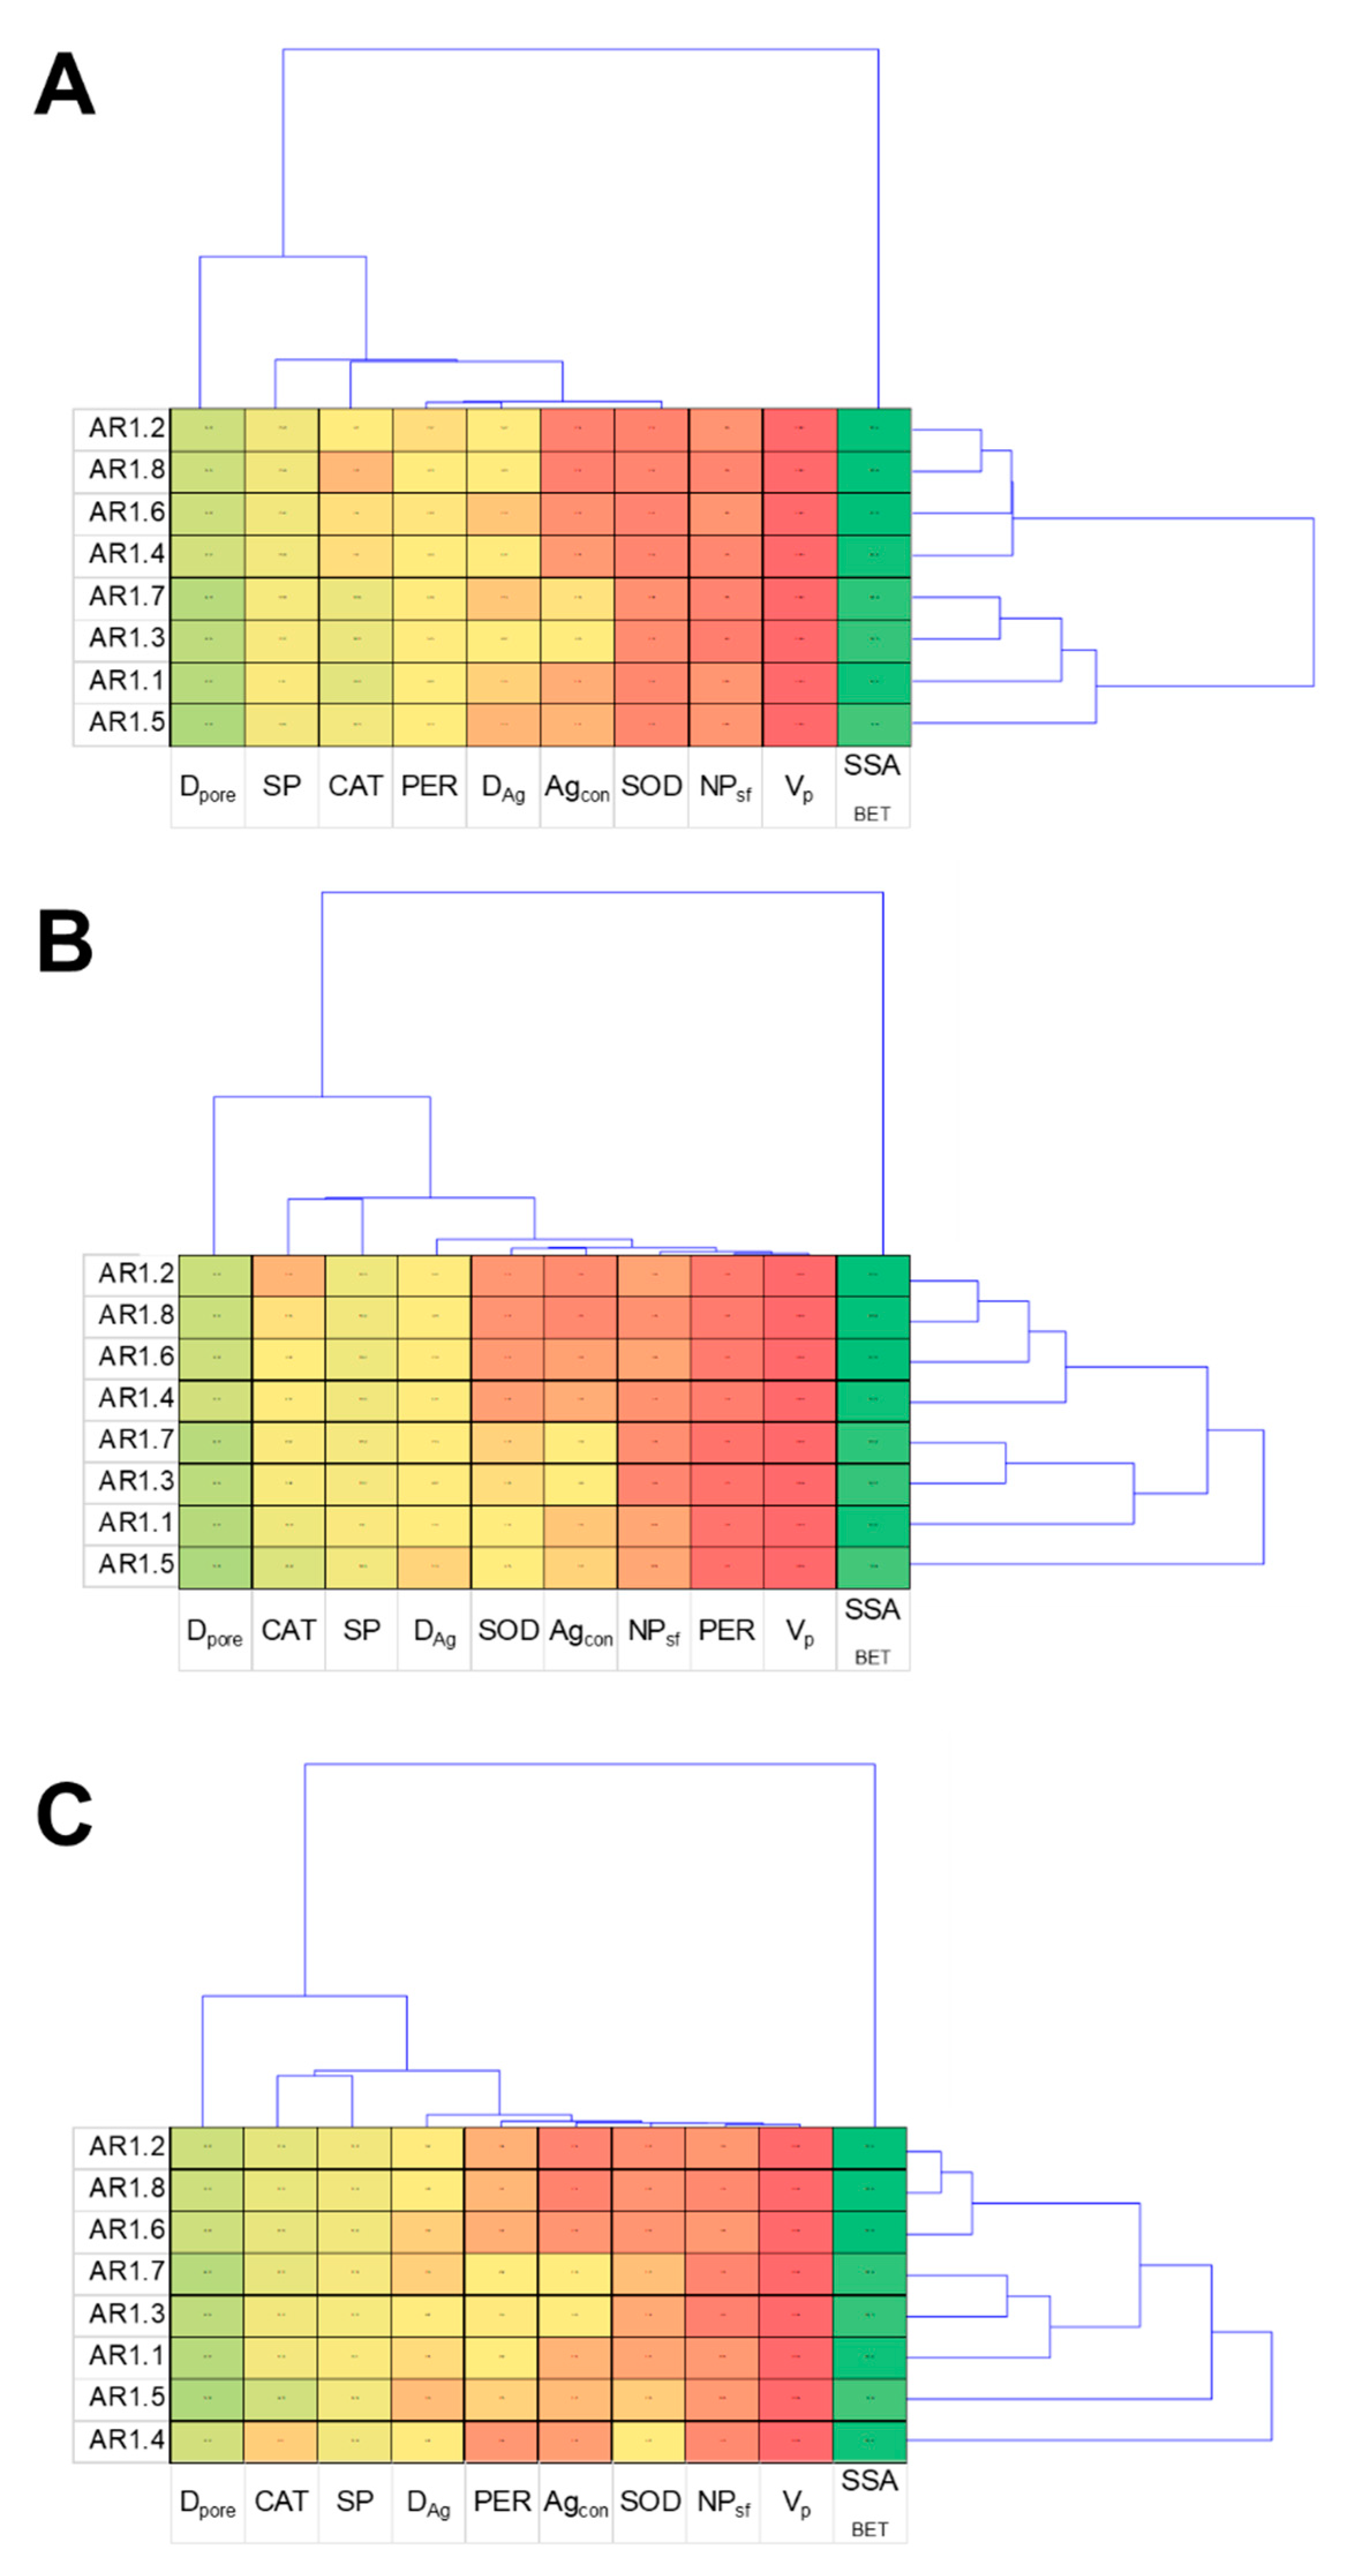
4.3. Statistical Data Exploration
5. Materials and Methods
5.1. Structural Analysis
5.2. Morphological Studies and Chemical Composition
5.3. Estimation of Nanoparticles Size
5.4. Determination of Nanoparticle Surface Charge
5.5. Determination of the Surface Area, Pore Volume, and Pore Diameter
5.6. Microbial Studies
5.6.1. Bacterial Strains and Toxicological Studies
5.6.2. Antioxidant Enzymes Response to NC Treatment
5.7. Statistical Analysis
6. Conclusions
Supplementary Materials
Author Contributions
Funding
Institutional Review Board Statement
Informed Consent Statement
Data Availability Statement
Conflicts of Interest
References
- Pareek, V.; Gupta, R.; Panwar, J. Do Physico-Chemical Properties of Silver Nanoparticles Decide Their Interaction with Biological Media and Bactericidal Action? A Review. Mater. Sci. Eng. C 2018, 90, 739–749. [Google Scholar] [CrossRef] [PubMed]
- Chang, T.-H.; Liu, Y.-W.; Lin, Y.-H.; Lin, J.-J.; Huang, J.-W.; Hussain, A.; Chang, P.-F.L. Silver Nanoparticles on Nanoscale Silica Platelets (AgNP/NSP) and Nanoscale Silica Platelets (NSP) Inhibit the Development of Fusarium Oxysporum f. Sp. Niveum. ACS Appl. Bio Mater. 2019, 2, 4978–4985. [Google Scholar] [CrossRef] [PubMed]
- Tăbăran, A.-F.; Matea, C.T.; Mocan, T.; Tăbăran, A.; Mihaiu, M.; Iancu, C.; Mocan, L. Silver Nanoparticles for the Therapy of Tuberculosis. Int. J. Nanomed. 2020, 15, 2231–2258. [Google Scholar] [CrossRef]
- Qing, Y.; Cheng, L.; Li, R.; Liu, G.; Zhang, Y.; Tang, X.; Wang, J.; Liu, H.; Qin, Y. Potential Antibacterial Mechanism of Silver Nanoparticles and the Optimization of Orthopedic Implants by Advanced Modification Technologies. Int. J. Nanomed. 2018, 13, 3311–3327. [Google Scholar] [CrossRef]
- Korzekwa, K.; Kędziora, A.; Stańczykiewicz, B.; Bugla-Płoskońska, G.; Wojnicz, D. Benefits of Usage of Immobilized Silver Nanoparticles as Pseudomonas Aeruginosa Antibiofilm Factors. Int. J. Mol. Sci. 2022, 23, 284. [Google Scholar] [CrossRef]
- Tang, S.; Zheng, J. Antibacterial Activity of Silver Nanoparticles: Structural Effects. Adv. Healthc. Mater. 2018, 7, 1701503. [Google Scholar] [CrossRef]
- He, H.; Meng, S.; Li, H.; Yang, Q.; Xu, Z.; Chen, X.; Sun, Z.; Jiang, B.; Li, C. Nanoplatform Based on GSH-Responsive Mesoporous Silica Nanoparticles for Cancer Therapy and Mitochondrial Targeted Imaging. Microchim. Acta 2021, 188, 154. [Google Scholar] [CrossRef]
- Bapat, R.A.; Chaubal, T.V.; Joshi, C.P.; Bapat, P.R.; Choudhury, H.; Pandey, M.; Gorain, B.; Kesharwani, P. An Overview of Application of Silver Nanoparticles for Biomaterials in Dentistry. Mater. Sci. Eng. C 2018, 91, 881–898. [Google Scholar] [CrossRef] [PubMed]
- Yin, I.X.; Zhang, J.; Zhao, I.S.; Mei, M.L.; Li, Q.; Chu, C.H. The Antibacterial Mechanism of Silver Nanoparticles and Its Application in Dentistry. Int. J. Nanomed. 2020, 15, 2555–2562. [Google Scholar] [CrossRef]
- Lee, S.H.; Jun, B.-H. Silver Nanoparticles: Synthesis and Application for Nanomedicine. Int. J. Mol. Sci. 2019, 20, 865. [Google Scholar] [CrossRef]
- Min, Y.; Akbulut, M.; Kristiansen, K.; Golan, Y.; Israelachvili, J. The Role of Interparticle and External Forces in Nanoparticle Assembly. Nat. Mater. 2008, 7, 527–538. [Google Scholar] [CrossRef] [PubMed]
- Stevenson, A.P.; Blanco Bea, D.; Civit, S.; Antoranz Contera, S.; Iglesias Cerveto, A.; Trigueros, S. Three Strategies to Stabilise Nearly Monodispersed Silver Nanoparticles in Aqueous Solution. Nanoscale Res. Lett. 2012, 7, 151. [Google Scholar] [CrossRef]
- Sotiriou, G.A.; Pratsinis, S.E. Engineering Nanosilver as an Antibacterial, Biosensor and Bioimaging Material. Curr. Opin. Chem. Eng. 2011, 1, 3–10. [Google Scholar] [CrossRef]
- Dulski, M.; Peszke, J.; Włodarczyk, J.; Sułowicz, S.; Piotrowska-Seget, Z.; Dudek, K.; Podwórny, J.; Malarz, K.; Mrozek-Wilczkiewicz, A.; Zubko, M.; et al. Physicochemical and Structural Features of Heat Treated Silver-Silica Nanocomposite and Their Impact on Biological Properties. Mater. Sci. Eng. C 2019, 103, 109790. [Google Scholar] [CrossRef] [PubMed]
- Panáček, A.; Kvítek, L.; Prucek, R.; Kolář, M.; Večeřová, R.; Pizúrová, N.; Sharma, V.K.; Nevěčná, T.; Zbořil, R. Silver Colloid Nanoparticles: Synthesis, Characterization, and Their Antibacterial Activity. J. Phys. Chem. B 2006, 110, 16248–16253. [Google Scholar] [CrossRef]
- Sharma, V.K.; Yngard, R.A.; Lin, Y. Silver Nanoparticles: Green Synthesis and Their Antimicrobial Activities. Adv. Colloid Interface Sci. 2009, 145, 83–96. [Google Scholar] [CrossRef]
- Sotiriou, G.A.; Pratsinis, S.E. Antibacterial Activity of Nanosilver Ions and Particles. Environ. Sci. Technol. 2010, 44, 5649–5654. [Google Scholar] [CrossRef]
- Sotiriou, G.A.; Meyer, A.; Knijnenburg, J.T.N.; Panke, S.; Pratsinis, S.E. Quantifying the Origin of Released Ag+ Ions from Nanosilver. Langmuir 2012, 28, 15929–15936. [Google Scholar] [CrossRef]
- Xiu, Z.; Zhang, Q.; Puppala, H.L.; Colvin, V.L.; Alvarez, P.J.J. Negligible Particle-Specific Antibacterial Activity of Silver Nanoparticles. Nano Lett. 2012, 12, 4271–4275. [Google Scholar] [CrossRef]
- Sotiriou, G.A.; Sannomiya, T.; Teleki, A.; Krumeich, F.; Vörös, J.; Pratsinis, S.E. Non-Toxic Dry-Coated Nanosilver for Plasmonic Biosensors. Adv. Funct. Mater. 2010, 20, 4250–4257. [Google Scholar] [CrossRef] [PubMed]
- Owan, R.; Handy, R. Viewpoint: Formulating the Problems for Environmental Risk Assessment of Nanomaterials. Environ. Sci. Technol. 2007, 41, 5582–5588. [Google Scholar] [CrossRef]
- Stone, V.; Nowack, B.; Baun, A.; van den Brink, N.; von der Kammer, F.; Dusinska, M.; Handy, R.; Hankin, S.; Hassellöv, M.; Joner, E.; et al. Nanomaterials for Environmental Studies: Classification, Reference Material Issues, and Strategies for Physico-Chemical Characterisation. Sci. Total Environ. 2010, 408, 1745–1754. [Google Scholar] [CrossRef]
- Lakbita, O.; Rhouta, B.; Maury, F.; Senocq, F.; Amjoud, M.; Daoudi, L. Influence of the Crystal Structure of Ag2CO3 on the Photocatalytic Activity under Visible Light of Ag2CO3-Palygorskite Nanocomposite Material. Appl. Surf. Sci. 2019, 464, 205–211. [Google Scholar] [CrossRef]
- Mergenbayeva, S.; Atabaev, T.S.; Vakros, J.; Mantzavinos, D.; Poulopoulos, S.G. Photocatalytic Degradation of 4-Tert-Butylphenol Using Solar Light Responsive Ag2CO3. Catalysts 2022, 12, 1523. [Google Scholar] [CrossRef]
- Ren, H.-T.; Jia, S.-Y.; Wu, S.-H.; Zhang, T.-H.; Han, X. Phase Transformation Synthesis of Novel Ag2O/Ag2CO3/g-C3N4 Composite with Enhanced Photocatalytic Activity. Mater. Lett. 2015, 142, 15–18. [Google Scholar] [CrossRef]
- Feng, Q.L.; Wu, J.; Chen, G.Q.; Cui, F.Z.; Kim, T.N.; Kim, J.O. A Mechanistic Study of the Antibacterial Effect of Silver Ions on Escherichia Coli and Staphylococcus Aureus. J. Biomed. Mater. Res. 2000, 52, 662–668. [Google Scholar] [CrossRef]
- Yamanaka, M.; Hara, K.; Kudo, J. Bactericidal Actions of a Silver Ion Solution on Escherichia Coli, Studied by Energy-Filtering Transmission Electron Microscopy and Proteomic Analysis. Appl. Environ. Microbiol. 2005, 71, 7589–7593. [Google Scholar] [CrossRef]
- Yao, Z.T.; Chen, T.; Li, H.Y.; Xia, M.S.; Ye, Y.; Zheng, H. Preparation, Characterization, and Antibacterial Activity of Shell Waste Loaded with Silver. J. Mater. Sci. 2013, 48, 8580–8587. [Google Scholar] [CrossRef]
- Xu, C.; Liu, Y.; Huang, B.; Li, H.; Qin, X.; Zhang, X.; Dai, Y. Preparation, Characterization, and Photocatalytic Properties of Silver Carbonate. Appl. Surf. Sci. 2011, 257, 8732–8736. [Google Scholar] [CrossRef]
- Zhang, H.; Chen, G.; Bahnemann, D.W. Photoelectrocatalytic Materials for Environmental Applications. J. Mater. Chem. 2009, 19, 5089–5121. [Google Scholar] [CrossRef]
- Teoh, W.Y.; Scott, J.A.; Amal, R. Progress in Heterogeneous Photocatalysis: From Classical Radical Chemistry to Engineering Nanomaterials and Solar Reactors. J. Phys. Chem. Lett. 2012, 3, 629–639. [Google Scholar] [CrossRef] [PubMed]
- Kamat, P.V.; Bisquert, J. Solar Fuels. Photocatalytic Hydrogen Generation. J. Phys. Chem. C 2013, 117, 14873–14875. [Google Scholar] [CrossRef]
- Guo, S.; Bao, J.; Hu, T.; Zhang, L.; Yang, L.; Peng, J.; Jiang, C. Controllable Synthesis Porous Ag2CO3 Nanorods for Efficient Photocatalysis. Nanoscale Res. Lett. 2015, 10, 193. [Google Scholar] [CrossRef]
- Dai, G.; Yu, J.; Liu, G. A New Approach for Photocorrosion Inhibition of Ag2CO3 Photocatalyst with Highly Visible-Light-Responsive Reactivity. J. Phys. Chem. C 2012, 116, 15519–15524. [Google Scholar] [CrossRef]
- Lončarević, D.; Vukoje, I.; Dostanić, J.; Bjelajac, A.; Đorđević, V.; Dimitrijević, S.; Nedeljković, J.M. Antimicrobial and Photocatalytic Abilities of Ag2CO3 Nano-Rods. ChemistrySelect 2017, 2, 2931–2938. [Google Scholar] [CrossRef]
- Zhou, L.; Liang, L.; Talifu, D.; Abulizi, A. Sonochemical Fabrication of Ag2CO3 Nanomaterial and Influencing Factors on Photocatalytic Properties. IOP Conf. Ser. Mater. Sci. Eng. 2017, 167, 012032. [Google Scholar] [CrossRef]
- Petala, A.; Nasiou, A.; Mantzavinos, D.; Frontistis, Z. Photocatalytic Evaluation of Ag2CO3 for Ethylparaben Degradation in Different Water Matrices. Water 2020, 12, 1180. [Google Scholar] [CrossRef]
- Panácek, A.; Kolár, M.; Vecerová, R.; Prucek, R.; Soukupová, J.; Krystof, V.; Hamal, P.; Zboril, R.; Kvítek, L. Antifungal Activity of Silver Nanoparticles against Candida Spp. Biomaterials 2009, 30, 6333–6340. [Google Scholar] [CrossRef]
- Yu, C.; Li, G.; Kumar, S.; Yang, K.; Jin, R. Phase Transformation Synthesis of Novel Ag2O/Ag2CO3 Heterostructures with High Visible Light Efficiency in Photocatalytic Degradation of Pollutants. Adv. Mater. 2014, 26, 892–898. [Google Scholar] [CrossRef]
- Buckley, J.J.; Gai, P.L.; Lee, A.F.; Olivi, L.; Wilson, K. Silver Carbonate Nanoparticles Stabilised over Alumina Nanoneedles Exhibiting Potent Antibacterial Properties. Chem. Commun. 2008, 34, 4013–4015. [Google Scholar] [CrossRef]
- Yu, C.; Wei, L.; Zhou, W.; Dionysiou, D.D.; Zhu, L.; Shu, Q.; Liu, H. A Visible-Light-Driven Core-Shell like Ag2S@Ag2CO3 Composite Photocatalyst with High Performance in Pollutants Degradation. Chemosphere 2016, 157, 250–261. [Google Scholar] [CrossRef]
- Yu, C.; Wei, L.; Chen, J.; Xie, Y.; Zhou, W.; Fan, Q. Enhancing the Photocatalytic Performance of Commercial TiO2 Crystals by Coupling with Trace Narrow-Band-Gap Ag2CO3. Ind. Eng. Chem. Res. 2014, 53, 5759–5766. [Google Scholar] [CrossRef]
- Rossi, N.R.; de Menezes, B.R.C.; Sampaio, A.D.G.; da Silva, D.M.; Koga-Ito, C.Y.; Thim, G.P.; Paes-Junior, T.J.D.A. Silver-Coated Silica Nanoparticles Modified with MPS: Potential Antimicrobial Biomaterials Applied in Glaze and Soft Reliner. Polymers 2022, 14, 4306. [Google Scholar] [CrossRef] [PubMed]
- Otari, S.V.; Patel, S.K.S.; Kalia, V.C.; Kim, I.-W.; Lee, J.-K. Antimicrobial Activity of Biosynthesized Silver Nanoparticles Decorated Silica Nanoparticles. Indian J. Microbiol. 2019, 59, 379–382. [Google Scholar] [CrossRef] [PubMed]
- Canhaci, S.J.; Perez, R.F.; Borges, L.E.P.; Fraga, M.A. Direct Conversion of Xylose to Furfuryl Alcohol on Single Organic–Inorganic Hybrid Mesoporous Silica-Supported Catalysts. Appl. Catal. B Environ. 2017, 207, 279–285. [Google Scholar] [CrossRef]
- Chen, K.; Fan, W.; Huang, C.; Qiu, X. Enhanced Stability and Catalytic Activity of Bismuth Nanoparticles by Modified with Porous Silica. J. Phys. Chem. Solids 2017, 110, 9–14. [Google Scholar] [CrossRef]
- Jaroniec, M.; Kruk, M.; Olivier, J.P. Standard Nitrogen Adsorption Data for Characterization of Nanoporous Silicas. Langmuir 1999, 15, 5410–5413. [Google Scholar] [CrossRef]
- Holland, B.T.; Blanford, C.F.; Do, T.; Stein, A. Synthesis of Highly Ordered, Three-Dimensional, Macroporous Structures of Amorphous or Crystalline Inorganic Oxides, Phosphates, and Hybrid Composites. Chem. Mater. 1999, 11, 795–805. [Google Scholar] [CrossRef]
- Ai, C.; Gong, G.; Zhao, X.; Liu, P. Macroporous Hollow Silica Microspheres-Supported Palladium Catalyst for Selective Hydrogenation of Nitrile Butadiene Rubber. J. Taiwan Inst. Chem. Eng. 2017, 77, 250–256. [Google Scholar] [CrossRef]
- Li, H.; Hou, B.; Wang, J.; Huang, X.; Chen, C.; Ma, Z.; Cui, J.; Jia, L.; Sun, D.; Li, D. Effect of Hierarchical Meso–Macroporous Structures on the Catalytic Performance of Silica Supported Cobalt Catalysts for Fischer–Tropsch Synthesis. Catal. Sci. Technol. 2017, 7, 3812–3822. [Google Scholar] [CrossRef]
- Jayan, H.; Sun, D.-W.; Pu, H.; Wei, Q. Mesoporous Silica Coated Core-Shell Nanoparticles Substrate for Size-Selective SERS Detection of Chloramphenicol. Spectrochim. Acta Part A Mol. Biomol. Spectrosc. 2023, 284, 121817. [Google Scholar] [CrossRef] [PubMed]
- Ambrogi, V.; Pietrella, D.; Donnadio, A.; Latterini, L.; Di Michele, A.; Luffarelli, I.; Ricci, M. Biocompatible Alginate Silica Supported Silver Nanoparticles Composite Films for Wound Dressing with Antibiofilm Activity. Mater. Sci. Eng. C 2020, 112, 110863. [Google Scholar] [CrossRef] [PubMed]
- Silicon Oxide Nanopowder/SiO2 Nanoparticles (SiO2, 99.5+%, 15-20nm, S-Type, Spherical). Available online: https://www.us-nano.com/inc/sdetail/410 (accessed on 29 December 2022).
- Silicon Dioxide SiO2 Nanopowder/Nanoparticles (SiO2, 99+%, 20-30 Nm). Available online: https://www.us-nano.com/inc/sdetail/408 (accessed on 29 December 2022).
- Griscom, D.L. The Electronic Structure of SiO2: A Review of Recent Spectroscopic and Theoretical Advances. J. Non-Cryst. Solids 1977, 24, 155–234. [Google Scholar] [CrossRef]
- Devine, R.A.; Arndt, J. Correlated Defect Creation and Dose-Dependent Radiation Sensitivity in Amorphous SiO2. Phys Rev. B Condens. Matter 1989, 39, 5132–5138. [Google Scholar] [CrossRef]
- Skuja, L. Optically Active Oxygen-Deficiency-Related Centers in Amorphous Silicon Dioxide. J. Non-Cryst. Solids 1998, 239, 16–48. [Google Scholar] [CrossRef]
- Furukawa, T.; Fox, K.E.; White, W.B. Raman Spectroscopic Investigation of the Structure of Silicate Glasses. III. Raman Intensities and Structural Units in Sodium Silicate Glasses. J. Chem. Phys. 1981, 75, 3226–3237. [Google Scholar] [CrossRef]
- Awazu, K.; Kawazoe, H. Strained Si–O–Si Bonds in Amorphous SiO2 Materials: A Family Member of Active Centers in Radio, Photo, and Chemical Responses. J. Appl. Phys. 2003, 94, 6243–6262. [Google Scholar] [CrossRef]
- Robinet, L.; Coupry, C.; Eremin, K.; Hall, C. The Use of Raman Spectrometry to Predict the Stability of Historic Glasses. J. Raman Spectrosc. 2006, 37, 789–797. [Google Scholar] [CrossRef]
- Bykov, V.N.; Koroleva, O.N.; Osipov, A.A. Structure of Silicate Melts: Raman Spectroscopic Data and Thermodynamic Simulation Results. Geochem. Int. 2009, 47, 1067. [Google Scholar] [CrossRef]
- McMillan, P.F.; Wolf, G.; Poe, B.T. Vibrational Spectroscopy of Silicate Liquids and Glasses. Chem. Geol. 1992, 96, 351–366. [Google Scholar] [CrossRef]
- Matson, D.W.; Sharma, S.K.; Philpotts, J.A. The Structure of High-Silica Alkali-Silicate Glasses. A Raman Spectroscopic Investigation. J. Non-Cryst. Solids 1983, 58, 323–352. [Google Scholar] [CrossRef]
- Parkinson, B.G.; Holland, D.; Smith, M.E.; Larson, C.; Doerr, J.; Affatigato, M.; Feller, S.A.; Howes, A.P.; Scales, C.R. Quantitative Measurement of Q3 Species in Silicate and Borosilicate Glasses Using Raman Spectroscopy. J. Non-Cryst. Solids 2008, 354, 1936–1942. [Google Scholar] [CrossRef]
- Konijnendijk, W.L.; Stevels, J.M. The Structure of Borosilicate Glasses Studied by Raman Scattering. J. Non-Cryst. Solids 1976, 20, 193–224. [Google Scholar] [CrossRef]
- Alessi, A.; Agnello, S.; Buscarino, G.; Gelardi, F.M. Structural Properties of Core and Surface of Silica Nanoparticles Investigated by Raman Spectroscopy. J. Raman Spectrosc. 2013, 44, 810–816. [Google Scholar] [CrossRef]
- McMillan, P. A Raman Spectroscopic Study of Glasses in the System CaO-MgO-SiO2. Am. Mineral. 1984, 69, 645–659. [Google Scholar]
- Sharma, S.K.; Mammone, J.F.; Nicol, M.F. Raman Investigation of Ring Configurations in Vitreous Silica. Nature 1981, 292, 140–141. [Google Scholar] [CrossRef]
- McMillan, P. Structural Studies of Silicate Glasses and Melts-Applications and Limitations of Raman Spectroscopy. Am. Mineral. 1984, 69, 622–644. [Google Scholar]
- McMillan, J.A. Magnetic Properties and Crystalline Structure of AgO. J. Inorg. Nucl. Chem. 1960, 13, 28–31. [Google Scholar] [CrossRef]
- McMillan, J.A. Higher Oxidation States of Silver. Chem. Rev. 1962, 62, 65–80. [Google Scholar] [CrossRef]
- Bosworth, Y.M.; Clark, R.J.H. Intensity Studies on the Raman-Active Fundamentals of Some Square-Planar (MX4n-) Ions and of the Dichloroiodate(1-) Ion. Calculation of Parallel and Perpendicular Bond Polarizability Derivatives and Bond Anisotropies. Inorg. Chem. 1975, 14, 170–177. [Google Scholar] [CrossRef]
- Waterhouse, G.I.; Bowmaker, G.A.; Metson, J.B. The Thermal Decomposition of Silver ( I, III ) Oxide: A Combined XRD, FT-IR and Raman Spectroscopic Study. Phys. Chem. Chem. Phys. 2001, 3, 3838–3845. [Google Scholar] [CrossRef]
- Slager, T.L.; Lindgren, B.J.; Mallmann, A.J.; Greenler, R.G. Infrared Spectra of the Oxides and Carbonates of Silver. J. Phys. Chem. 1972, 76, 940–943. [Google Scholar] [CrossRef]
- Morimoto, T.; Aoki, K. Effect of Adsorbed Water on the Reaction of Silver(I) Oxide with Carbon Dioxide. Langmuir 1986, 2, 525–528. [Google Scholar] [CrossRef]
- Martina, I.; Wiesinger, R.; Jembrih-Simbürger, D.; Schreiner, M. Micro-Raman Characterisation of Silver Corrosion Products: Instrumental Set Up and Reference Database. E-Preserv. Sci. 2012, 9, 1–8. [Google Scholar]
- Allen, J.A.; Scaife, P.H. Infrared Spectra in the Ag2O-CO2-Ag2CO3 System. Aust. J. Chem. 1966, 19, 715–724. [Google Scholar] [CrossRef]
- Shinoda, K.; Hato, M.; Hayashi, T. Physicochemical Properties of Aqueous Solutions of Fluorinated Surfactants. J. Phys. Chem. 1972, 76, 909–914. [Google Scholar] [CrossRef]
- Naumkin, V.; Kraut-Vass, A.; Gaarenstroom, S.W.; Powell, C.P. NIST X-Ray Photoelectron Spectroscopy Database; National Institute of Standards and Technology: Gaithersburg, MA, USA, 2000. [Google Scholar]
- Mennig, M.; Schmitt, M.; Schmidt, H. Synthesis of Ag-Colloids in Sol-Gel Derived SiO2-Coatings on Glass. J. Sol-Gel. Sci. Technol. 1997, 8, 1035–1042. [Google Scholar] [CrossRef]
- Slavin, Y.N.; Asnis, J.; Häfeli, U.O.; Bach, H. Metal Nanoparticles: Understanding the Mechanisms behind Antibacterial Activity. J. Nanobiotechnology 2017, 15, 65. [Google Scholar] [CrossRef]
- Khan, I.; Saeed, K.; Khan, I. Nanoparticles: Properties, Applications and Toxicities. Arab. J. Chem. 2019, 12, 908–931. [Google Scholar] [CrossRef]
- Linklater, D.P.; Baulin, V.A.; Le Guével, X.; Fleury, J.-B.; Hanssen, E.; Nguyen, T.H.P.; Juodkazis, S.; Bryant, G.; Crawford, R.J.; Stoodley, P.; et al. Antibacterial Action of Nanoparticles by Lethal Stretching of Bacterial Cell Membranes. Adv. Mater. 2020, 32, e2005679. [Google Scholar] [CrossRef] [PubMed]
- Sajid, M.; Ilyas, M.; Basheer, C.; Tariq, M.; Daud, M.; Baig, N.; Shehzad, F. Impact of Nanoparticles on Human and Environment: Review of Toxicity Factors, Exposures, Control Strategies, and Future Prospects. Environ. Sci. Pollut. Res. 2015, 22, 4122–4143. [Google Scholar] [CrossRef]
- Ahmed, B.; Solanki, B.; Zaidi, A.; Khan, M.S.; Musarrat, J. Bacterial Toxicity of Biomimetic Green Zinc Oxide Nanoantibiotic: Insights into ZnONP Uptake and Nanocolloid–Bacteria Interface. Toxicol. Res. 2019, 8, 246–261. [Google Scholar] [CrossRef] [PubMed]
- Handy, R.D.; von der Kammer, F.; Lead, J.R.; Hassellöv, M.; Owen, R.; Crane, M. The Ecotoxicology and Chemistry of Manufactured Nanoparticles. Ecotoxicology 2008, 17, 287–314. [Google Scholar] [CrossRef] [PubMed]
- Ha, M.K.; Shim, Y.J.; Yoon, T.H. Effects of Agglomeration on in Vitro Dosimetry and Cellular Association of Silver Nanoparticles. Environ. Sci. Nano 2018, 5, 446–455. [Google Scholar] [CrossRef]
- Raza, M.A.; Kanwal, Z.; Rauf, A.; Sabri, A.N.; Riaz, S.; Naseem, S. Size- and Shape-Dependent Antibacterial Studies of Silver Nanoparticles Synthesized by Wet Chemical Routes. Nanomaterials 2016, 6, 74. [Google Scholar] [CrossRef]
- Acharya, D.; Singha, K.M.; Pandey, P.; Mohanta, B.; Rajkumari, J.; Singha, L.P. Shape Dependent Physical Mutilation and Lethal Effects of Silver Nanoparticles on Bacteria. Sci. Rep. 2018, 8, 201. [Google Scholar] [CrossRef]
- Acharya, D.; Mohanta, B.; Pandey, P.; Nasiri, F. Antibacterial Properties of Synthesized Ag and Ag@SiO2 Core–Shell Nanoparticles: A Comparative Study. Can. J. Phys. 2018, 96, 955–960. [Google Scholar] [CrossRef]
- Gankhuyag, S.; Bae, D.S.; Lee, K.; Lee, S. One-Pot Synthesis of SiO2@Ag Mesoporous Nanoparticle Coating for Inhibition of Escherichia Coli Bacteria on Various Surfaces. Nanomaterials 2021, 11, 549. [Google Scholar] [CrossRef]
- Pal, S.; Nisi, R.; Licciulli, A. Antibacterial Activity of In Situ Generated Silver Nanoparticles in Hybrid Silica Films. Photochem 2022, 2, 479–488. [Google Scholar] [CrossRef]
- Montalvo-Quirós, S.; Gómez-Graña, S.; Vallet-Regí, M.; Prados-Rosales, R.C.; González, B.; Luque-Garcia, J.L. Mesoporous Silica Nanoparticles Containing Silver as Novel Antimycobacterial Agents against Mycobacterium Tuberculosis. Colloids Surf. B Biointerfaces 2021, 197, 111405. [Google Scholar] [CrossRef]
- Malekzadeh, M.; Yeung, K.L.; Halali, M.; Chang, Q. Preparation and Antibacterial Behaviour of Nanostructured Ag@SiO2–Penicillin with Silver Nanoplates. New J. Chem. 2019, 43, 16612–16620. [Google Scholar] [CrossRef]
- Ahmed, F.; AlOmar, S.Y.; Albalawi, F.; Arshi, N.; Dwivedi, S.; Kumar, S.; Shaalan, N.M.; Ahmad, N. Microwave Mediated Fast Synthesis of Silver Nanoparticles and Investigation of Their Antibacterial Activities for Gram-Positive and Gram-Negative Microorganisms. Crystals 2021, 11, 666. [Google Scholar] [CrossRef]
- Canaparo, R.; Foglietta, F.; Limongi, T.; Serpe, L. Biomedical Applications of Reactive Oxygen Species Generation by Metal Nanoparticles. Materials 2020, 14, 53. [Google Scholar] [CrossRef]
- Manke, A.; Wang, L.; Rojanasakul, Y. Mechanisms of Nanoparticle-Induced Oxidative Stress and Toxicity. BioMed Res. Int. 2013, 2013, 942916. [Google Scholar] [CrossRef]
- Raghunath, A.; Perumal, E. Metal Oxide Nanoparticles as Antimicrobial Agents: A Promise for the Future. Int. J. Antimicrob. Agents 2017, 49, 137–152. [Google Scholar] [CrossRef]
- Liao, S.; Zhang, Y.; Pan, X.; Zhu, F.; Jiang, C.; Liu, Q.; Cheng, Z.; Dai, G.; Wu, G.; Wang, L.; et al. Antibacterial Activity and Mechanism of Silver Nanoparticles against Multidrug-Resistant Pseudomonas Aeruginosa. Int. J. Nanomed. 2019, 14, 1469–1487. [Google Scholar] [CrossRef] [PubMed]
- Howard, D.; Sebastian, S.; Le, Q.V.-C.; Thierry, B.; Kempson, I. Chemical Mechanisms of Nanoparticle Radiosensitization and Radioprotection: A Review of Structure-Function Relationships Influencing Reactive Oxygen Species. Int. J. Mol. Sci. 2020, 21, 579. [Google Scholar] [CrossRef]
- Yuan, Y.-G.; Peng, Q.-L.; Gurunathan, S. Effects of Silver Nanoparticles on Multiple Drug-Resistant Strains of Staphylococcus Aureus and Pseudomonas Aeruginosa from Mastitis-Infected Goats: An Alternative Approach for Antimicrobial Therapy. Int. J. Mol. Sci. 2017, 18, 569. [Google Scholar] [CrossRef]
- Jain, N.; Bhargava, A.; Rathi, M.; Dilip, R.V.; Panwar, J. Removal of Protein Capping Enhances the Antibacterial Efficiency of Biosynthesized Silver Nanoparticles. PLoS ONE 2015, 10, e0134337. [Google Scholar] [CrossRef] [PubMed]
- Borkowski, A.; Cłapa, T.; Szala, M.; Gąsiński, A.; Selwet, M. Synthesis of SiC/Ag/Cellulose Nanocomposite and Its Antibacterial Activity by Reactive Oxygen Species Generation. Nanomaterials 2016, 6, 171. [Google Scholar] [CrossRef]
- Wiegand, I.; Hilpert, K.; Hancock, R.E.W. Agar and Broth Dilution Methods to Determine the Minimal Inhibitory Concentration (MIC) of Antimicrobial Substances. Nat. Protoc. 2008, 3, 163–175. [Google Scholar] [CrossRef]
- Bagchi, B.; Kar, S.; Dey, S.K.; Bhandary, S.; Roy, D.; Mukhopadhyay, T.K.; Das, S.; Nandy, P. In Situ Synthesis and Antibacterial Activity of Copper Nanoparticle Loaded Natural Montmorillonite Clay Based on Contact Inhibition and Ion Release. Colloids Surf. B Biointerfaces 2013, 108, 358–365. [Google Scholar] [CrossRef]
- Sebaugh, J.L. Guidelines for Accurate EC50/IC50 Estimation. Pharmaceut. Statist. 2011, 10, 128–134. [Google Scholar] [CrossRef]
- Hegeman, G.D. Synthesis of the Enzymes of the Mandelate Pathway by Pseudomonas Putida I. Synthesis of Enzymes by the Wild Type. J. Bacteriol. 1966, 91, 1140–1154. [Google Scholar] [CrossRef] [PubMed]
- Zhang, C.; Bruins, M.E.; Yang, Z.-Q.; Liu, S.-T.; Rao, P.-F. A New Formula to Calculate Activity of Superoxide Dismutase in Indirect Assays. Anal. Biochem. 2016, 503, 65–67. [Google Scholar] [CrossRef] [PubMed]
- Bradford, M.M. A Rapid and Sensitive Method for the Quantitation of Microgram Quantities of Protein Utilizing the Principle of Protein-Dye Binding. Anal. Biochem. 1976, 72, 248–254. [Google Scholar] [CrossRef] [PubMed]


| P = 150 W | P = 700 W | |||
|---|---|---|---|---|
| t = 60 s | t = 150 s | t = 60 s | t = 150 s | |
| Ag-S1 | AR1.1 | AR1.2 | AR1.3 | AR1.4 |
| Ag-S2 | AR1.5 | AR1.6 | AR1.7 | AR1.8 |
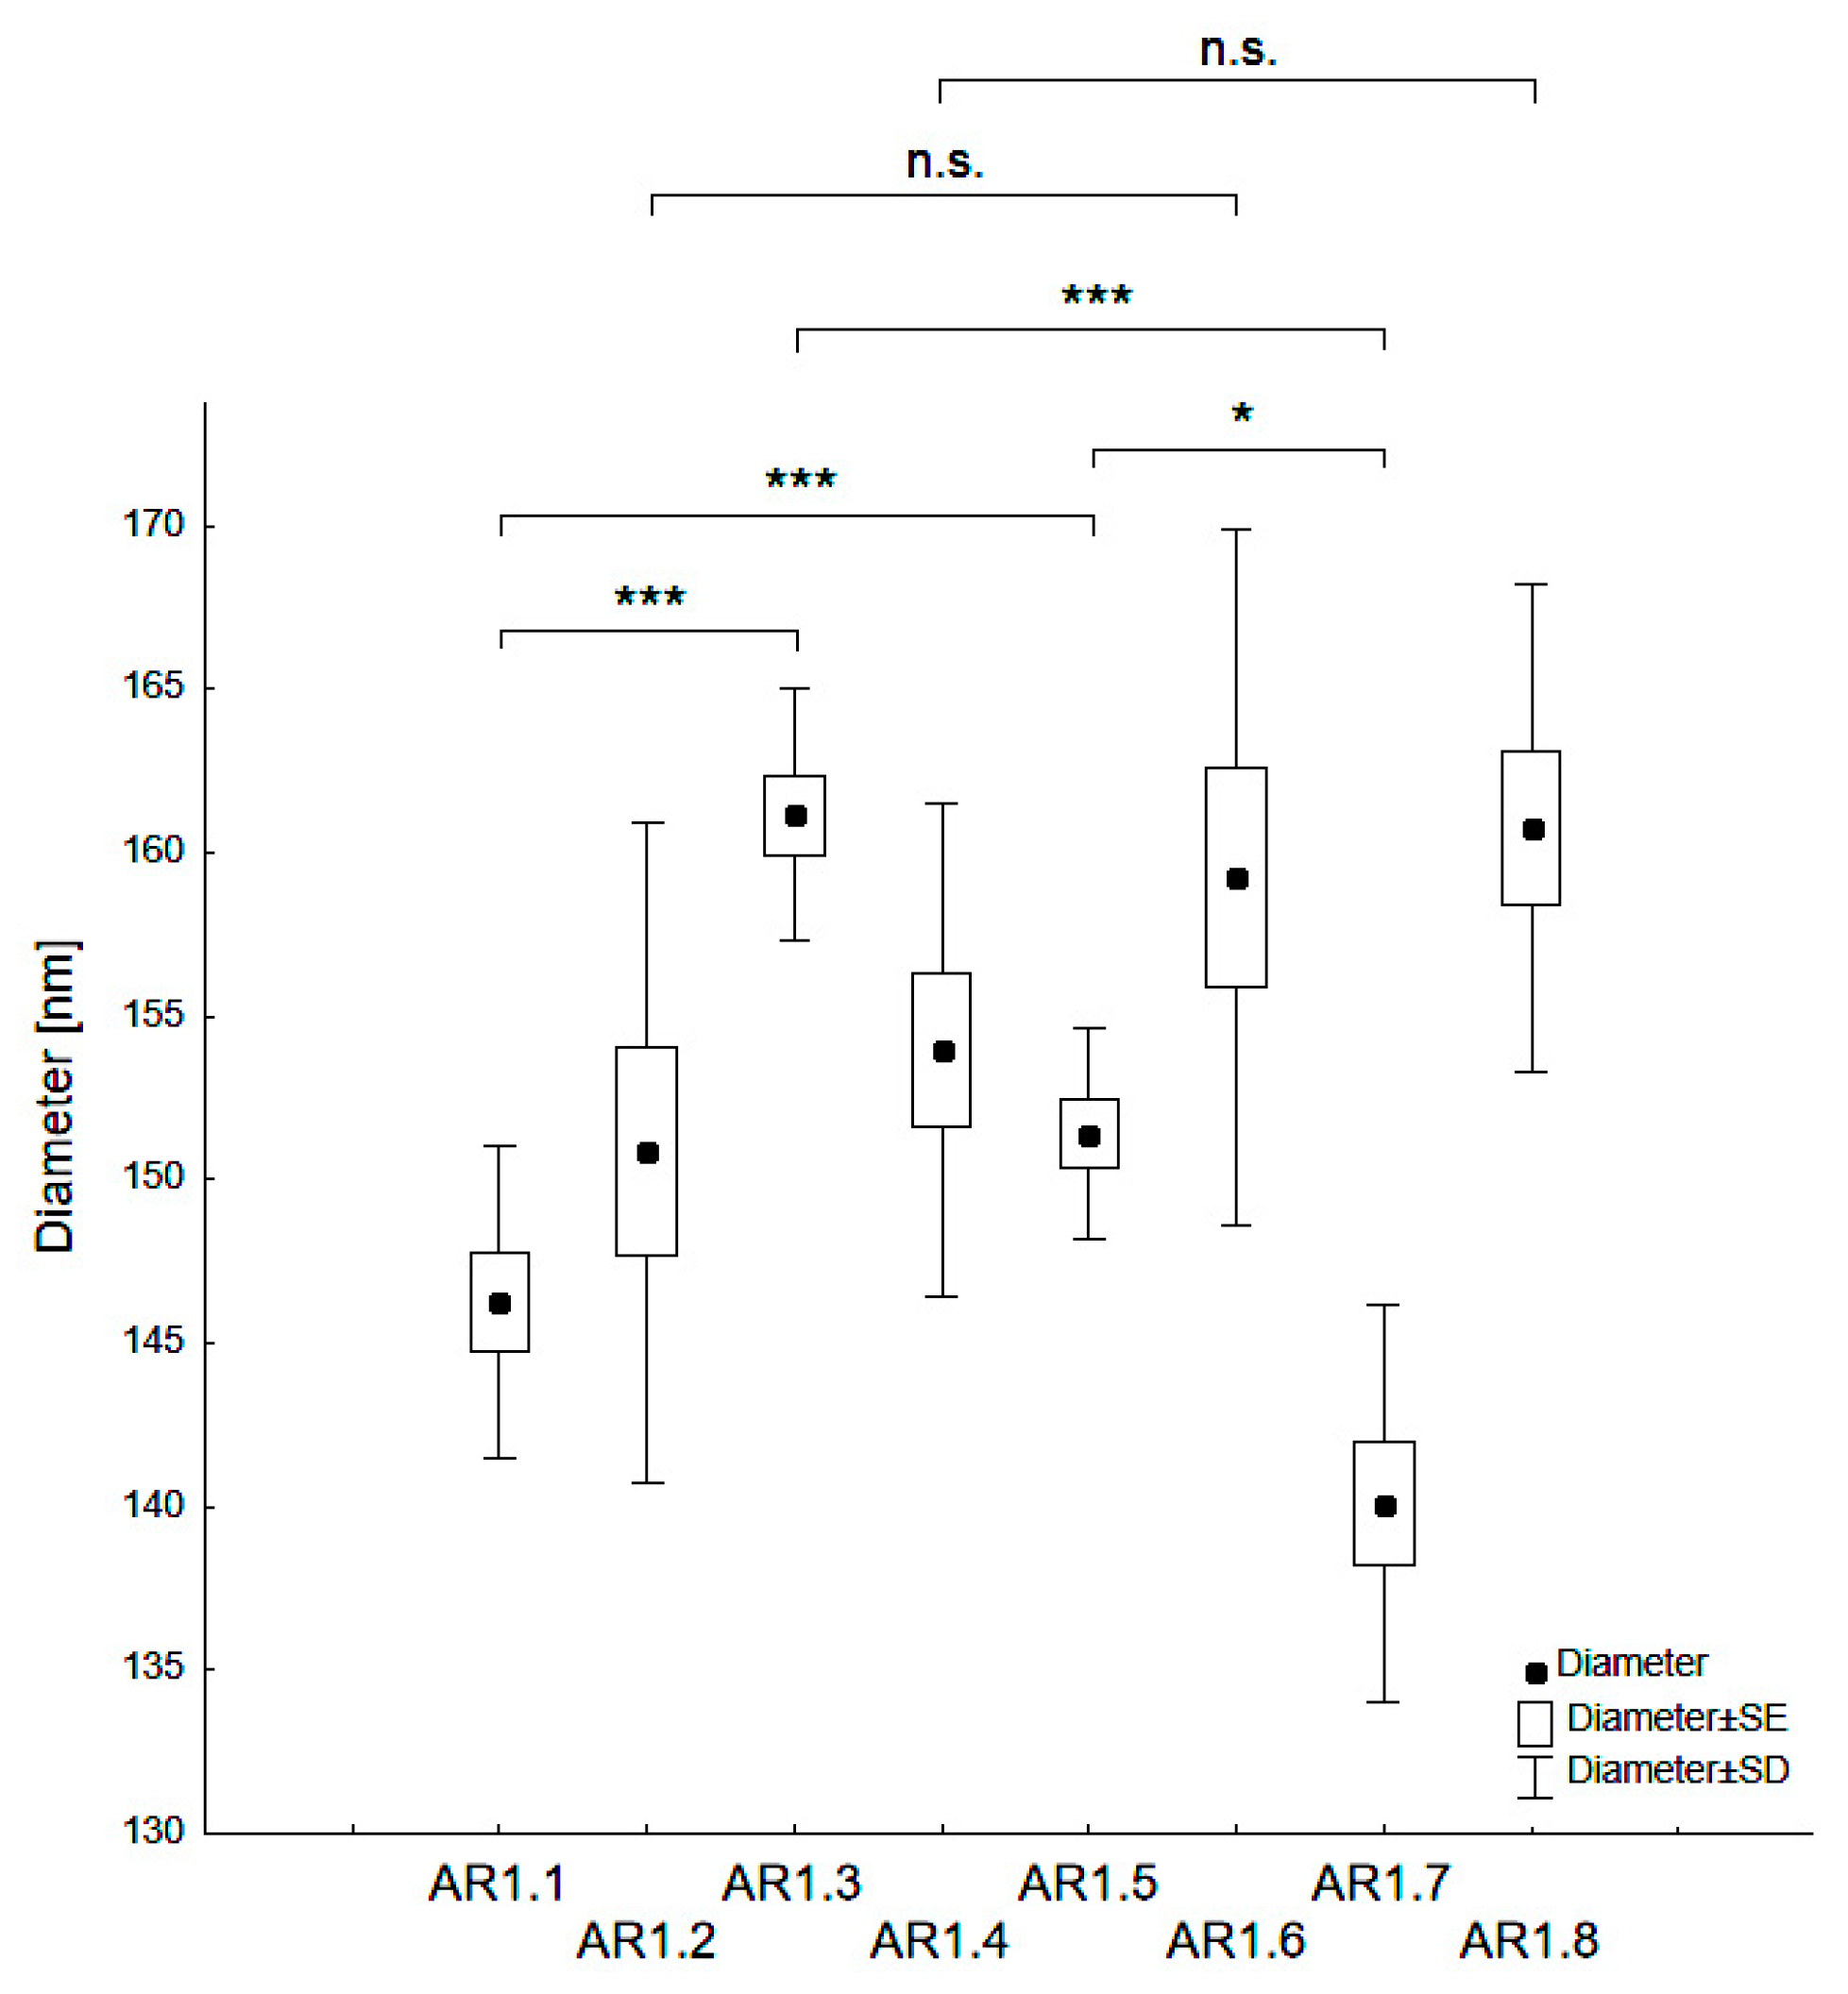
| Sample Code | dH (nm) | PDI (-) | z (mV) |
|---|---|---|---|
| AR1.1 | 146.3 ± 4.8 | 0.35 ± 0.02 | −39.9 ± 0.93 |
| AR1.2 | 150.9 ± 10.1 | 0.35 ± 0.03 | −37.6 ± 0.86 |
| AR1.3 | 161.2 ± 3.8 | 0.33 ± 0.03 | −37.5 ± 1.28 |
| AR1.4 | 154.0 ± 7.5 | 0.39 ± 0.02 | −38.6 ± 1.45 |
| AR1.5 | 151.4 ± 3.2 | 0.34 ± 0.03 | −38.5 ± 1.99 |
| AR1.6 | 159.2 ± 10.6 | 0.37 ± 0.06 | −37.2 ± 0.28 |
| AR1.7 | 140.1 ± 6.1 | 0.36 ± 0.03 | −37.0 ± 1.79 |
| AR1.8 | 160.8 ± 7.5 | 0.36 ± 0.05 | −38.8 ± 0.65 |
| Sample Code | SSABET (m2/g) | Vp (ml/g) * | SP (m2/g) ** | Dpore (nm) | TPV (cm3/g) | Porosity (%) |
|---|---|---|---|---|---|---|
| AR1.1 | 106.45 ± 0.36 | 0.00326 | 9.60 | 47.02 | 1.2514 | 75.02 |
| AR1.2 | 109.66 ± 0.56 | 0.00622 | 15.69 | 35.78 | 0.9808 | 70.19 |
| AR1.3 | 100.70 ± 0.43 | 0.00459 | 11.97 | 43.56 | 1.1713 | 73.76 |
| AR1.4 | 106.41 ± 0.55 | 0.00594 | 15.03 | 32.37 | 0.8612 | 67.39 |
| AR1.5 | 96.04 ± 0.51 | 0.00561 | 14.16 | 51.17 | 1.2288 | 74.68 |
| AR1.6 | 112.90 ± 0.56 | 0.00613 | 15.61 | 34.99 | 0.9878 | 70.33 |
| AR1.7 | 100.33 ± 0.57 | 0.00465 | 12.50 | 46.69 | 1.0967 | 72.47 |
| AR1.8 | 108.04 ± 0.57 | 0.00607 | 15.32 | 35.76 | 0.9659 | 69.86 |
| Sample Code | SEM-EDS | TEM-EDS | ||||
|---|---|---|---|---|---|---|
| O (at.%) | Si (at.%) | Ag (at.%) | O (at.%) | Si (at.%) | Ag (at.%) | |
| AR1.1 | 75.0 (4.6) | 21.8 (5.0) | 3.2 (1.2) | 77.2 (13.1) | 12.9 (2.9) | 9.9 (1.5) |
| AR1.2 | 77.5 (3.2) | 20.2 (3.0) | 2.4 (1.5) | 85.1 (4.6) | 14.1 (4.5) | 0.8 (0.5) |
| AR1.3 | 73.9 (4.5) | 23.0 (5.2) | 3.1 (0.9) | 78.0 (4.9) | 19.8 (3.7) | 2.2 (1.3) |
| AR1.4 | 76.2 (1.0) | 20.0 (1.4) | 3.8 (0.6) | 78.4 (1.0) | 21.1 (0.8) | 0.5 (0.2) |
| AR1.5 | 78.7 (0.7) | 18.9 (1.2) | 2.4 (0.6) | 75.9 (8.7) | 15.2 (1.6) | 8.9 (3.9) |
| AR1.6 | 76.7 (1.8) | 20.9 (1.4) | 2.5 (0.4) | 83.3 (1.9) | 16.0 (1.8) | 0.6 (0.2) |
| AR1.7 | 74.3 (1.5) | 24.7 (1.1) | 0.9 (0.6) | 82.8 (2.4) | 16.8 (2.0) | 0.4 (0.2) |
| AR1.8 | 74.2 (1.2) | 23.0 (1.8) | 2.8 (1.0) | 83.9 (2.8) | 16.0 (2.8) | 0.1 (0.1) |
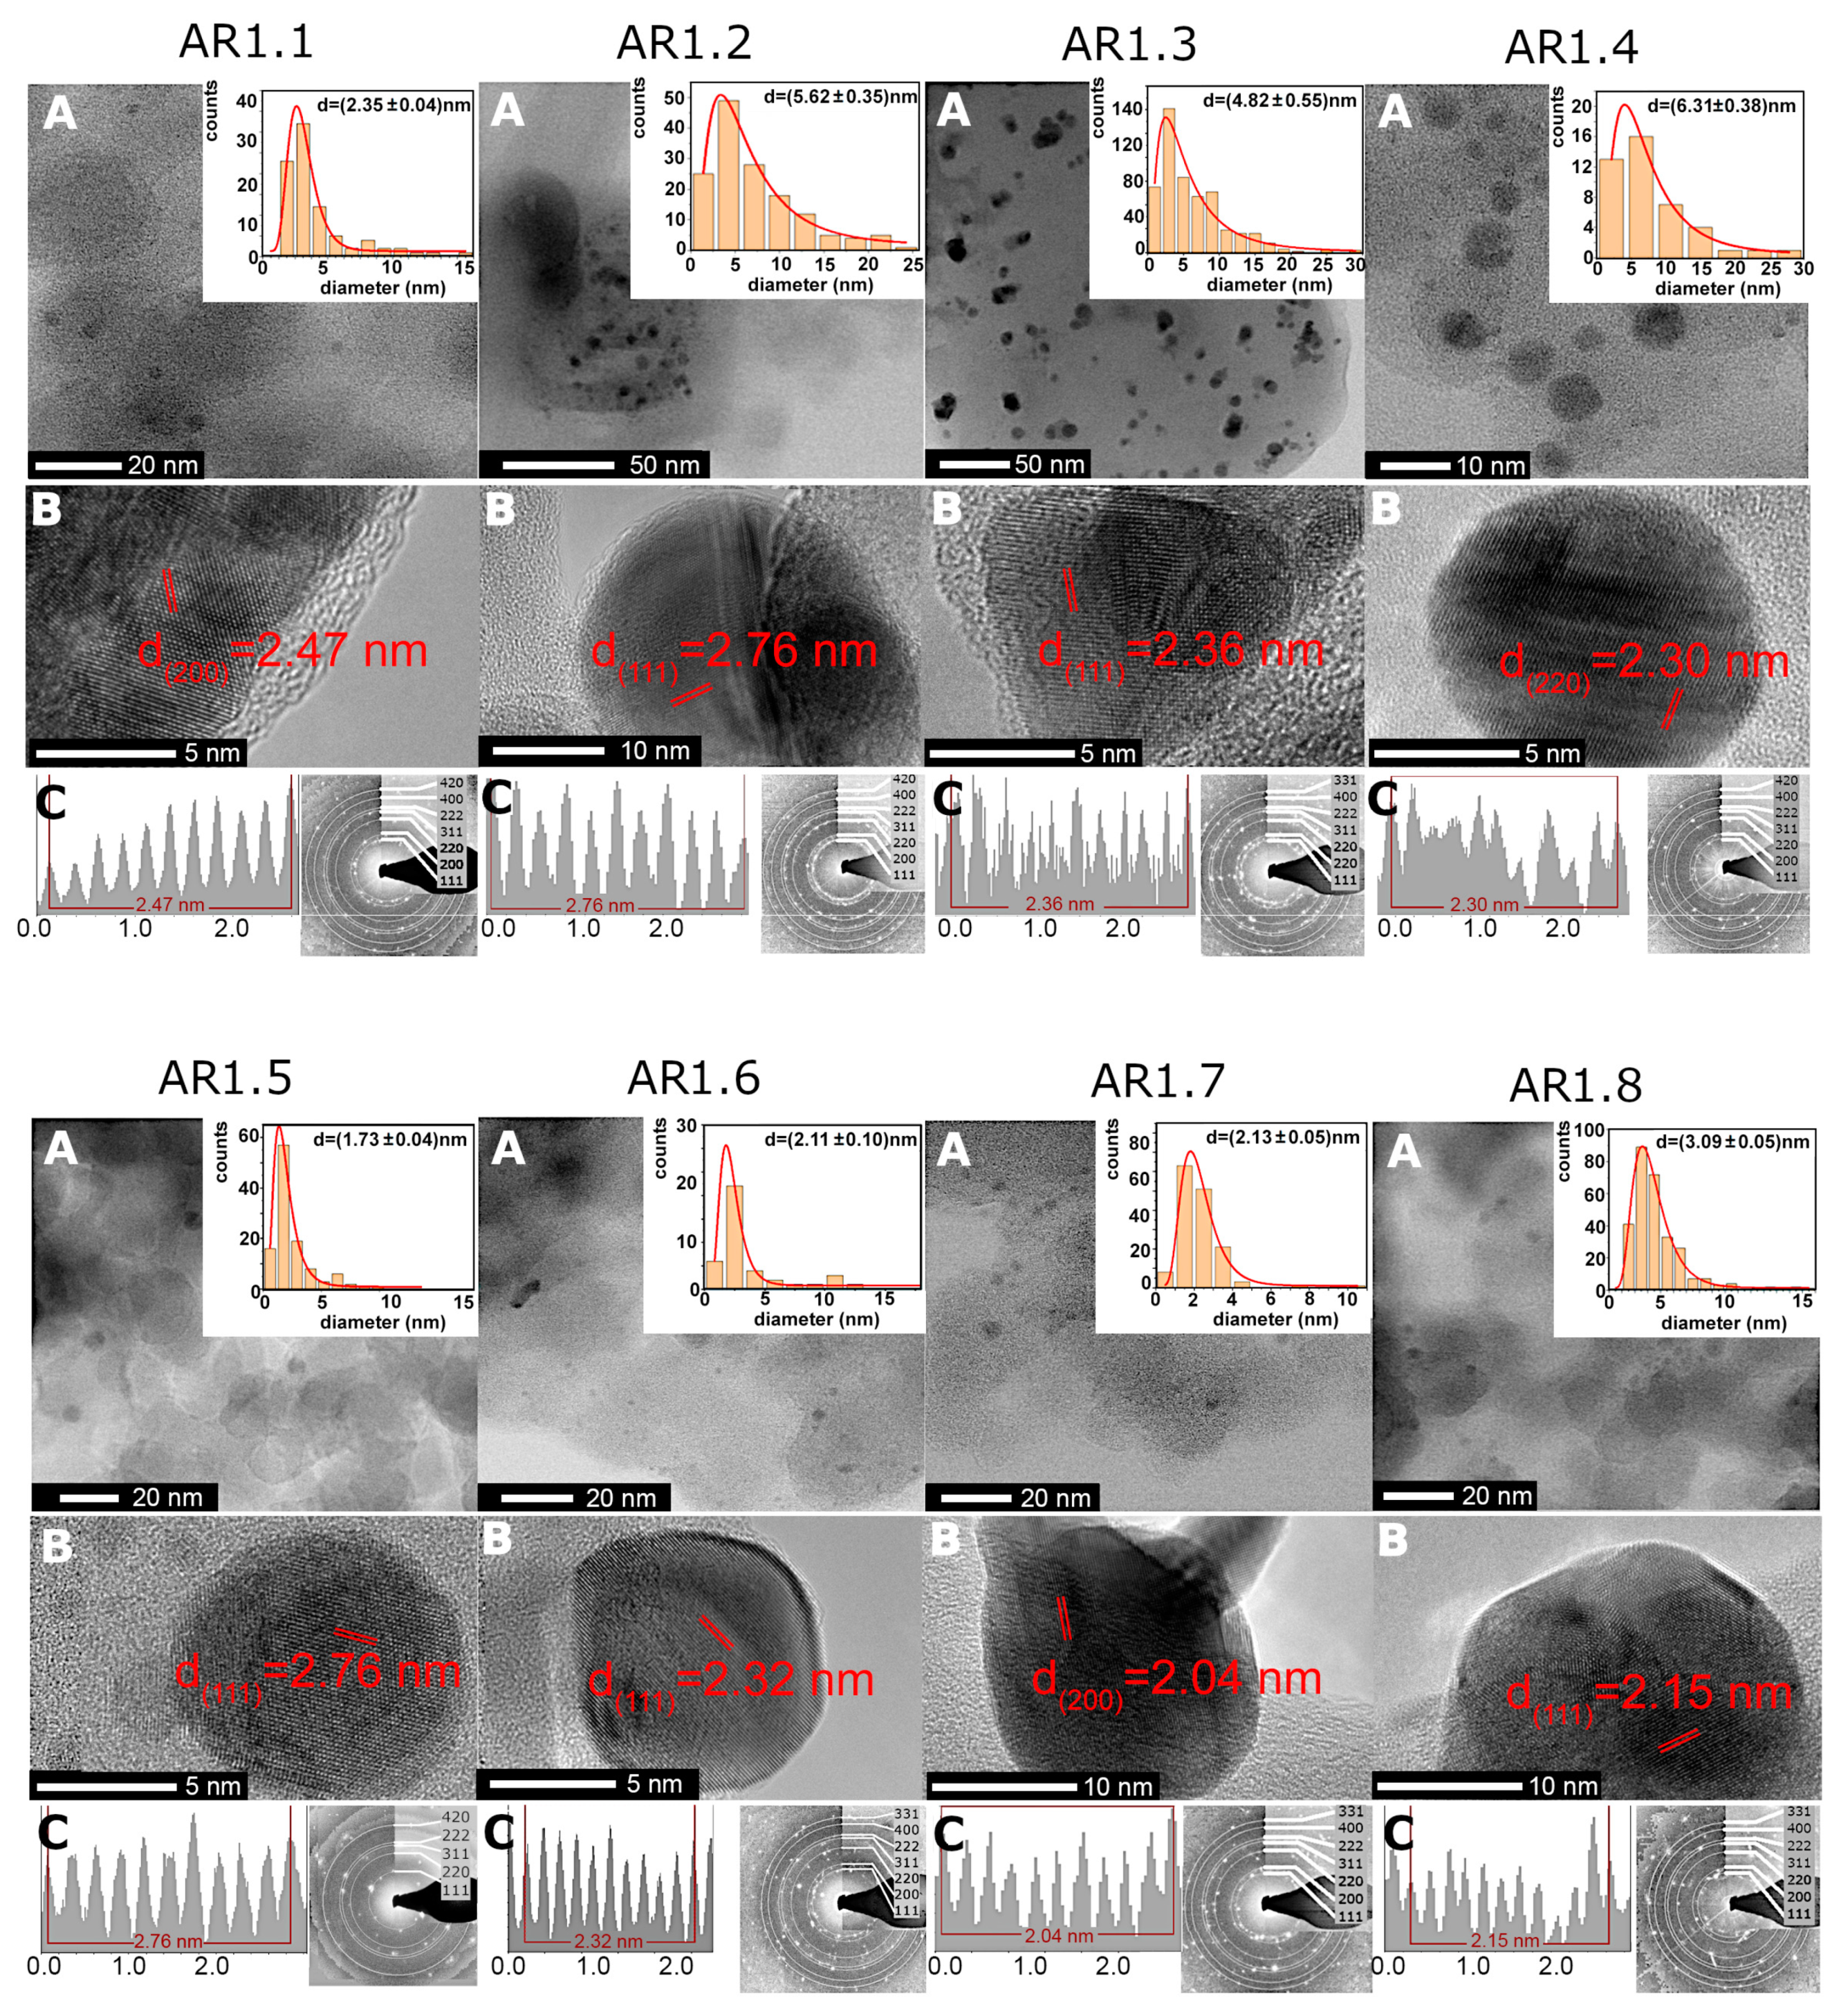
| Sample Code | Ag NP Diameter (nm) | % Spherical NPs |
|---|---|---|
| AR1.1 | 2.35 ± 0.04 | 100% |
| AR1.2 | 5.61 ± 0.35 | 96% |
| AR1.3 | 4.82 ± 0.55 | 46% |
| AR1.4 | 6.31 ± 0.38 | 67% |
| AR1.5 | 1.73 ± 0.04 | 100% |
| AR1.6 | 2.10 ± 0.10 | 98% |
| AR1.7 | 2.13 ± 0.05 | 59% |
| AR1.8 | 3.09 ± 0.05 | 65% |
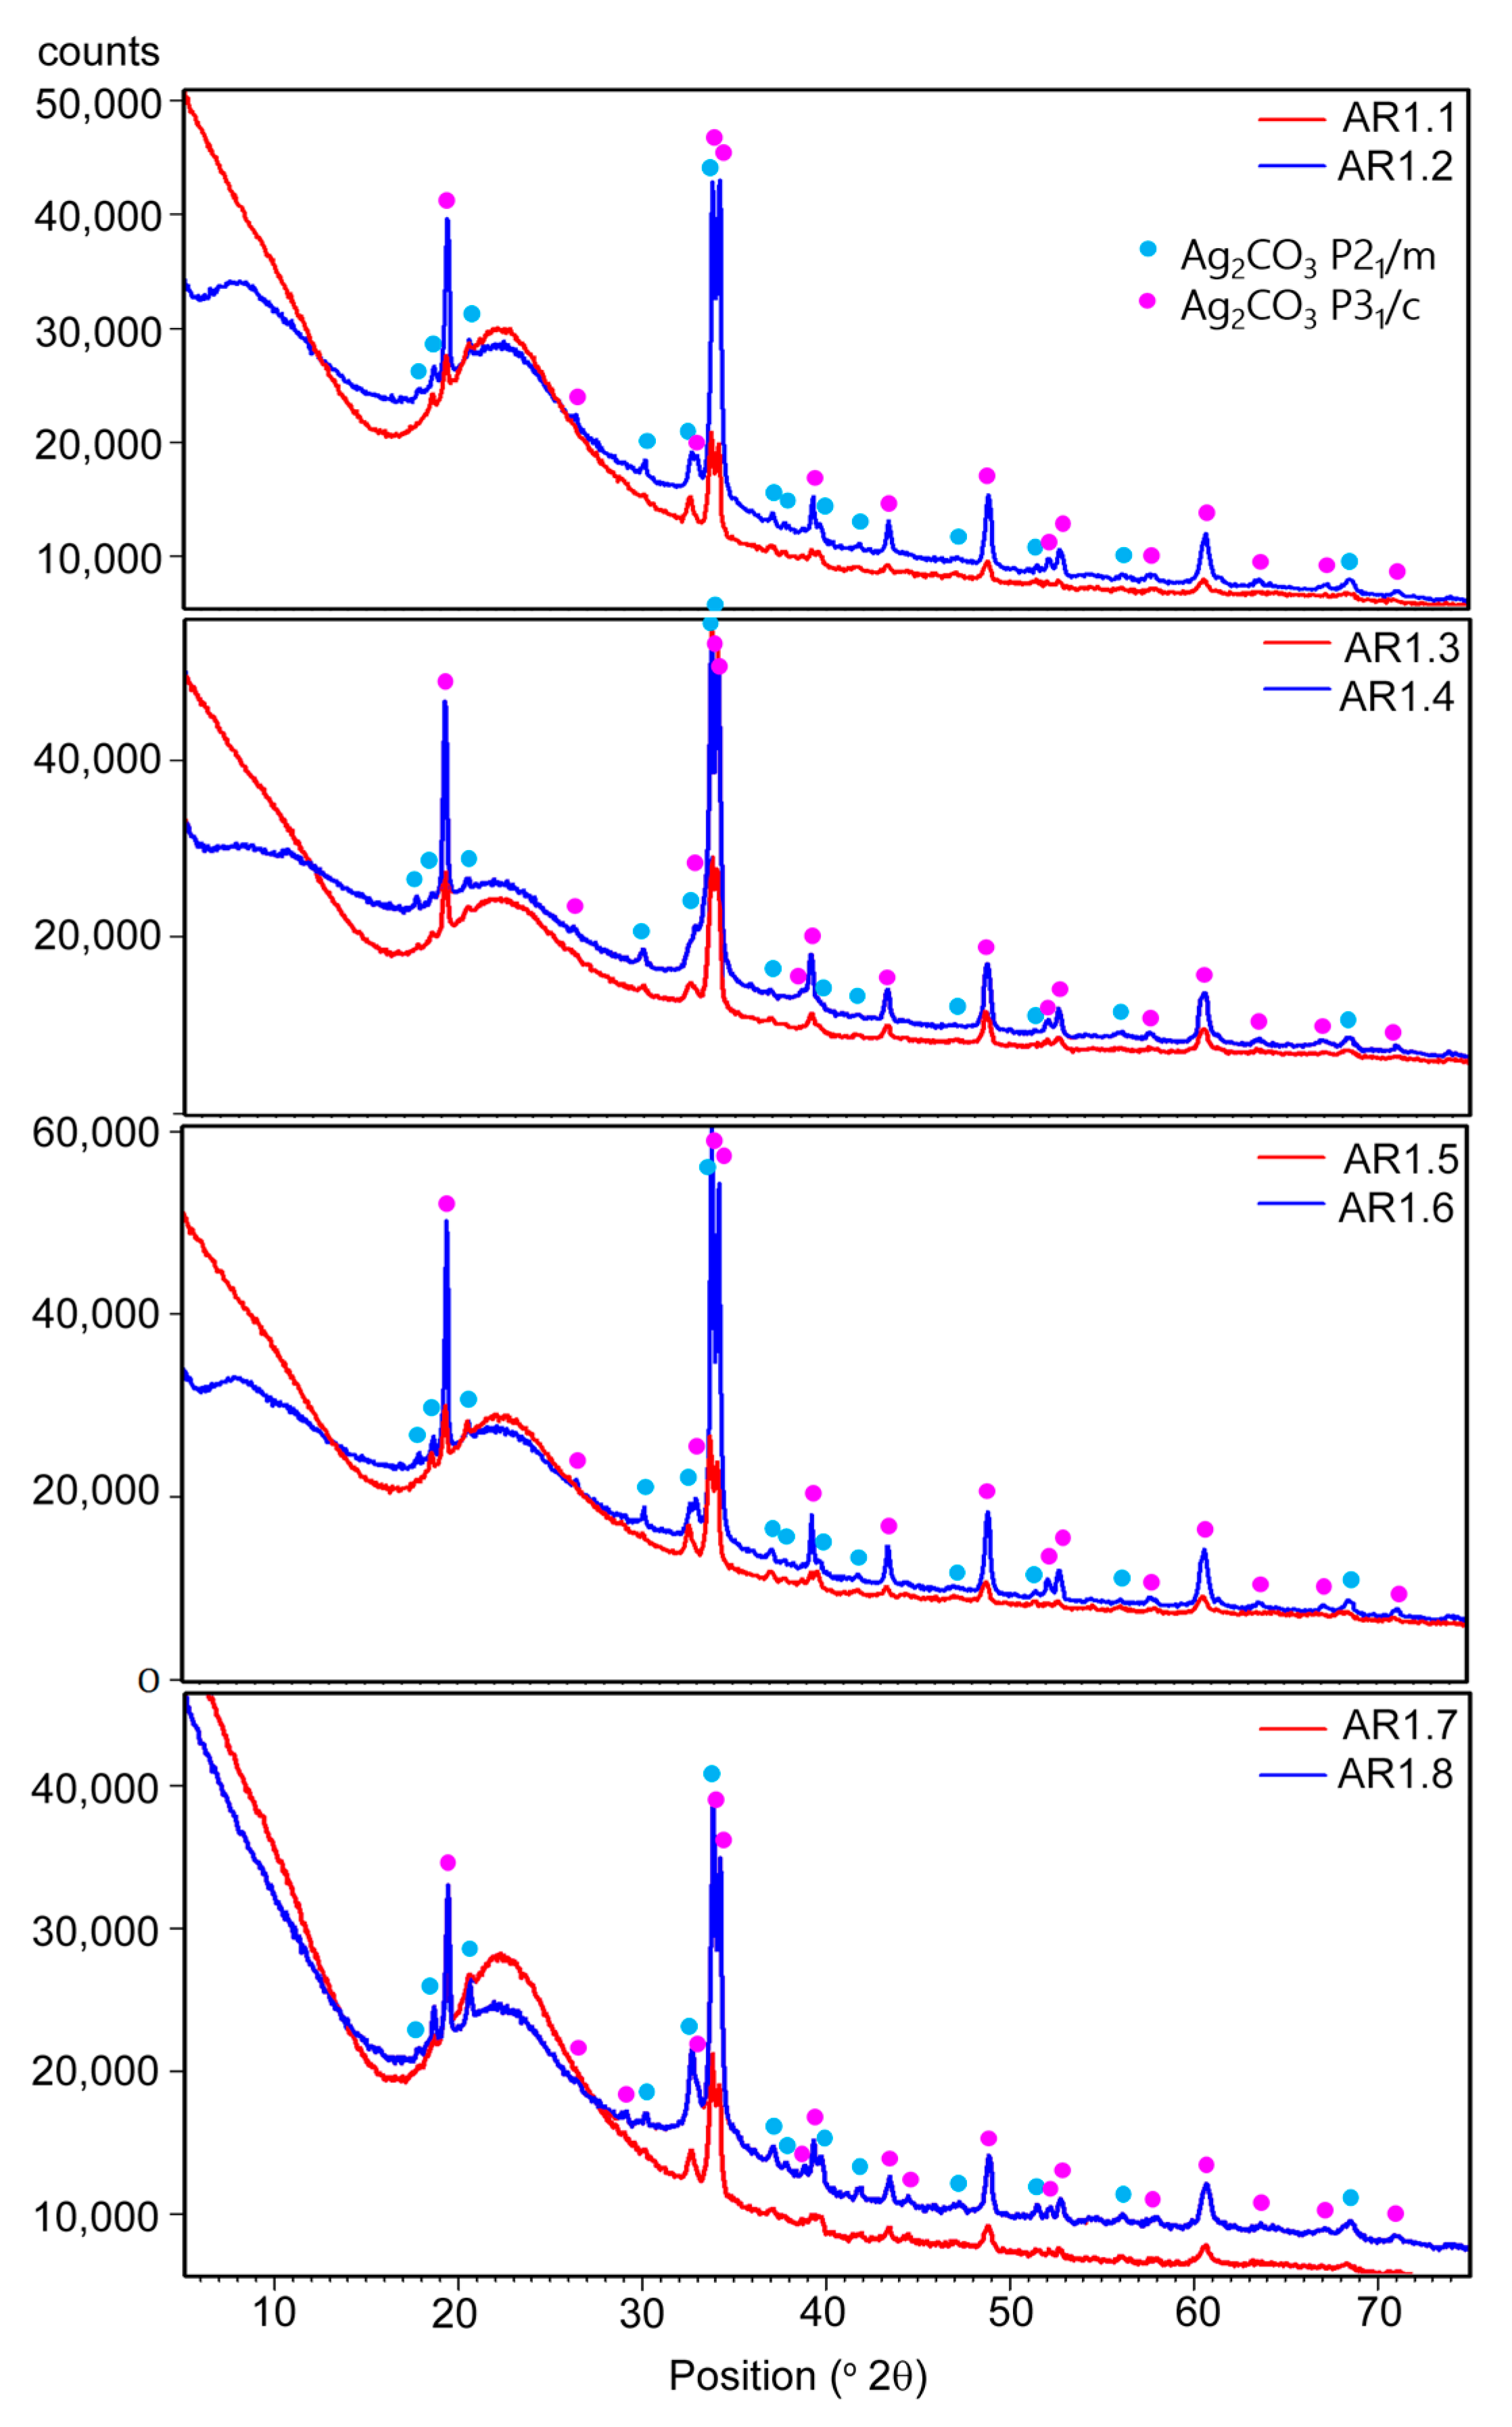
| Phase (Space Group) | Ag2CO3 (P21) | Ag2CO3 (P31c) | ||||
|---|---|---|---|---|---|---|
| Lattice Parameters | a0 (Å) | b0 (Å) | c0 (Å) | β (°) | a0 (Å) | c0 (Å) |
| AR1.1 | 3.255(7) | 9.547(7) | 4.855(1) | 92.20(2) | 9.189(8) | 6.405(4) |
| AR1.2 | 3.258(4) | 9.561(5) | 4.8656(3) | 92.20(7) | 9.201(2) | 6.411(7) |
| AR1.3 | 3.251(7) | 9.609(1) | 4.876(9) | 91.98(2) | 9.198(8) | 6.405(1) |
| AR1.4 | 3.263(6) | 9.557(8) | 4.866(1) | 92.22(2) | 9.204(1) | 6.421(4) |
| AR1.5 | 3.255(9) | 9.545(9) | 4.863(6) | 92.25(1) | 9.194(7) | 6.404(9) |
| AR1.6 | 3.258(9) | 9.559(1) | 4.861(1) | 92.13(6) | 9.200(1) | 6.413(3) |
| AR1.7 | 3.255(9) | 9.558(4) | 4.864(1) | 92.15(2) | 9.198(4) | 6.406(8) |
| AR1.8 | 3.260(1) | 9.560(9) | 4.865(9) | 92.13(1) | 9.204(5) | 6.414(2) |
| (at.%) | ||||
|---|---|---|---|---|
| Sample Code | C 1s | O 1s | Si 2p | Ag 3d |
| AR 1.1 | 5.31 | 63.99 | 30.42 | 0.28 |
| AR 1.2 | 3.55 | 64.28 | 32.07 | 0.10 |
| AR 1.3 | 2.49 | 64.15 | 32.67 | 0.69 |
| AR 1.4 | 2.41 | 65.35 | 32.03 | 0.20 |
| AR 1.5 | 2.97 | 64.79 | 31.92 | 0.32 |
| AR 1.6 | 4.60 | 62.79 | 32.44 | 0.17 |
| AR 1.7 | 3.42 | 64.58 | 31.49 | 0.51 |
| AR 1.8 | 2.58 | 64.32 | 33.00 | 0.10 |
| MBC (mg L−1) | IC50 (mg L−1) | |
|---|---|---|
| AR1.1 | 25/10/25 | 5.35/1.83/7.21 |
| AR1.2 | 5/10/10 | 2.11/5.43/5.95 |
| AR1.3 | 25/5/25 | 1.28/1.22/7.97 |
| AR1.4 | 7.5/1.5/10 | 5.32/6.11/2 |
| AR1.5 | 25/10/25 | 13.30/5.54/10.69 |
| AR1.6 | 2.5/10/7.5 | 0.31/0.67/1.69 |
| AR1.7 | 25/10/10 | 12.66/3.75/4.87 |
| AR1.8 | 5/10/7.5 | 1.18/7.79/0.41 |
Disclaimer/Publisher’s Note: The statements, opinions and data contained in all publications are solely those of the individual author(s) and contributor(s) and not of MDPI and/or the editor(s). MDPI and/or the editor(s) disclaim responsibility for any injury to people or property resulting from any ideas, methods, instructions or products referred to in the content. |
© 2023 by the authors. Licensee MDPI, Basel, Switzerland. This article is an open access article distributed under the terms and conditions of the Creative Commons Attribution (CC BY) license (https://creativecommons.org/licenses/by/4.0/).
Share and Cite
Strach, A.; Dulski, M.; Wasilkowski, D.; Metryka, O.; Nowak, A.; Matus, K.; Dudek, K.; Rawicka, P.; Kubacki, J.; Waloszczyk, N.; et al. Microwave Irradiation vs. Structural, Physicochemical, and Biological Features of Porous Environmentally Active Silver–Silica Nanocomposites. Int. J. Mol. Sci. 2023, 24, 6632. https://doi.org/10.3390/ijms24076632
Strach A, Dulski M, Wasilkowski D, Metryka O, Nowak A, Matus K, Dudek K, Rawicka P, Kubacki J, Waloszczyk N, et al. Microwave Irradiation vs. Structural, Physicochemical, and Biological Features of Porous Environmentally Active Silver–Silica Nanocomposites. International Journal of Molecular Sciences. 2023; 24(7):6632. https://doi.org/10.3390/ijms24076632
Chicago/Turabian StyleStrach, Aleksandra, Mateusz Dulski, Daniel Wasilkowski, Oliwia Metryka, Anna Nowak, Krzysztof Matus, Karolina Dudek, Patrycja Rawicka, Jerzy Kubacki, Natalia Waloszczyk, and et al. 2023. "Microwave Irradiation vs. Structural, Physicochemical, and Biological Features of Porous Environmentally Active Silver–Silica Nanocomposites" International Journal of Molecular Sciences 24, no. 7: 6632. https://doi.org/10.3390/ijms24076632
APA StyleStrach, A., Dulski, M., Wasilkowski, D., Metryka, O., Nowak, A., Matus, K., Dudek, K., Rawicka, P., Kubacki, J., Waloszczyk, N., Mrozik, A., & Golba, S. (2023). Microwave Irradiation vs. Structural, Physicochemical, and Biological Features of Porous Environmentally Active Silver–Silica Nanocomposites. International Journal of Molecular Sciences, 24(7), 6632. https://doi.org/10.3390/ijms24076632