Article

Cadmium Disrupted ER Ca2+ Homeostasis by Inhibiting SERCA2 Expression and Activity to Induce Apoptosis in Renal Proximal Tubular Cells

1
School of Life Sciences, Jiangsu University, Zhenjiang 212013, China
2
Department of Biology, Hong Kong Baptist University, Hong Kong SAR, China
*
Author to whom correspondence should be addressed.
These authors contributed equally to this work.
Int. J. Mol. Sci. 2023, 24(6), 5979; https://doi.org/10.3390/ijms24065979
Submission received: 2 March 2023 / Revised: 16 March 2023 / Accepted: 20 March 2023 / Published: 22 March 2023
(This article belongs to the Special Issue Stress Signaling and Programmed Cell Death)

Abstract

:
Cadmium (Cd2+) exposure induces chronic kidney disease and renal cancers, which originate from injury and cancerization of renal tubular cells. Previous studies have shown that Cd2+ induced cytotoxicity by disrupting the intracellular Ca2+ homeostasis that is physically regulated by the endoplasmic reticulum (ER) Ca2+ store. However, the molecular mechanism of ER Ca2+ homeostasis in Cd2+-induced nephrotoxicity remains unclear. In this study, our results firstly revealed that the activation of calcium-sensing receptor (CaSR) by NPS R-467 could protect against Cd2+ exposure-induced cytotoxicity of mouse renal tubular cells (mRTEC) by restoring ER Ca2+ homeostasis through the ER Ca2+ reuptake channel sarco/endoplasmic reticulum Ca2+-ATPase (SERCA). Cd2+-induced ER stress and cell apoptosis were effectively abrogated by SERCA agonist CDN1163 and SERCA2 overexpression. In addition, in vivo, and in vitro results proved that Cd2+ reduced the expressions of SERCA2 and its activity regulator phosphorylation phospholamban (p-PLB) in renal tubular cells. Cd2+-induced SERCA2 degradation was suppressed by the treatment of proteasome inhibitor MG132, which suggested that Cd2+ reduced SERCA2 protein stability by promoting the proteasomal protein degradation pathway. These results suggested that SERCA2 played pivotal roles in Cd2+-induced ER Ca2+ imbalance and stress to contribute to apoptosis of renal tubular cells, and the proteasomal pathway was involved in regulating SERCA2 stability. Our results proposed a new therapeutic approach targeting SERCA2 and associated proteasome that might protect against Cd2+-induced cytotoxicity and renal injury.

Graphical Abstract

1. Introduction

Cadmium (Cd), as a widely distributed environmental pollutant, is unavoidably absorbed by humans through environmental and occupational exposures [1]. After intake into the human body, approximately 50% Cd as the divalent cation (Cd2+) accumulates in the kidney, in which the renal proximal tubule is the first opportunistic site of Cd2+ reabsorption following plasma filtration in the glomerulus. Previous studies have tried to explore the potential mechanism of Cd2+-induced cytotoxicity of the renal proximal tubule cells, which will help find potential intoxication targets and explore novel renoprotective strategies [2,3]. However, primary cellular events and key effector molecules of Cd2+-induced cytotoxicity remain unclear.
Cd2+-disrupted intracellular calcium (Ca2+) homeostasis induced autophagy inhibition, promoted oxidative stress, and thereby mediated cell apoptosis [4,5,6,7,8]. Previous studies have shown that heavy metals (Cd2+, Pb2+) exposure induces subcellular Ca2+ redistribution by increasing Ca2+ release from the endoplasmic reticulum (ER) Ca2+ stored in primary rat proximal tubular cells [9,10,11]. In mouse renal tubular cells, our previous study showed that Cd2+ increased cytosolic Ca2+ levels by activating phospholipase C (PLC)-inositol 1, 4, 5-trisphosphate receptor (IP3R), which is one of the main Ca2+ release channels of ER [12]. In addition to the Ca2+ release channels, ER also has Ca2+ reuptake channel sarco/endoplasmic reticulum Ca2+-ATPase (SERCA) to maintain ER Ca2+ store level. In NIH 3T3 fibroblast cells, Cd2+ exposure decreased SERCA activity and inhibited the reuptake of Ca2+ from the cytoplasm back into the ER, which caused the disruption of ER Ca2+ homeostasis and cell apoptosis [13]. However, the roles of SERCA in the Cd2+-induced apoptosis of renal tubular cells have not been clarified.
SERCA activity and expression were significantly increased in human embryonic kidney cells HEK-293 with gain-of-function variants of the Ca2+ sensing receptor (CaSR) [14]. It suggests that SERCA might be a downstream target of CaSR. Moreover, NPS R-467-activated CaSR could restore Cd2+-disrupted intracellular Ca2+ homeostasis and protect against Cd2+-induced kidney apoptosis and injury [12,15]. Therefore, in this study, we aimed to identify the roles of SERCA in Cd2+-modulated Ca2+ homeostasis and Cd2+-induced ER stress and apoptosis in renal tubular cells and explore the underlying mechanism of Cd2+-targeted SERCA regulation.

2. Results

2.1. NPS R-467 Protects against Cd2+-Induced Apoptosis Associated with Restoring Cytosolic Ca2+ Homeostasis

Cd2+-induced nephrotoxicity originated from the damage of renal tubular cells. As shown in Figure 1A, Cd2+ treatment increased the expression of kidney injury biomarker, kidney injury molecule-1 (KIM-1) in mRTEC (Figure 1A). The results of the flow cytometry assay showed that Cd2+ treatment induced apoptosis of mRTEC cells in a dose-dependent manner (Figure S1A). However, Cd2+ (5 μM)-induced apoptosis was effectively reversed by R-467 pretreatment (Figure 1B and Figure S1B). The results of Fura-2/AM staining showed that Cd2+ treatment induced a transient increase of cytosolic Ca2+ levels in a few seconds, which is similar to TG (inhibitor of ER Ca2+ reuptake channel SERCA) treatment alone (Figure 1C,D), and was abrogated by the pretreatment of TG and 2-APB (inhibitor of ER Ca2+ release channel IP3R) (Figure 1E,F). Although NPS R-467 treatment alone did not change the cytosolic Ca2+ level, it could restore the Cd2+-increased cytosolic Ca2+ level in a few minutes (Figure 1G,H). These results showed that activation of CaSR by R-467 could protect against Cd2+-induced apoptosis associated with restoring cytosolic Ca2+ homeostasis, which might be mediated by ER.

2.2. Cd2+-Induced Cytosolic Ca2+ Level Depends on ER Store

In order to investigate if part of the increased cytosolic Ca2+ level is dependent on extracellular Ca2+, we detected the change of cytosolic Ca2+ level after the short-term application of Cd2+ in Ca2+ free medium. The result of Flou-3/AM showed that the Ca2+ levels increased after short-term Cd2+ treatment (0.1 h) in both Ca2+-free HBSS and RMPI 1640 medium (Figure 2A). Then, the intracellular Ca2+ could return to resting level (0.5–4 h) (Figure 2A), which was further confirmed by the staining of Fura-2/AM after the cells were treated with Cd2+ for 4 h (Figure 2B). It suggests that Cd2+-induced elevation of cytosolic Ca2+ levels is not dependent on extracellular Ca2+ and could be restored in short-term Cd2+ treatment.
The ER is a main Ca2+ store in the cells and maintains intracellular Ca2+ homeostasis. As shown in Figure 2C, Mag-Fluo-4/AM is used to indicate ER Ca2+ content as it is specially co-localized or surrounded with ER-trackers in mRTEC (Figure 2C). Although short-term Cd2+ treatment (4 h) did not alter the ER Ca2+ content (Figure 2D), the long-term Cd2+ treatment (24 h) would reduce the ER Ca2+ content (Figure 2E). Moreover, SERCA agonist CDN1163 could restore the ER Ca2+ level disrupted by Cd2+ exposure (Figure 2E). Certainly, long-term Cd2+ treatment-reduced ER Ca2+ content might be due to Cd2+-induced cell apoptosis as TG treatment. The pretreatments of R-467 and CDN1163 could activate SERCA, the key Ca2+ reuptake channel of ER, to maintain Ca2+ homeostasis and inhibit Cd2+-induced apoptosis. Therefore, it needs further investigation in the following experiments.

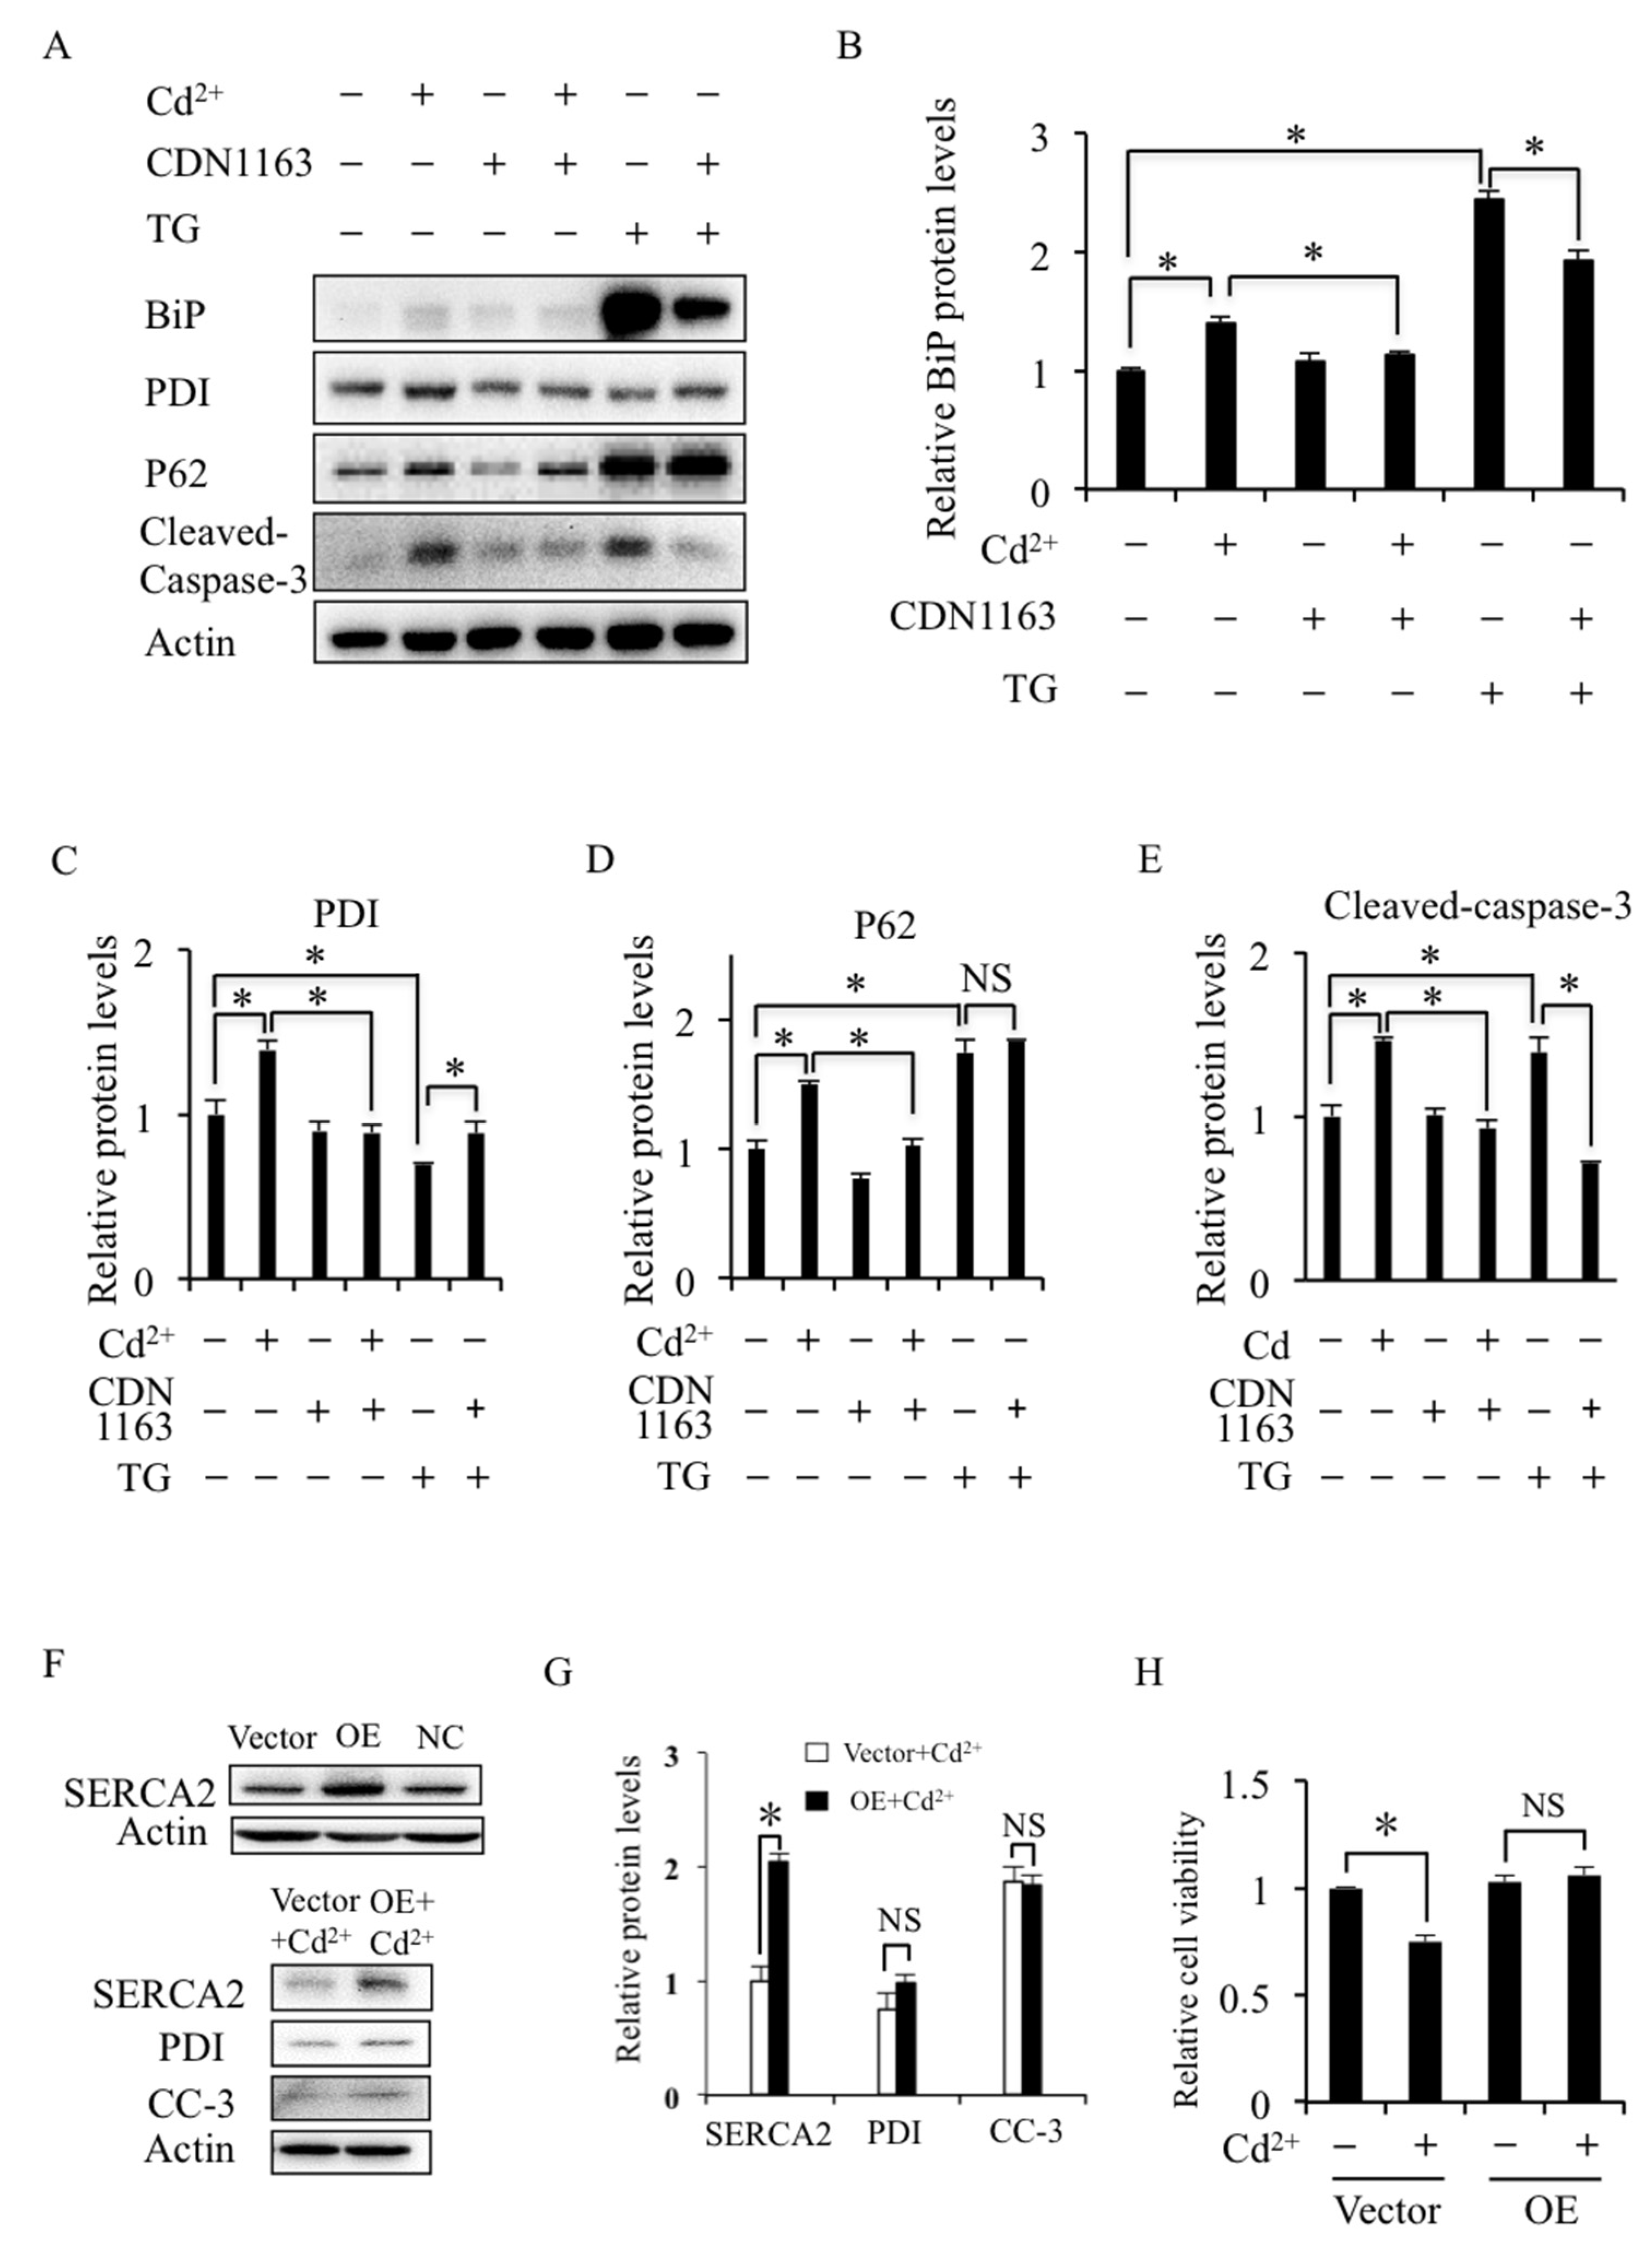
2.3. SERCA Inhibition Induces ER Stress and Apoptosis

To further identify the role of SERCA in mRTEC cells, the effects of SERCA inhibitor TG and SERCA agonist CDN1163 on the ER stress, autophagy, and apoptosis were detected. Western blotting results showed that Cd2+ slightly increased the expression of ER stress biomarkers BiP and PDI, and the apoptosis biomarker cleaved caspase-3, although not as TG so significantly (Figure 3A–E and Figure S2A,B). It is noted that CDN1163 could restore Cd2+-increased expression of BiP, PDI, and cleaved caspase-3 but not autophagy biomarker p62 (Figure 3A–E). Overexpression of SERCA2 (the main isoform of SERCA expressed in kidneys) could inhibit Cd2+-increased expression of PDI and cleaved caspase-3 and store cell viability (Figure 3F–H). These results suggest that the inhibitory effect of Cd2+ on SERCA contributes to ER stress and increases apoptosis of mRTEC cells but does not inhibit autophagy flux.

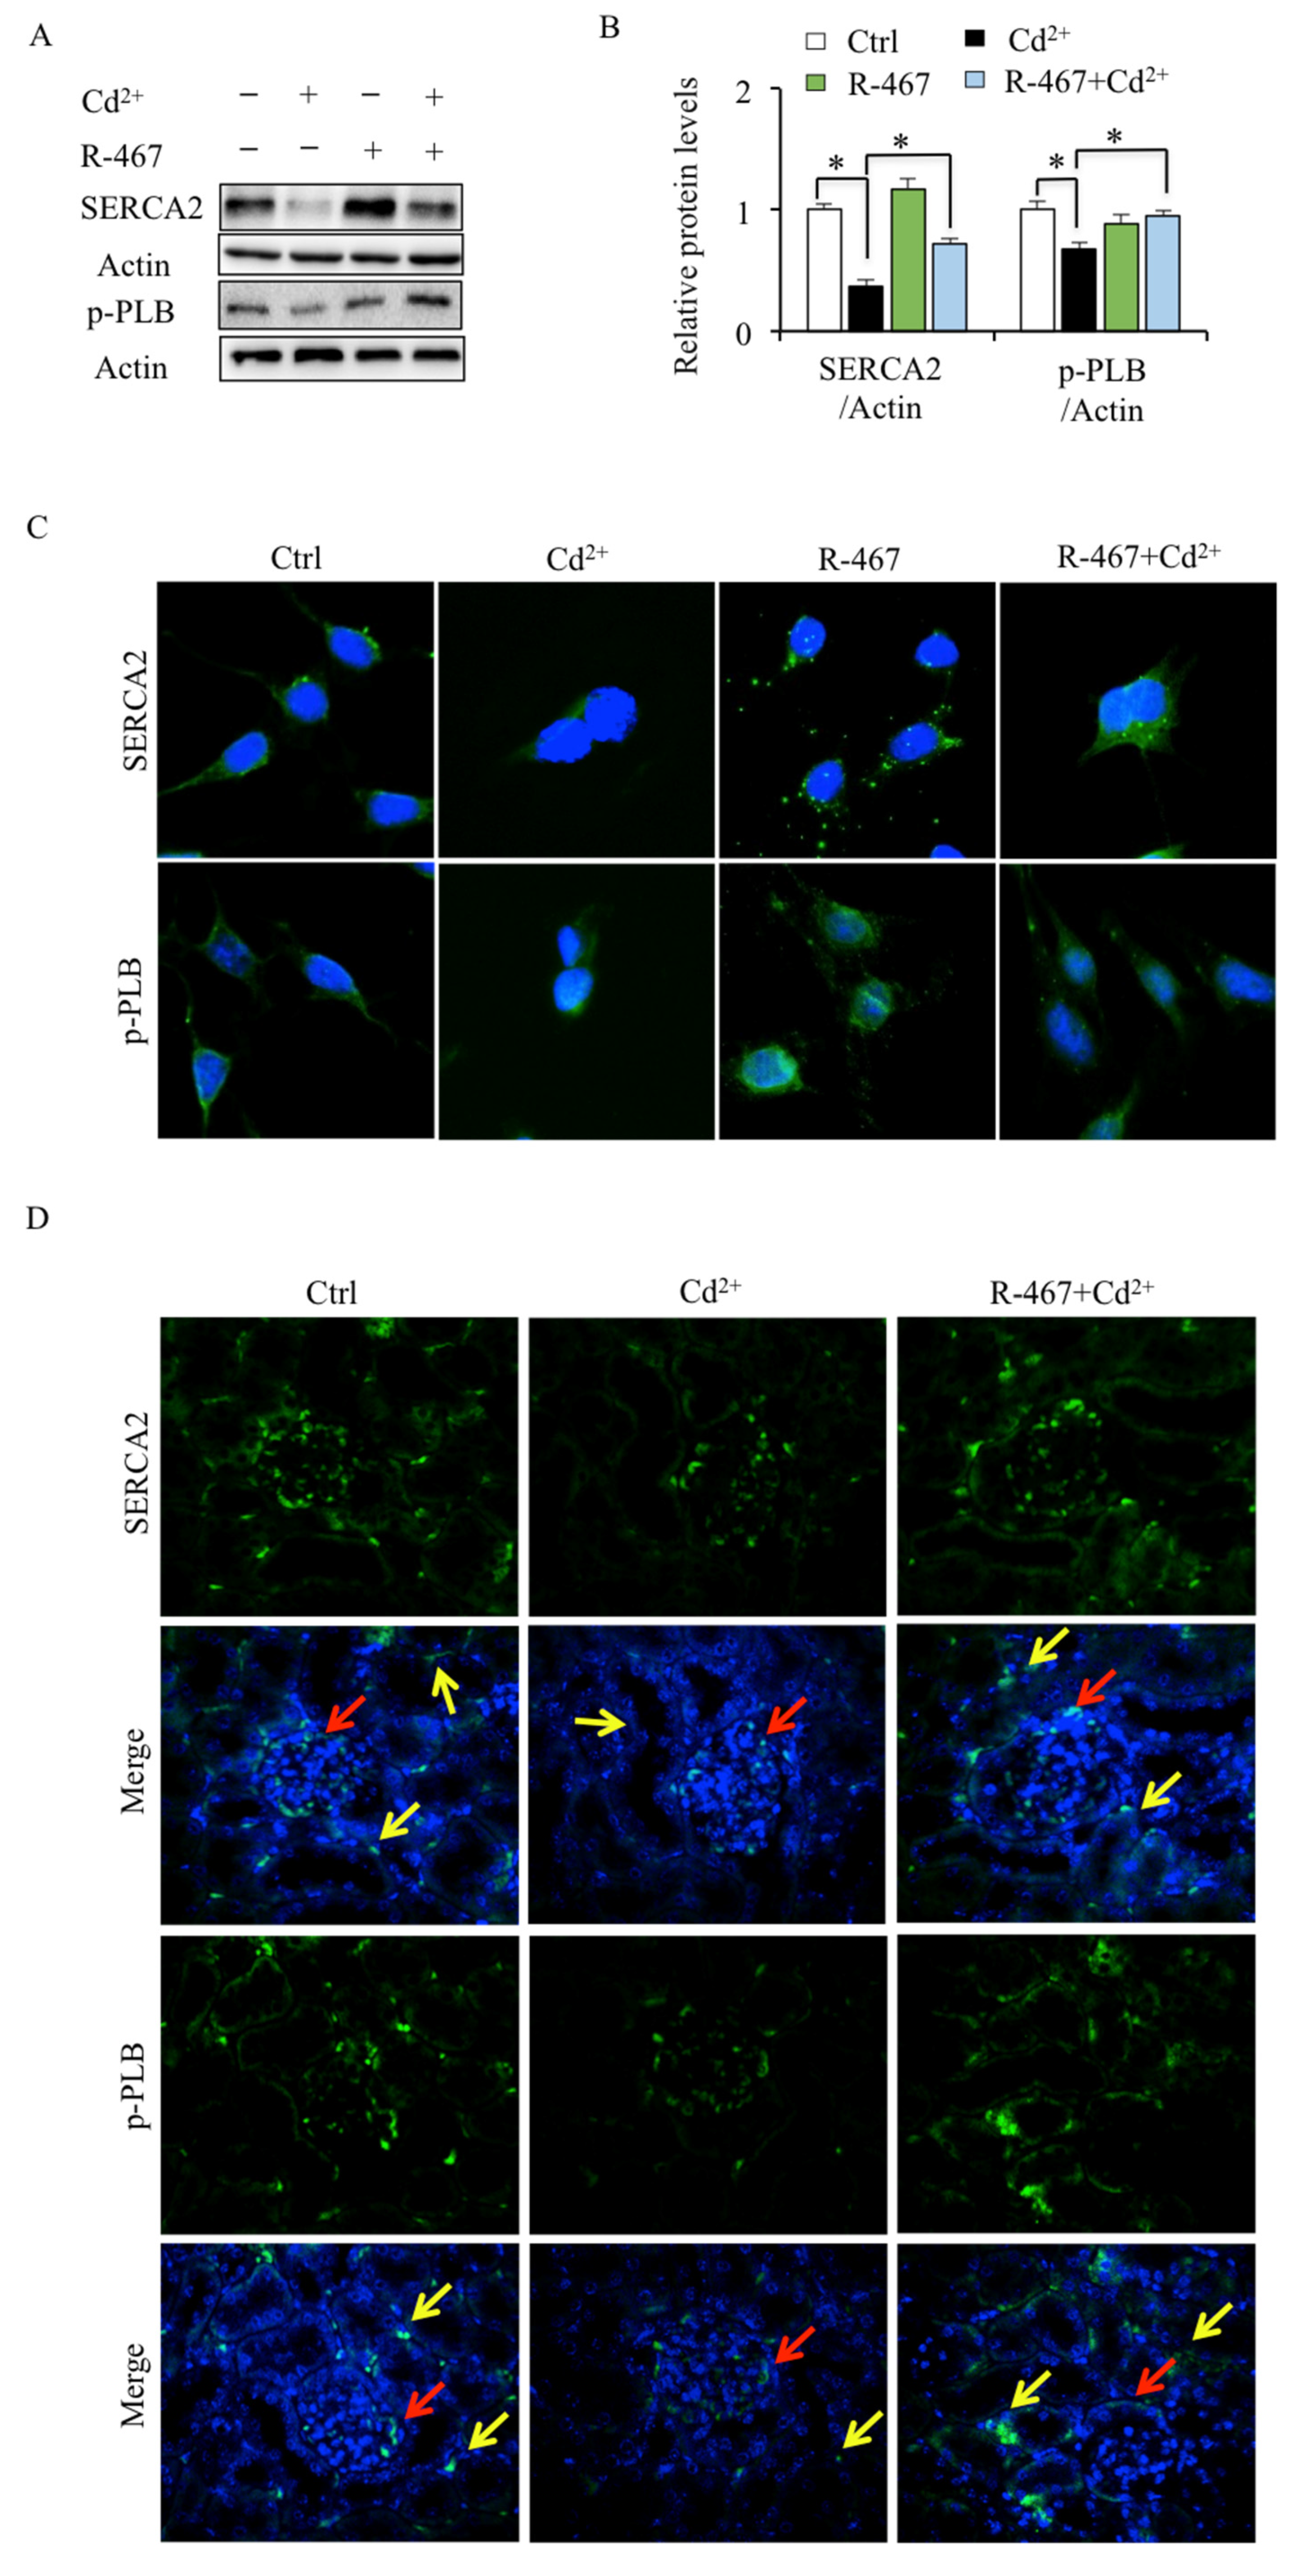
2.4. R-467 Reverses Cd2+-Inhibited SERCA2 and p-PLB Expression in Mice Kidney Cells and Tissues

SERCA2 activity is regulated by the phosphorylation of PLB. To identify the regulation of Cd2+ on SERCA2, the expression of SERCA2 and p-PLB in mRTEC cells and kidney tissues was detected. As shown in Western blotting and immunofluorescence staining, Cd2+ significantly reduced the protein levels of SERCA2 and p-PLB in both mRTEC cells and renal tubules of kidney tissues (Figure 4A–D). Moreover, Cd2+-down-regulated SERCA2 and p-PLB expression were restored by R-467 (Figure 4A–D). These results confirmed that Cd2+ inhibited the expression and activity of SERCA2. The restoring effects of R-467 on expression and activity SERCA2, together with the cytosolic and ER Ca2+ levels, indicated that SERCA could act as a downstream target of CaSR.

2.5. Cd2+ Induces SERCA2 Protein Degradation through Proteasome Pathway

To explore the mechanism of Cd2+-decreased expression of SERCA2, the mRNA level and protein stability of SERCA2 were detected. The RT-PCR results suggested that the SERCA2 mRNA level in mRTEC cells did not alter by Cd2+ exposure (Figure 5A,B). In addition, the results showed that Cd2+-induced SERCA2 degradation was inhibited after being treated with proteasome inhibitor MG132 but not lysosome inhibitor CQ (Figure 5C,D). These results indicated that Cd2+ exposure modulated SERCA2 expression in mRTEC cells by promoting the protein degradation pathway instead of inhibiting mRNA transcription. Cd2+-reduced SERCA2 proteins stability was further confirmed by a half-life assay. It showed that in the presence of the translation inhibitor, CHX, Cd2+ exposure reduced the half-life of SERCA2 (Figure 5E,F). Taken together, these data suggest that Cd2+ inhibited SERCA2 expression by stimulating the proteasomal degradation pathway.

3. Discussion

Cd2+ accumulated in the human kidney causes nephrotoxicity that promotes the development of CKD [16,17], as well as the occurrence and progression of renal cell carcinoma (RCC) [18,19]. The initiation of CKD and RCC originates from renal tubular cell injury and cancerization [18,20]. In previous studies, we showed that NPS R-467-activated CaSR could abrogate Cd2+-disrupted intracellular Ca2+ homeostasis and protect against long-term Cd2+ exposure-induced kidney apoptosis and injury [12,15]. In addition, it is supposed that ER Ca2+ homeostasis might play a key role in the Cd2+-induced apoptosis of renal tubular cells [12]. However, the key effectors targeted by Cd2+ have not been identified. Our results demonstrated that Cd2+ disrupted ER Ca2+ homeostasis by inhibiting SERCA2, which could be a potential target to prevent Cd2+-induced ER stress and cytotoxicity of renal tubular cells.
The ER is a sophisticated organelle controlling Ca2+ homeostasis by two Ca2+-releasing channels: IP3R and Ryanodine receptor (RyR), and a Ca2+ reflux channel SERCA. The balance between these three Ca2+ channels is crucial to maintain the dynamic balance of ER Ca2+ [21,22]. In addition, the Ca2+ channels on the plasma membrane, such as transient receptor potential vanilloid (TRPV) channels, could maintain ER Ca2+ homeostasis and protect against ER stress-induced apoptosis [23,24]. However, Cd2+ competites the TRPV5 and TRPV6 channels to block the Ca2+ uptake [25,26,27]. In proximal renal tubule epithelial cells, the Ca2+ release channel on the ER is mainly IP3R [28,29]. Through IP3R, Cd2+ induced Ca2+ release from the ER and caused Ca2+ redistribution, further resulting in primary rat proximal tubular cell apoptosis [9]. In mRTEC cells, our previous results confirmed that Cd2+ increased intracellular Ca2+ levels by activating the PLC-IP3R pathway [12]. Moreover, NPS R-467-activated CaSR could reverse Cd2+-disrupted cytosolic Ca2+ homeostasis and protect against Cd2+-induced kidney apoptosis and injury [12,15]. The present study identified that Cd2+-induced ER Ca2+ loss was effectively reversed by CaSR activator R-467 and SERCA agonist CDN1163. It suggests that Cd2+-disrupted ER Ca2+ homeostasis was modulated by the SERCA pump.
It suggests that SERCA activity plays an important role in Cd2+-induced cytotoxicity. Cd2+-decreased SERCA activity causes the disruption of ER Ca2+ homeostasis and apoptosis in NIH 3T3 fibroblast cells [13]. In the primary culture of rat cerebral cortical neurons, Cd2+ induced apoptosis by inhibiting Ca2+-ATPase activity [30]. In HepG2 cells, SERCA agonist CDN1163 can reverse Cd2+-increased triglyceride levels [31]. The SERCA pump activity is regulated by phospholamban (PLB). When binding to PLB, SERCA activity is suppressed; hence, the Ca2+ transport rate from the cytoplasm into ER decreases, which is reversed by the phosphorylation of PLB (p-PLB) [32]. Here, our results suggested that Cd2+ reduced the protein levels of p-PLB both in mouse renal tubular cells and kidney tissues. It suggests that Cd2+ induces ER stress, and apoptosis of renal tubular cells might be by inhibiting SERCA activity.
It is supposed that dysregulation of SERCA2 could cause kidney diseases. Reducing SERCA2-dependent ER stress could alleviate podocyte injury in diabetic nephropathy mice [33]. Upregulating SERCA2 expression causes ER Ca2+ depletion, which triggers apoptotic pathways in diabetic nephropathic mice [34]. Activation of AMP-activated protein kinase (AMPK) increased activation of SERCA to reduce cytosolic Ca2+ in vascular smooth muscle, which might benefit the treatment of vasodilation in human intrarenal arteries [35]. By attenuating SERCA2-dependent ER stress, Astragaloside IV prevented podocyte apoptosis in the progression of diabetic nephropathy [33]. The results here showed that Cd2+ reduced the protein level of SERCA2 and upregulated the expression of ER stress and apoptosis biomarkers, which was reversed by CaSR activator R-467 and SERCA agonist CDN1163, as well as overexpression of SERCA2. It suggests that Cd2+-inhibited expression of SERCA2 causes ER stress and apoptosis in renal tubular cells.
Our previous study suggested that Cd2+ inhibited autophagy flux by increasing Ca2+ released from ER through the IP3R channel [12]. With the Ca2+ channels IP3R and SERCA, the ER can transfer the cytosolic Ca2+ to the lysosomes to affect the lysosomal acid environment, an essential element for autophagy flux [36,37]. SERCA inhibitor Saikosaponin-D can inhibit the proliferation of autosomal dominant polycystic kidney disease (ADPKD) cells by promoting autophagy [38]. In liver HepG2 cells, the IP3R inhibitor 2-APB could restore the Cd2+-disrupted lysosomal acidic environment, which was also dysregulated by SERCA inhibitor TG [31]. Here, our result also confirms that TG treatment inhibits the autophagy flux as p62 accumulates in renal tubular cells. However, TG and Cd2+-induced p62 accumulation could not be reversed by R-467 and SERCA agonist CDN1163. It indicates that Cd2+ inhibits autophagy flux and might simultaneously increase IP3R-mediated Ca2+ release and suppress SERCA-dependent Ca2+ reflux.
Moreover, the lysosomal acidity inhibitor CQ could not inhibit Cd2+-induced SERCA2 degradation, which was obviously reversed by proteasomal inhibitor MG132. It suggests that Cd2+ induced SERCA2 degradation by promoting the proteasome pathway. The ubiquitin-proteasome system (UPS) is a main protein degradation process tightly related to ER stress [39]. ER stress inhibitor, 4-phenylbutyric acid (PBA), could prevent diabetic muscle wastage/atrophy in rats by reducing UPS activation [40] and reducing neuronal apoptosis of diabetes rats by restoring UPS activity [41]. Our results demonstrated that Cd2+ decreased SERCA2 stability by stimulating the proteasomal pathway in renal tubular cells.
The present study demonstrates that Cd2+ exposure induces apoptosis of renal tubular cells mRTEC due to disrupting ER Ca2+ homeostasis by suppressing SERCA2 expression and activity. SERCA2 agonist and overexpression of SERCA2 could abate Cd2+-induced ER stress and cell apoptosis. In addition, Cd2+ reduced SERCA2 protein stability by promoting proteasomal degradation. Therefore, SERCA2 might be a potential new target to protect against Cd2+-induced cytotoxicity and renal injury.

4. Materials and Methods

4.1. Reagents

Cadmium chloride, cycloheximide (CHX), and proteasome inhibitor MG132 were purchased from Sigma (Saint Louis, MO, USA). IP3R inhibitor 2-APB, SERCA inhibitor thapsigargin (TG), and SERCA agonist CDN1163 were purchased from Tocris Biosciences (Bristol, UK). Fura-2/AM, Fluo-3/AM, and Mag-Fluo-4/AM were purchased from Thermo Fisher Scientific (Shanghai, China); Calcimimetics NPS R-467 was purchased from NPS Pharmaceuticals (Salt Lake, UT, USA).

4.2. Animal Experiments and Cell Culture

All animal procedures complied with the guidelines approved by the Ethical Committee for the Use of Laboratory Animals of Jiangsu University (SYXK 2018-0053). As in our previous studies, 10 male ICR mice (8 weeks old, n = 5, around 25 g) were assigned to Cd2+ exposure group and control group (5 in each group), performed at least three times. CdCl2 was dissolved in distilled water and then added into Specific Pathogen Free (SPF) grade diets to final concentration of 1000 ppm Cd2+. Mice were continually fed on the Cd2+ contaminated diet for 28 days. To determine the effect of NPS R-467, the mice were fed on the 1000 ppm Cd2+ contaminated diet and tail vein injection with NPS R-467 (10 μM) in 20 μL PBS every day for 28 days. The mice were raised at 18~22 °C, with 50–60% humidity, natural daylighting, and tidy housing surrounding. All mice were euthanized by cervical dislocation at time point, and the kidney tissues were taken out for immunofluorescence staining.
Mouse renal tubular epithelial cells (mRTECs) obtained from American Type Culture Collection (ATCC, Manassas, VA, USA) were cultured and maintained in RPMI 1640 medium (pH 7.4) supplemented with 10% fetal bovine serum (FBS) (Gibco, Thermo Fisher Scientific, Shanghai, China) and 1% penicillin/streptomycin in 5% CO2 incubator with 95% humidity. RPMI 1640 medium, FBS, penicillin, and streptomycin were purchased from Gibco (Thermo Fisher Scientific, Shanghai, China).

4.3. Measurement of Cell Viability

After being treated for 24 h, the cell viability was measured by the MTT (3-(4,5-dimethyl-2-thiazolyl)-2,5-diphenyl-2-H- tetrazolium bromide) assay (Sangon, Shanghai, China). In brief, cells were incubated in 100 μL MTT solution (0.5 mg/mL in RPMI 1640 medium) in 96-well plate for 4 h before the end of incubation. The supernatant was discarded, and 100 μL DMSO (Sangon, Shanghai, China) was added to dissolve the colored product (formazan). The absorbance was measured at 540 nm (690 nm as reference) using a Synergy H4 Hybrid Multi-Mode Microplate Reader (BioTek, Winooski, VT, USA).

4.4. Flow Cytometry

The apoptosis rate was determined using an Annexin V-FITC and propidium iodide (PI) double staining kit (Neobiosciences, Shenzhen, China) according to the manufacturer’s instructions. Briefly, after being treated with CdCl2 (1, 5, 10 μM) or CdCl2 (5 μM) + R-467 (1 μM) for 24 h, 1 × 10⁶ cells were re-suspended in binding buffer containing Annexin V-FITC (0.025%) and/or PI (20 μg/mL) and incubated in darkness at room temperature for 3 and 10 min, respectively. Then, the cells were immediately analyzed by a FACScan flow cytometer (Beckman Instruments, Fullerton, CA, USA).

4.5. RNA Isolation and RT-PCR Analysis

The cell total RNA was isolated using Trizol (Sangon, Shanghai, China). All RNA isolations were performed as directed by the manufacturer. Gel electrophoresis and ethidium bromide staining confirmed the purity and integrity of the samples. Quantification of RNA was based on spectrophotometric analysis at 260/280 nm. cDNA was made from 10 μg total RNA using an RNA-to-cDNA kit (Vazyme, Nanjing, China). Real-time PCRs were carried out by ABI7300 system using SYBR Green master mix (Vazyme, Nanjing, China). Gene-specific primers for Mouse-SERCA2-F: GGCATCTTTGGGGAGAACGA, Mouse SERCA2-R: CCATCACCTGTCATGGCTGT, Mouse-βActin-F: AAGCTGTGCTATGTTGCTCTA, Mouse-βActin-R: GTTTCATGGAT GCCACAGGA. The occurrence of primer-dimers and secondary products was inspected using melting curve analysis and agarose gel electrophoresis. Control amplification was done either without reverse transcriptase or without RNA. The relative expression ratio of a target gene was calculated according to their threshold cycle Ct values.

4.6. Western Blotting Analysis

The cells were treated with Cd2+ (5 μM) for 24 h. In some experiments, cells were either untreated or pre-treated with regulators, i.e., R-467 (1 μM), CQ (20 μM), and CDN1163 (10 μM) for 1 h, followed by treatment with Cd2+ (5 μM) for 24 h, or TG (0.1 μM) and MG132 (10 μM) for 6 h. The cells were lysed in RIPA buffer on ice for 30 min. After centrifugation at 13,000× g for 15 min at 4 °C, the supernatant was collected, and the total protein concentration was determined by BCA (Thermo Fisher Scientific, USA). The protein lysates containing 40 μg total cellular protein in RIPA buffer were subjected to electrophoresis on 8–12% polyacrylamide gels. The gels were then blotted onto PVDF membranes (Millipore, Billerica, MA, USA). Western blotting was conducted using mouse monoclonal antibody C/EBP homologous protein (CHOP) (Cell Signaling Technology, Shanghai, China) or rabbit monoclonal antibodies against phosphorylation phospholamban (p-PLB) (Abcam, Cambridge, MA, USA), Ubiquitin (Santa Cruz, Dallas, TX, USA), SERCA2, Binding immunoglobulin Protein (BiP), Protein Disulphide Isomerase (PDI), Inositol-requiring enzyme 1 (IRE-1α), endoplasmic reticulum oxidoreductase 1 (ERO1), p62, cleaved caspase-3 (Cell Signaling Technology, Shanghai, China) (1:1000), followed by incubation with horseradish peroxidase-conjugated goat anti-rabbit antibody (1:4000). Specific bands were visualized using ECL chemiluminescent reagent (Vazyme, Nanjing, China). The blots were then washed in PBST and re-probed with rabbit anti-actin (Cell Signaling Technology, Shanghai, China) (1:1000).

4.7. Plasmid Transfection

SERCA2-GFP overexpression plasmid (VB190422-1024rhe), which contains full length of mouse SERCA2 expression cassette, was constructed by VectorBuilder (Guangzhou, China). Transfection was performed on 60–70% confluent mRTEC cells according to the manufacturer’s instruction of Lipofectamine 2000 (Thermo Fisher Scientific, Shanghai, China). Transfection mixture (per well in 6-well culture plates) consisted of 1.5 μL Lipofectamine 2000, 1.5 μg ultra-pure plasmid SERCA2-GFP, and 900 μL optimum reduced serum-free medium. Cells were washed once with optimum reduced serum-free medium, the transfection mixture was added and incubated for 6 h, and then the cell medium was replaced by fresh completed medium without antibiotics. After being cultured for 48 h, cells were treated with or without Cd2+ (5 μM) for 24 h before protein extraction.

4.8. Protein Half-Life of SERCA2

The cells were incubated with 5 μM Cd2+ for 24 h and cycloheximide (CHX, 10 μg/mL) for 0, 3, and 6 h. Total protein was extracted from those treated cells, and the amount of SERCA2 was estimated by Western blotting using anti-SERCA2 antibodies, which were used to determine the half-life of those proteins. Quantification of the relative protein levels of SERCA2 was performed using the software Image J 1.54c.

4.9. Immunofluorescence

To detect the expression of SERCA2 and p-PLB in mRTEC, the cells were treated with CdCl2 (5 μM) with or without R-467 (1 μM) for 24 h. The cells were fixed for 30 min in 4% Formaldehyde (Sangon, Shanghai, China). Then, the cells were permeabilized with 0.1% Triton X-100 (Sangon, Shanghai, China) in PBS for 20 min. Paraformaldehyde-fixed mice spleen sections were dewaxed, rehydrated in graded ethanol, and rinsed in PBS + 0.1% Tween 20 (PBST). The staining procedure involved incubation of the cells or tissue sections with 3% normal goat serum in PBST to reduce non-specific staining, followed by overnight incubation at 4 °C with rabbit polyclonal antibodies against SERCA2 (1:50, Cell Signaling Technology, Shanghai, China), p-PLB (1:50, Abcam, Shanghai, China) KIM-1 (1:200, Thermo Fisher Scientific, Shanghai, China) antibodies. Then, the cell or sides were incubated with Alexa Fluor 488 goat anti-rabbit IgG (1:200, Thermo Fisher Scientific, Shanghai, China) for 1 h at room temperature. The cells or tissues were stained by the DAPI (Thermo Fisher Scientific, Shanghai, China) for several minutes and were examined by Olympus IX73 microscopy (Tokyo, Japan). The cells or slides were washed for 3 × 15 min in PBST after each antiserum application.

4.10. Measurement of Intracellular Ca2+ Level and ER Ca2+ Content

To detect the transient effect of Cd2+ on intracellular Ca2+ levels in renal cells, mRTEC cells were seeded at a density of 5 × 10³ cells/well in 96-well plates. Next day, the cells were loaded with 1 μM Fura-2/AM in the RMPI 1640 medium (phenol red free) for 30 min at 37 °C in the dark. After dye loading, the cells were washed twice with the medium. Adding the medium with CdCl2 (5 μM), R-467 (1 μM) or CdCl2 (5 μM) + R-467 (1 μM), or pretreated with TG (0.1 μM), 2-APB (50 μM). Then, the fluorescent intensity was recorded with excitation at 348 nm and emission at 380 nm using a Synergy H4 Hybrid Multi-Mode Microplate Reader (BioTek, Winooski, VT, USA).
For measurement of the short-term effect of Cd2+ on cytosolic Ca2+ levels, the cells were treated with CdCl2 (5 μM) for 0–4 h. For long-term effect of ER Ca2+ content, the cells were treated with CdCl2 (5 μM) for 24 h, or pre-treated with regulators, i.e., R-467 (1 μM), CDN1163 (10 μM) for 1 h, followed by treatment with Cd2+ (5 μM) for 24 h, or TG (0.1 μM) for 6 h. Then, the cells were washed twice with RMPI 1640 medium (phenol red free), followed by loading with 1 μM Mag-Fluo-4/AM (for ER Ca2+ content, Thermo Fisher Scientific, Shanghai, China) in the RMPI 1640 medium (phenol red free) for 30 min at 37 °C in the dark. After dye loading, the cells were washed twice with the medium. Then, the fluorescent intensity was recorded with excitation at 488 nm and emission at 535 nm using a Synergy H4 Hybrid Multi-Mode Microplate Reader (BioTek, Winooski, VT, USA). Moreover, cells were loaded with ER-specific dye ER-tracker red (Beyotime, Shanghai, China) and/or Mag-Fluo-4-AM to indicate that Mag-Fluo-4 was selectively labeled on ER. The co-localization of Mag-Fluo-4 with ER-tracker red was observed by Leica TCS SP5 confocal microscope (Heidelberg, Germany).

4.11. Statistical Analysis

Chemical treatments were performed in triplicate in each experiment, and every experiment was repeated at least three times. All data are represented as means ± standard deviation (SD). Statistical significance was assessed with Student’s t-test or one-way analysis of variance (ANOVA) followed by Duncan’s multiple range test by IBM SPSS Statistics 27.0.1 software as described in figure legends. Groups were considered significantly different if * p < 0.05.

Supplementary Materials

The following supporting information can be downloaded at: https://www.mdpi.com/article/10.3390/ijms24065979/s1.

Author Contributions

Conceptualization, J.G. and H.S.; methodology, J.G. and H.S.; software, K.L. and C.G.; validation, K.L., C.G., J.R. and B.N.; formal analysis, K.L., C.G. and J.R.; investigation, K.L., C.G. and J.R.; resources, C.K.-C.W., J.G. and H.S.; writing—original draft preparation, J.G.; writing—review and editing, J.G. and H.S.; funding acquisition, J.G. and H.S. All authors have read and agreed to the published version of the manuscript.

Funding

This research was funded by the National Natural Science Foundation of China (31600952 and 31271272), the Start-Up Research Funding of Jiangsu University for Distinguished Scholars (4111330006), and the Postgraduate Research Practice Innovation Project of Jiangsu Province (KYCX22_3608).

Institutional Review Board Statement

The animal study protocol was approved by the Ethical Committee for the Use of Laboratory Animals of Jiangsu University (SYXK 2018-0053).

Informed Consent Statement

Not applicable.

Data Availability Statement

All the data supporting the conclusions is included within the manuscript and is available on request from the corresponding authors.

Acknowledgments

We would like to thank Zhou Yang, Chen Liang, and Lu Rongzhu (Jiangsu University) for the useful discussion during the preparation of the manuscript.

Conflicts of Interest

The authors declare no conflict of interest.

References

  1. Jarup, L. Hazards of heavy metal contamination. Br. Med. Bull. 2003, 68, 167–182. [Google Scholar] [CrossRef] [PubMed] [Green Version]
  2. Gerhardsson, L.; Englyst, V.; Lundström, N.; Sandberg, S.; Nordberg, G. Cadmium, copper and zinc in tissues of deceased copper smelter workers. J. Trace Elem. Med. Biol. 2002, 16, 261–266. [Google Scholar] [CrossRef] [PubMed]
  3. Komoike, Y.; Inamura, H.; Matsuoka, M. Effects of salubrinal on cadmium-induced apoptosis in HK-2 human renal proximal tubular cells. Arch. Toxicol. 2012, 86, 37–44. [Google Scholar] [CrossRef]
  4. Fan, R.F.; Tang, K.K.; Wang, Z.Y.; Wang, L. Persistent activation of Nrf2 promotes a vicious cycle of oxidative stress and autophagy inhibition in cadmium-induced kidney injury. Toxicology 2021, 464, 152999. [Google Scholar] [CrossRef]
  5. Gu, J.; Wang, Y.; Liu, Y.; Shi, M.; Yin, L.; Hou, Y.; Zhou, Y.; Wong, C.K.C.; Chen, D.; Guo, Z.; et al. Inhibition of autophagy alleviates cadmium-induced mouse spleen and human B cells apoptosis. Toxicol. Sci. 2019, 170, 109–122. [Google Scholar] [CrossRef]
  6. Liu, F.; Wang, X.Y.; Zhou, X.P.; Liu, Z.P.; Song, X.B.; Wang, Z.Y.; Wang, L. Cadmium disrupts autophagic flux by inhibiting cytosolic Ca2+-dependent autophagosome-lysosome fusion in primary rat proximal tubular cells. Toxicology 2017, 383, 13–23. [Google Scholar] [CrossRef] [PubMed]
  7. Ning, B.; Guo, C.; Kong, A.; Li, K.; Xie, Y.; Shi, H.; Gu, J. Calcium signaling mediates cell death and crosstalk with autophagy in kidney disease. Cells 2021, 10, 3204. [Google Scholar] [CrossRef]
  8. Wang, X.Y.; Yang, H.; Wang, M.G.; Yang, D.B.; Wang, Z.Y.; Wang, L. Trehalose protects against cadmium-induced cytotoxicity in primary rat proximal tubular cells via inhibiting apoptosis and restoring autophagic flux. Cell Death Dis. 2017, 8, e3099. [Google Scholar] [CrossRef] [Green Version]
  9. Liu, F.; Li, Z.F.; Wang, Z.Y.; Wang, L. Role of subcellular calcium redistribution in regulating apoptosis and autophagy in cadmium-exposed primary rat proximal tubular cells. J. Inorg. Biochem. 2016, 164, 99–109. [Google Scholar] [CrossRef]
  10. Kosiba, A.A.; Wang, Y.; Chen, D.; Wong, C.K.C.; Gu, J.; Shi, H. The roles of calcium-sensing receptor (CaSR) in heavy metals-induced nephrotoxicity. Life Sci. 2020, 242, 117183. [Google Scholar] [CrossRef]
  11. Wang, H.; Wang, Z.K.; Jiao, P.; Zhou, X.P.; Yang, D.B.; Wang, Z.Y.; Wang, L. Redistribution of subcellular calcium and its effect on apoptosis in primary cultures of rat proximal tubular cells exposed to lead. Toxicology 2015, 333, 137–146. [Google Scholar] [CrossRef] [PubMed]
  12. Gu, J.; Dai, S.; Liu, Y.; Liu, H.; Zhang, Y.; Ji, X.; Yu, F.; Zhou, Y.; Chen, L.; Tse, W.K.F.; et al. Activation of Ca2+-sensing receptor as a protective pathway to reduce Cadmium-induced cytotoxicity in renal proximal tubular cells. Sci. Rep. 2018, 8, 1092. [Google Scholar] [CrossRef] [PubMed] [Green Version]
  13. Biagioli, M.; Pifferi, S.; Ragghianti, M.; Bucci, S.; Rizzuto, R.; Pinton, P. Endoplasmic reticulum stress and alteration in calcium homeostasis are involved in cadmium-induced apoptosis. Cell Calcium 2008, 43, 184–195. [Google Scholar] [CrossRef] [PubMed]
  14. Ranieri, M.; Tamma, G.D.M.A.; Vezzoli, G.; Soldati, L.; Svelto, M.; Valenti, G. Excessive signal transduction of gain-of-function variants of the calcium-sensing receptor (CaSR) are associated with increased ER to cytosol calcium gradient. PLoS ONE 2013, 8, e79113. [Google Scholar] [CrossRef] [PubMed] [Green Version]
  15. Gu, J.; Ren, Z.; Zhao, J.; Peprah, F.A.; Xie, Y.; Cheng, D.; Wang, Y.; Liu, H.; Wong, C.K.C.; Zhou, Y.; et al. Calcimimetic compound NPS R-467 protects against chronic cadmium-induced mouse kidney injury by restoring autophagy process. Ecotoxicol. Environ. Saf. 2020, 189, 110052. [Google Scholar] [CrossRef] [PubMed]
  16. Orr, S.E.; Bridges, C.C. Chronic kidney disease and exposure to nephrotoxic metals. Int. J. Mol. Sci. 2017, 18, 1039. [Google Scholar] [CrossRef] [PubMed] [Green Version]
  17. Xu, X.; Nie, S.; Ding, H.; Hou, F.F. Environmental pollution and kidney diseases. Nat. Rev. Nephrol. 2018, 14, 313–324. [Google Scholar] [CrossRef]
  18. Hsieh, J.J.; Purdue, M.P.; Signoretti, S.; Swanton, C.; Albiges, L.; Schmidinger, M.; Heng, D.Y.; Larkin, J.; Ficarra, V. Renal cell carcinoma. Nat. Rev. Dis. Prim. 2017, 3, 17009. [Google Scholar] [CrossRef]
  19. Shi, H.; Sun, X.; Kong, A.; Ma, H.; Xie, Y.; Cheng, D.; Wong, C.K.C.; Zhou, Y.; Gu, J. Cadmium induces epithelial-mesenchymal transition and migration of renal cancer cells by increasing PGE2 through a cAMP/PKA-COX2 dependent mechanism. Ecotoxicol. Environ. Saf. 2021, 207, 111480. [Google Scholar] [CrossRef]
  20. Evenepoel, P.; Viaene, L.; Meijers, B. Calcium balance in chronic kidney disease: Walking the tightrope. Kidney Int. 2012, 81, 1057–1059. [Google Scholar] [CrossRef] [Green Version]
  21. Luciani, D.S.; Gwiazda, K.S.; Yang, T.L.; Kalynyak, T.B.; Bychkivska, Y.; Frey, M.H.; Jeffrey, K.D.; Sampaio, A.V.; Underhill, T.M.; Johnson, J.D. Roles of IP3R and RyR Ca2+ channels in endoplasmic reticulum stress and beta-cell death. Diabetes 2009, 58, 422–432. [Google Scholar] [CrossRef] [Green Version]
  22. Seo, M.D.; Enomoto, M.; Ishiyama, N.; Stathopulos, P.B.; Ikura, M. Structural insights into endoplasmic reticulum stored calcium regulation by inositol 1,4,5-trisphosphate and ryanodine receptors. Biochim. Biophys. Acta 2015, 1853, 1980–1991. [Google Scholar] [CrossRef] [PubMed] [Green Version]
  23. Li, Z.; Meng, Z.; Lu, J.; Chen, F.M.; Wong, W.T.; Tse, G.; Zheng, C.; Keung, W.; Tse, K.; Li, R.A.; et al. TRPV6 protects ER stress-induced apoptosis via ATF6α-TRPV6-JNK pathway in human embryonic stem cell-derived cardiomyocytes. J. Mol. Cell. Cardiol. 2018, 120, 1–11. [Google Scholar] [CrossRef] [PubMed]
  24. Haustrate, A.; Prevarskaya, N.; Lehen’kyi, V. Role of the TRPV Channels in the Endoplasmic Reticulum Calcium Homeostasis. Cells 2020, 9, 317. [Google Scholar] [CrossRef] [PubMed] [Green Version]
  25. Kovacs, G.; Danko, T.; Bergeron, M.J.; Balazs, B.; Suzuki, Y.; Zsembery, A.; Hediger, M.A. Heavy metal cations permeate the TRPV6 epithelial cation channel. Cell Calcium 2011, 49, 43–55. [Google Scholar] [CrossRef]
  26. Kovacs, G.; Montalbetti, N.; Franz, M.C.; Graeter, S.; Simonin, A.; Hediger, M.A. Human TRPV5 and TRPV6: Key players in cadmium and zinc toxicity. Cell Calcium 2013, 54, 276–286. [Google Scholar] [CrossRef]
  27. Yang, H.; Shu, Y. Cadmium transporters in the kidney and cadmium-induced nephrotoxicity. Int. J. Mol. Sci. 2015, 16, 1484–1494. [Google Scholar] [CrossRef] [Green Version]
  28. Aizman, O.; Uhlen, P.; Lal, M.; Brismar, H.; Aperia, A. Ouabain, a steroid hormone that signals with slow calcium oscillations. Proc. Natl. Acad. Sci. USA 2001, 98, 13420–13424. [Google Scholar] [CrossRef] [Green Version]
  29. Li, J.; Zelenin, S.; Aperia, A.; Aizman, O. Low doses of ouabain protect from serum deprivation-triggered apoptosis and stimulate kidney cell proliferation via activation of NF-kappaB. J. Am. Soc. Nephrol. 2006, 17, 1848–1857. [Google Scholar] [CrossRef] [Green Version]
  30. Yuan, Y.; Jiang, C.Y.; Xu, H.; Sun, Y.; Hu, F.F.; Bian, J.C.; Liu, X.Z.; Gu, J.H.; Liu, Z.P. Cadmium-induced apoptosis in primary rat cerebral cortical neurons culture is mediated by a calcium signaling pathway. PLoS ONE 2013, 8, e64330. [Google Scholar] [CrossRef]
  31. Kong, A.; Zhang, Y.; Ning, B.; Li, K.; Ren, Z.; Dai, S.; Chen, D.; Zhou, Y.; Gu, J.; Shi, H. Cadmium induces triglyceride levels via microsomal triglyceride transfer protein (MTTP) accumulation caused by lysosomal deacidification regulated by endoplasmic reticulum (ER) Ca2+ homeostasis. Chem. Biol. Interact. 2021, 348, 109649. [Google Scholar] [CrossRef] [PubMed]
  32. MacLennan, D.H.; Kranias, E.G. Phospholamban: A crucial regulator of cardiac contractility. Nat. Rev. Mol. Cell Biol. 2003, 4, 566–577. [Google Scholar] [CrossRef] [PubMed]
  33. Guo, H.; Wang, Y.; Zhang, X.; Zang, Y.; Zhang, Y.; Wang, L.; Wang, H.; Wang, Y.; Cao, A.; Peng, W. Astragaloside IV protects against podocyte injury via SERCA2-dependent ER stress reduction and AMPKalpha-regulated autophagy induction in streptozotocin-induced diabetic nephropathy. Sci. Rep. 2017, 7, 6852. [Google Scholar] [CrossRef] [PubMed] [Green Version]
  34. Guo, H.; Cao, A.; Chu, S.; Wang, Y.; Zang, Y.; Mao, X.; Wang, H.; Wang, Y.; Liu, C.; Zhang, X.; et al. Astragaloside IV attenuates podocyte apoptosis mediated by endoplasmic reticulum stress through upregulating sarco/endoplasmic reticulum Ca2+-ATPase 2 expression in diabetic nephropathy. Front. Pharmacol. 2016, 7, 500. [Google Scholar] [CrossRef] [PubMed] [Green Version]
  35. Rodriguez, C.; Contreras, C.; Saenz-Medina, J.; Munoz, M.; Corbacho, C.; Carballido, J.; Garcia-Sacristan, A.; Hernandez, M.; Lopez, M.; Rivera, L.; et al. Activation of the AMP-related kinase (AMPK) induces renal vasodilatation and downregulates Nox-derived reactive oxygen species (ROS) generation. Redox Biol. 2020, 34, 101575. [Google Scholar] [CrossRef]
  36. Lacave, J.M.; Bilbao, E.; Gilliland, D.; Mura, F.; Dini, L.; Cajaraville, M.P.; Orbea, A. Bioaccumulation, cellular and molecular effects in adult zebrafish after exposure to cadmium sulphide nanoparticles and to ionic cadmium. Chemosphere 2020, 238, 124588. [Google Scholar] [CrossRef] [PubMed]
  37. Lopez-Sanjurjo, C.I.; Tovey, S.C.; Prole, D.L.; Taylor, C.W. Lysosomes shape Ins(1,4,5)P3-evoked Ca2+ signals by selectively sequestering Ca2+ released from the endoplasmic reticulum. J. Cell Sci. 2013, 126, 289–300. [Google Scholar] [CrossRef] [PubMed] [Green Version]
  38. Shi, W.; Xu, D.; Gu, J.; Xue, C.; Yang, B.; Fu, L.; Song, S.; Liu, D.; Zhou, W.; Lv, J.; et al. Saikosaponin-d inhibits proliferation by up-regulating autophagy via the CaMKKβ-AMPK-mTOR pathway in ADPKD cells. Mol. Cell Biochem. 2018, 449, 219–226. [Google Scholar] [CrossRef] [PubMed]
  39. Qu, J.; Zou, T.; Lin, Z. The roles of the ubiquitin-proteasome system in the endoplasmic reticulum stress pathway. Int. J. Mol. Sci. 2021, 22, 1526. [Google Scholar] [CrossRef] [PubMed]
  40. Reddy, S.S.; Shruthi, K.; Joy, D.; Reddy, G.B. 4-PBA prevents diabetic muscle atrophy in rats by modulating ER stress response and ubiquitin-proteasome system. Chem. Biol. Interact. 2019, 306, 70–77. [Google Scholar] [CrossRef]
  41. Shruthi, K.; Reddy, S.S.; Chitra, P.S.; Reddy, G.B. Ubiquitin-proteasome system and ER stress in the brain of diabetic rats. J. Cell. Biochem. 2019, 120, 5962–5973. [Google Scholar] [CrossRef] [PubMed]
Figure 1. Effects of NPS R-467 on Cd2+-induced apoptosis and dysregulated transient cytosolic Ca2+ homeostasis. (A) Cd2+ induced the expression of kidney injury biomarker KIM-1 in mRTEC. KIM-1: Green, DAPI: Blue. (B) Effects of R-467 on Cd2+-induced apoptosis of mRTEC cells. After being treated with CdCl2 (5 μM) or CdCl2 (5 μM)+R-467 (1 μM) for 24 h, the apoptosis of mRTEC cells was determined by flow cytometry staining by Annexin V-FITC/PI. The apoptosis percentage was calculated. (CH) Transient effects of Cd2+ and R-467 on cytosolic Ca2+ levels in mRTEC cells. After treated with CdCl2 (5 μM) or CdCl2 (5 μM)+R-467 (1 μM) or pretreated with TG (0.1 μM) and 2-APB (50 μM), the cytosolic Ca2+ level changes in mRTEC cells were determined by Fura-2/AM immediately. 2-APB: inhibitor of ER Ca2+ release channel IP3R, R-467: Calcimimetics, activator of Calcium sensing receptor, TG: inhibitor of SERCA. Results are presented as mean ± SD (n = 4 well cells/group). * Statistical significance between control and treatments, or between treatments, p < 0.05, using one-way ANOVA followed by Duncan’s multiple range test.
Ijms 24 05979 g001
Figure 2. Effects of ER Ca2+ channels in Cd2+-dysregulated ER Ca2+ homeostasis. (A) Short-term effects of Cd2+ on cytosolic Ca2+ content in mRTEC cells. Cells were treated with CdCl2 (5 μM) for 0–4 h, and the cytosolic Ca2+ levels in mRTEC cells were determined by Fluo-3/AM in Ca2+ containing and Ca2+-free medium, respectively. (B) Steady cytosolic Ca2+ levels in mRTEC cells were determined by Fura-2/AM after being treated with CdCl2 (5 μM) for 4 h. (C) Co-localization of ER Ca2+ content indicator Mag-Fluo-4/AM staining (Green) with ER tracker (Red). (D) Effects of short-term Cd2+ treatment on ER Ca2+ content. After being treated with Cd2+ (5 μM) for 4 h, the ER Ca2+ content in mRTEC cells was determined by Mag-Fluo-4/AM. (E) Effects of SERCA modulators on Cd2+-regulated ER Ca2+ content in mRTEC cells. After being treated with Cd2+ (5 μM) for 24 h or pretreated with CDN1163 (10 μM) or R-467 (1 μM) for 1 h, followed with TG (0.1 μM) for 6 h. The ER Ca2+ content in mRTEC cells was determined by Mag-Fluo-4/AM. Results are presented as mean ± SD (n = 4 well cells/group). * Statistical significance difference between control and Cd2+ treatment or between treatments. NS—No significant difference. p < 0.05, using one-way ANOVA followed by Duncan’s multiple range test. CDN1163: agonist of ER Ca2+ reuptake channel SERCA, TG: inhibitor of SERCA.
Ijms 24 05979 g002
Figure 3. Effects of SERCA modulators on ER stress, autophagy, and apoptosis. (A) Effect of Cd2+, CDN1163, and TG on the expression of ER stress biomarkers BiP and PDI, autophagy biomarker p62, and apoptosis biomarker cleaved caspase-3 (CC-3) were detected by Western blotting. (BE) Quantification of the relative protein levels was performed using the software Image J 1.54c. (F,G) Effect of Cd2+ on the expression of PDI and CC-3 detected by Western blotting and quantification by Image J. NC—negative control. OE: SERCA2 overexpression. (H) MTT detection of cell viability in Cd2+-treated SERCA2 overexpressed mRTEC cells. Results are presented as mean ± SD (n = 4 well cells/group). * indicates statistical significance between control and Cd2+ treatment or between treatments. NS means no significant difference. p < 0.05, using one-way ANOVA followed by Duncan’s multiple range test.
Ijms 24 05979 g003
Figure 4. Effects of R-467 on Cd2+-regulated SERCA2 and p-PLB expression in mice kidney cells and tissues. (A) Effects of R-467 on Cd2+-regulated SERCA2 and p-PLB expression in mRTEC cells were detected by Western blotting. (B) Quantification of the relative protein levels was performed using the software Image J 1.54c. Results are presented as mean ± SD (n = 4 well cells/group). * Statistical significance between control and Cd2+ treatment or between treatments. p < 0.05, using one-way ANOVA followed by Duncan’s multiple range test. Effects of R-467 on Cd2+-regulated SERCA2 and p-PLB expression in mRTEC cells (C) and mice kidney tissues (D) were detected by immunohistochemistry. After being treated by Cd2+ for 24 h, with or without R-467 pretreatment, cells were fixed (n = 4 well cells/group). After being exposed to Cd2+ for 28 days, mice kidney tissues were collected (n = 5 mice/group). The protein levels of SERCA2 and p-PLB in cells and tissues were investigated by immunofluorescence. SERCA2 (green), p-PLB (green), DAPI (blue). The red arrow refers to the glomerulus, and the yellow arrow refers to the renal proximal tubule.
Ijms 24 05979 g004
Figure 5. Effects of Cd2+ on SERCA2 stability in mRTEC cells. (A,B) After being treated with Cd2+ (0–10 μM) for 24 h or treated with Cd2+ (5 μM) or Cd (5 μM) + R-467 (1 μM) for 24 h, mRTEC cells were collected for RNA extraction, and the SERCA2 mRNA levels detected by RT-PCR. (C) Effects of MG132 and CQ on Cd2+-induced degradation of SERCA2. The mRTEC cells were pretreated with CQ (20 μM) for 1 h, followed by treatment with Cd2+ (5 μM) for 24 h, or Cd2+ (5 μM) for 18 h + MG132 (10 μM) for 6 h, and then the proteins were extracted for Western blotting analysis. (E) Effects of Cd2+ on half-life of SERCA2 protein. Cells were treated with Cycloheximide (CHX) (10 μg/mL) for 3 and 6 h or pretreated with Cd2+ (5 μM) for 24 h, and the protein was extracted for Western blotting analysis. (D,F) Quantification of the relative protein levels of SERCA2 was performed using the software Image J 1.54c. * indicates statistical significance between control and Cd2+ treatment or between treatments. NS: no significant difference. (n = 4 well cells/group) p < 0.05, using one-way ANOVA followed by Duncan’s multiple range test (A,B,D) and Student’s t-test (F).
Ijms 24 05979 g005
Disclaimer/Publisher’s Note: The statements, opinions and data contained in all publications are solely those of the individual author(s) and contributor(s) and not of MDPI and/or the editor(s). MDPI and/or the editor(s) disclaim responsibility for any injury to people or property resulting from any ideas, methods, instructions or products referred to in the content.

