
Could Toll-like Receptor 2 Serve as Biomarker to Detect Advanced Gastric Cancer?

 , ,
, ,  ,
,
Abstract
:1. Introduction
2. Results
2.1. Characteristics of Selected Peripheral Blood Count Parameters and Immunophenotype Assessment of Patients with Gastric Cancer and the Control Group
2.2. Evaluation of the Percentage of Selected Populations of Peripheral Blood Immune Cells Expressing TLR2 and TLR2 Serum Concentration in Patients with Gastric Cancer Compared to Patients in the Control Group
2.3. Detailed Analysis of the Percentage of Selected Populations of Peripheral Blood Immune Cells Expressing TLR2 in Patients with Gastric Cancer in Relation to Lauren Classification, Grading and Tumor Staging Based on TNM Classification
2.3.1. Evaluation of the Prevalence of Selected Immune Cell Populations Expressing TLR2 and sTLR2 Serum Concentration in Patients with Gastric Cancer in the Context of Lauren’s Classification
2.3.2. Evaluation of the Prevalence of Selected Immune Cell Populations Expressing TLR2 and sTLR2 Serum Concentration in Patients with Gastric Cancer in the Context of Grading (G1–G3)
2.3.3. Evaluation of the Prevalence of Selected Immune Cell Populations Expressing TLR2 and sTLR2 Serum Concentration in Patients with Gastric Cancer Depending on the Tumor Staging Based on the TNM Classification
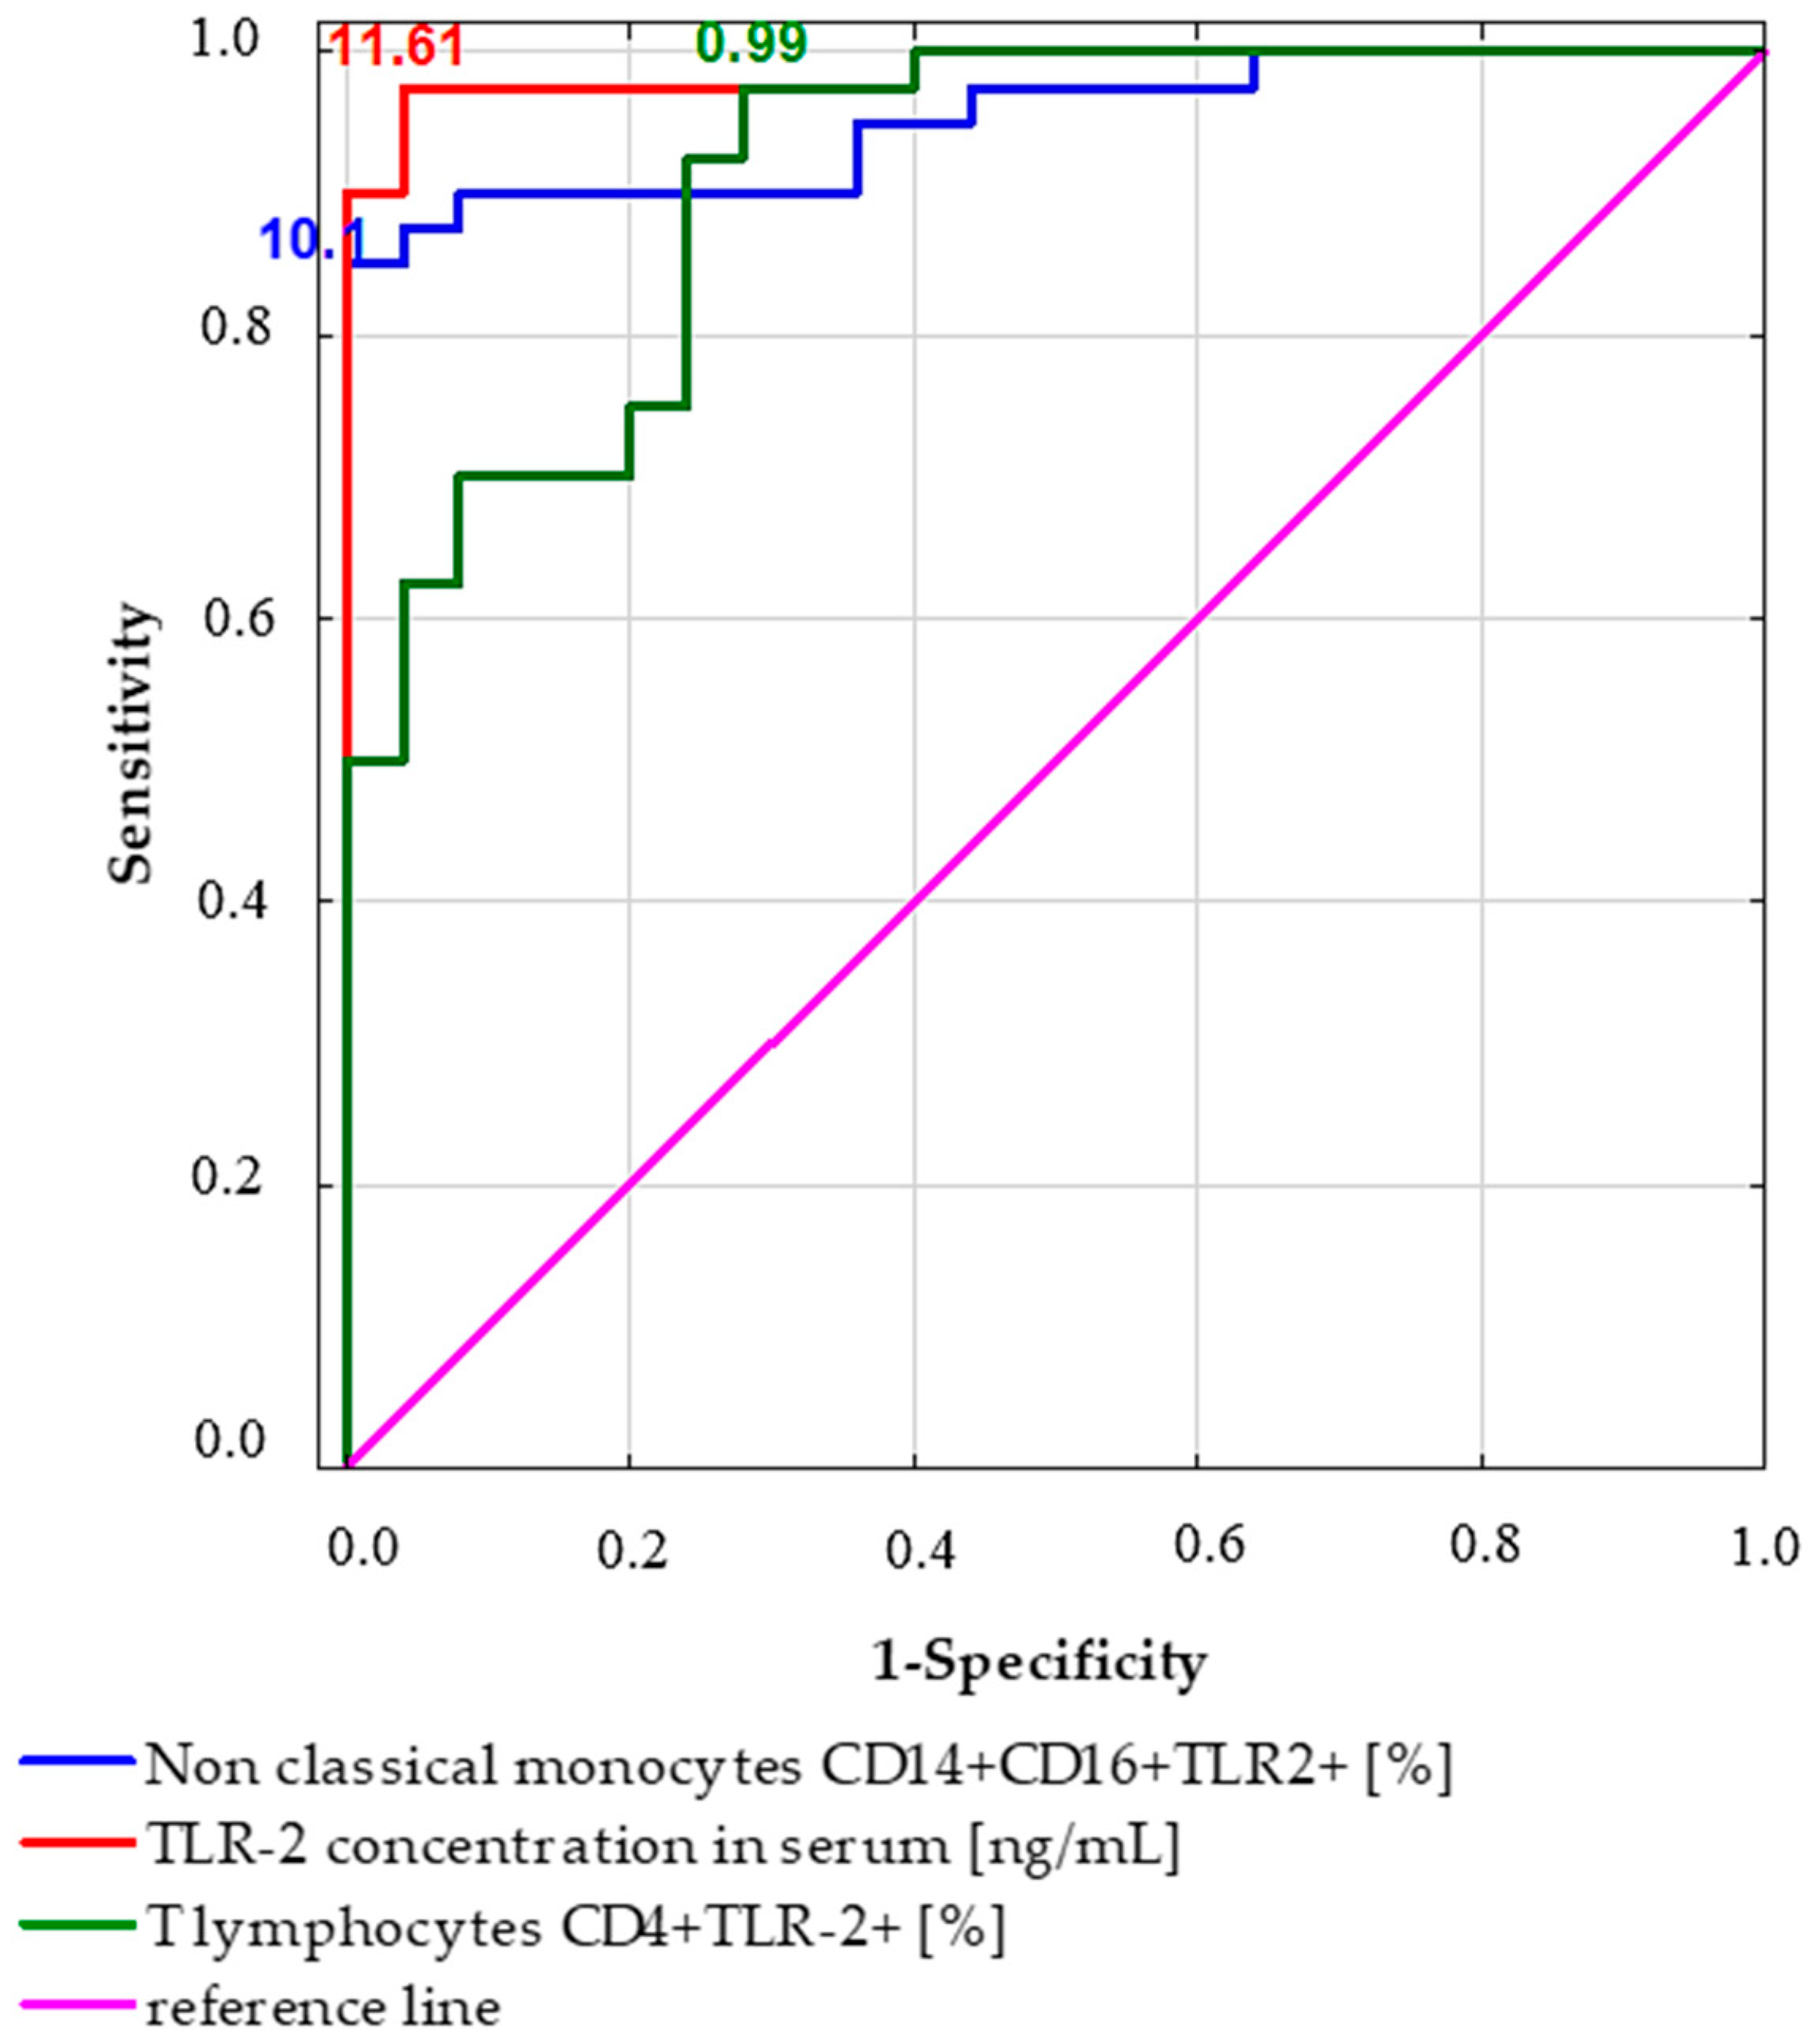
2.4. Receiver Operating Characteristic (ROC) Curve Analysis to Determine the Diagnostic Accuracy of TLR2 Expression in Patients with Gastric Cancer vs. Controls
3. Discussion
4. Materials and Methods
4.1. Characteristics of Patients Diagnosed with Gastric Cancer and Patients from the Control Group and Research Material
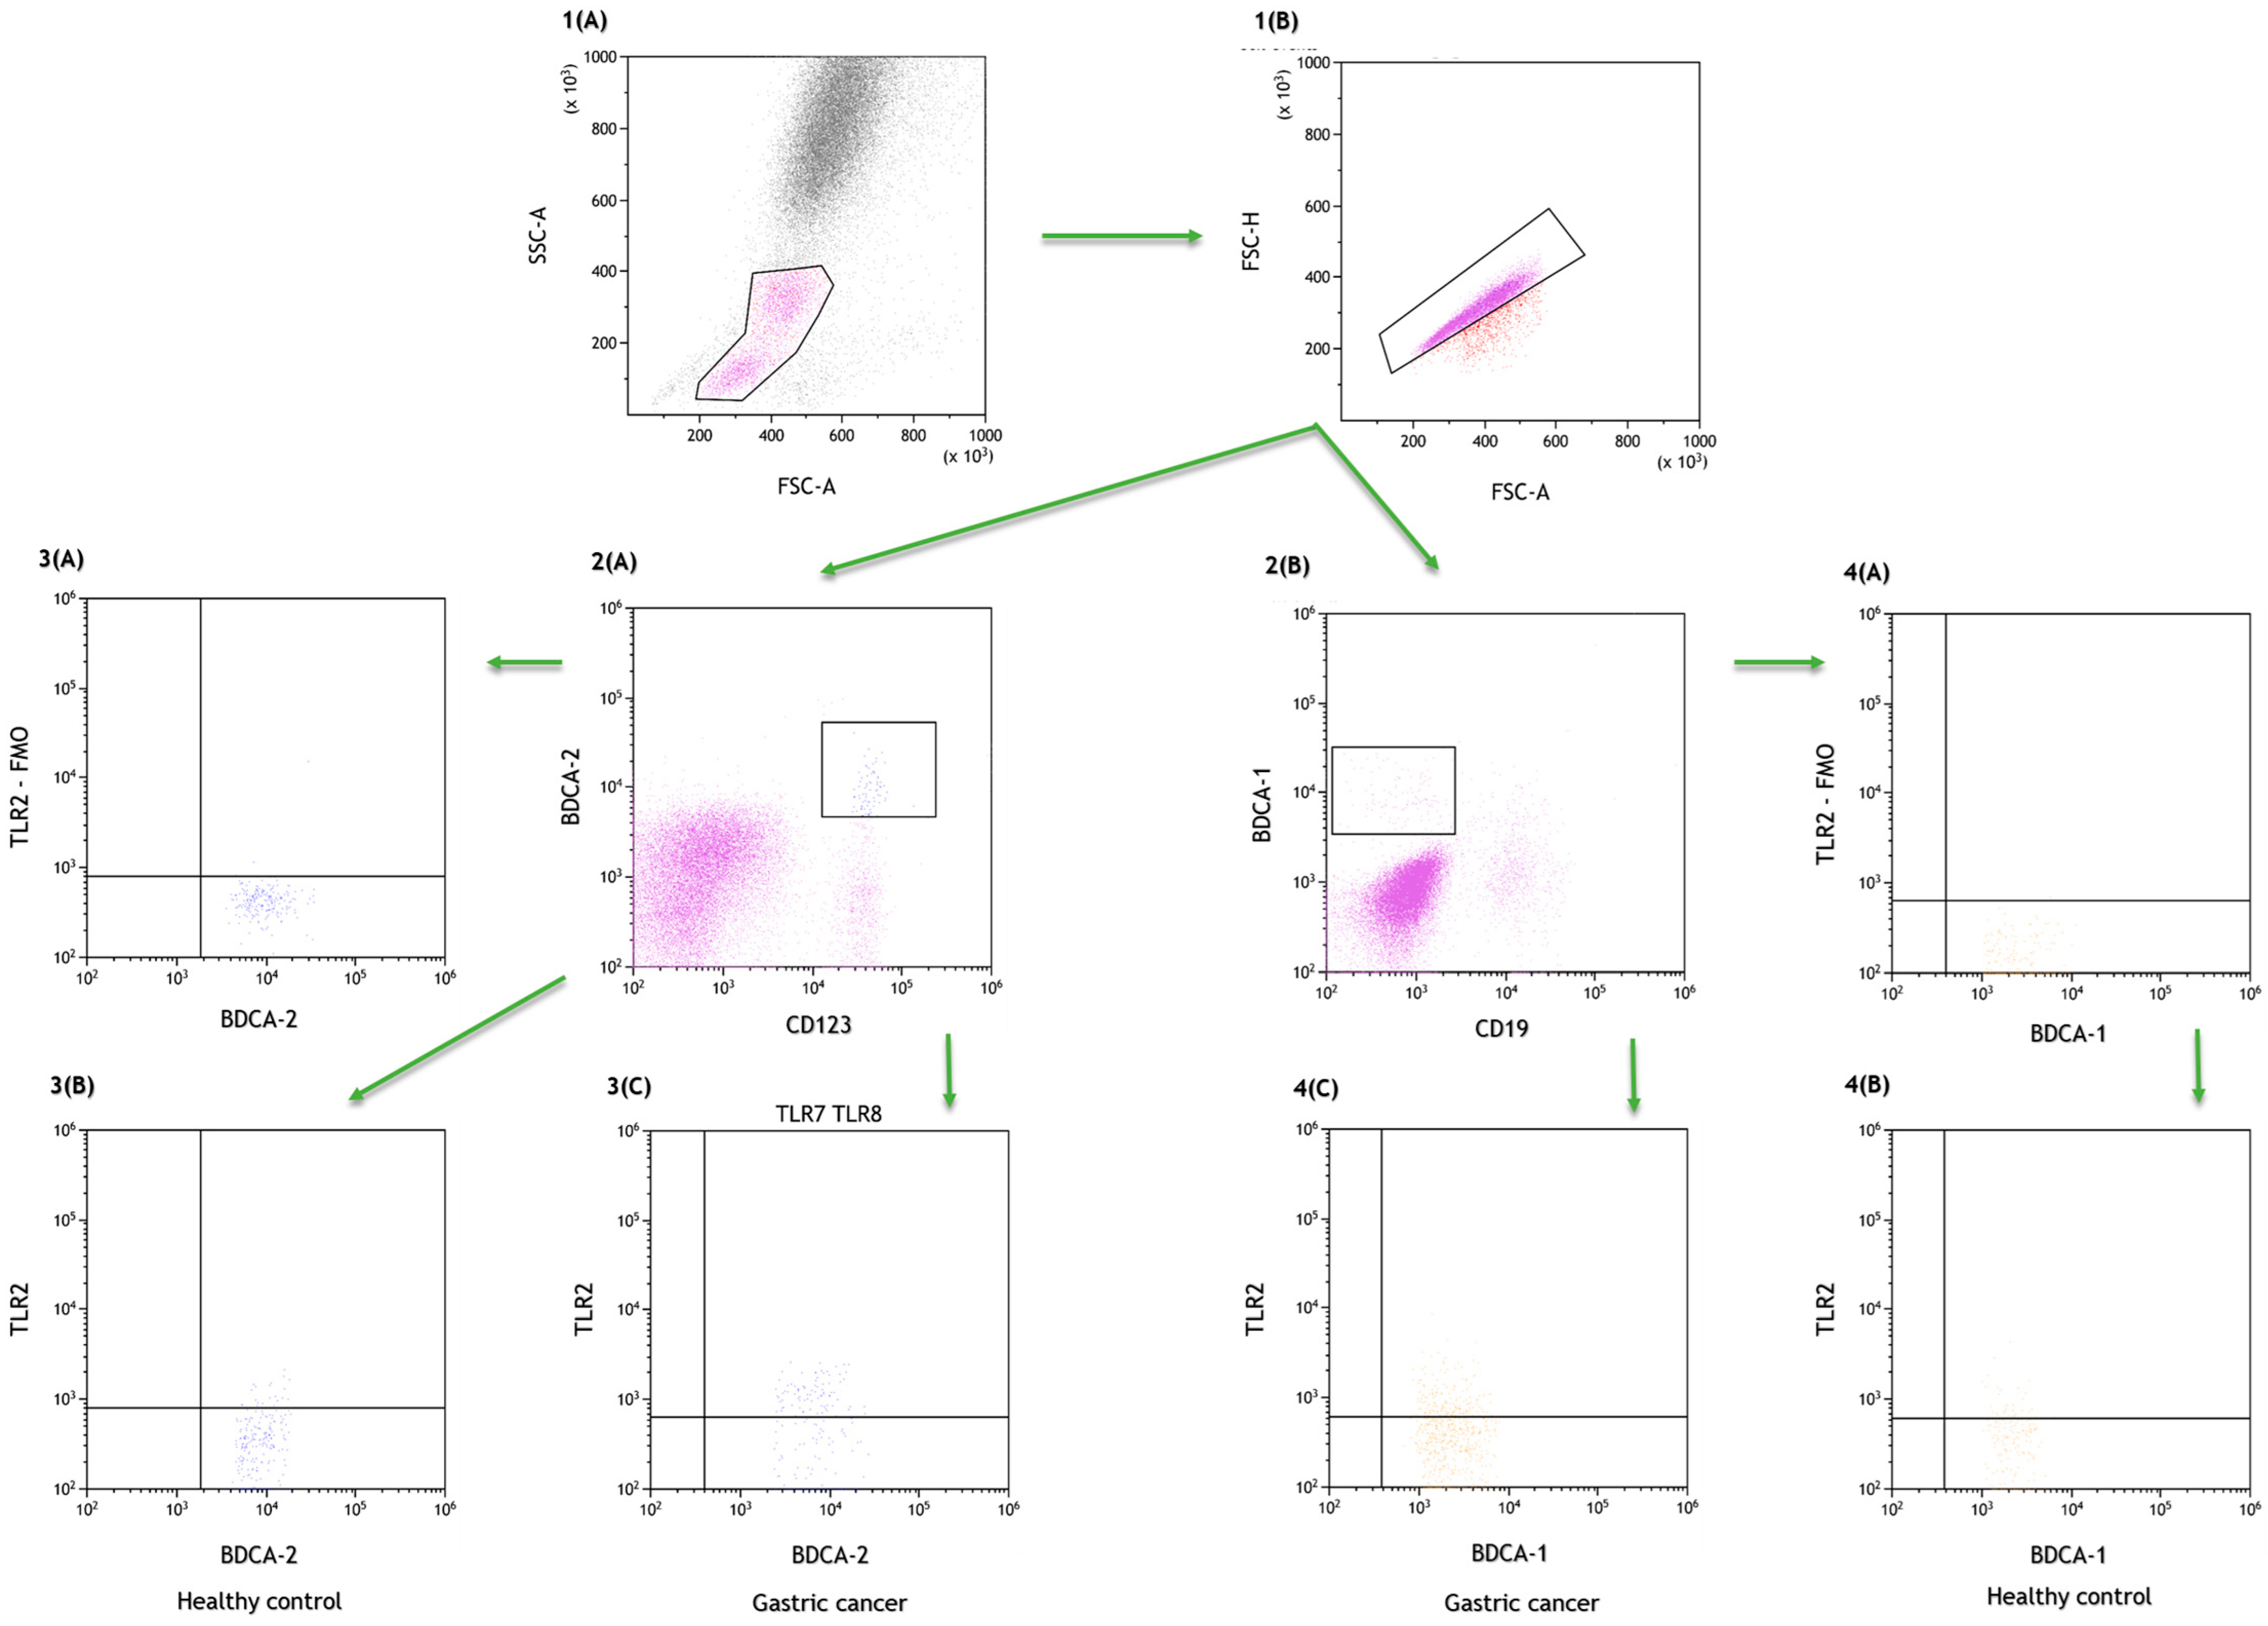
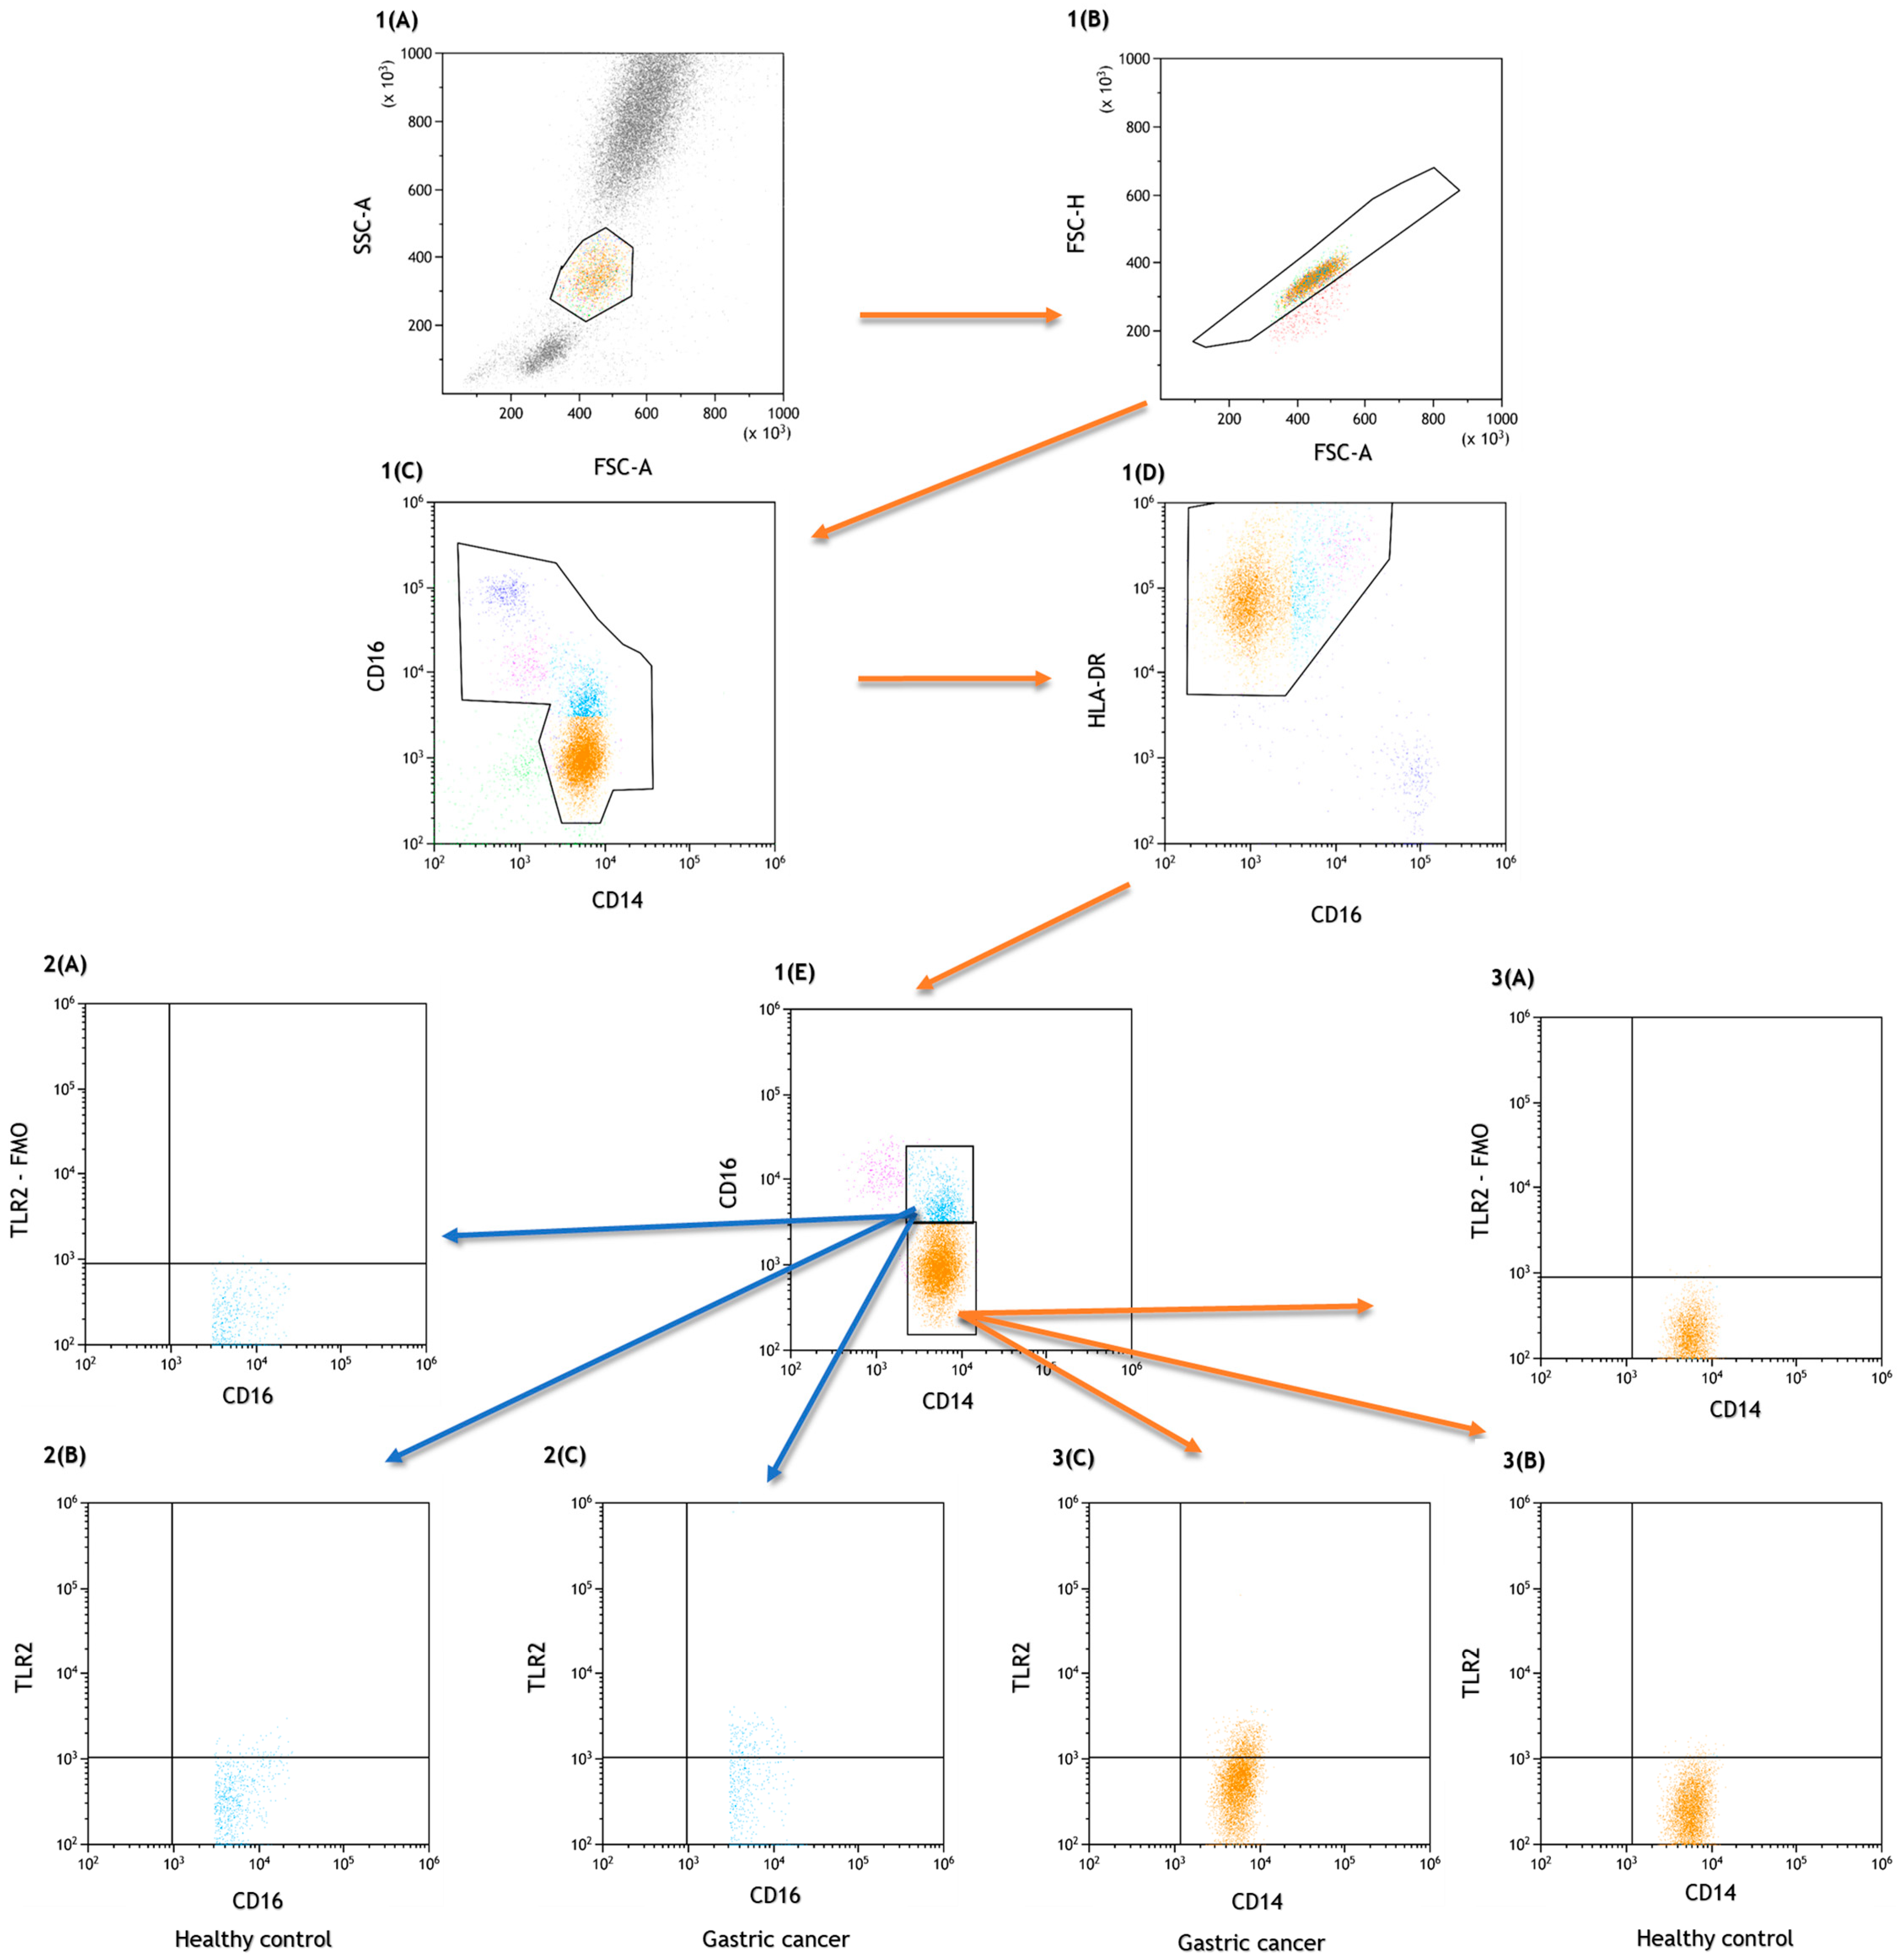
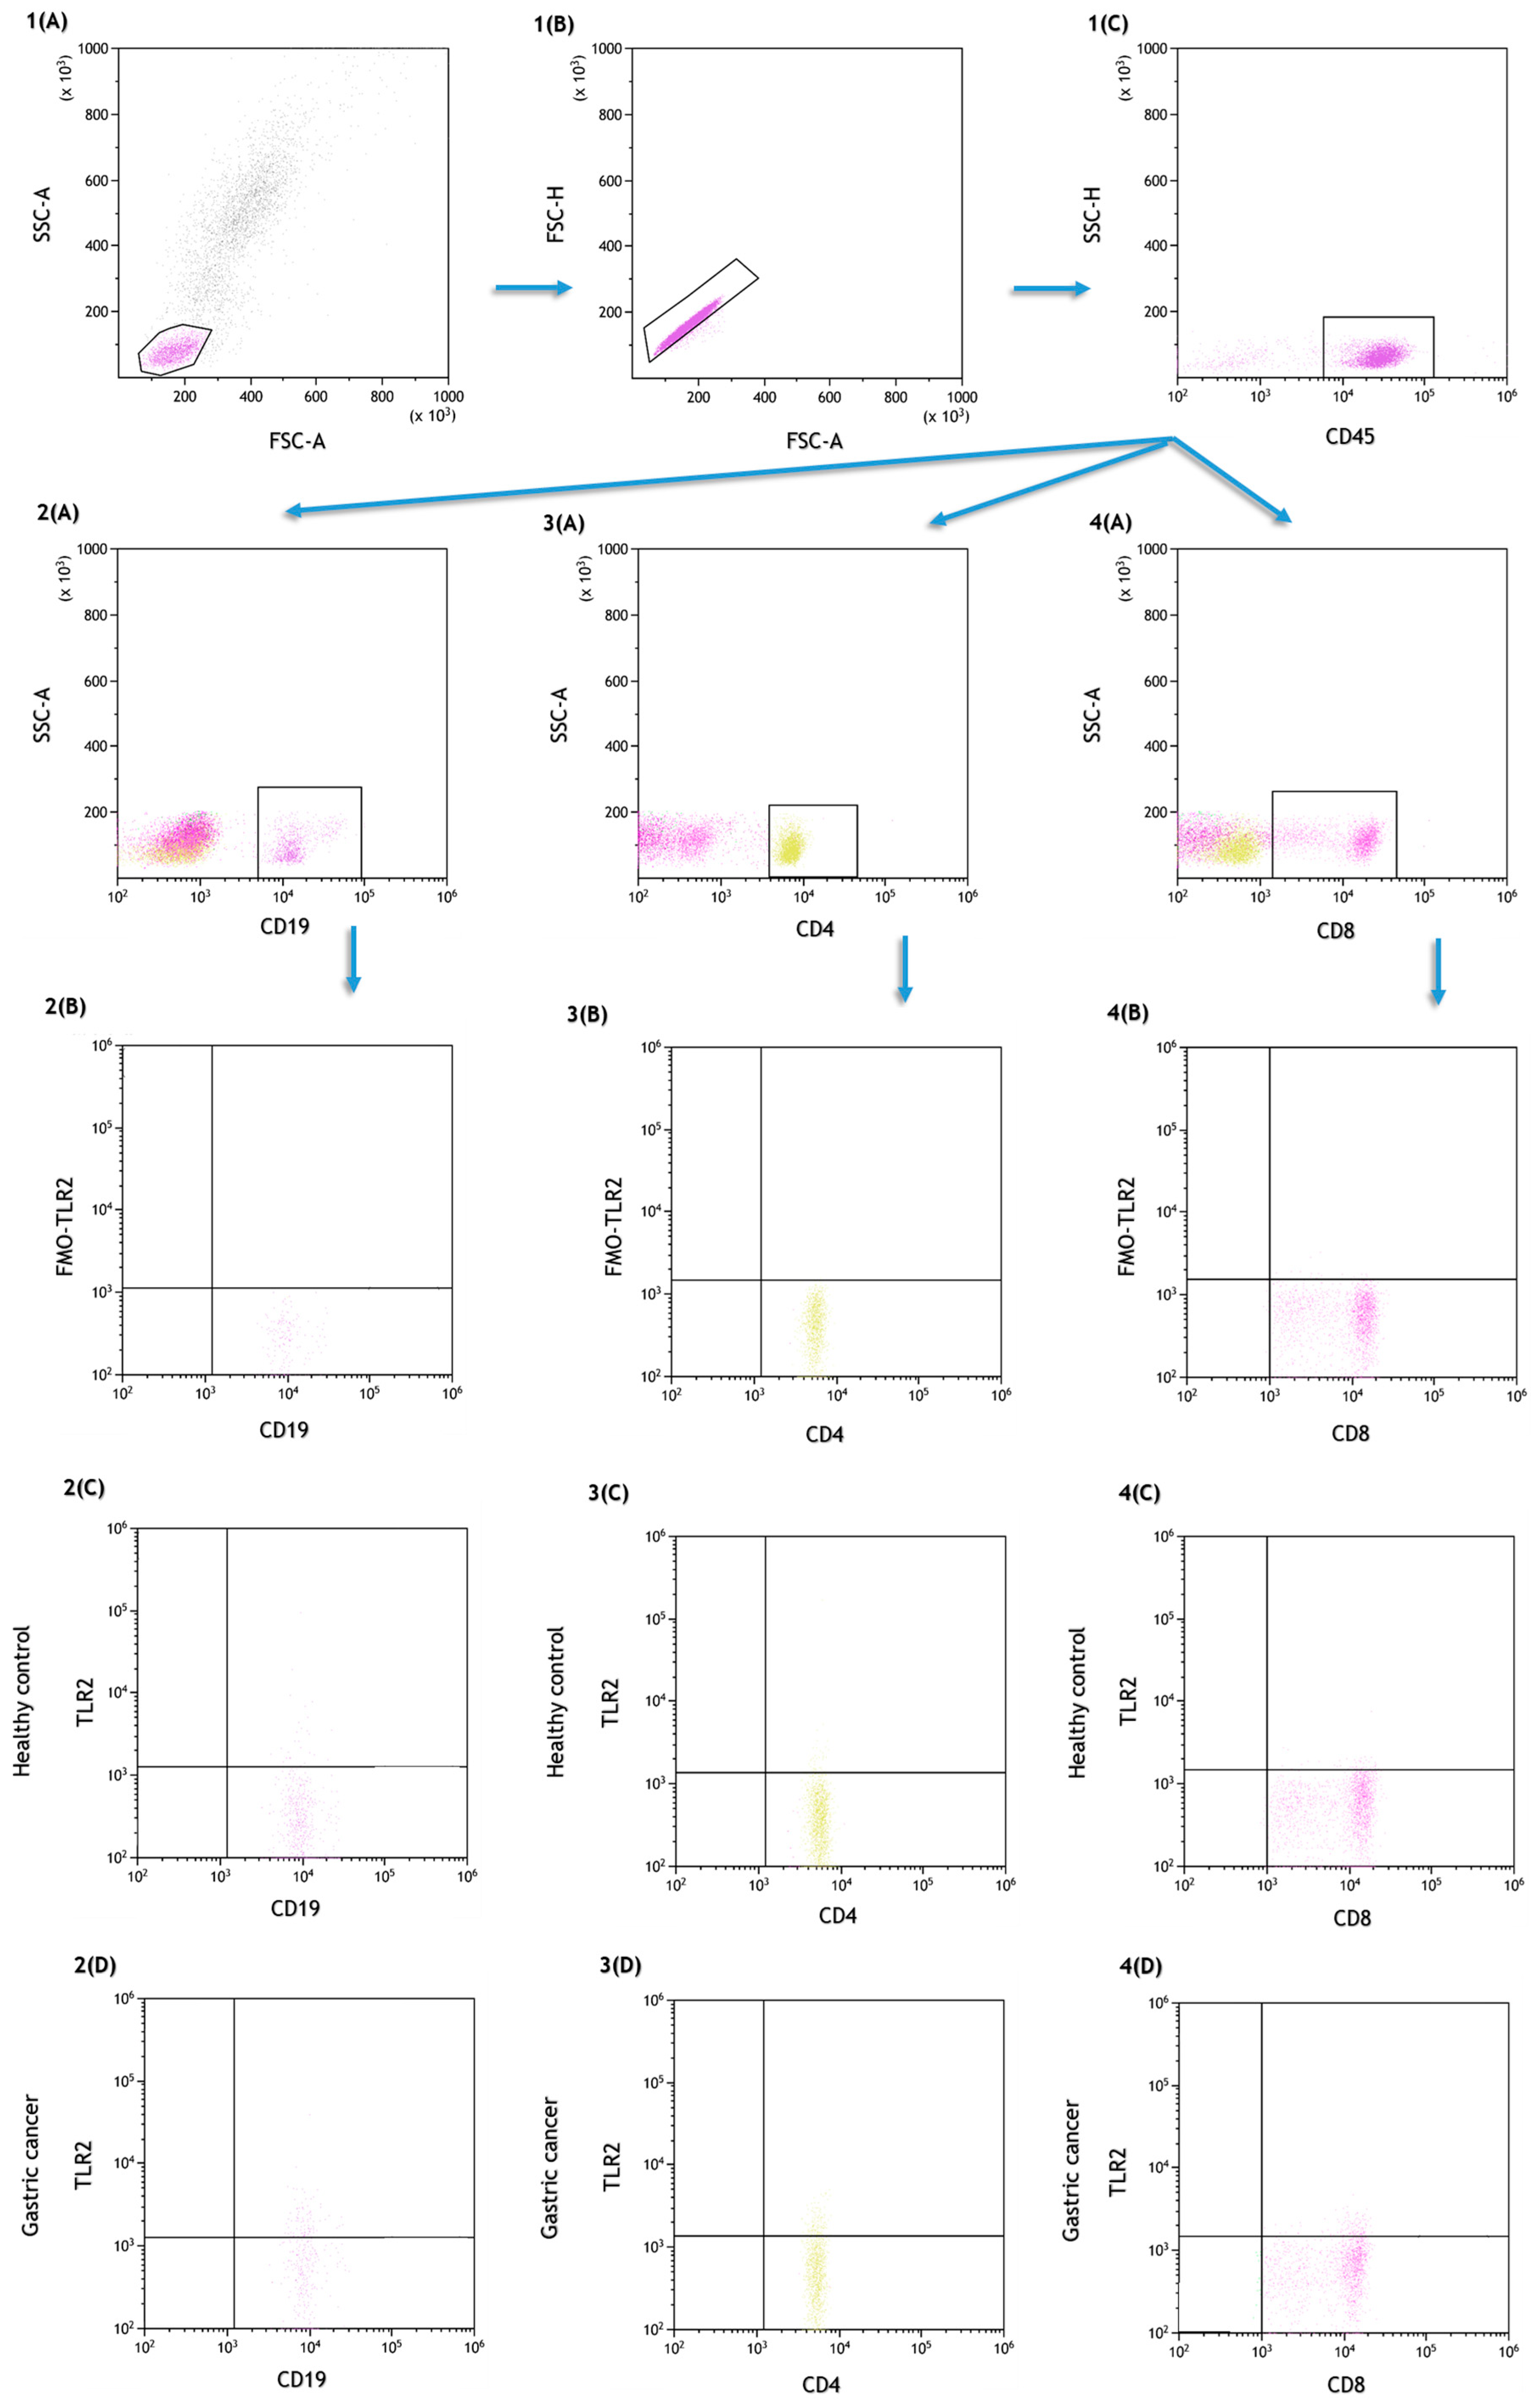
4.2. Assessment of the Percentage of Lymphocytes, Dendritic Cells and Peripheral Blood Monocytes Expressing TLR2
4.3. Evaluation of TLR2 Concentration in Plasma by Enzyme Immunoassay
4.4. Statistical Analysis of the Obtained Results
5. Conclusions
Author Contributions
Funding
Institutional Review Board Statement
Informed Consent Statement
Data Availability Statement
Conflicts of Interest
References
- Cancer Tomorrow. Available online: https://gco.iarc.fr/tomorrow/en/dataviz/isotype (accessed on 8 January 2023).
- Stomach Cancer Statistics. WCRF International. Available online: https://www.wcrf.org/cancer-trends/stomach-cancer-statistics/ (accessed on 8 January 2023).
- Ilic, M.; Ilic, I. Epidemiology of Stomach Cancer. World J. Gastroenterol. 2022, 28, 1187–1203. [Google Scholar] [CrossRef] [PubMed]
- Stomach (Gastric) Cancer Key Statistics. Available online: https://www.cancer.org/cancer/stomach-cancer/about/key-statistics.html (accessed on 8 January 2023).
- Cancer of the Stomach—Cancer Stat Facts. Available online: https://seer.cancer.gov/statfacts/html/stomach.html (accessed on 8 January 2023).
- Cancer Tomorrow. Available online: https://gco.iarc.fr/tomorrow/en/dataviz/isotype?cancers=7&single_unit=50000 (accessed on 8 January 2023).
- Yusefi, A.R.; Lankarani, K.B.; Bastani, P.; Radinmanesh, M.; Kavosi, Z. Risk Factors for Gastric Cancer: A Systematic Review. Asian Pac. J. Cancer Prev. 2018, 19, 591–603. [Google Scholar] [CrossRef] [PubMed]
- Zali, H.; Rezaei-Tavirani, M.; Azodi, M. Gastric Cancer: Prevention, Risk Factors and Treatment. Gastroenterol. Hepatol. Bed. Bench. 2011, 4, 175–185. [Google Scholar] [PubMed]
- Ramos, M.F.K.P.; Ribeiro Júnior, U.; Viscondi, J.K.Y.; Zilberstein, B.; Cecconello, I.; Eluf-Neto, J. Risk Factors Associated with the Development of Gastric Cancer—Case-Control Study. Rev. Assoc. Med. Bras. 2018, 64, 611–619. [Google Scholar] [CrossRef] [PubMed]
- Wang, M.; Busuttil, R.A.; Pattison, S.; Neeson, P.J.; Boussioutas, A. Immunological Battlefield in Gastric Cancer and Role of Immunotherapies. World J. Gastroenterol. 2016, 22, 6373–6384. [Google Scholar] [CrossRef]
- Kwak, Y.; Seo, A.N.; Lee, H.E.; Lee, H.S. Tumor Immune Response and Immunotherapy in Gastric Cancer. J. Pathol. Transl. Med. 2020, 54, 20–33. [Google Scholar] [CrossRef] [Green Version]
- Sukri, A.; Hanafiah, A.; Kosai, N.R. The Roles of Immune Cells in Gastric Cancer: Anti-Cancer or Pro-Cancer? Cancers 2022, 14, 3922. [Google Scholar] [CrossRef]
- Majewski, M.; Mertowska, P.; Mertowski, S.; Smolak, K.; Grywalska, E.; Torres, K. Microbiota and the Immune System—Actors in the Gastric Cancer Story. Cancers 2022, 14, 3832. [Google Scholar] [CrossRef]
- Cui, L.; Wang, X.; Zhang, D. TLRs as a Promise Target Along With Immune Checkpoint Against Gastric Cancer. Front. Cell Dev. Biol. 2021, 8, 611444. [Google Scholar] [CrossRef]
- Prasad, S.B.; Kumar, R.; Prasad, S.B.; Kumar, R. Role of Toll-Like Receptor (TLR)-Signaling in Cancer Progression and Treatment; IntechOpen: London, UK, 2020; ISBN 978-1-83968-417-3. [Google Scholar]
- Javaid, N.; Choi, S. Toll-like Receptors from the Perspective of Cancer Treatment. Cancers 2020, 12, 297. [Google Scholar] [CrossRef] [Green Version]
- Mokhtari, Y.; Pourbagheri-Sigaroodi, A.; Zafari, P.; Bagheri, N.; Ghaffari, S.H.; Bashash, D. Toll-like Receptors (TLRs): An Old Family of Immune Receptors with a New Face in Cancer Pathogenesis. J. Cell. Mol. Med. 2021, 25, 639–651. [Google Scholar] [CrossRef]
- Chen, X.; Zhang, Y.; Fu, Y. The Critical Role of Toll-like Receptor-Mediated Signaling in Cancer Immunotherapy. Med. Drug Discov. 2022, 14, 100122. [Google Scholar] [CrossRef]
- Liu, Y.D.; Yu, L.; Ying, L.; Balic, J.; Gao, H.; Deng, N.T.; West, A.; Yan, F.; Ji, C.B.; Gough, D.; et al. Toll-like Receptor 2 Regulates Metabolic Reprogramming in Gastric Cancer via Superoxide Dismutase 2. Int. J. Cancer 2019, 144, 3056–3069. [Google Scholar] [CrossRef] [PubMed] [Green Version]
- West, A.C.; Tang, K.; Tye, H.; Yu, L.; Deng, N.; Najdovska, M.; Lin, S.J.; Balic, J.J.; Okochi-Takada, E.; McGuirk, P.; et al. Identification of a TLR2-Regulated Gene Signature Associated with Tumor Cell Growth in Gastric Cancer. Oncogene 2017, 36, 5134–5144. [Google Scholar] [CrossRef]
- Shcheblyakov, D.V.; Logunov, D.Y.; Tukhvatulin, A.I.; Shmarov, M.M.; Naroditsky, B.S.; Gintsburg, A.L. Toll-Like Receptors (TLRs): The Role in Tumor Progression. Acta Nat. 2010, 2, 21–29. [Google Scholar] [CrossRef] [Green Version]
- Tye, H.; Kennedy, C.L.; Najdovska, M.; McLeod, L.; McCormack, W.; Hughes, N.; Dev, A.; Sievert, W.; Ooi, C.H.; Ishikawa, T.; et al. STAT3-Driven Upregulation of TLR2 Promotes Gastric Tumorigenesis Independent of Tumor Inflammation. Cancer Cell 2012, 22, 466–478. [Google Scholar] [CrossRef] [Green Version]
- Jenkins, B.; Tye, H.; Kennedy, C.; Najdovska, M.; McLeod, L.; Sievert, W.; Oshima, M.; Tan, P. O017 TLR2 Promotes Tumorigenesis Independent of Inflammation in STAT3-Driven Gastric Cancer. Cytokine 2012, 59, 505. [Google Scholar] [CrossRef]
- Xu, J.; Guo, R.; Jia, J.; He, Y.; He, S. Activation of Toll-like Receptor 2 Enhances Peripheral and Tumor-Infiltrating CD8+ T Cell Cytotoxicity in Patients with Gastric Cancer. BMC Immunol. 2021, 22, 67. [Google Scholar] [CrossRef] [PubMed]
- Yang, H.; Wang, B.; Yan, J.; Wang, T.; Zhou, X.-N.; Wen, H.-Y.; Zhu, X.-M. Toll-like Receptor 2 Promotes Invasion by SGC-7901 Human Gastric Carcinoma Cells and Is Associated with Gastric Carcinoma Metastasis. Ann. Clin. Lab. Sci. 2014, 44, 158–166. [Google Scholar]
- Kasurinen, A.; Hagström, J.; Laitinen, A.; Kokkola, A.; Böckelman, C.; Haglund, C. Evaluation of Toll-like Receptors as Prognostic Biomarkers in Gastric Cancer: High Tissue TLR5 Predicts a Better Outcome. Sci. Rep. 2019, 9, 12553. [Google Scholar] [CrossRef] [Green Version]
- Goto, Y.; Arigami, T.; Kitago, M.; Nguyen, S.L.; Narita, N.; Ferrone, S.; Morton, D.L.; Irie, R.F.; Hoon, D.S.B. Activation of Toll-like Receptors 2, 3, and 4 on Human Melanoma Cells Induces Inflammatory Factors. Mol. Cancer Ther. 2008, 7, 3642–3653. [Google Scholar] [CrossRef] [Green Version]
- Beilmann-Lehtonen, I.; Böckelman, C.; Mustonen, H.; Koskensalo, S.; Hagström, J.; Haglund, C. The Prognostic Role of Tissue TLR2 and TLR4 in Colorectal Cancer. Virchows Arch. 2020, 477, 705–715. [Google Scholar] [CrossRef] [PubMed]
- Zhao, D.; Wu, Y.; Zhao, T.; Jia, Z.; Cao, D.; Yang, N.; Wang, Y.; Cao, X.; Jiang, J. Single-Nucleotide Polymorphisms in Toll-like Receptor Genes Are Associated with the Prognosis of Gastric Cancer and Are Not Associated with Helicobacter Pylori Infection. Infect. Genet. Evol. 2019, 73, 384–389. [Google Scholar] [CrossRef] [PubMed]
- Di Lorenzo, A.; Bolli, E.; Tarone, L.; Cavallo, F.; Conti, L. Toll-Like Receptor 2 at the Crossroad between Cancer Cells, the Immune System, and the Microbiota. Int. J. Mol. Sci. 2020, 21, 9418. [Google Scholar] [CrossRef] [PubMed]


| Parameter [%] | Gastric Cancer Group (n = 40) | Healthy Control Group (n = 25) | Z Value | p Value |
|---|---|---|---|---|
| Median (IQR) | ||||
| White blood cells [103/mm3] | 7.64 (6.5–8.9) | 7.27 (7.0–7.5) | 1.54 | 0.12 |
| Neutrophils [103/mm3] | 4.40 (3.7–5.7) | 4.44 (3.7–4.6) | 1.25 | 0.21 |
| Monocytes [103/mm3] | 0.48 (0.4–0.6) | 0.47 (0.4–0.5) | 0.80 | 0.42 |
| Lymphocytes [103/mm3] | 2.23 (1.9–2.6) | 2.61 (2.3–2.8) | −2.16 | 0.03 |
| T lymphocytes CD3+ [%] | 72.82 (70.1–74.2) | 71.28 (70.3–73.3) | 0.90 | 0.37 |
| B lymphocytes CD19+ [%] | 10.98 (70.1–12.9) | 11.75 (10.7–13.3) | −1.31 | 0.19 |
| NK cells CD3-CD16+CD56+ [%] | 12.03 (10.0–12.9) | 14.24 (12.9–16.8) | −3.76 | 0.0002 * |
| NKT-like cells CD3+CD16+CD56+ [%] | 2.19 (1.2–3.9) | 3.22 (2.4–3.5) | −1.59 | 0.11 |
| T lymphocytes CD3+CD4+ [%] | 39.62 (37.2–41.9) | 40.44 (38.0–42.6) | −1.17 | 0.24 |
| T lymphocytes CD3+CD8+ [%] | 29.17 (26.6–32.0) | 30.49 (28.1–32.9) | −1.43 | 0.15 |
| T lymphocytes ratio CD3+CD4+/T CD3+CD8+ | 1.36 (1.2–1.6) | 1.28 (1.2–1.4) | 0.68 | 0.50 |
| Myeloid dendritic cells BDCA1+CD19- [%] | 0.35 (0.26–0.52) | 0.37 (0.2–0.5) | 0.22 | 0.83 |
| Plasmacytoid dendritic cells BDCA2+CD123+ [%] | 0.35 (0.28–0.49) | 0.26 (0.2–0.4) | 2.62 | 0.009* |
| MDC/PDC ratio | 1.04 (0.6–1.5) | 1.6 (0.7–2.3) | −1.78 | 0.075 |
| Classical monocytes CD14+CD16- [%] | 87.31 (83.2–90.7) | 91.96 (89.0–93.8) | −3.55 | 0.0004 * |
| Non-classical monocytes CD14+CD16+ [%] | 8.32 (5.8–11.9) | 4.60 (3.5–5.9) | 3.85 | 0.00011 * |
| Parameter [%] | Gastric Cancer Group (n = 40) | Healthy Control Group (n = 25) | Z Value | p Value |
|---|---|---|---|---|
| Median (IQR) | ||||
| T lymphocytes CD4+TLR2+ [%] | 2.67 (1.64–6.0) | 0.81 (0.5–1.0) | 5.56 | <0.0001 * |
| T lymphocytes CD8+TLR2+ [%] | 2.43 (1.2–6.6) | 0.71 (0.4–1.9) | 3.94 | <0.0001 * |
| B lymphocytes CD19+TLR2+ [%] | 4.12 (2.9–6.1) | 2.48 (2.1–3.3) | 3.52 | 0.0004 * |
| Myeloid dendritic cells BDCA1+CD19-TLR2+ [%] | 16.67 (6.8–29.2) | 6.8 (2.1–8.5) | 3.92 | <0.0001 * |
| Plasmacytoid dendritic cells BDCA2+CD123+ TLR2+ [%] | 12.5 (7.0–18.2) | 5.77 (4.5–9.2) | 3.63 | 0.0003 * |
| Classical monocytes CD14+CD16-TLR2+ [%] | 6.21 (4.6–12.8) | 3.96 (3.3–6.0) | 3.31 | 0.0009 * |
| Non-classical monocytes CD14+CD16+TLR2+ [%] | 14.43 (12.3–17.7) | 4.65 (3.2–7.1) | 6.09 | <0.0001 * |
| sTLR2 concentration in serum [ng/mL] | 19.69 (15.0–26.4) | 4.92 (2.7–9.0) | 6.56 | <0.0001 * |
| Parameter [%] | Intestinal Type (n = 17) | Diffuse Type (n = 23) | p Value |
|---|---|---|---|
| Median (IQR) | |||
| T lymphocytes CD4+TLR2+ [%] | 2.03 (1.4–2.6) | 4.21 (2.1–10.7) | 0.009 * |
| T lymphocytes CD8+TLR2+ [%] | 1.6 (1.0–2.4) | 4.12 (1.8–9.9) | 0.009 * |
| B lymphocytes CD19+TLR2+ [%] | 3.09 (2.1–4.0) | 5.53 (3.1–7.3) | 0.014 * |
| Myeloid dendritic cells BDCA1+CD19-TLR2+ [%] | 10.24 (3.3–16.7) | 25.36 (12.0–30.6) | 0.011 * |
| Plasmacytoid dendritic cells BDCA2+CD123+ TLR2+ [%] | 8.33 (5.3–17.1) | 16.67 (9.1–21.4) | 0.029 * |
| Classical monocytes CD14+CD16-TLR2+ [%] | 5.79 (3.7–12.6) | 6.38 (4.9–13.5) | 0.30 |
| Non-classical monocytes CD14+CD16+TLR2+ [%] | 13.89 (10.1–14.9) | 15.21 (13.6–23.6) | 0.04 |
| sTLRs2 concentration in serum [ng/mL] | 15.09 (13.3–18.4) | 25.36 (19.8–29.3) | 0.0009 * |
| Parameter [%] | G1 (n = 10) | G2 (n = 13) | G3 (n = 17) | p Value |
|---|---|---|---|---|
| Median (IQR) | ||||
| T lymphocytes CD4+TLR-2+ [%] | 1.7 (1.0–2.6) | 2.27 (2.0–4.1) | 4.79 (3.6–10.8) | 0.002 * |
| T lymphocytes CD8+TLR-2+ [%] | 1.37 (0.6–2.4) | 2.1 (1.6–4.1) | 5.65 (3.5–9.9) | 0.002 * |
| B lymphocytes CD19+TLR-2+ [%] | 2.69 (1.8–4.0) | 3.2 (3.1–5.5) | 5.62 (4.5–9.8) | 0.003 * |
| Myeloid dendritic cells BDCA1+CD19-TLR2+ [%] | 3.56 (2.3–16.7) | 12.95 (10.2–23.1) | 27.8 (18.6–31.5) | 0.002 * |
| Plasmacytoid dendritic cells BDCA2+CD123+ TLR2+ [%] | 5.66 (4.8–12.5) | 13.03 (7.3–17.7) | 16.67 (10.5–25.2) | 0.02 * |
| Classical monocytes CD14+CD16-TLR2+ [%] | 5.55 (3.7–8.3) | 4.85 (4.4–11.9) | 10.34 (5.4–13.8) | 0.13 |
| Non-classical monocytes CD14+CD16+TLR2+ [%] | 10.09 (9.0–12.0) | 14.92 (14.0–17.6) | 15.59 (13.6–26.4) | 0.001 * |
| TLR-2 concentration in serum [ng/mL] | 14.45 (12.2–17.5) | 19.55 (16.2–25.8) | 26.36 (20.5–31.9) | 0.0005 * |
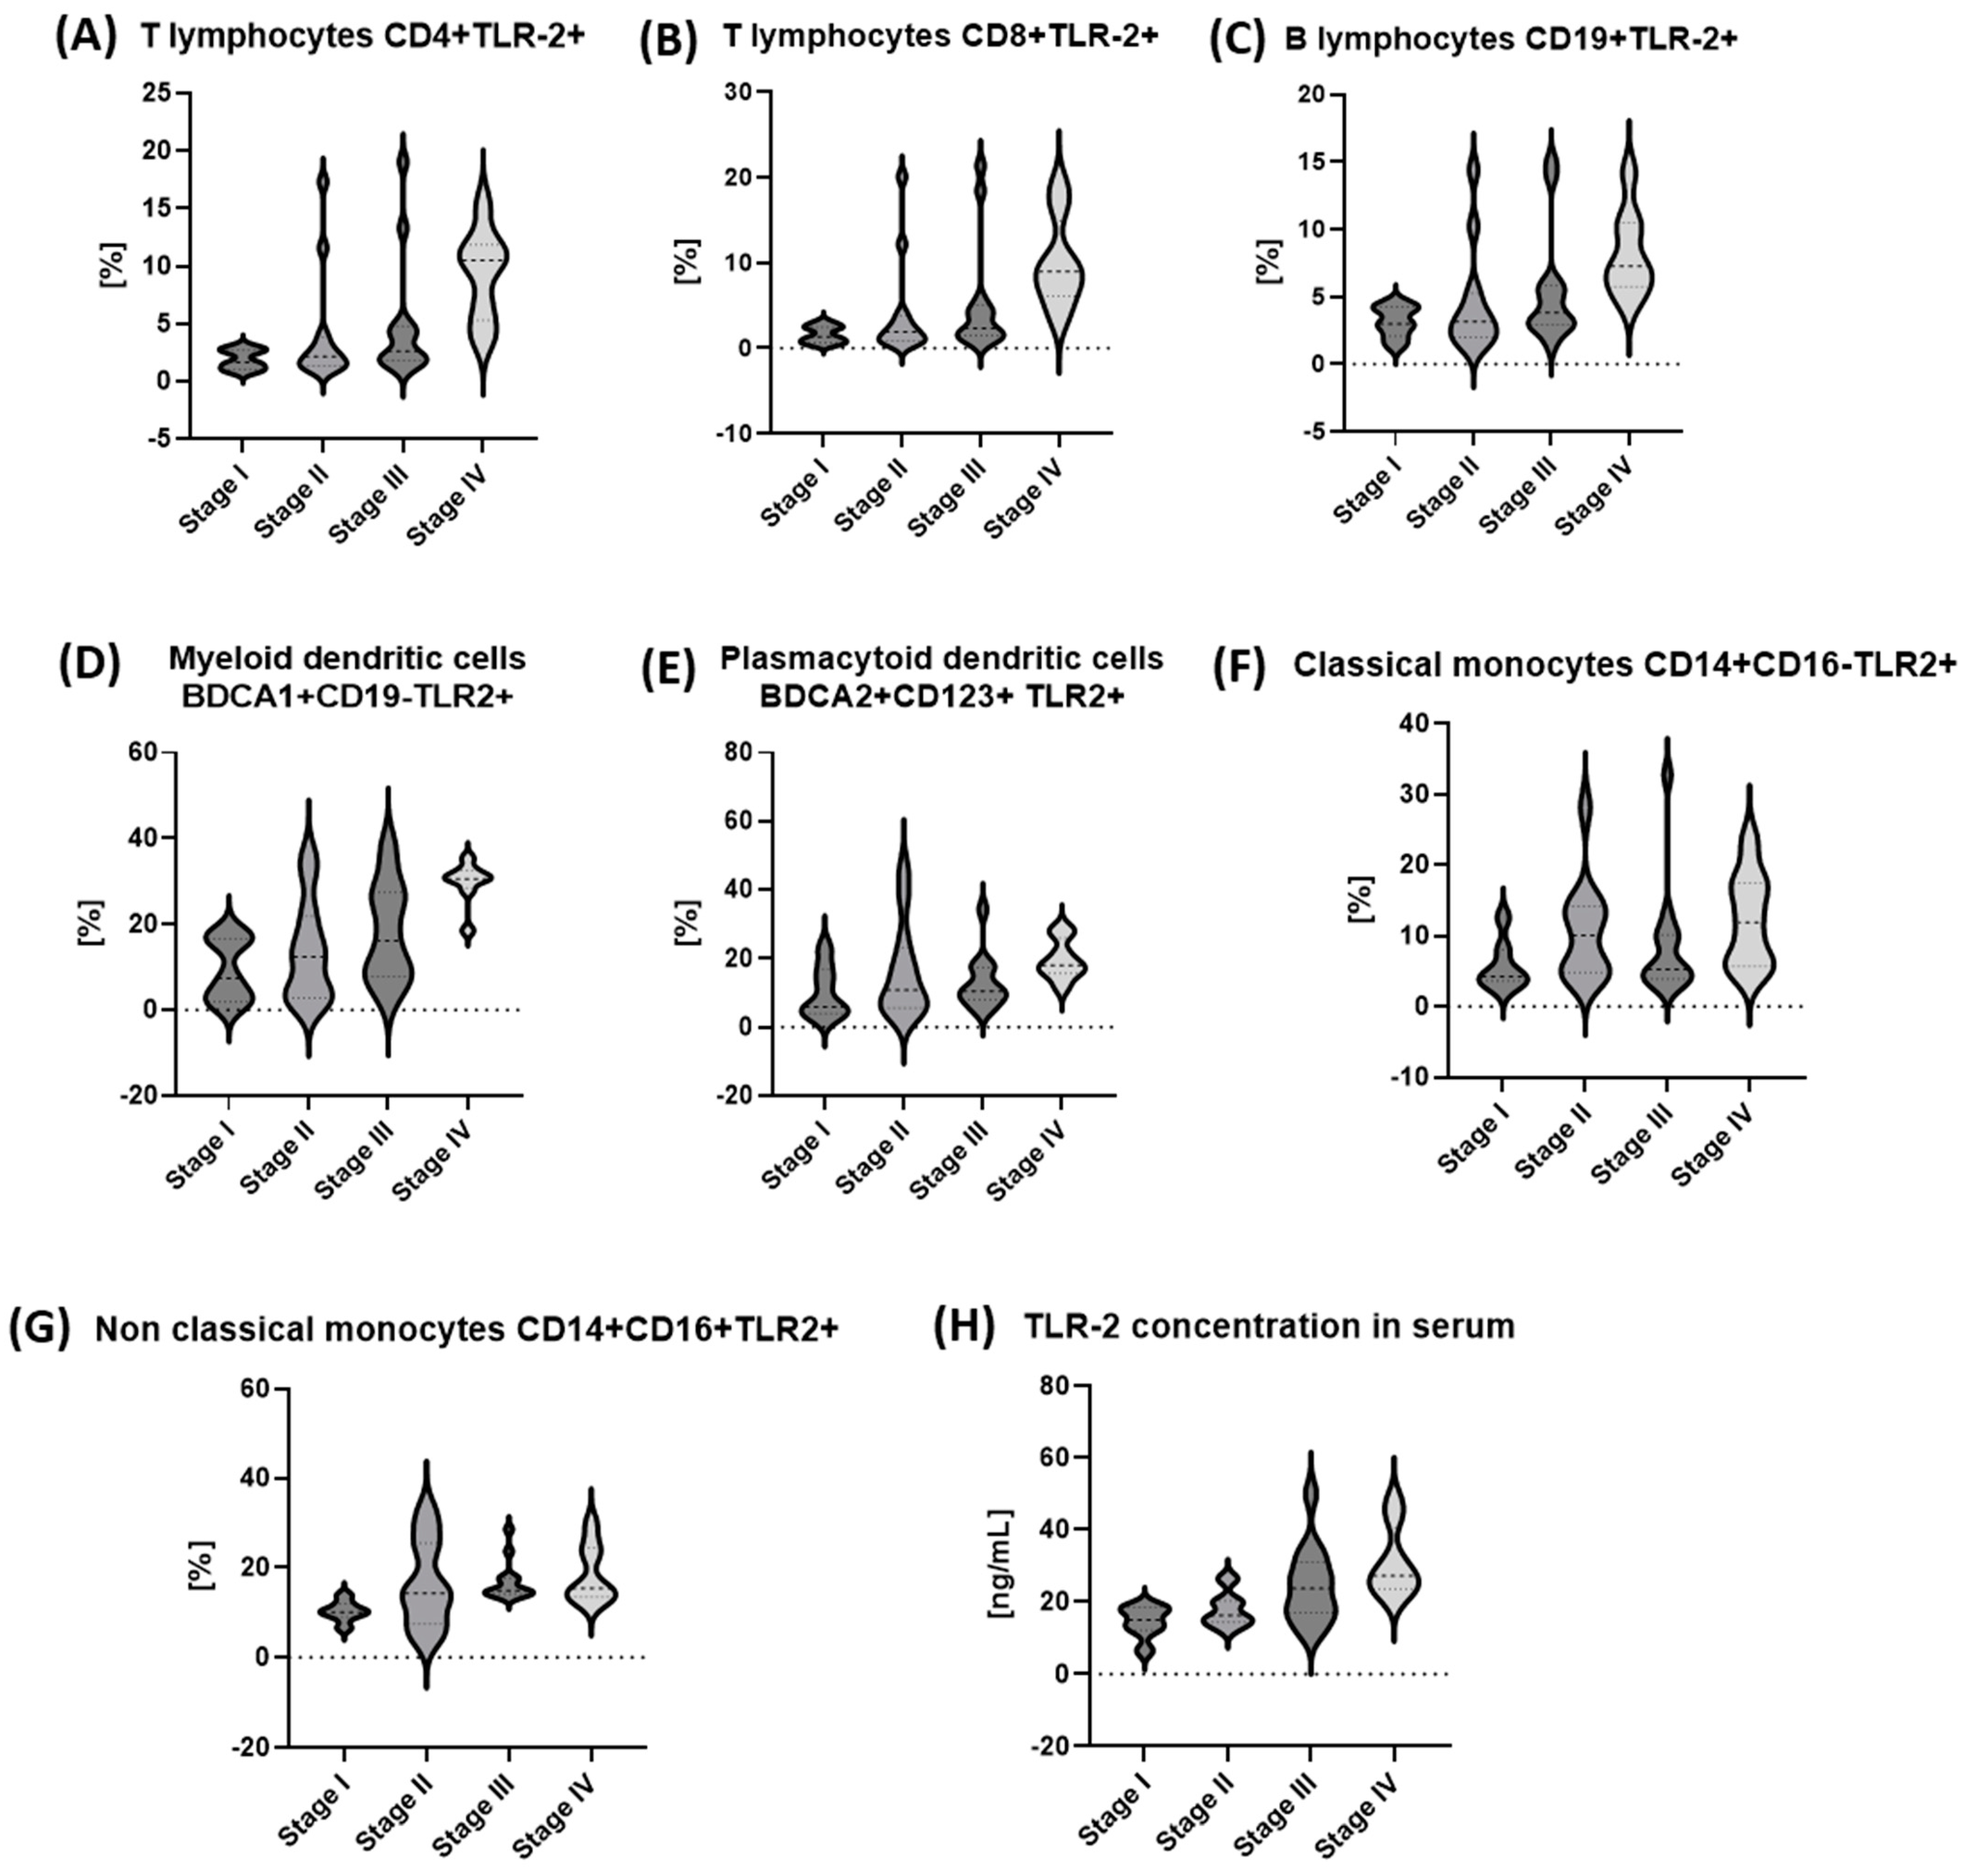
| Parameter [%] | I (n = 7) | II (n = 12) | III (n = 13) | IV (n = 8) | p Value |
|---|---|---|---|---|---|
| Median (IQR) | |||||
| T lymphocytes CD4+TLR-2+ [%] | 1.9 (1.0–2.7) | 2.17 (1.4–3.6) | 2.62 (1.9–4.5) | 10.53 (5.8–11.5) | 0.0054 * |
| T lymphocytes CD8+TLR-2+ [%] | 1.62 (0.6–2.5) | 1.93 (0.9–3.6) | 2.36 (1.6–4.4) | 8.98 (6.5–13.3) | 0.0056 * |
| B lymphocytes CD19+TLR-2+ [%] | 3.15 (2.1–4.3) | 3.15 (2.0–5.0) | 3.82 (3.0–5.5) | 7.26 (5.9–10.3) | 0.0082 * |
| Myeloid dendritic cells BDCA1+CD19-TLR2+ [%] | 7.45 (1.9–16.7) | 12.46 (3.0–20.8) | 16.22 (8.1–26.8) | 30.57 (29.1–32.2) | 0.0056 * |
| Plasmacytoid dendritic cells BDCA2+CD123+ TLR2+ [%] | 5.88 (4.0–17.1) | 10.92 (5.9–21.5) | 10.53 (8.7–17.2) | 18.09 (16.0–24.5) | 0.089 |
| Classical monocytes CD14+CD16-TLR2+ [%] | 4.24 (3.6–8.1) | 10.12 (4.9–14.0) | 5.29 (4.4–10.0) | 11.92 (5.9–17.4) | 0.036 * |
| Non-classical monocytes CD14+CD16+TLR2+ [%] | 10.09 (9.0–12.0) | 14.25 (8.2–24.8) | 14.92 (14.4–17.6) | 15.4 (13.5–23.7) | 0.017 * |
| TLR-2 concentration in serum [ng/mL] | 15.0 (12.2–18.4) | 16.33 (14.5–20.1) | 23.68 (17.3–29.3) | 27.18 (24.2–37.6) | 0.0019 * |
| Parameter [%] | Prognostic Value | Youden Index | Area under the Curve (AUC) | 95% CI | p Value |
|---|---|---|---|---|---|
| T lymphocytes CD4+TLR-2+ [%] | 0.99 | 0.7 | 0.91 | 0.84–0.98 | <0.0001 * |
| T lymphocytes CD8+TLR-2+ [%] | 0.79 | ||||
| B lymphocytes CD19+TLR-2+ [%] | 0.76 | ||||
| Myeloid dendritic cells BDCA1+CD19-TLR2+ [%] | 0.79 | ||||
| Plasmacytoid dendritic cells BDCA2+CD123+ TLR2+ [%] | 0.77 | ||||
| TLR-2 concentration in serum [ng/mL] | 11.61 | 0.94 | 0.99 | 0.97–1.0 | <0.0001 * |
| Classical monocytes CD14+CD16-TLR2+ [%] | 0.75 | ||||
| Non-classical monocytes CD14+CD16+TLR2+ [%] | 10.08 | 0.85 | 0.95 | 0.9–1.0 | <0.0001 * |
| Parameter | Gastric Cancer (n = 40) | Control Group (n = 25) | ||
|---|---|---|---|---|
| Age [years] Mean ± SD | 62.7 ± 10.7 | 62.3 ± 9.7 | ||
| Male, n (%) | 24 (60) | 15 (60) | ||
| Female, n (%) | 16 (40) | 10 (40) | ||
| TMN stage | n | % | ||
| IA | 5 | 12.5 | ||
| IB | 2 | 5 | ||
| IIA | 7 | 17.5 | ||
| IIB | 5 | 12.5 | ||
| IIIA | 8 | 20 | ||
| IIIB | 2 | 5 | ||
| IIIC | 3 | 7.5 | ||
| IV | 8 | 20 | ||
| Grading | ||||
| G1 | 10 | 25 | ||
| G2 | 13 | 32.5 | ||
| G3 | 17 | 42.5 | ||
| Lauren classification | ||||
| Intestinal type | 17 | 42.5 | ||
| Diffuse type | 23 | 57.5 | ||
Disclaimer/Publisher’s Note: The statements, opinions and data contained in all publications are solely those of the individual author(s) and contributor(s) and not of MDPI and/or the editor(s). MDPI and/or the editor(s) disclaim responsibility for any injury to people or property resulting from any ideas, methods, instructions or products referred to in the content. |
© 2023 by the authors. Licensee MDPI, Basel, Switzerland. This article is an open access article distributed under the terms and conditions of the Creative Commons Attribution (CC BY) license (https://creativecommons.org/licenses/by/4.0/).
Share and Cite
Majewski, M.; Torres, K.; Mertowska, P.; Mertowski, S.; Korona-Głowniak, I.; Korulczyk, J.; Zgodziński, W.; Grywalska, E. Could Toll-like Receptor 2 Serve as Biomarker to Detect Advanced Gastric Cancer? Int. J. Mol. Sci. 2023, 24, 5824. https://doi.org/10.3390/ijms24065824
Majewski M, Torres K, Mertowska P, Mertowski S, Korona-Głowniak I, Korulczyk J, Zgodziński W, Grywalska E. Could Toll-like Receptor 2 Serve as Biomarker to Detect Advanced Gastric Cancer? International Journal of Molecular Sciences. 2023; 24(6):5824. https://doi.org/10.3390/ijms24065824
Chicago/Turabian StyleMajewski, Marek, Kamil Torres, Paulina Mertowska, Sebastian Mertowski, Izabela Korona-Głowniak, Jan Korulczyk, Witold Zgodziński, and Ewelina Grywalska. 2023. "Could Toll-like Receptor 2 Serve as Biomarker to Detect Advanced Gastric Cancer?" International Journal of Molecular Sciences 24, no. 6: 5824. https://doi.org/10.3390/ijms24065824
APA StyleMajewski, M., Torres, K., Mertowska, P., Mertowski, S., Korona-Głowniak, I., Korulczyk, J., Zgodziński, W., & Grywalska, E. (2023). Could Toll-like Receptor 2 Serve as Biomarker to Detect Advanced Gastric Cancer? International Journal of Molecular Sciences, 24(6), 5824. https://doi.org/10.3390/ijms24065824