
The Allergenic Activity of Blo t 2, a Blomia tropicalis IgE-Binding Molecule

 , , , , and
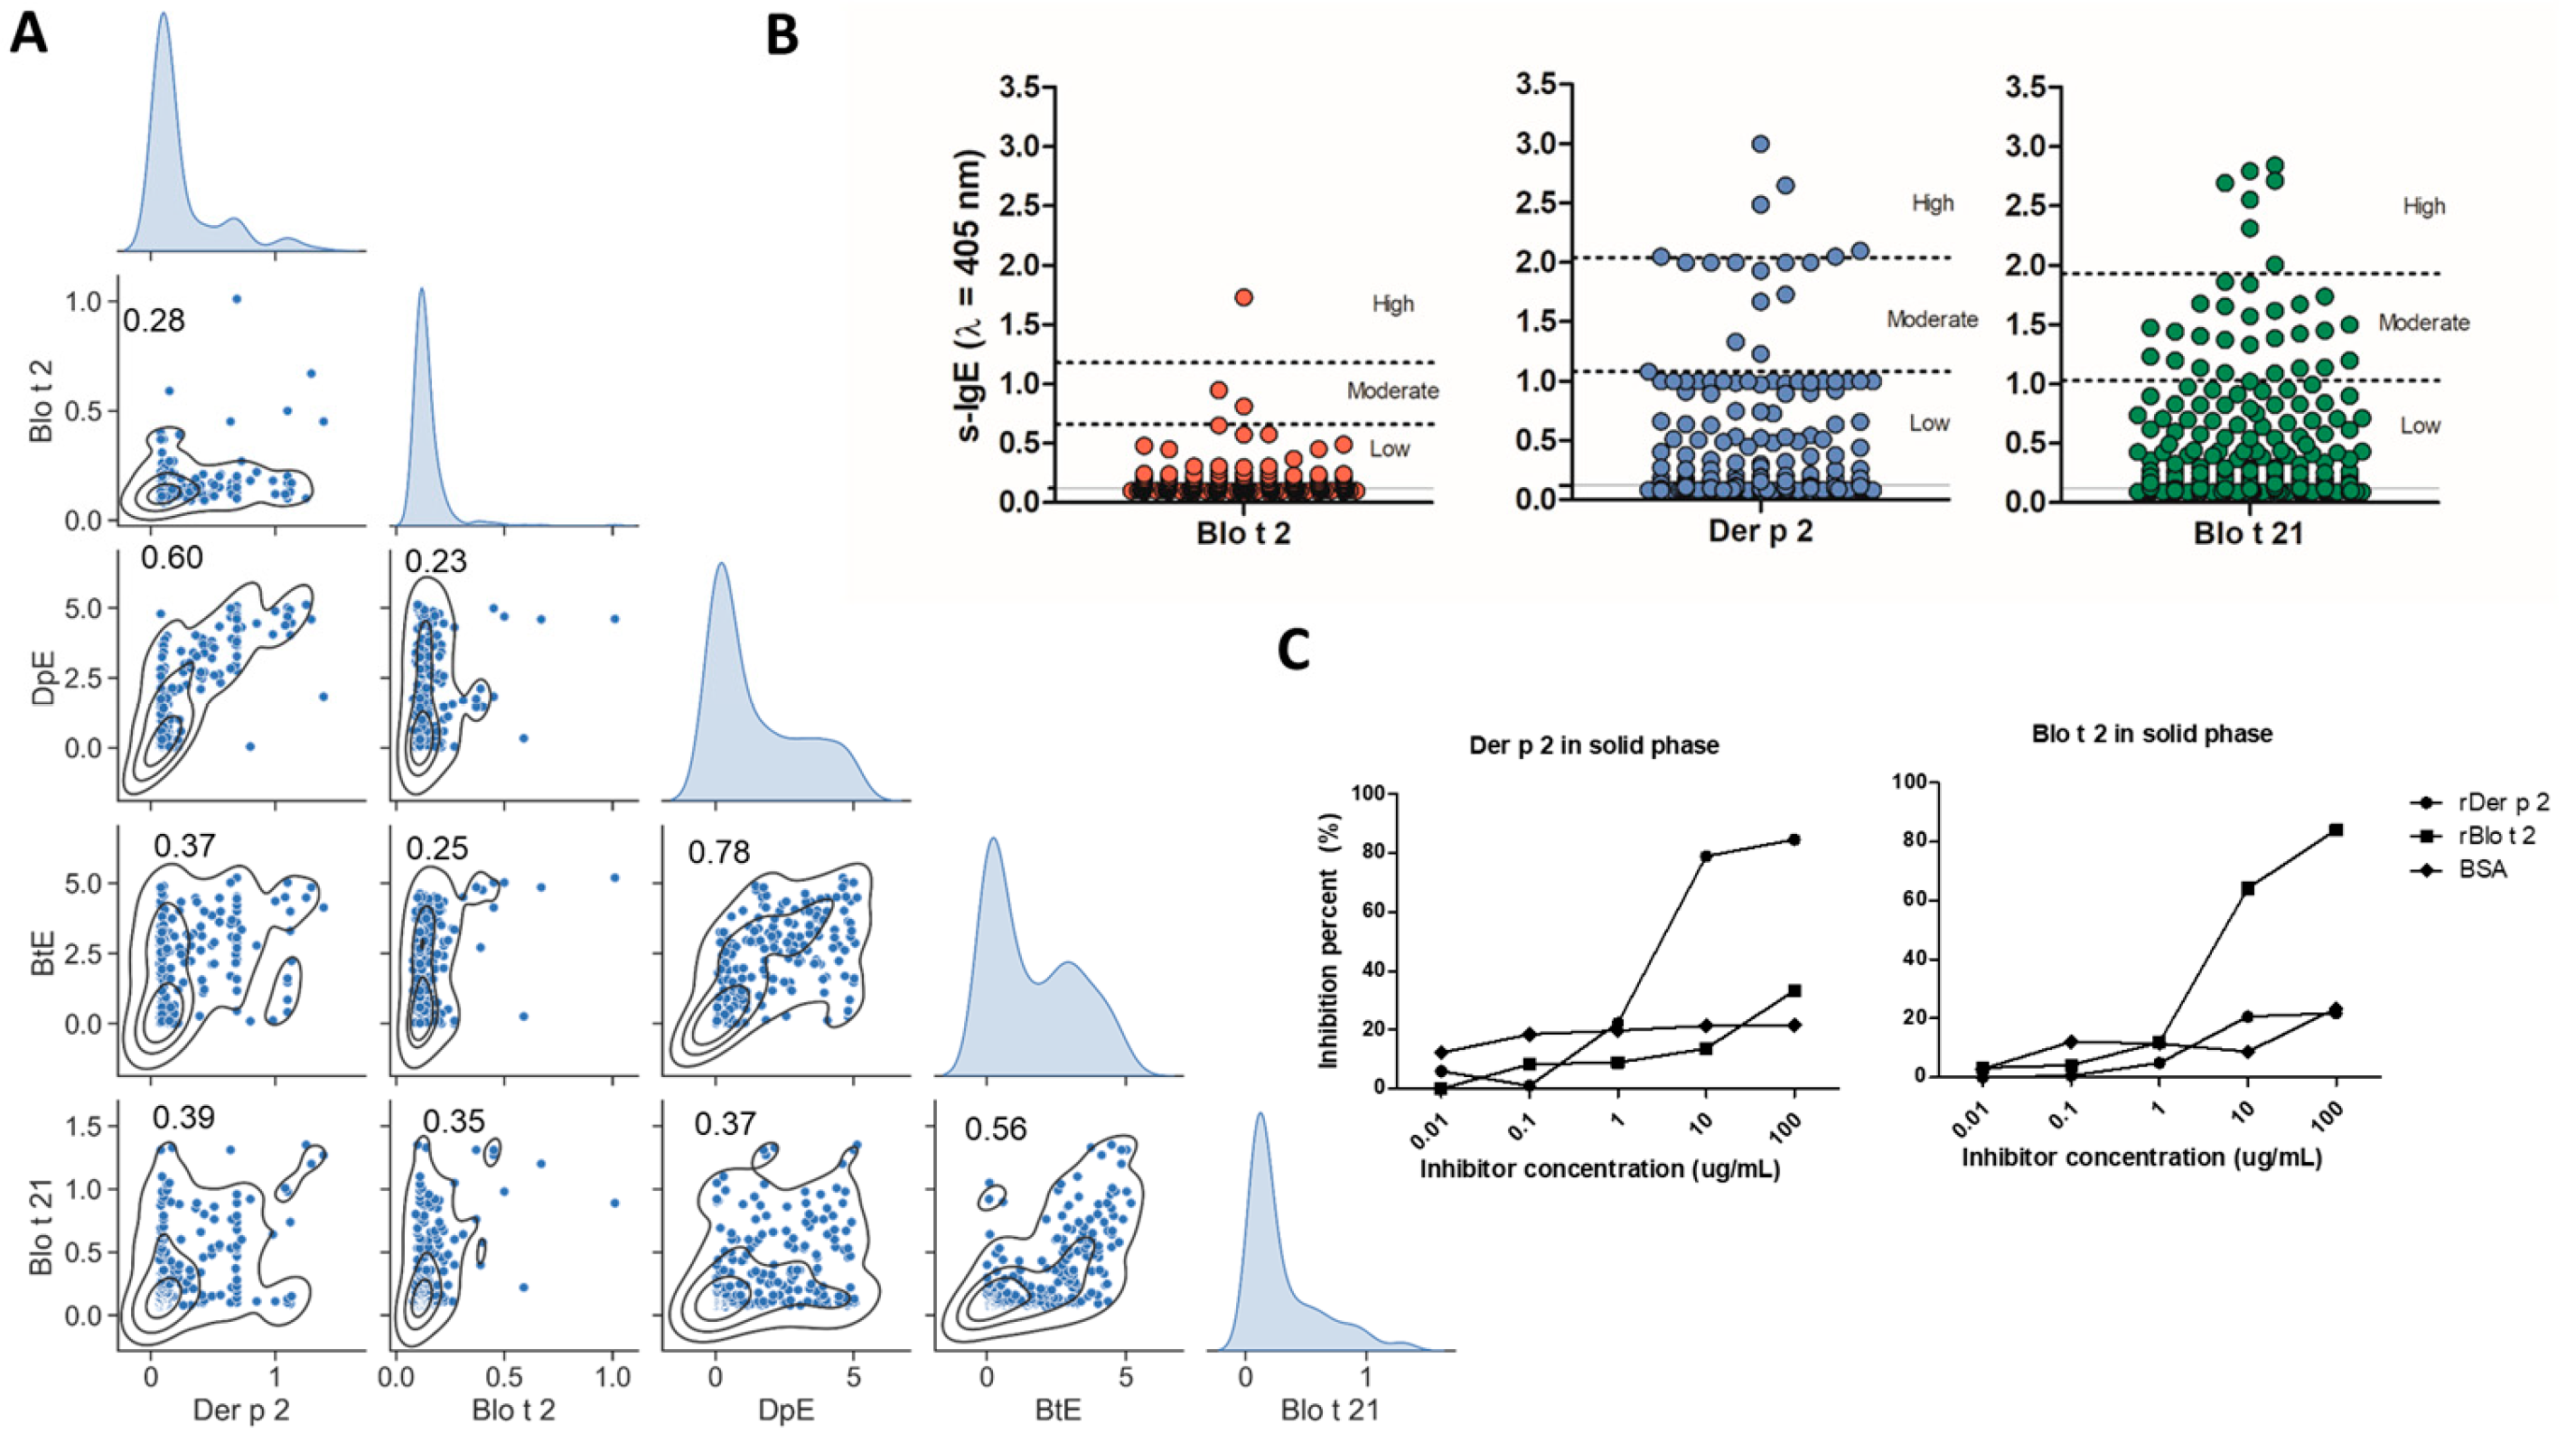
Abstract
1. Introduction
2. Results
2.1. Purification of Blo t 2
2.2. Specific IgE to Blo t 2 and Der p 2 Exhibit Differences
2.3. rBlo t 2 Degranulates Human Basophils and Mast Cells
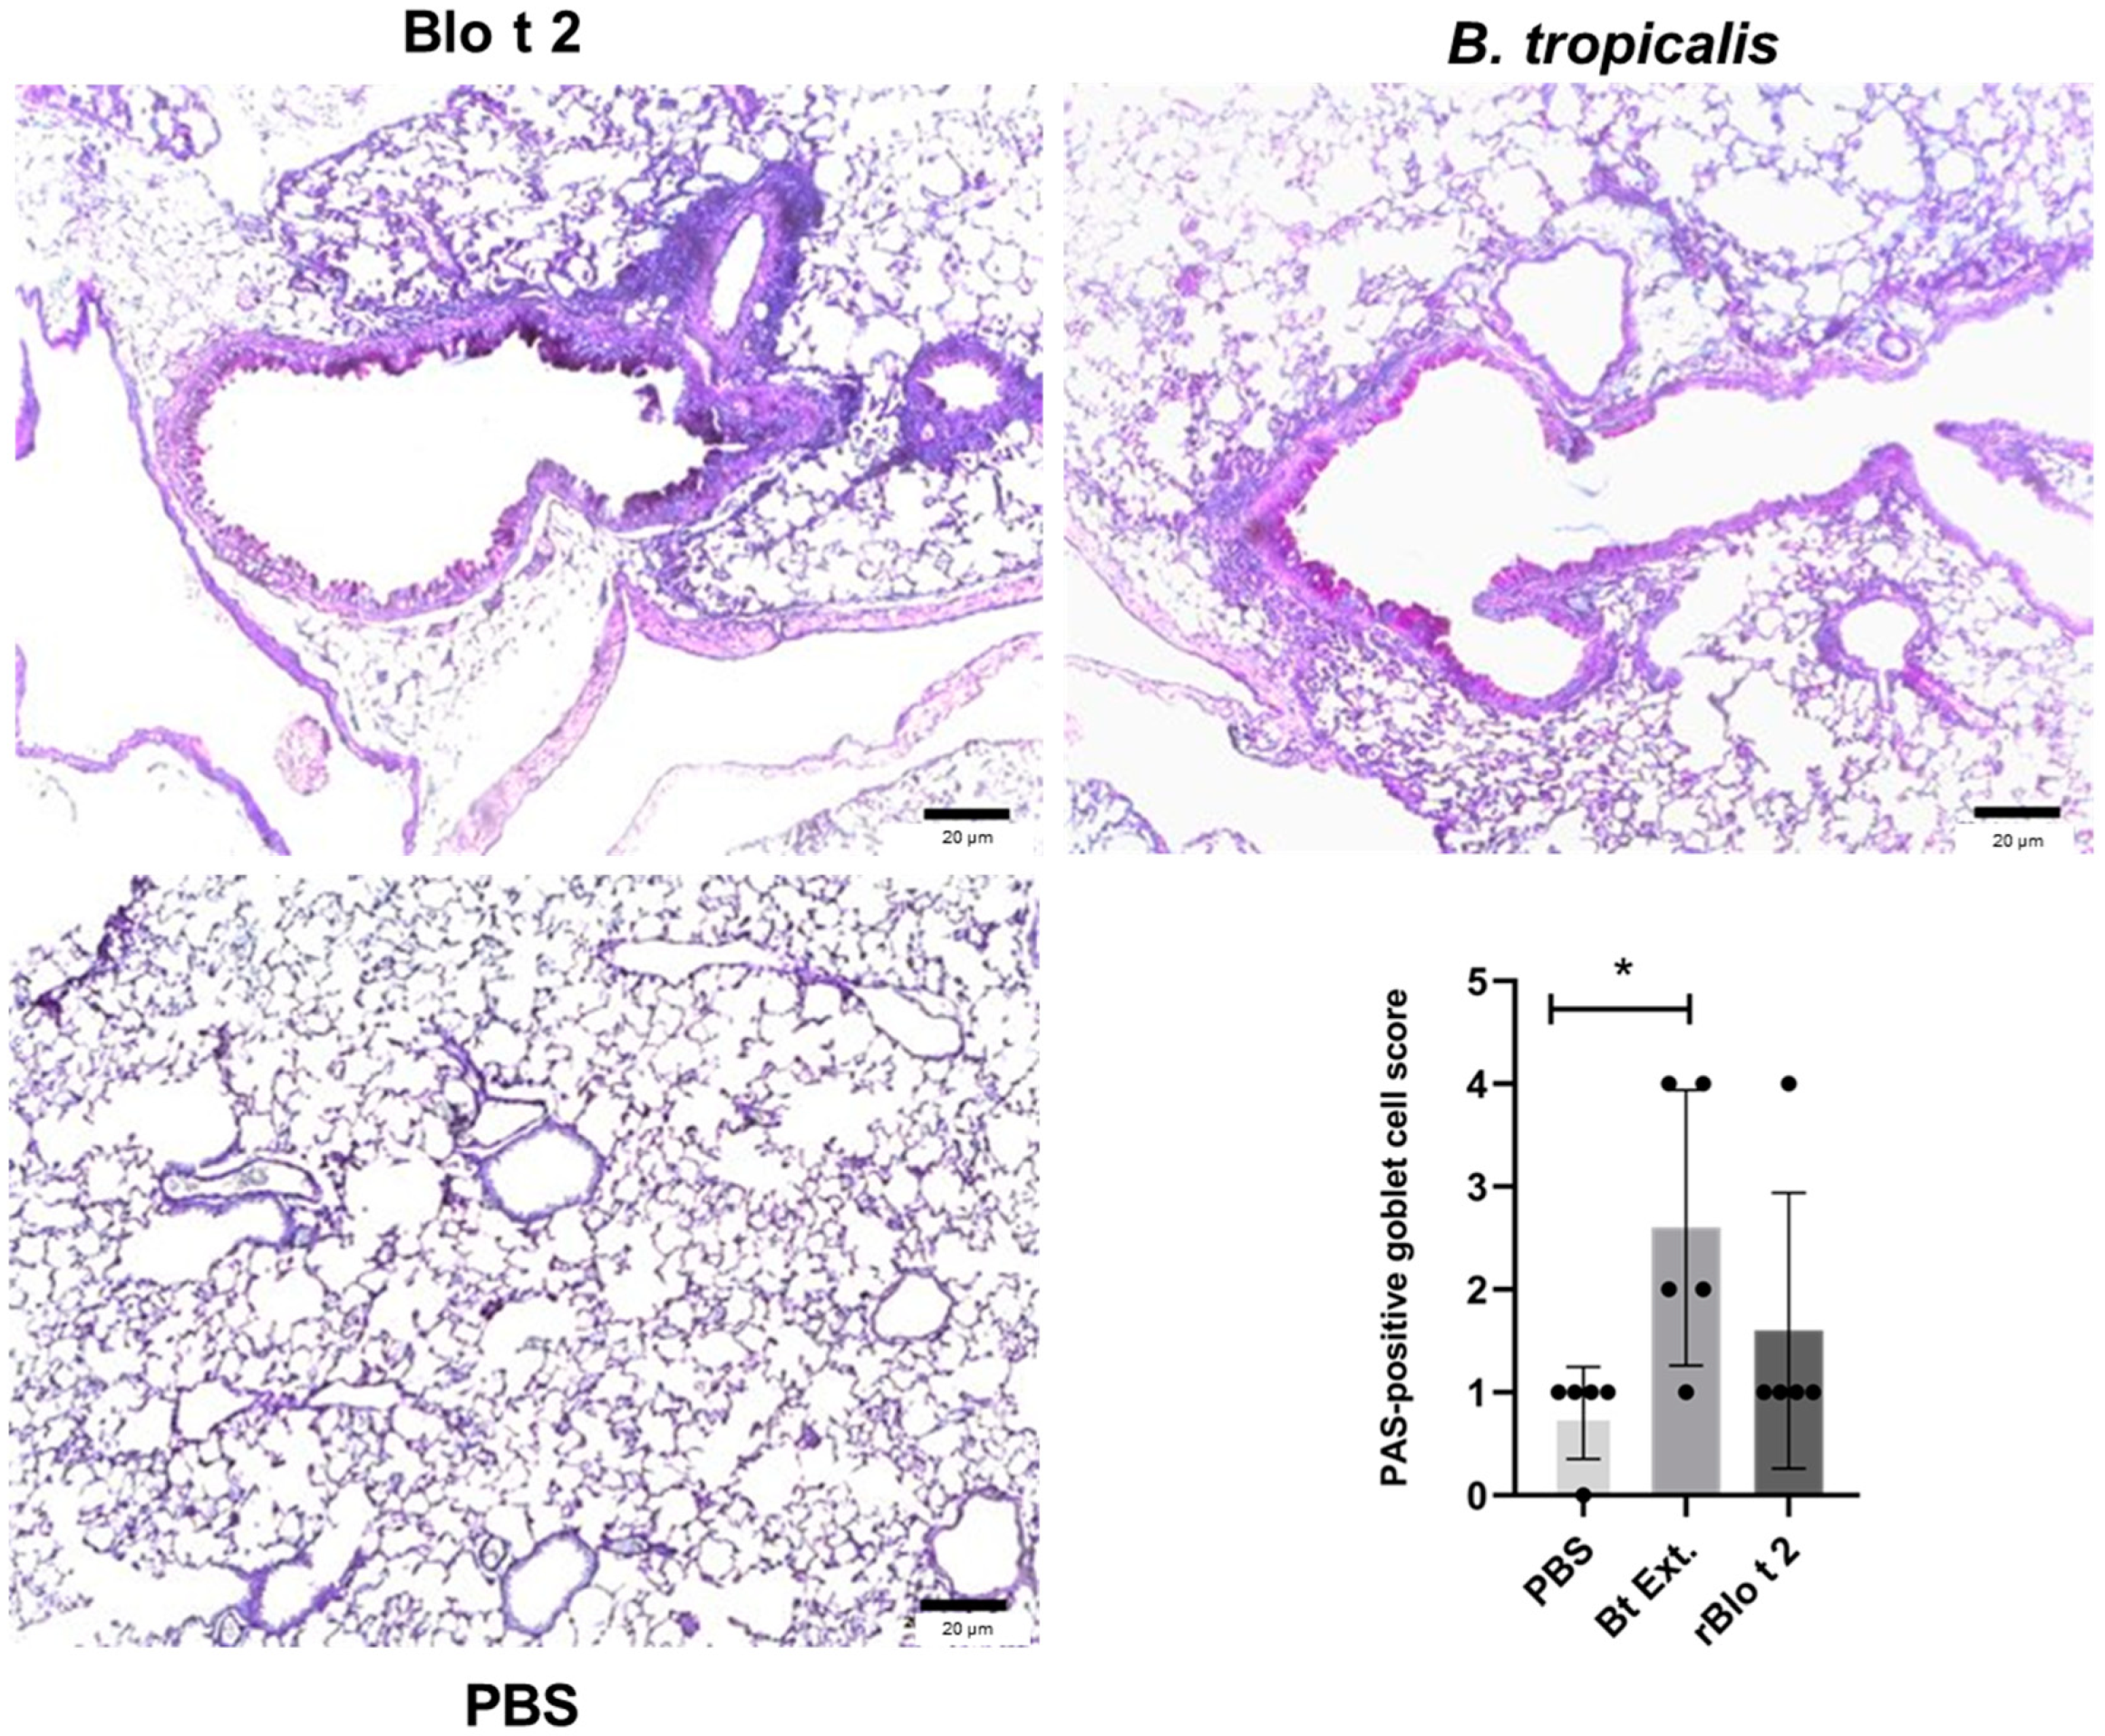
2.4. rBlo t 2 Induces Inflammation in a Murine Model of Allergic Asthma
2.5. rBlo t 2 Induces Passive Cutaneous Anaphylaxis
3. Discussion
4. Materials and Methods
4.1. Recombinant Allergen Production
4.2. Human Samples
4.3. Assessment of Sensitization
4.4. ELISA Inhibition
4.5. Passive Basophil Activation Test
4.6. Skin Prick Test (SPT)
4.7. Model of Allergic Airway Inflammation
4.8. Measurement of Airway Hyperreactivity
4.9. Histology
4.10. Bronchoalveolar Lavage (BAL)
4.11. Mouse Antibody Analyses
4.12. Passive Cutaneous Anaphylaxis (PCA) Model
4.13. Statistical Analysis
Supplementary Materials
Author Contributions
Funding
Institutional Review Board Statement
Informed Consent Statement
Data Availability Statement
Acknowledgments
Conflicts of Interest
References
- Chew, F.T.; Zhang, L.; Ho, T.M.; Lee, B.W. House dust mite fauna of tropical Singapore. Clin. Exp. Allergy 1999, 29, 201–206. [Google Scholar] [CrossRef]
- Baqueiro, T.; Carvalho, F.M.; Rios, C.F.; Dos Santos, N.M.; Medical Student Group; Alcantara-Neves, N.M. Dust Mite Species and Allergen Concentrations in Beds of Individuals Belonging to Different Urban Socioeconomic Groups in Brazil. J. Asthma 2006, 43, 101–105. [Google Scholar] [CrossRef] [PubMed]
- Fernández-Caldas, E.; Puerta, L.; Mercado, D.; Lockey, R.F.; Caraballo, L.R. Mite fauna, Der p I, Der f I and Blomia tropicalis allergen levels in a tropical environment. Clin. Exp. Allergy 1993, 23, 292–297. [Google Scholar] [CrossRef]
- Caraballo, L.; Valenta, R.; Puerta, L.; Pomés, A.; Zakzuk, J.; Fernandez-Caldas, E.; Acevedo, N.; Sanchez-Borges, M.; Ansotegui, I.; Zhang, L.; et al. The allergenic activity and clinical impact of individual IgE-antibody binding molecules from indoor allergen sources. World Allergy Organ. J. 2020, 13, 100118. [Google Scholar] [CrossRef]
- Smole, U.; Gour, N.; Phelan, J.; Hofer, G.; Köhler, C.; Kratzer, B.; Tauber, P.A.; Xiao, X.; Yao, N.; Dvorak, J.; et al. Serum amyloid A is a soluble pattern recognition receptor that drives type 2 immunity. Nat. Immunol. 2020, 21, 756–765. [Google Scholar] [CrossRef]
- Reginald, K.; Pang, S.L.; Chew, F.T. Blo t 2: Group 2 allergen from the dust mite Blomia tropicalis. Sci. Rep. 2019, 9, 12239. [Google Scholar] [CrossRef] [PubMed]
- Caraballo, L.; Valenta, R.; Acevedo, N.; Zakzuk, J. Are the Terms Major and Minor Allergens Useful for Precision Allergology? Front. Immunol. 2021, 12, 651500. [Google Scholar] [CrossRef]
- Gour, N.; Lajoie, S.; Smole, U.; White, M.; Hu, D.; Goddard, P.; Huntsman, S.; Eng, C.; Mak, A.; Oh, S.; et al. Dysregulated invertebrate tropomyosin–dectin-1 interaction confers susceptibility to allergic diseases. Sci. Immunol. 2018, 3, 651500. [Google Scholar] [CrossRef]
- Puccio, F.A.; Lynch, N.R.; Noga, O.; Noda, A.; Hagel, I.; Lopez, E.; Lopez, R.; Caraballo, L.; Mercado, D.; Di Prisco, M. Importance of including Blomia tropicalis in the routine diagnosis of Venezuelan patients with persistent allergic symptoms. Allergy 2004, 59, 753–757. [Google Scholar] [CrossRef]
- da Silva, E.S.; Asam, C.; Lackner, P.; Hofer, H.; Wallner, M.; Pinheiro, C.S.; Alcântara-Neves, N.M.; Ferreira, F. Allergens of Blomia tropicalis: An Overview of Recombinant Molecules. Int. Arch. Allergy Immunol. 2017, 172, 203–214. [Google Scholar] [CrossRef]
- Caraballo, L.; Zakzuk, J.; Lee, B.W.; Acevedo, N.; Soh, J.Y.; Sanchez-Borges, M.; Hossny, E.; Garcia, E.; Rosario, N.; Ansotegui, I.; et al. Particularities of allergy in the Tropics. World Allergy Organ. J. 2016, 9, 20. [Google Scholar] [CrossRef] [PubMed]
- Pauli, G.; Wurmser-Danion, C.; Roos, A.; Kokou, C.; Huang, H.-J.; Lupinek, C.; Zakzuk, J.; Luis, C.; Susanne, V.; Rudolf, V. Molecular sensitization profile of asthmatic children in equatorial Africa. World Allergy Organ. J. 2020, 13, 100160. [Google Scholar] [CrossRef]
- Lopez, J.; Regino, R.; Guerrero, L.; Gracia, M.; Marrugo, V.; Zakzuk, J.; Caraballo, L. Sensitization to Blomia Tropicalis and Ascaris spp. Components in Recurrent Wheezing Children Living in a Tropical City. In Allergy; John Wiley & Sons: Hoboken, NJ, USA, 2019; pp. 841–842. [Google Scholar]
- Urrego, J.; Hofer, H.; Aglas, L.; Pinheiro, C.; Briza, P.; Wallner, M.; Alcantara-Neves, N.; Ferreira, F. Physicochemical and Immunological Characterization of the Recombinant Blomia Tropicalis Allergen Blo t 2; Allergy EAACI, OAS 31, abstract 182; John Wiley & Sons: Hoboken, NJ, USA, 2016. [Google Scholar]
- da Silva, E.S.; Ponte, J.C.M.; da Silva, M.B.; Pinheiro, C.S.; Pacheco, L.G.C.; Ferreira, F.; Briza, P.; Alcantara-Neves, N.M. Proteomic Analysis Reveals Allergen Variability among Breeds of the Dust Mite Blomia tropicalis. Int. Arch. Allergy Immunol. 2019, 180, 159–172. [Google Scholar] [CrossRef]
- Pinheiro, C.S.; Silva, E.S.; Belitardo, E.M.M.D.A.; Pacheco, L.G.C.; Aguiar, E.R.G.R.; Alcantara-Neves, N.M.; Gadermaier, G.; Ferreira, F. En route to personalized medicine: Uncovering distinct IgE reactivity pattern to house dust mite components in Brazilian and Austrian allergic patients. Clin. Transl. Allergy 2021, 11, e12004. [Google Scholar] [CrossRef]
- Zakzuk, J.; Acevedo, N.; Harb, H.; Eick, L.; Renz, H.; Potaczek, D.P.; Caraballo, L. IgE Levels to Ascaris and House Dust Mite Allergens Are Associated With Increased Histone Acetylation at Key Type-2 Immune Genes. Front. Immunol. 2020, 11, 756. [Google Scholar] [CrossRef]
- Chew, F.T.; Yi, F.C.; Chua, K.Y.; Caldas, F.; Arruda, L.K.; Chapman, M.D.; Lee, B.W. Allergenic differences between the domestic mites Blomia tropicalis and Dermatophagoides pteronyssinus. Clin. Exp. Allergy 1999, 29, 982–988. [Google Scholar] [CrossRef]
- Yi, F.C.; Cheong, N.; Shek, P.C.L.; Wang, D.Y.; Chua, K.Y.; Lee, B.W. Identification of shared and unique immunoglobulin E epitopes of the highly conserved tropomyosins in Blomia tropicalis and Dermatophagoides pteronyssinus. Clin. Exp. Allergy 2002, 32, 1203–1210. [Google Scholar] [CrossRef]
- Batard, T.; Hrabina, A.; Bi, X.Z.; Chabre, H.; Lemoine, P.; Couret, M.-N.; Faccenda, D.; Villet, B.; Harzic, P.; André, F.; et al. Production and Proteomic Characterization of Pharmaceutical-Grade Dermatophagoides pteronyssinus and Dermatophagoides farinae Extracts for Allergy Vaccines. Int. Arch. Allergy Immunol. 2006, 140, 295–305. [Google Scholar] [CrossRef]
- Dharmage, S.; Bailey, M.; Raven, J.; Mitakakis, T.; Cheng, A.; Guest, D.; Rolland, J.; Forbes, A.; Thien, F.; Abramson, M.; et al. Current Indoor Allergen Levels of Fungi and Cats, But Not House Dust Mites, Influence Allergy and Asthma in Adults with High Dust Mite Exposure. Am. J. Respir. Crit. Care Med. 2001, 164, 65–71. [Google Scholar] [CrossRef]
- Zakzuk, J.; Mercado, D.; Bornacelly, A.; Sanchez, J.; Ahumada, V.; Acevedo, N.; Caraballo, L. Hygienic conditions influence sensitization to Blomia tropicalis allergenic components: Results from the FRAAT birth cohort. Pediatr. Allergy Immunol. 2019, 30, 172–178. [Google Scholar] [CrossRef]
- Yasue, M.; Yokota, T.; Kajiwara, Y.; Suko, M.; Okudaira, H. Inhibition of airway inflammation in rDer f 2-sensitized mice by oral administration of recombinant der f 2. Cell Immunol. 1997, 181, 30–37. [Google Scholar] [CrossRef]
- Trompette, A.; Divanovic, S.; Visintin, A.; Blanchard, C.; Hegde, R.S.; Madan, R.; Thorne, P.S.; Wills-Karp, M.; Gioannini, T.L.; Weiss, J.P.; et al. Allergenicity resulting from functional mimicry of a Toll-like receptor complex protein. Nature 2009, 457, 585–588. [Google Scholar] [CrossRef]
- Yin, S.-C.; Liao, E.-C.; Ye, C.-X.; Chang, C.-Y.; Tsai, J.-J. Effect of mite allergenic components on innate immune response: Synergy of protease (Group 1 & 3) and non-protease (Group 2 & 7) allergens. Immunobiology 2018, 223, 443–448. [Google Scholar] [CrossRef]
- Radzyukevich, Y.V.; Kosyakova, N.I.; Prokhorenko, I.R. Synergistic effect of Dermatophagoides pteronyssinus allergen and Escherichia coli lipopolysaccharide on human blood cells. PLoS ONE 2018, 13, e0207311. [Google Scholar] [CrossRef]
- Soongrung, T.; Mongkorntanyatip, K.; Peepim, T.; Buaklin, A.; Le Mignon, M.; Malainual, N.; Nony, E.; Jacquet, A. The Blomia tropicalis allergen Blo t 7 stimulates innate immune signalling pathways through TLR2. Clin. Exp. Allergy 2018, 48, 464–474. [Google Scholar] [CrossRef]
- Pulsawat, P.; Soongrung, T.; Satitsuksanoa, P.; Le Mignon, M.; Khemili, S.; Gilis, D.; Nony, E.; Kennedy, M.W.; Jacquet, A. The house dust mite allergen Der p 5 binds lipid ligands and stimulates airway epithelial cells through a TLR2-dependent pathway. Clin. Exp. Allergy 2018, 49, 378–390. [Google Scholar] [CrossRef]
- Satitsuksanoa, P.; Kennedy, M.; Gilis, D.; Le Mignon, M.; Suratannon, N.; Soh, W.T.; Wongpiyabovorn, J.; Chatchatee, P.; Vangveravong, M.; Rerkpattanapipat, T.; et al. The minor house dust mite allergen Der p 13 is a fatty acid-binding protein and an activator of a TLR2-mediated innate immune response. Allergy 2016, 71, 1425–1434. [Google Scholar] [CrossRef]
- Coronado, S.; Zakzuk, J.; Regino, R.; Ahumada, V.; Benedetti, I.; Angelina, A.; Palomares, O.; Caraballo, L. Ascaris lumbricoides Cystatin Prevents Development of Allergic Airway Inflammation in a Mouse Model. Front. Immunol. 2019, 10, 2280. [Google Scholar] [CrossRef] [PubMed]
- Yamanishi, R.; Yusa, I.; Bando, N.; Terao, J. Adjuvant Activity of Alum in Inducing Antigen Specific IgE Antibodies in BALB/c Mice: A Reevaluation. Biosci. Biotechnol. Biochem. 2003, 67, 166–169. [Google Scholar] [CrossRef]
- Carvalho, A.F.; Fusaro, A.E.; Oliveira, C.R.; Brito, C.A.; Duarte, A.J.; Sato, M.N. Blomia tropicalis and Dermatophagoides pteronyssinus mites evoke distinct patterns of airway cellular influx in type I hypersensitivity murine model. J. Clin. Immunol. 2004, 24, 533–541. [Google Scholar] [CrossRef]
- Gyimesi, E.; Gönczi, F.; Szilasi, M.; Pál, G.; Baráth, S.; Sipka, S. The effects of various doses of bacterial lipopolysaccharide on the expression of CD63 and the release of histamine by basophils of atopic and non-atopic patients. Inflamm. Res. 2013, 62, 213–218. [Google Scholar] [CrossRef] [PubMed]
- Mustafa, A.D.; Kalyanasundram, J.; Sabidi, S.; Song, A.A.; Abdullah, M.; Abdul Rahim, R.; Yusoff, K. Recovery of recombinant Mycobacterium tuberculosis antigens fused with cell wall-anchoring motif (LysM) from inclusion bodies using non-denaturing reagent (N-laurylsarcosine). BMC Biotechnol. 2019, 19, 27. [Google Scholar] [CrossRef] [PubMed]
- Francis, V.G.; Majeed, M.A.; Gummadi, S.N. Recovery of functionally active recombinant human phospholipid scramblase 1 from inclusion bodies using N-lauroyl sarcosine. J. Ind. Microbiol. Biotechnol. 2012, 39, 1041–1048. [Google Scholar] [CrossRef] [PubMed]
- López-Cano, A.; Sicilia, P.; Gaja, C.; Arís, A.; Garcia-Fruitós, E. Quality comparison of recombinant soluble proteins and proteins solubilized from bacterial inclusion bodies. New Biotechnol. 2022, 72, 58–63. [Google Scholar] [CrossRef]
- Zakzuk, J.; Benedetti, I.; Fernandez-Caldas, E.; Caraballo, L. The influence of chitin on the immune response to the house dust mite allergen Blo T 12. Int. Arch. Allergy Immunol. 2014, 163, 119–129. [Google Scholar] [CrossRef]
- Buendia, E.; Zakzuk, J.; Mercado, D.; Alvarez, A.; Caraballo, L. The IgE response to Ascaris molecular components is associated with clinical indicators of asthma severity. World Allergy Organ J. 2015, 8, 8. [Google Scholar] [CrossRef]
- Zakzuk, J.; Jimenez, S.; Cheong, N.; Puerta, L.; Lee, B.W.; Chua, K.Y.; Caraballo, L. Immunological characterization of a Blo t 12 isoallergen: Identification of immunoglobulin E epitopes. Clin. Exp. Allergy 2009, 39, 608–616. [Google Scholar] [CrossRef]
- Myou, S.; Leff, A.R.; Myo, S.; Boetticher, E.; Tong, J.; Meliton, A.Y.; Liu, J.; Munoz, N.M.; Zhu, X. Blockade of inflammation and airway hyperresponsiveness in immune-sensitized mice by dominant-negative phosphoinositide 3-kinase-TAT. J. Exp. Med. 2003, 198, 1573–1582. [Google Scholar] [CrossRef]


Disclaimer/Publisher’s Note: The statements, opinions and data contained in all publications are solely those of the individual author(s) and contributor(s) and not of MDPI and/or the editor(s). MDPI and/or the editor(s) disclaim responsibility for any injury to people or property resulting from any ideas, methods, instructions or products referred to in the content. |
© 2023 by the authors. Licensee MDPI, Basel, Switzerland. This article is an open access article distributed under the terms and conditions of the Creative Commons Attribution (CC BY) license (https://creativecommons.org/licenses/by/4.0/).
Share and Cite
Mondol, E.; Donado, K.; Regino, R.; Hernandez, K.; Mercado, D.; Mercado, A.C.; Benedetti, I.; Puerta, L.; Zakzuk, J.; Caraballo, L. The Allergenic Activity of Blo t 2, a Blomia tropicalis IgE-Binding Molecule. Int. J. Mol. Sci. 2023, 24, 5543. https://doi.org/10.3390/ijms24065543
Mondol E, Donado K, Regino R, Hernandez K, Mercado D, Mercado AC, Benedetti I, Puerta L, Zakzuk J, Caraballo L. The Allergenic Activity of Blo t 2, a Blomia tropicalis IgE-Binding Molecule. International Journal of Molecular Sciences. 2023; 24(6):5543. https://doi.org/10.3390/ijms24065543
Chicago/Turabian StyleMondol, Ernesto, Karen Donado, Ronald Regino, Karen Hernandez, Dilia Mercado, Ana Carolina Mercado, Inés Benedetti, Leonardo Puerta, Josefina Zakzuk, and Luis Caraballo. 2023. "The Allergenic Activity of Blo t 2, a Blomia tropicalis IgE-Binding Molecule" International Journal of Molecular Sciences 24, no. 6: 5543. https://doi.org/10.3390/ijms24065543
APA StyleMondol, E., Donado, K., Regino, R., Hernandez, K., Mercado, D., Mercado, A. C., Benedetti, I., Puerta, L., Zakzuk, J., & Caraballo, L. (2023). The Allergenic Activity of Blo t 2, a Blomia tropicalis IgE-Binding Molecule. International Journal of Molecular Sciences, 24(6), 5543. https://doi.org/10.3390/ijms24065543