

Discovery-Based Proteomics Identify Skeletal Muscle Mitochondrial Alterations as an Early Metabolic Defect in a Mouse Model of β-Thalassemia
 , ,
, ,  ,
, 
 and
and 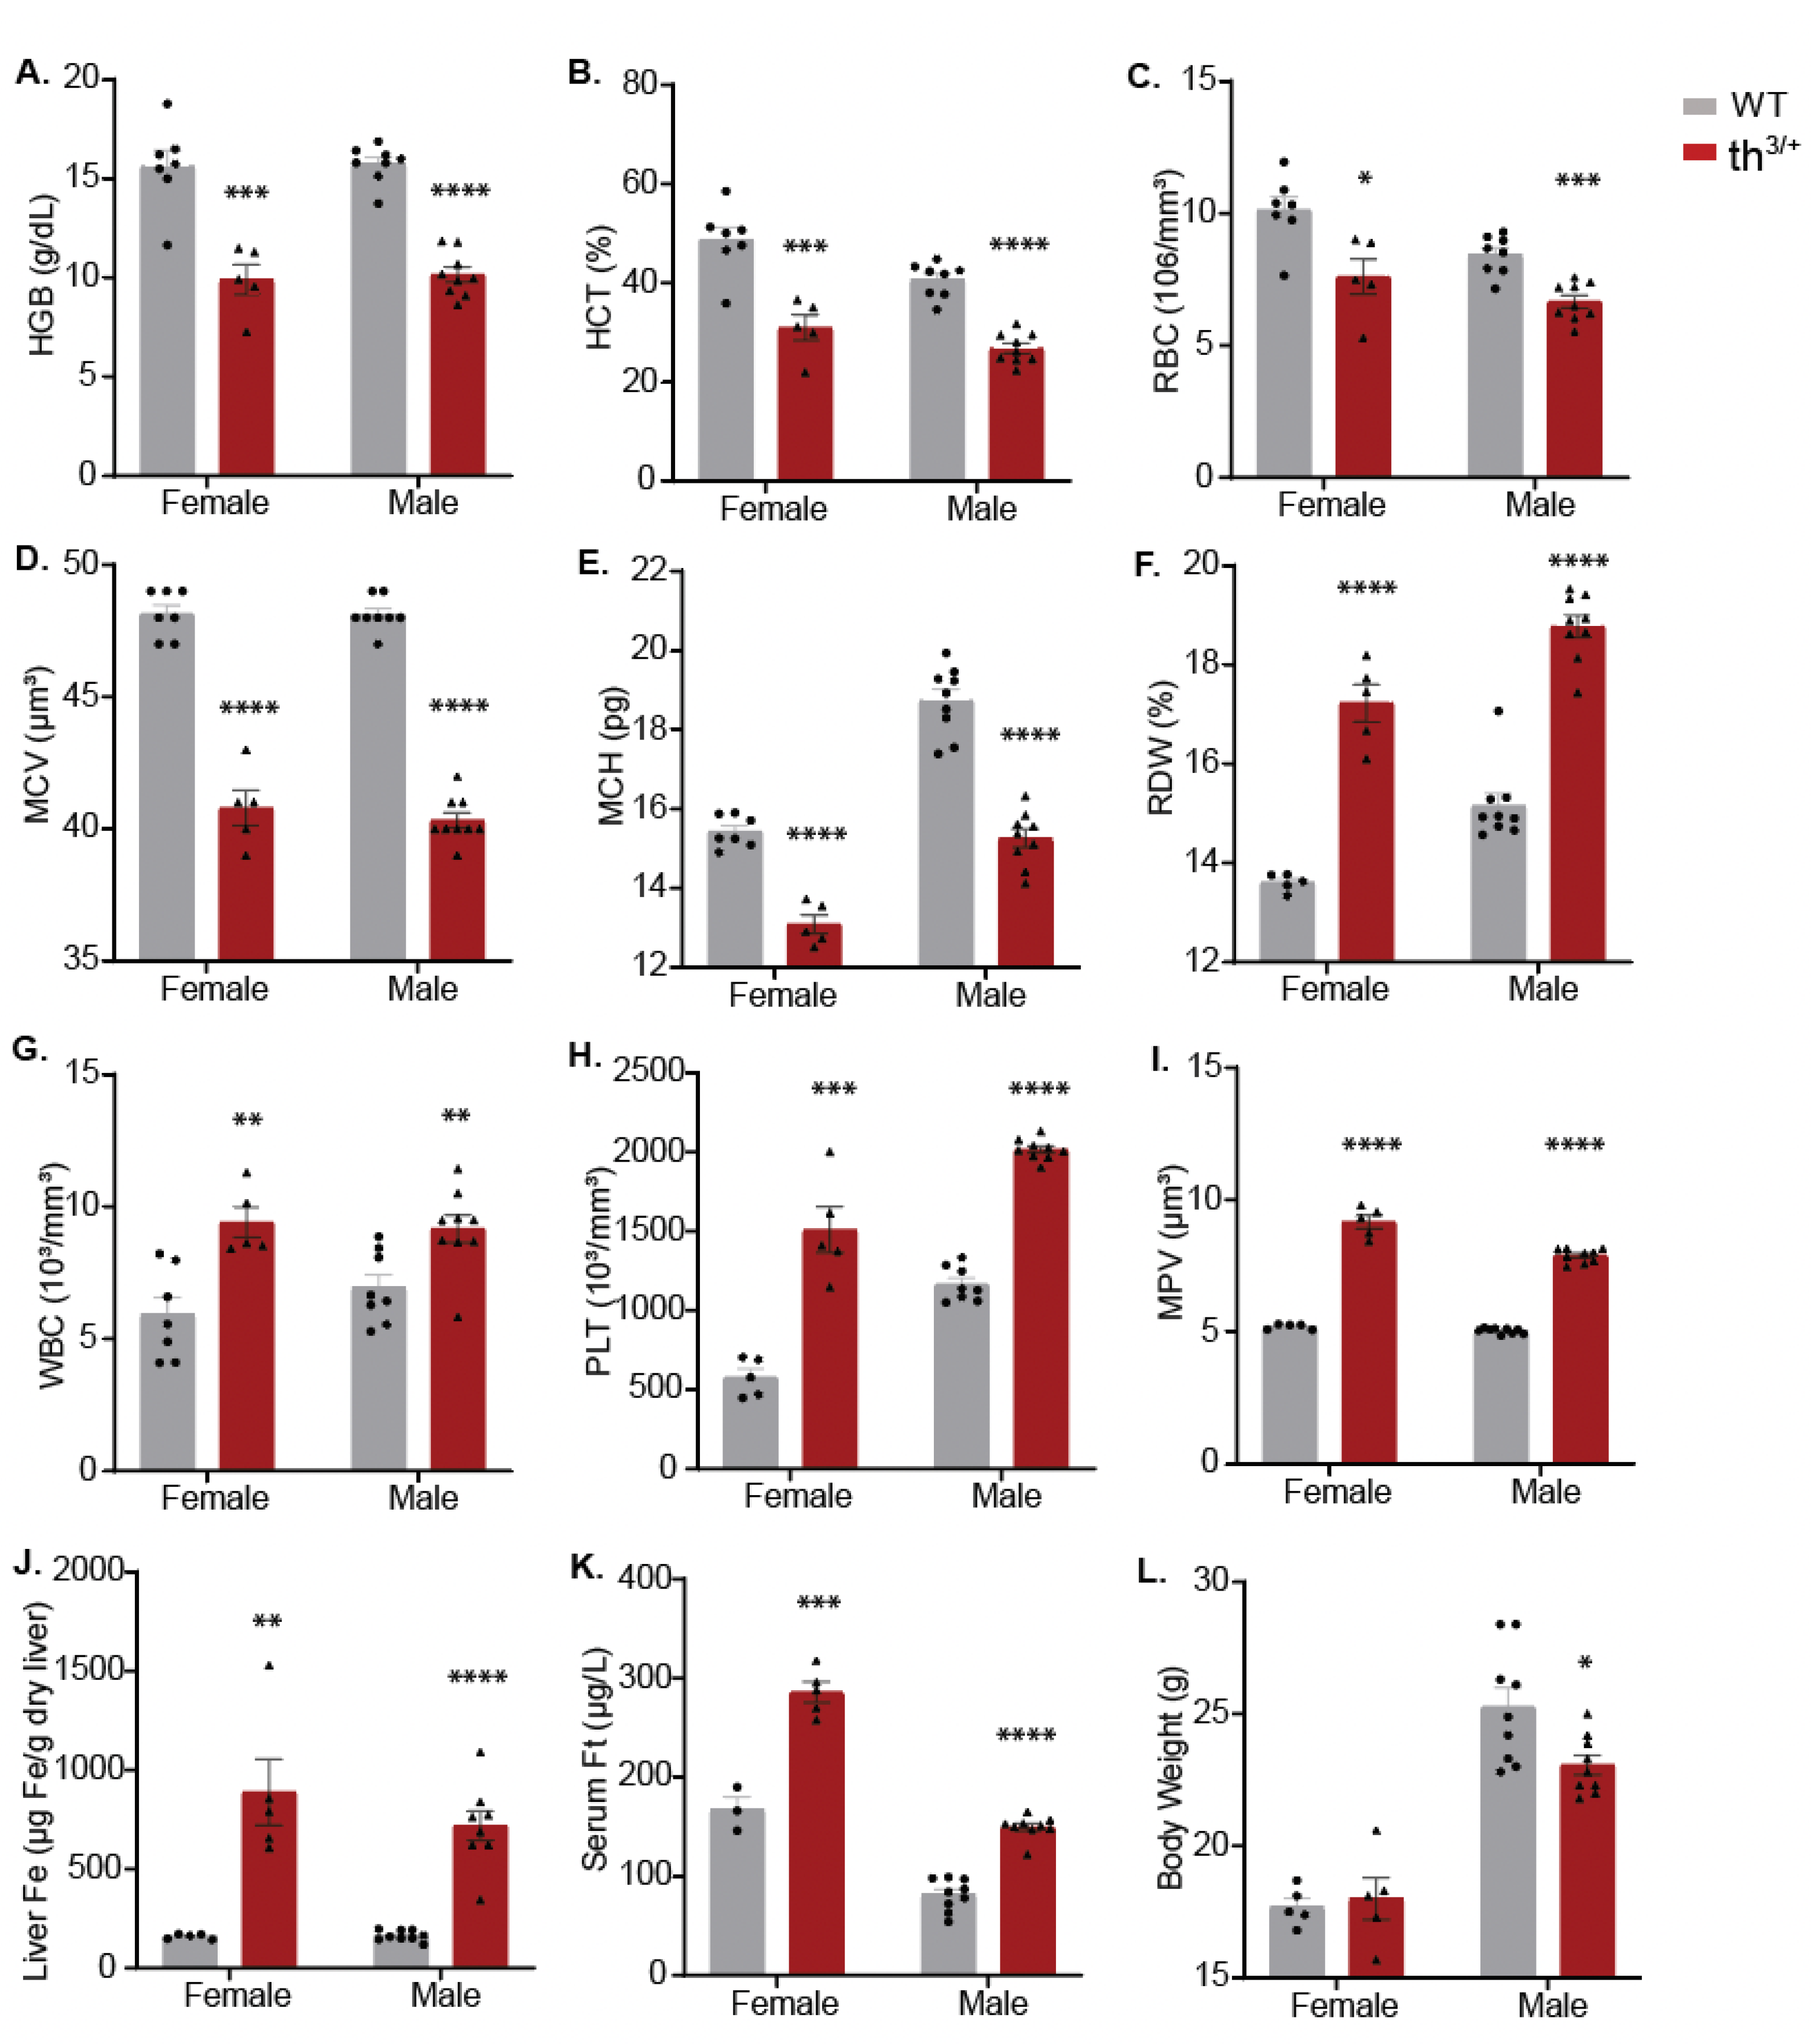
Abstract
1. Introduction
2. Results
2.1. Hematological and Iron Phenotype of 8-Week-Old th3/+ Mice
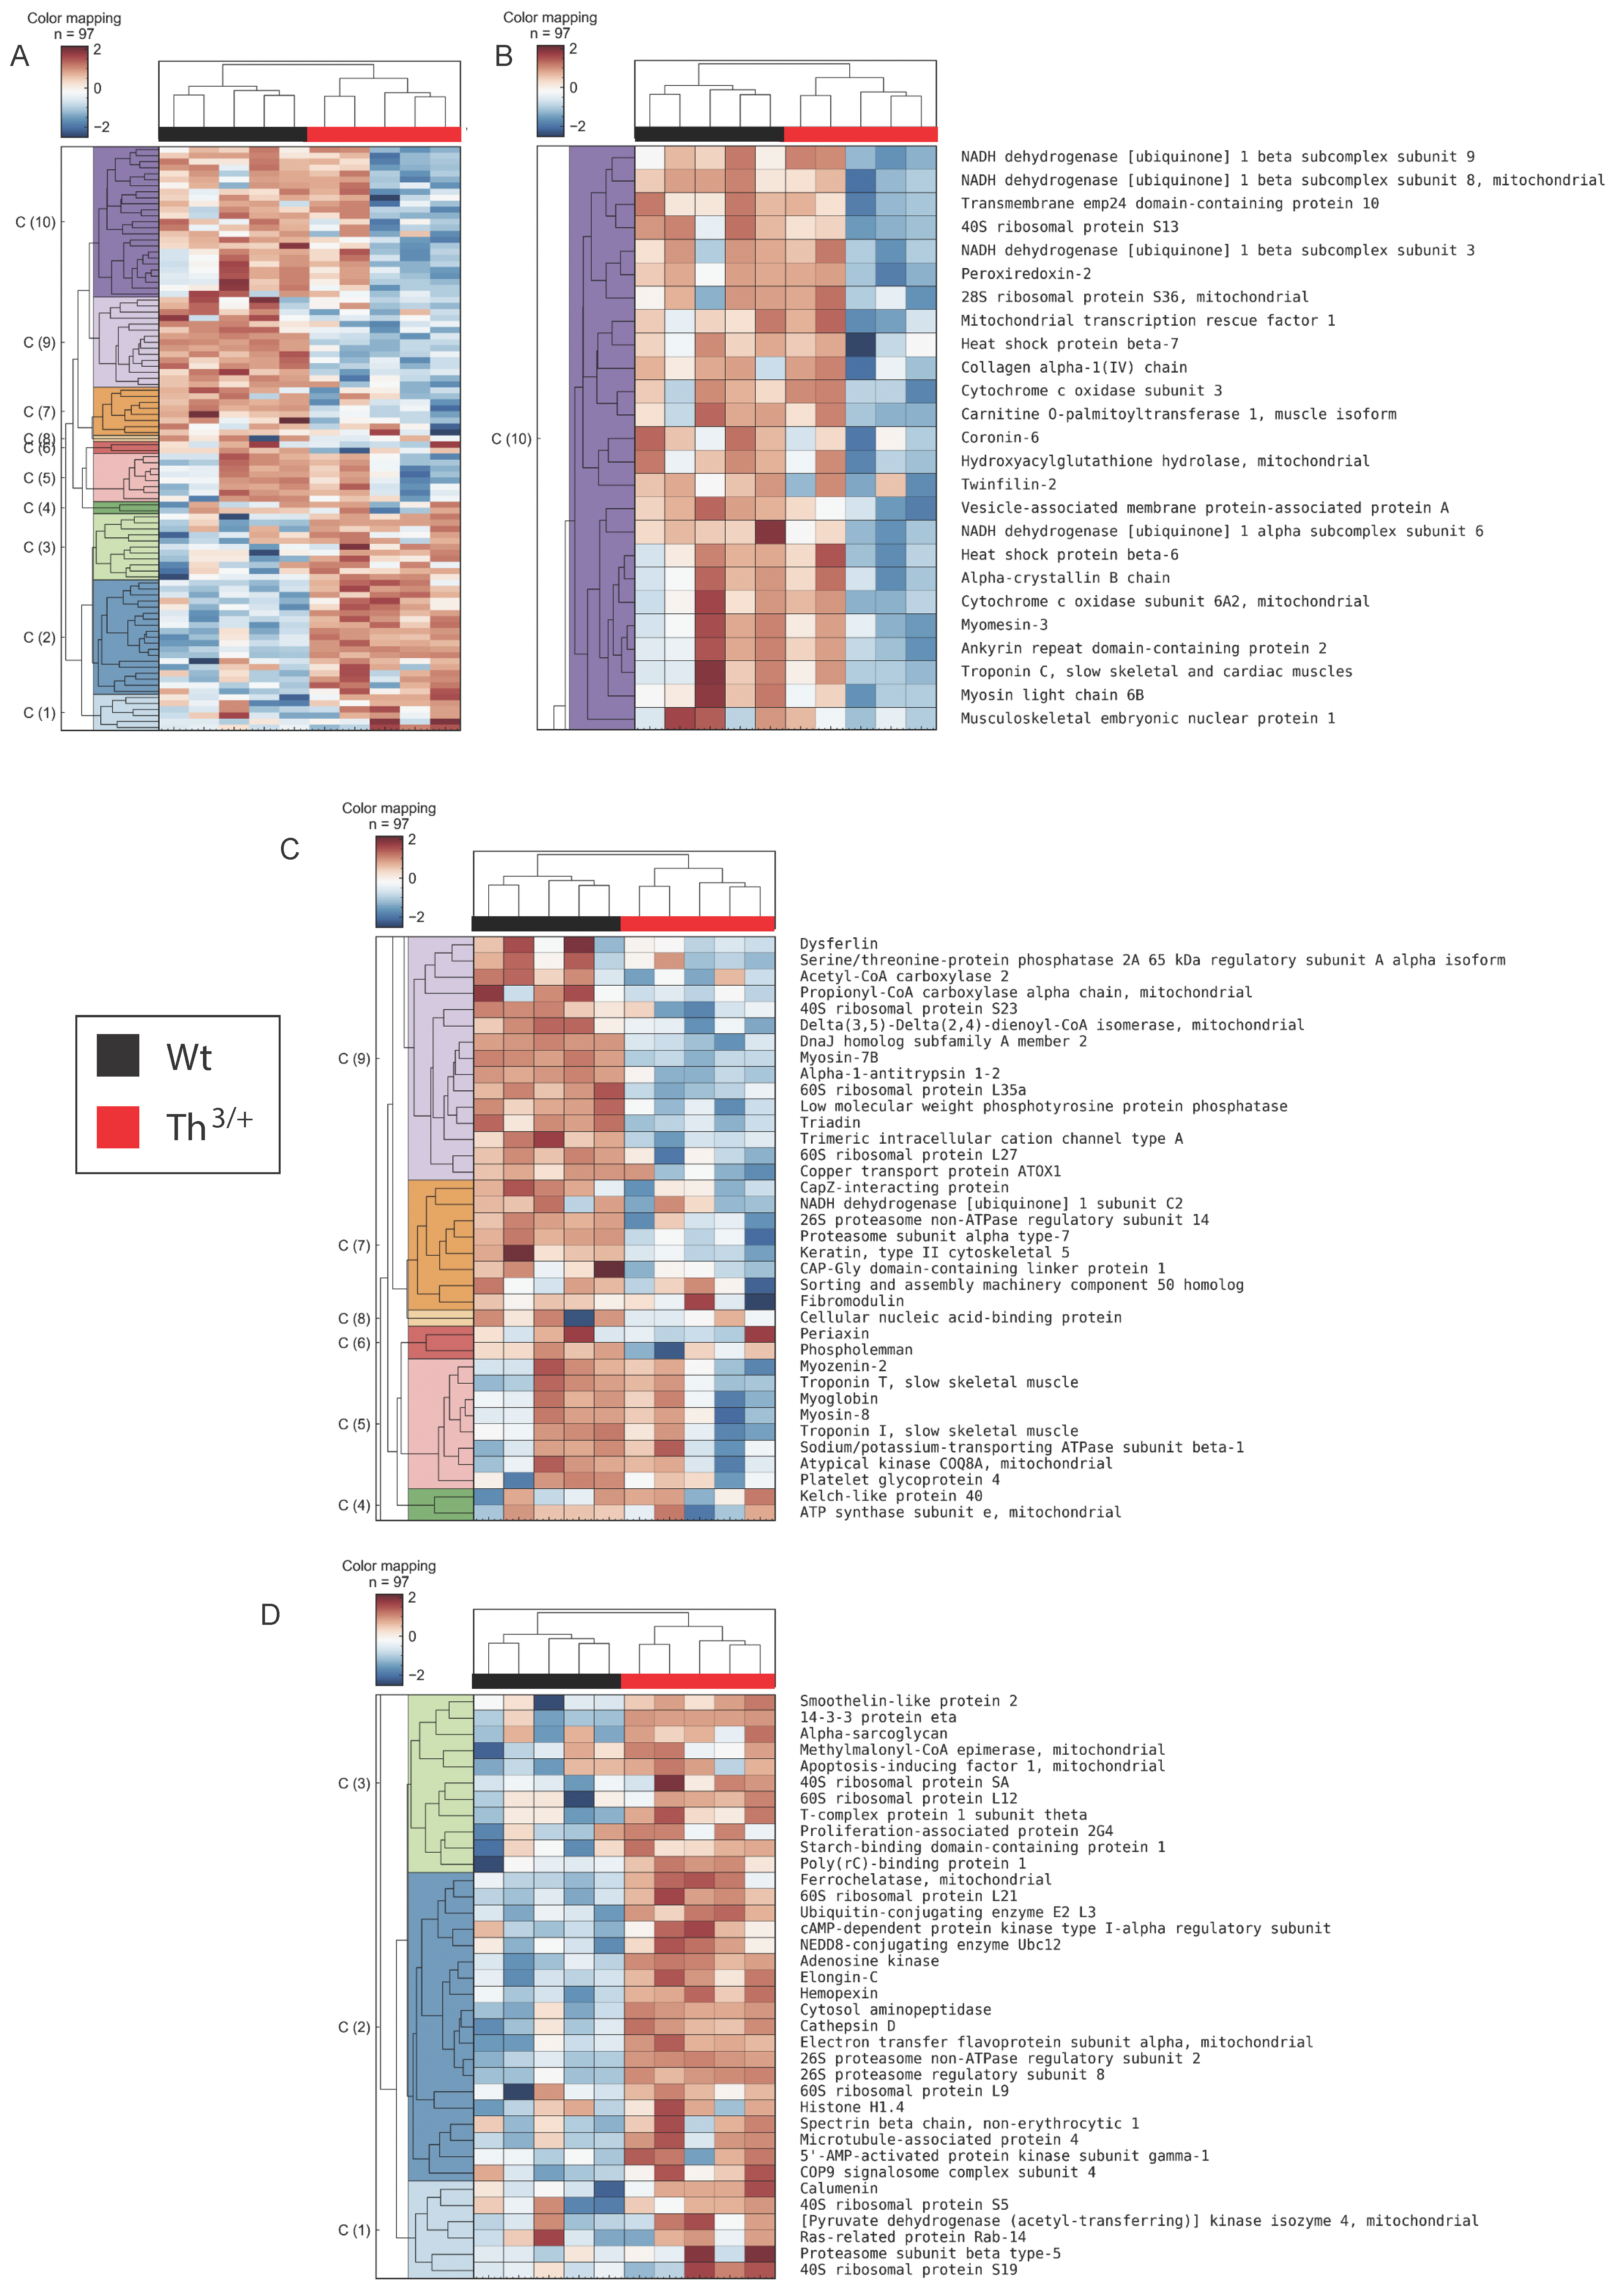
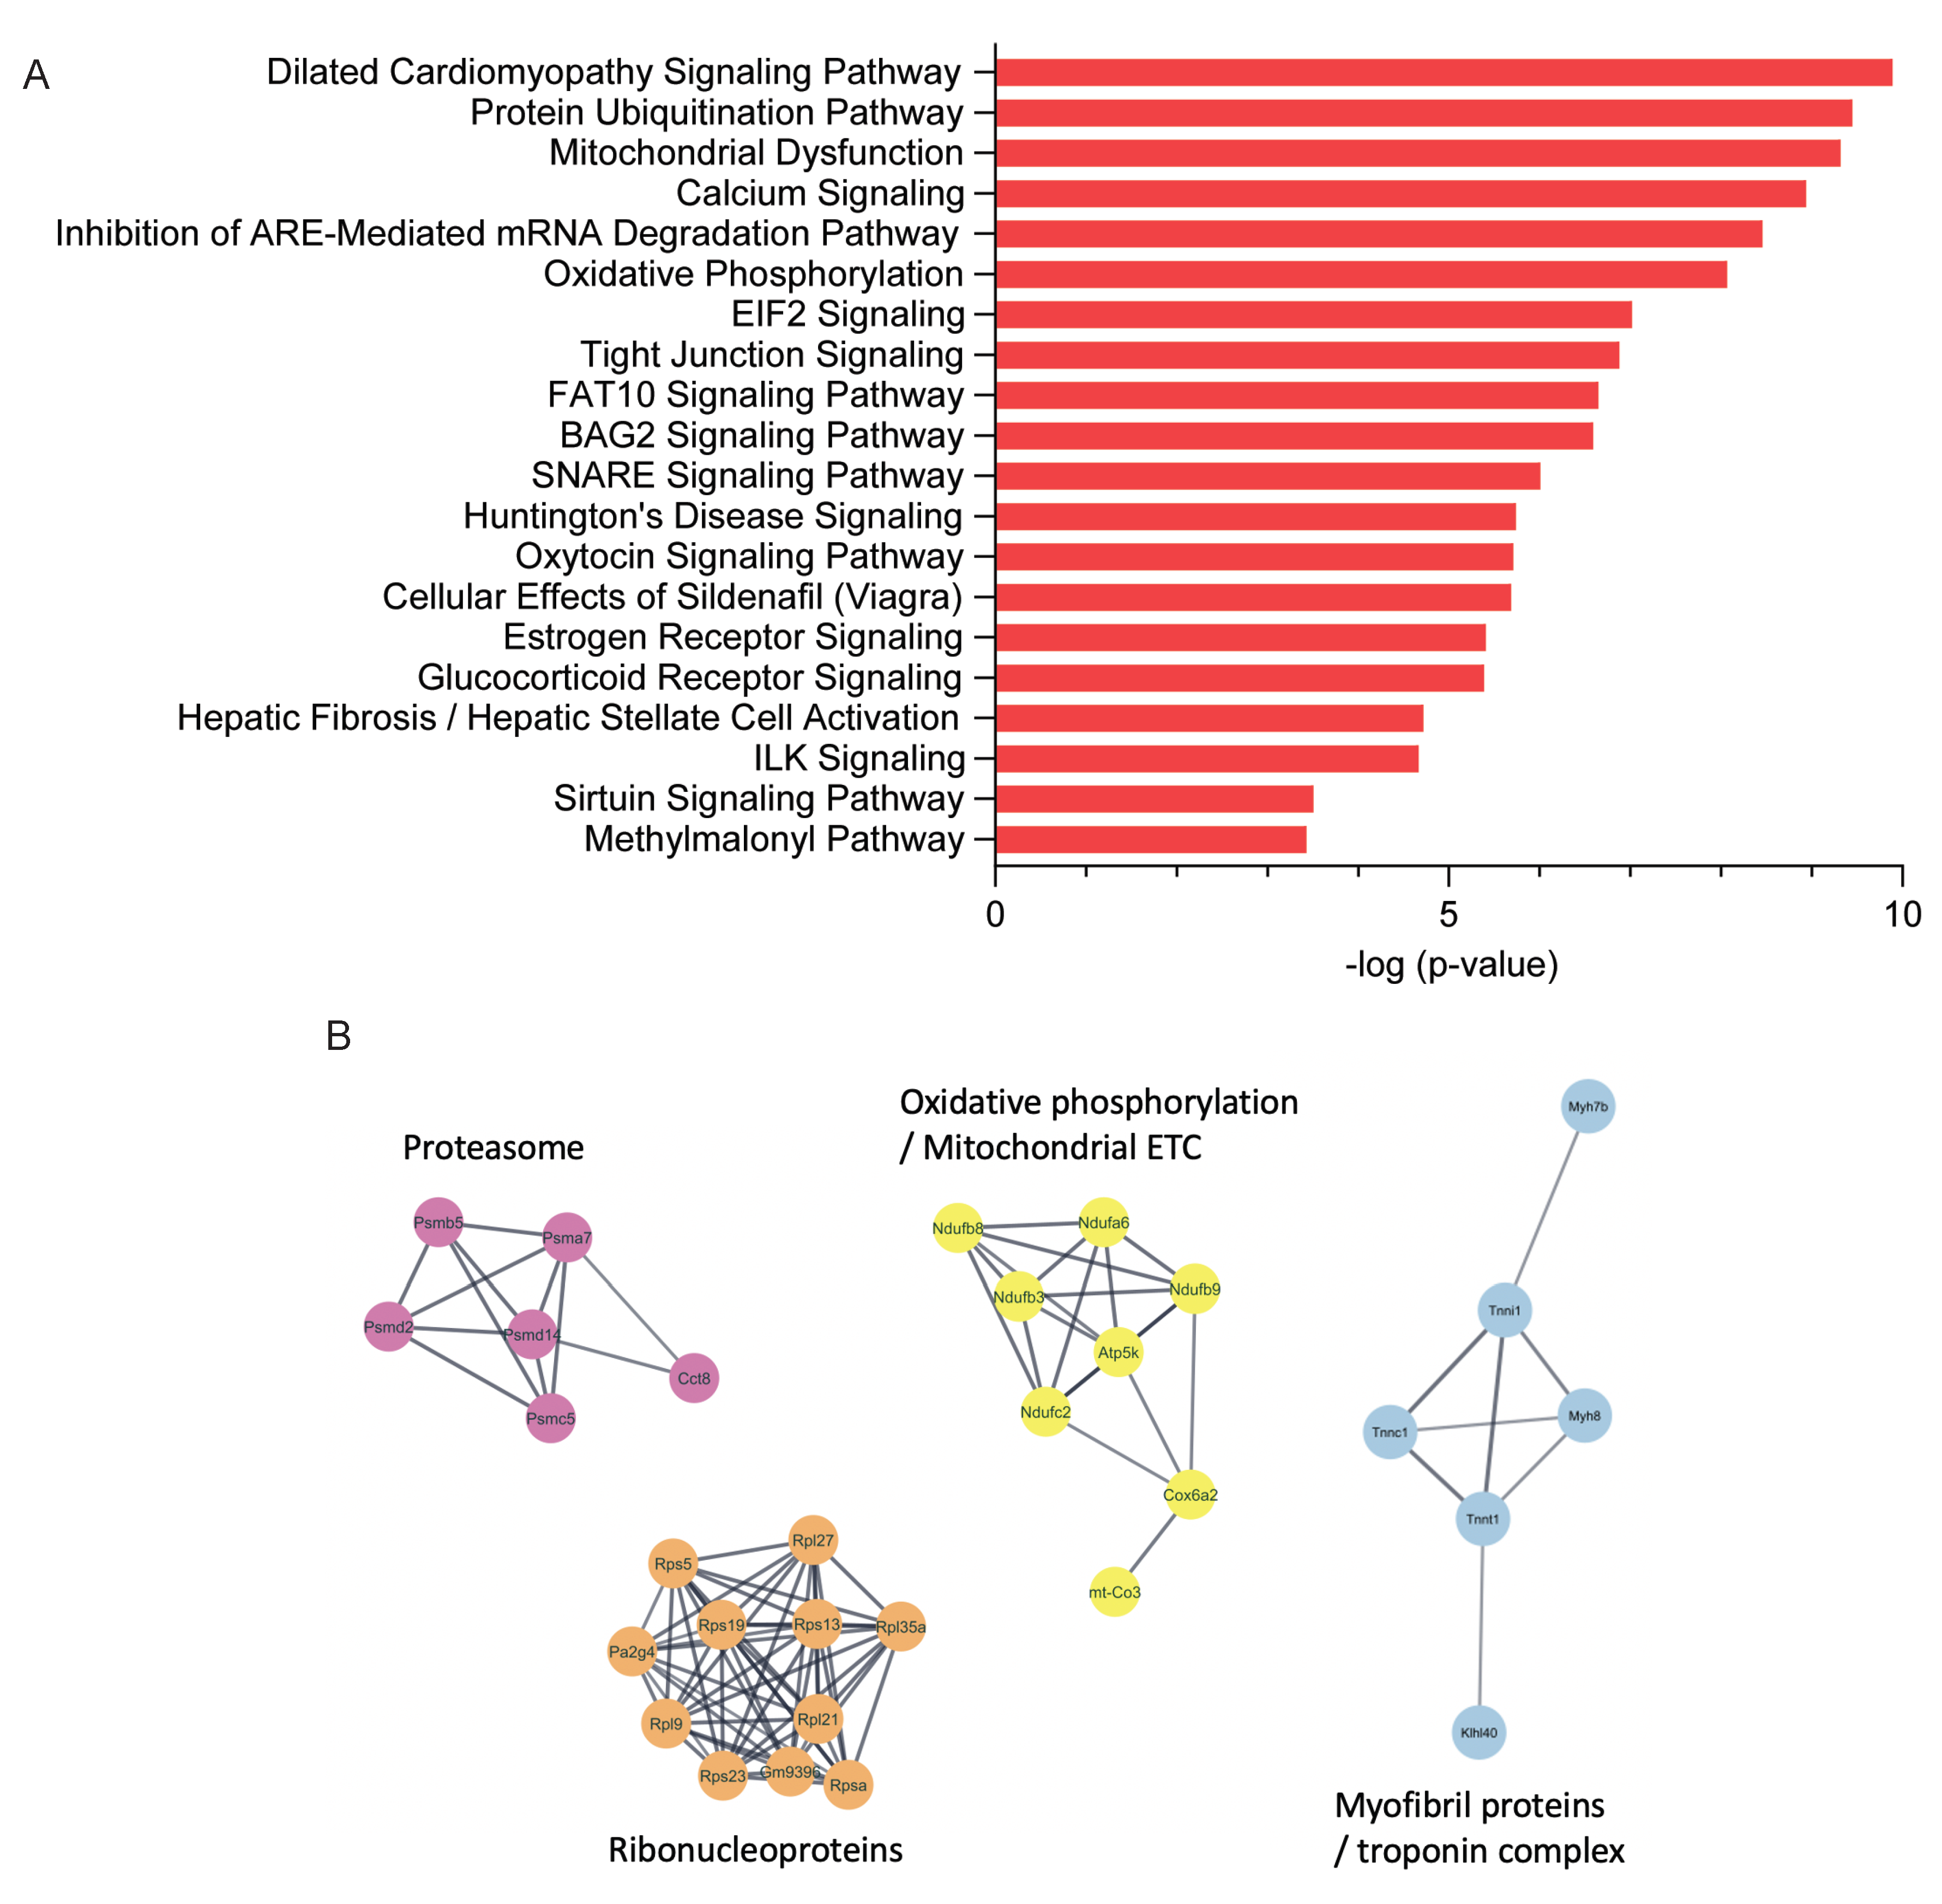
2.2. Proteomics Analysis of Skeletal Muscle
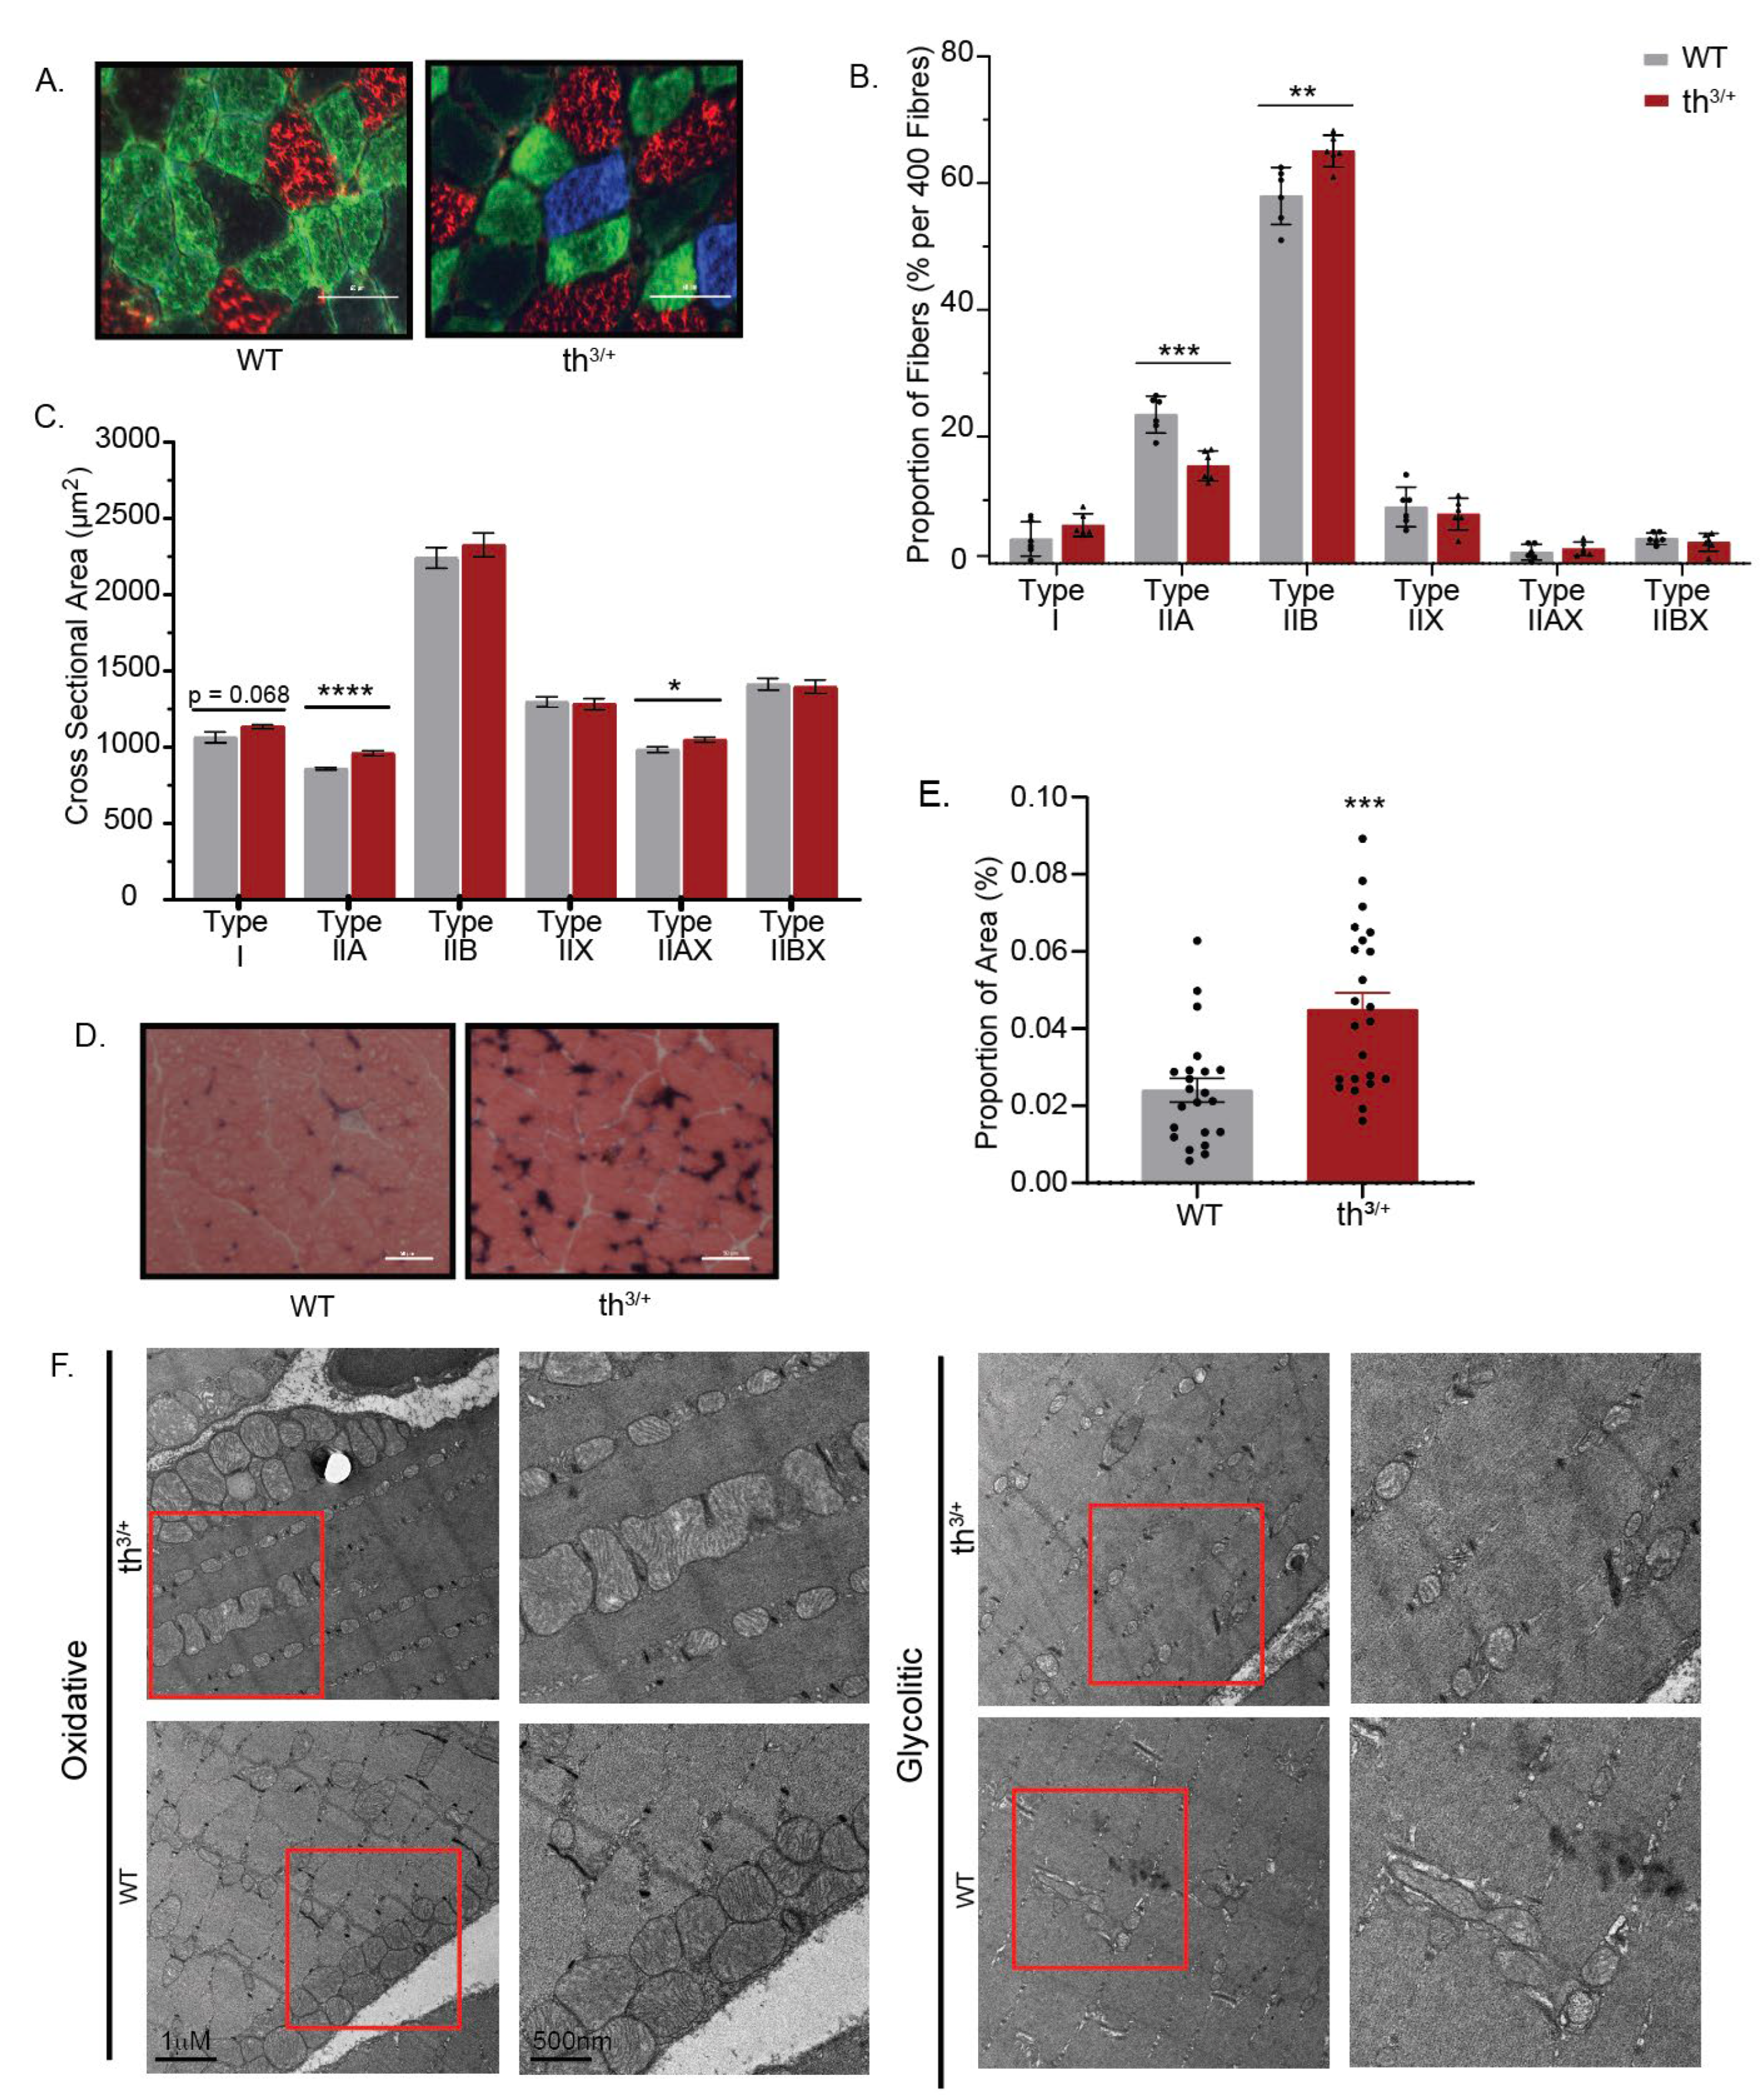
2.3. Partial Deletion of β-Globin Gene Results in Altered Phenotype in the Gastrocnemius Muscle of Thalassemia Mouse Model
2.4. Mitochondrial Content Is Changed in Skeletal Muscle of Thalassemia Model
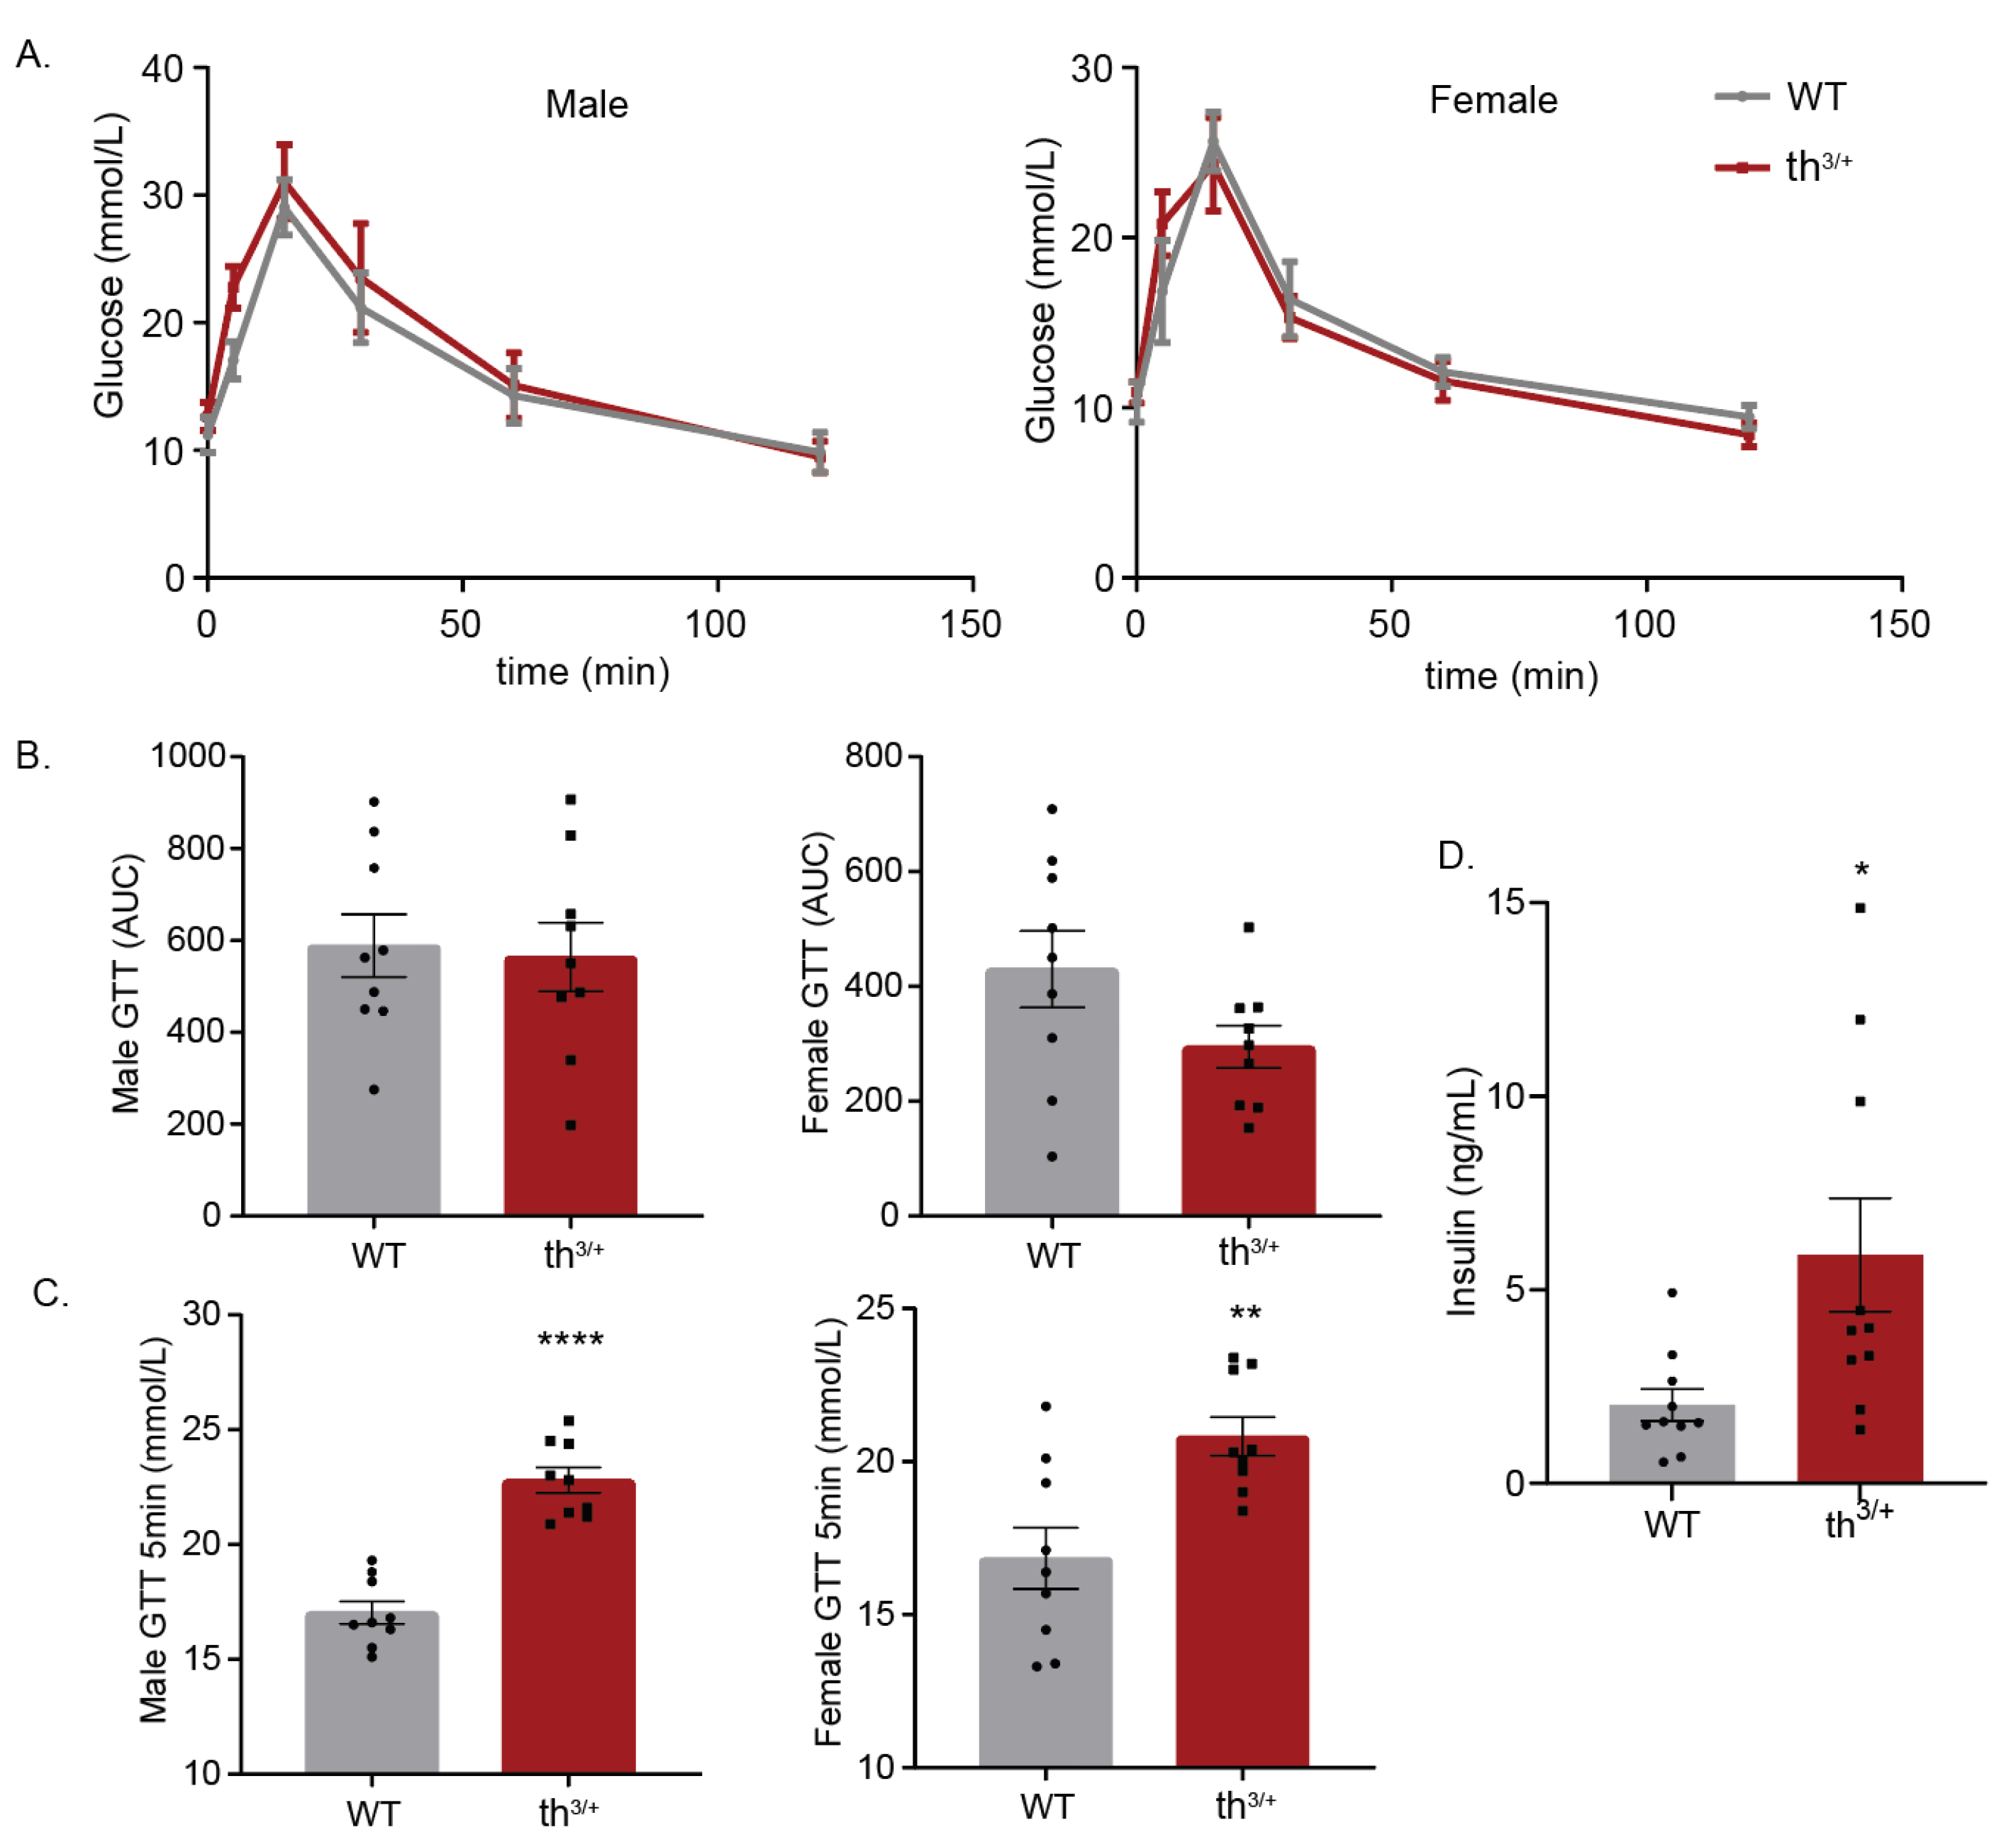
2.5. Metabolic Analysis of 8-Week-Old th3/+ Mice
3. Discussion
4. Materials and Methods
4.1. Experimental Animals, Serum and Tissue Collection
4.2. Hematological Analysis, Serum Biochemistry and Quantification of Liver Iron
4.3. Global Proteome Analysis of WT and Thalassemic Mouse Muscle Tissues
4.4. LC-MS/MS Acquisition and Data Analysis
4.5. Analysis of Proteomics Data
4.6. Fibre Typing
4.7. Alkaline Phosphatase Stain
4.8. Transmission Electron Microscopy (TEM)
4.9. PCR Analysis
4.10. Western Blotting
4.11. Glucose Tolerance Test (GTT) and Analysis of Insulin
4.12. Statistical Analysis
Author Contributions
Funding
Institutional Review Board Statement
Informed Consent Statement
Data Availability Statement
Conflicts of Interest
References
- Piel, F.B.; Weatherall, D.J. The alpha-thalassemias. N. Engl. J. Med. 2014, 371, 1908–1916. [Google Scholar] [CrossRef]
- Taher, A.T.; Musallam, K.M.; Cappellini, M.D. beta-Thalassemias. N. Engl. J. Med. 2021, 384, 727–743. [Google Scholar] [CrossRef]
- Vichinsky, E.; Neumayr, L.; Trimble, S.; Giardina, P.J.; Cohen, A.R.; Coates, T.; Boudreaux, J.; Neufeld, E.J.; Kenney, K.; Grant, A.; et al. Transfusion complications in thalassemia patients: A report from the Centers for Disease Control and Prevention (CME). Transfusion 2014, 54, 972–981. [Google Scholar] [CrossRef]
- Ganz, T. Erythropoietic regulators of iron metabolism. Free Radic. Biol. Med. 2019, 133, 69–74. [Google Scholar] [CrossRef]
- Pantopoulos, K. Inherited Disorders of Iron Overload. Front. Nutr. 2018, 5, 103. [Google Scholar] [CrossRef]
- Mobarra, N.; Shanaki, M.; Ehteram, H.; Nasiri, H.; Sahmani, M.; Saeidi, M.; Goudarzi, M.; Pourkarim, H.; Azad, M. A Review on Iron Chelators in Treatment of Iron Overload Syndromes. Int. J. Hematol. Oncol. Stem Cell Res. 2016, 10, 239–247. [Google Scholar]
- Li, M.J.; Peng, S.S.F.; Lu, M.Y.; Chang, H.H.; Yang, Y.L.; Jou, S.T.; Lin, D.T.; Lin, K.H. Diabetes mellitus in patients with thalassemia major. Pediatr. Blood Cancer 2014, 61, 20–24. [Google Scholar] [CrossRef]
- Borgna-Pignatti, C.; Cappellini, M.; De Stefano, P.; Del Vecchio, G.; Forni, G.; Gamberini, M.; Ghilardi, R.; Origa, R.; Piga, A.; Romeo, M. Survival and complications in thalassemia. Ann. N. Y. Acad. Sci. 2005, 1054, 40–47. [Google Scholar] [CrossRef]
- Azami, M.; Sharifi, A.; Norozi, S.; Mansouri, A.; Sayehmiri, K. Prevalence of diabetes, impaired fasting glucose and impaired glucose tolerance in patients with thalassemia major in Iran: A meta-analysis study. Casp. J. Intern. Med. 2017, 8, 1–15. [Google Scholar]
- De Sanctis, V.; Soliman, A.T.; Elsedfy, H.; Pepe, A.; Kattamis, C.; El Kholy, M.; Yassin, M. Diabetes and Glucose Metabolism in Thalassemia Major: An Update. Expert Rev. Hematol. 2016, 9, 401–408. [Google Scholar] [CrossRef]
- Hershko, C. Pathogenesis and management of iron toxicity in thalassemia. Ann. N. Y. Acad. Sci. 2010, 1202, 1–9. [Google Scholar] [CrossRef]
- Ferro, E.; Visalli, G.; Civa, R.; La Rosa, M.A.; Randazzo Papa, G.; Baluce, B.; D’Ascola, D.G.; Piraino, B.; Salpietro, C.; Di Pietro, A. Oxidative damage and genotoxicity biomarkers in transfused and untransfused thalassemic subjects. Free Radic. Biol. Med. 2012, 53, 1829–1837. [Google Scholar] [CrossRef]
- Lal, A.; Gomez, E.; Calloway, C. Increased mitochondrial DNA deletions and copy number in transfusion-dependent thalassemia. JCI Insight 2016, 1, e88150. [Google Scholar] [CrossRef]
- Khungwanmaythawee, K.; Sornjai, W.; Paemanee, A.; Jaratsittisin, J.; Fucharoen, S.; Svasti, S.; Lithanatudom, P.; Roytrakul, S.; Smith, D.R. Mitochondrial Changes in β0-Thalassemia/Hb E Disease. PLoS ONE 2016, 11, e0153831. [Google Scholar] [CrossRef]
- Kumfu, S.; Chattipakorn, S.; Fucharoen, S.; Chattipakorn, N. Ferric iron uptake into cardiomyocytes of β-thalassemic mice is not through calcium channels. Drug Chem. Toxicol. 2013, 36, 329–334. [Google Scholar] [CrossRef]
- Kumfu, S.; Chattipakorn, S.; Srichairatanakool, S.; Settakorn, J.; Fucharoen, S.; Chattipakorn, N. T-type calcium channel as a portal of iron uptake into cardiomyocytes of beta-thalassemic mice. Eur. J. Haematol. 2011, 86, 156–166. [Google Scholar] [CrossRef]
- Vincent, L.; Féasson, L.; Oyono-Enguéllé, S.; Banimbek, V.; Denis, C.; Guarneri, C.; Aufradet, E.; Monchanin, G.; Martin, C.; Gozal, D.; et al. Remodeling of skeletal muscle microvasculature in sickle cell trait and alpha-thalassemia. Am. J. Physiol. Heart Circ. Physiol. 2010, 298, H375–H384. [Google Scholar] [CrossRef]
- Sanyear, C.; Butthep, P.; Nithipongvanich, R.; Sirankapracha, P.; Winichagoon, P.; Fucharoen, S.; Svasti, S. Cardiomyocyte ultrastructural damage in β-thalassaemic mice. Int. J. Exp. Pathol. 2013, 94, 336–342. [Google Scholar] [CrossRef]
- Abdulsada, S.H. Metabolic syndrome in Iraqi female patients with major β-thalassemia. Al-Mustansiriyah J. Sci. 2016, 27, 39–42. [Google Scholar] [CrossRef]
- Saki, F.; Bahadori, R.; Kashkooli, N.M.; Jazayeri, A.; Ghahremani, N.; Omrani, G.H.R. Prevalence of metabolic syndrome in beta thalassemia major adolescents in southern Iran: A cross-sectional study. Int. J. Diabetes Dev. Ctries. 2018, 39, 444–450. [Google Scholar] [CrossRef]
- Deugnier, Y.; Bardou-Jacquet, E.; Laine, F. Dysmetabolic iron overload syndrome (DIOS). Presse Med. 2017, 46, e306–e311. [Google Scholar] [CrossRef]
- Britton, R.S.; Leicester, K.L.; Bacon, B.R. Iron toxicity and chelation therapy. Int. J. Hematol. 2002, 76, 219–228. [Google Scholar] [CrossRef]
- Miliotou, A.N.; Pappas, I.S.; Spyroulias, G.; Vlachaki, E.; Tsiftsoglou, A.S.; Vizirianakis, I.S.; Papadopoulou, L.C. Development of a novel PTD-mediated IVT-mRNA delivery platform for potential protein replacement therapy of metabolic/genetic disorders. Mol. Ther. Nucleic Acids 2021, 26, 694–710. [Google Scholar] [CrossRef]
- Matte, A.; De Falco, L.; Iolascon, A.; Mohandas, N.; An, X.; Siciliano, A.; Leboeuf, C.; Janin, A.; Bruno, M.; Choi, S.Y.; et al. The Interplay Between Peroxiredoxin-2 and Nuclear Factor-Erythroid 2 Is Important in Limiting Oxidative Mediated Dysfunction in beta-Thalassemic Erythropoiesis. Antioxid. Redox Signal. 2015, 23, 1284–1297. [Google Scholar] [CrossRef]
- Lee, H.; Ha, T.Y.; Jung, C.H.; Nirmala, F.S.; Park, S.Y.; Huh, Y.H.; Ahn, J. Mitochondrial dysfunction in skeletal muscle contributes to the development of acute insulin resistance in mice. J. Cachexia Sarcopenia Muscle 2021, 12, 1925–1939. [Google Scholar] [CrossRef]
- Jahng, J.W.S.; Alsaadi, R.M.; Palanivel, R.; Song, E.; Hipolito, V.E.B.; Sung, H.K.; Botelho, R.J.; Russell, R.C.; Sweeney, G. Iron overload inhibits late stage autophagic flux leading to insulin resistance. EMBO Rep. 2019, 20, e47911. [Google Scholar] [CrossRef]
- Sung, H.K.; Song, E.; Jahng, J.W.S.; Pantopoulos, K.; Sweeney, G. Iron induces insulin resistance in cardiomyocytes via regulation of oxidative stress. Sci. Rep. 2019, 9, 4668. [Google Scholar] [CrossRef]
- Picca, A.; Mankowski, R.T.; Kamenov, G.; Anton, S.D.; Manini, T.M.; Buford, T.W.; Saini, S.K.; Calvani, R.; Landi, F.; Bernabei, R.; et al. Advanced Age Is Associated with Iron Dyshomeostasis and Mitochondrial DNA Damage in Human Skeletal Muscle. Cells 2019, 8, 1525. [Google Scholar] [CrossRef]
- Khandros, E.; Weiss, M.J. Protein quality control during erythropoiesis and hemoglobin synthesis. Hematol. Oncol. Clin. N. Am. 2010, 24, 1071–1088. [Google Scholar] [CrossRef]
- Lechauve, C.; Keith, J.; Khandros, E.; Fowler, S.; Mayberry, K.; Freiwan, A.; Thom, C.S.; Delbini, P.; Romero, E.B.; Zhang, J.; et al. The autophagy-activating kinase ULK1 mediates clearance of free alpha-globin in beta-thalassemia. Sci. Transl. Med. 2019, 11, eaav4881. [Google Scholar] [CrossRef]
- Anastasiadi, A.T.; Tzounakas, V.L.; Arvaniti, V.Z.; Dzieciatkowska, M.; Stamoulis, K.; Lekka, M.E.; Papassideri, I.S.; D’Alessandro, A.; Kriebardis, A.G.; Antonelou, M.H. Red Blood Cell Proteasome in Beta-Thalassemia Trait: Topology of Activity and Networking in Blood Bank Conditions. Membranes 2021, 11, 716. [Google Scholar] [CrossRef]
- Bergemalm, D.; Ramstrom, S.; Kardeby, C.; Hultenby, K.; Eremo, A.G.; Sihlbom, C.; Bergstrom, J.; Palmblad, J.; Astrom, M. Platelet proteome and function in X-linked thrombocytopenia with thalassemia and in silico comparisons with gray platelet syndrome. Haematologica 2021, 106, 2947–2959. [Google Scholar] [CrossRef]
- Chaichompoo, P.; Svasti, S.; Smith, D.R. The Roles of Mitophagy and Autophagy in Ineffective Erythropoiesis in beta-Thalassemia. Int. J. Mol. Sci. 2022, 23, 10811. [Google Scholar] [CrossRef]
- Kitada, M.; Koya, D. Autophagy in metabolic disease and ageing. Nat. Rev. Endocrinol. 2021, 17, 647–661. [Google Scholar] [CrossRef]
- Martin, D.; Nay, K.; Robin, F.; Rebillard, A.; Orfila, L.; Martin, B.; Leroyer, P.; Guggenbuhl, P.; Dufresne, S.; Noirez, P.; et al. Oxidative and glycolytic skeletal muscles deploy protective mechanisms to avoid atrophy under pathophysiological iron overload. J. Cachexia Sarcopenia Muscle 2022, 13, 1250–1261. [Google Scholar] [CrossRef]
- Correa-Vela, M.; Lupo, V.; Montpeyo, M.; Sancho, P.; Marce-Grau, A.; Hernandez-Vara, J.; Darling, A.; Jenkins, A.; Fernandez-Rodriguez, S.; Tello, C.; et al. Impaired proteasome activity and neurodegeneration with brain iron accumulation in FBXO7 defect. Ann. Clin. Transl. Neurol. 2020, 7, 1436–1442. [Google Scholar] [CrossRef]
- Bordini, J.; Morisi, F.; Cerruti, F.; Cascio, P.; Camaschella, C.; Ghia, P.; Campanella, A. Iron Causes Lipid Oxidation and Inhibits Proteasome Function in Multiple Myeloma Cells: A Proof of Concept for Novel Combination Therapies. Cancers 2020, 12, 970. [Google Scholar] [CrossRef]
- Lithanatudom, P.; Smith, D.R. Analysis of protein profiling studies of beta-thalassemia/Hb E disease. Proteomics Clin. Appl. 2016, 10, 1093–1102. [Google Scholar] [CrossRef]
- Li, N.; An, P.; Wang, J.; Zhang, T.; Qing, X.; Wu, B.; Sun, L.; Ding, X.; Niu, L.; Xie, Z.; et al. Plasma proteome profiling combined with clinical and genetic features reveals the pathophysiological characteristics of beta-thalassemia. iScience 2022, 25, 104091. [Google Scholar] [CrossRef]
- Botta, A.; Forest, A.; Daneault, C.; Pantopoulos, K.; Tantiworawit, A.; Phrommintikul, A.; Chattipakorn, S.; Chattipakorn, N.; Des Rosiers, C.; Sweeney, G. Identification of Circulating Endocan-1 and Ether Phospholipids as Biomarkers for Complications in Thalassemia Patients. Metabolites 2021, 11, 70. [Google Scholar] [CrossRef]
- Iqbal, A.; Ansari, S.H.; Parveen, S.; Khan, I.A.; Siddiqui, A.J.; Musharraf, S.G. Hydroxyurea Treated beta-Thalassemia Children Demonstrate a Shift in Metabolism Towards Healthy Pattern. Sci. Rep. 2018, 8, 15152. [Google Scholar] [CrossRef]
- Iqbal, A.; Siddiqui, A.J.; Huang, J.H.; Ansari, S.H.; Musharraf, S.G. Impact of hydroxyurea therapy on serum fatty acids of beta-thalassemia patients. Metabolomics 2018, 14, 27. [Google Scholar] [CrossRef]
- Yang, B.; Kirby, S.; Lewis, J.; Detloff, P.J.; Maeda, N.; Smithies, O. A mouse model for beta 0-thalassemia. Proc. Natl. Acad. Sci. USA 1995, 92, 11608–11612. [Google Scholar] [CrossRef]
- Daba, A.; Gkouvatsos, K.; Sebastiani, G.; Pantopoulos, K. Differences in activation of mouse hepcidin by dietary iron and parenterally administered iron dextran: Compartmentalization is critical for iron sensing. J. Mol. Med. (Berl.) 2013, 91, 95–102. [Google Scholar] [CrossRef]
- Zougman, A.; Selby, P.J.; Banks, R.E. Suspension trapping (STrap) sample preparation method for bottom-up proteomics analysis. Proteomics 2014, 14, 1006–1000. [Google Scholar] [CrossRef]
- Szklarczyk, D.; Gable, A.L.; Nastou, K.C.; Lyon, D.; Kirsch, R.; Pyysalo, S.; Doncheva, N.T.; Legeay, M.; Fang, T.; Bork, P.; et al. The STRING database in 2021: Customizable protein-protein networks, and functional characterization of user-uploaded gene/measurement sets. Nucleic Acids Res. 2021, 49, D605–D612. [Google Scholar] [CrossRef]
- Shannon, P.; Markiel, A.; Ozier, O.; Baliga, N.S.; Wang, J.T.; Ramage, D.; Amin, N.; Schwikowski, B.; Ideker, T. Cytoscape: A software environment for integrated models of biomolecular interaction networks. Genome Res. 2003, 13, 2498–2504. [Google Scholar] [CrossRef]
- Bloemberg, D.; Quadrilatero, J. Rapid determination of myosin heavy chain expression in rat, mouse, and human skeletal muscle using multicolor immunofluorescence analysis. PLoS ONE 2012, 7, e35273. [Google Scholar] [CrossRef]
- Quiros, P.M.; Goyal, A.; Jha, P.; Auwerx, J. Analysis of mtDNA/nDNA Ratio in Mice. Curr. Protoc. Mouse Biol. 2017, 7, 47–54. [Google Scholar] [CrossRef]
- Khan, M.B.N.; Iftikhar, F.; Khan, T.; Danish, A.; Shamsi, T.; Musharraf, S.G.; Siddiqui, A.J. IVS I-5 (G > C) is associated with changes to the RBC membrane lipidome in response to hydroxyurea treatment in β-thalassemia patients. Mol Omics. 2022, 18, 534–544. [Google Scholar] [CrossRef]
- Khalid, A.; Siddiqui, A.J.; Ansari, S.H.; Musharraf, S.G. Reflection of treatment proficiency of hydroxyurea treated β-thalassemia serum samples through nuclear magnetic resonance based metabonomics. Sci Rep. 2019, 9, 2041. [Google Scholar] [CrossRef]
- Datz, C.; Felder, T.K.; Niederseer, D.; Aigner, E. Iron homeostasis in the metabolic syndrome. Eur. J. Clin. Investig. 2013, 43, 215–224. [Google Scholar] [CrossRef]
- Rajpathak, S.N.; Crandall, J.P.; Wylie-Rosett, J.; Kabat, G.C.; Rohan, T.E.; Hu, F.B. The role of iron in type 2 diabetes in humans. Biochim. Biophys. Acta 2009, 1790, 671–681. [Google Scholar] [CrossRef]
- Murali, A.R.; Gupta, A.; Brown, K. Systematic review and meta-analysis to determine the impact of iron depletion in dysmetabolic iron overload syndrome and non-alcoholic fatty liver disease. Hepatol. Res. 2018, 48, E30–E41. [Google Scholar] [CrossRef]
- Kumfu, S.; Chattipakorn, S.C.; Chattipakorn, N. Iron overload cardiomyopathy: Using the latest evidence to inform future applications. Exp. Biol. Med. (Maywood) 2022, 247, 574–583. [Google Scholar] [CrossRef]
- Origa, R.; Galanello, R. Pathophysiology of beta thalassaemia. Pediatr. Endocrinol. Rev. 2011, 8 (Suppl. 2), 263–270. [Google Scholar]
- Tsagris, V.; Liapi-Adamidou, G. Serum carnitine levels in patients with homozygous beta thalassemia: A possible new role for carnitine? Eur. J. Pediatr. 2005, 164, 131–134. [Google Scholar] [CrossRef]
- Putburee, R.; Jetsrisuparb, A.; Fucharoen, S.; Tripatara, A. Mitochondrial ferritin expression in erythroid cells from patients with alpha-thalassaemia. Hematology 2018, 23, 844–848. [Google Scholar] [CrossRef]


Disclaimer/Publisher’s Note: The statements, opinions and data contained in all publications are solely those of the individual author(s) and contributor(s) and not of MDPI and/or the editor(s). MDPI and/or the editor(s) disclaim responsibility for any injury to people or property resulting from any ideas, methods, instructions or products referred to in the content. |
© 2023 by the authors. Licensee MDPI, Basel, Switzerland. This article is an open access article distributed under the terms and conditions of the Creative Commons Attribution (CC BY) license (https://creativecommons.org/licenses/by/4.0/).
Share and Cite
Reboucas, P.; Fillebeen, C.; Botta, A.; Cleverdon, R.; Steele, A.P.; Richard, V.; Zahedi, R.P.; Borchers, C.H.; Burelle, Y.; Hawke, T.J.; et al. Discovery-Based Proteomics Identify Skeletal Muscle Mitochondrial Alterations as an Early Metabolic Defect in a Mouse Model of β-Thalassemia. Int. J. Mol. Sci. 2023, 24, 4402. https://doi.org/10.3390/ijms24054402
Reboucas P, Fillebeen C, Botta A, Cleverdon R, Steele AP, Richard V, Zahedi RP, Borchers CH, Burelle Y, Hawke TJ, et al. Discovery-Based Proteomics Identify Skeletal Muscle Mitochondrial Alterations as an Early Metabolic Defect in a Mouse Model of β-Thalassemia. International Journal of Molecular Sciences. 2023; 24(5):4402. https://doi.org/10.3390/ijms24054402
Chicago/Turabian StyleReboucas, Patricia, Carine Fillebeen, Amy Botta, Riley Cleverdon, Alexandra P. Steele, Vincent Richard, René P. Zahedi, Christoph H. Borchers, Yan Burelle, Thomas J. Hawke, and et al. 2023. "Discovery-Based Proteomics Identify Skeletal Muscle Mitochondrial Alterations as an Early Metabolic Defect in a Mouse Model of β-Thalassemia" International Journal of Molecular Sciences 24, no. 5: 4402. https://doi.org/10.3390/ijms24054402
APA StyleReboucas, P., Fillebeen, C., Botta, A., Cleverdon, R., Steele, A. P., Richard, V., Zahedi, R. P., Borchers, C. H., Burelle, Y., Hawke, T. J., Pantopoulos, K., & Sweeney, G. (2023). Discovery-Based Proteomics Identify Skeletal Muscle Mitochondrial Alterations as an Early Metabolic Defect in a Mouse Model of β-Thalassemia. International Journal of Molecular Sciences, 24(5), 4402. https://doi.org/10.3390/ijms24054402