Article

Genome-Wide Characterization of the PIFs Family in Sweet Potato and Functional Identification of IbPIF3.1 under Drought and Fusarium Wilt Stresses

1
Key Laboratory of Sweet Potato Biology and Biotechnology, Ministry of Agriculture and Rural Affairs/Beijing Key Laboratory of Crop Genetic Improvement/Laboratory of Crop Heterosis and Utilization, Ministry of Education, College of Agronomy & Biotechnology, China Agricultural University, Beijing 100193, China
2
Institute of Sericulture and Tea, Zhejiang Academy of Agricultural Sciences, Hangzhou 310021, China
*
Author to whom correspondence should be addressed.
Int. J. Mol. Sci. 2023, 24(4), 4092; https://doi.org/10.3390/ijms24044092
Submission received: 10 January 2023 / Revised: 12 February 2023 / Accepted: 14 February 2023 / Published: 17 February 2023
(This article belongs to the Special Issue Function and Mechanism Analysis of Plant Stress Resistance Genes)

Abstract

:
Phytochrome-interacting factors (PIFs) are essential for plant growth, development, and defense responses. However, research on the PIFs in sweet potato has been insufficient to date. In this study, we identified PIF genes in the cultivated hexaploid sweet potato (Ipomoea batatas) and its two wild relatives, Ipomoea triloba, and Ipomoea trifida. Phylogenetic analysis revealed that IbPIFs could be divided into four groups, showing the closest relationship with tomato and potato. Subsequently, the PIFs protein properties, chromosome location, gene structure, and protein interaction network were systematically analyzed. RNA-Seq and qRT-PCR analyses showed that IbPIFs were mainly expressed in stem, as well as had different gene expression patterns in response to various stresses. Among them, the expression of IbPIF3.1 was strongly induced by salt, drought, H2O2, cold, heat, Fusarium oxysporum f. sp. batatas (Fob), and stem nematodes, indicating that IbPIF3.1 might play an important role in response to abiotic and biotic stresses in sweet potato. Further research revealed that overexpression of IbPIF3.1 significantly enhanced drought and Fusarium wilt tolerance in transgenic tobacco plants. This study provides new insights for understanding PIF-mediated stress responses and lays a foundation for future investigation of sweet potato PIFs.

1. Introduction

Light not only provides photosynthates and energy to plants, but is also an important environmental stimulus regulating plant growth and defense [1]. Plants respond to abiotic and biotic stresses by sensing changes in light wavelength, intensity, direction, and duration [2,3]. Photoreceptors play an essential role in light signal reception. Several photoreceptors have been found in plants, including phytochrome (PHY), cryptochrome (CRY), UV-B photoreceptor (UVR8), and phototropin [4,5,6], which are involved in a series of physiological and biochemical reactions in plants, such as photomorphogenesis, abiotic stress tolerance, and plant defense [7,8,9,10]. Phytochrome-interacting factors (PIFs) interact physically with the red and far-red light photoreceptors to mediate light responses [11,12,13]. When exposed to light, PHY promotes the rapid phosphorylation, sequential ubiquitination, and eventual degradation of PIFs [14]. Research has shown that PIFs can directly regulate the expression of downstream genes by binding to G-box (CACGTG) and/or E-box (CANNTG) motifs contained in their promoter [15].
PIFs are a subfamily of basic helix-loop-helix (bHLH) transcription factors [16]. Arabidopsis has at least eight PIFs (AtPIF1 to AtPIF8), which either redundantly or exclusively regulate plant growth and development. All AtPIFs contain a bHLH domain, which plays an important role in the formation of AtPIF homodimers and heterodimers [13]. The active phyB-binding (APB) domain is present in all AtPIFs, whereas the active phyA-binding (APA) domain is present only in AtPIF1 and AtPIF3. Aside from Arabidopsis, PIFs have been extensively studied in other plants, including 8 found in tomato [17], 4 in grape [18], 8 in apple [19], 7 in tea [20], 6 in pepper [21], 14 in peanut [22], 7 in potato [23], 30 in rapeseed [24], and 5 in carrot [25].
PIFs have been reported as key regulators of plant growth, development, and metabolism. AtPIF3, AtPIF4, and AtPIF7 promote Arabidopsis hypocotyl elongation [26]. RhPIF8 regulates rose petal senescence by modulating ROS homeostasis [27]. The overexpression of OsPIL1/OsPIL13 in transgenic rice plants promotes internode elongation [28]. SlPIF3 is involved in tocopherol biosynthesis during tomato fruit ripening [29]. In addition, accumulating evidence has indicated that PIFs are essential factors regulating the responses to various abiotic stresses. ZmPIF1 and ZmPIF3 have been shown to enhance drought tolerance in rice [30,31]. AtPIF3, AtPIF4, and AtPIF7 regulate plant cold tolerance by repressing CBF/DREB1 gene expression [32,33,34]. In Arabidopsis, AtPIF4 inhibits secondary cell wall thickening and induces the shade avoidance [35]. The role of PIFs in regulating plant defense responses has also been studied. AtPIF4 acts as a negative regulator of immunity and increases susceptibility to Pseudomonas syringae pv. tomato DC3000 [36]. PIF1/3/4/5 negatively regulate Arabidopsis resistance to Botrytis cinerea during plant defense against necrotic pathogens [37]. In recent years, increasingly more studies have noted that PIFs play an important role in increasing crop yields. Knockout of OsPIL15 using CRISPR/Cas9 improves grain size and weight in rice [38]. ZmPIF1 enhances rice yield by increasing tiller number and panicle number [30]. However, the related molecular mechanism in sweet potato is still poorly understood.
Sweet potato (Ipomoea batatas (L.) Lam., 2n = 6x = 90) is a dicotyledonous plant of the Convolvulaceae family. Sweet potato is the seventh largest food crop in the world and has been considered as a new type of bioenergy [39]. Due to its strong adaptability and resistance, it is widely planted in drought, waterlogged, and saline areas [40]. Several genes have been reported to be associated with abiotic stress in sweet potato, including IbMIPS1, IbC3H18, IbBBX24, ItfWRKY70, IbPYL8, IbbHLH66, IbbHLH118, and IbMYB48 [41,42,43,44,45,46]. Sweet potato is susceptible to many pests and diseases, which may cause huge economic losses in crop production. Fusarium wilt, a soil-borne pathogenic fungal disease caused by Fusarium oxysporum f. sp. batatas (Fob), is one of the most destructive diseases in sweet potato plants [47]. Once infected with Fob, the leaves and veins shrivel and the plant eventually dies [48]. Plant parasitic stem nematodes mainly damage plant roots and underground tissues, seriously affecting the yield and quality of sweet potato [49]. At present, some progress has been made on the defense mechanism of sweet potato. IbSWEET10 and IbBBX24 improve resistance to Fusarium wilt of transgenic sweet potato [43,50]. IbMIPS1 significantly increases callose and lignin content and enhances stem nematode resistance in transgenic sweet potato [41]. However, the study of PIF genes in sweet potato under stress has not been reported. Due to the complicated and highly heterozygous genetic background of sweet potato, the improvement of its agronomic traits is limited [51]. With the continuous advancement of sequencing technology, the genome assembly of hexaploid sweet potato Taizhong 6 [52], and two diploid species, Ipomoea triloba NCNSP0323 (2n = 2x = 30) and Ipomoea trifida NCNSP0306 (2n = 2x = 30) have recently been completed [53], making it possible to systematically investigate important gene families in sweet potato.
In this study, we identify PIF genes in I. batatas, I. triloba, and I. trifida. We analyzed the protein properties, chromosomal location, phylogenetic relationship, and structure of the PIF genes as well as the cis-elements of their promoters and interaction network of the PIF proteins in sweet potato. To further clarify the function of these genes in sweet potato and its two diploid relatives, we tested the expression pattern of PIFs in different tissues and under various stress conditions. On this basis, the role of IbPIF3.1 under drought and Fob treatment was preliminarily verified in tobacco.

2. Results

2.1. Identification and Characteristic of PIFs in Sweet Potato and Its Two Diploid Relatives

To the identified PIFs members, we utilized the protein sequences of PIFs in Arabidopsis as queries to perform a BLASTP search against the sweet potato and its two diploid relative protein sequence databases. As a result, a total of 18 protein sequences have been identified in three Impoea genomes including 6 of I. batatas, 6 of I. triloba, and 6 of I. trifida. Then, all PIFs members were named according to their homologous genes in Arabidopsis. The PIF genes from I. batatas were named after “Ib”; I. triloba, named after “Itb”; and I. trifida, named after “Itf” (Supplementary Table S1). The basic physicochemical information of IbPIFs were analyzed as listed in Table 1. IbPIF1.2 and IbPIF4 had the smallest and largest genomic lengths, respectively, which varied from 3275 bp (IbPIF1.2) to 8025 bp (IbPIF4). The CDS length of IbPIFs ranged from 1365 bp (IbPIF1.2) to 2661 bp (IbPIF4). The length of the putative proteins ranged from 454 aa to 886 aa while the molecular weight (MW) ranged from 48.728 kDa to 97.031 kDa. The theoretical isoelectric points (pI) of various proteins ranged between 5.29 and 7.17. All of the IbPIF proteins were unstable, with an instability index of more than 43. Their GRAVY scores were less than 0, indicating that they are hydrophilic proteins. Subcellular localization predicted that all of the IbPIFs were located in the nucleus.

2.2. Chromosomal Location of Sweet Potato and Its Two Diploid Relatives

Chromosomal location showed that all of the PIFs from I. batatas, I. triloba, and I. trifida were dispersed on five chromosomes (Figure 1). In I. batatas, one IbPIF was on each of Chr9, Chr11, Chr12, and Chr13; and two were on Chr2 (Figure 1A). In I. triloba and I. trifida, the distribution of PIFs was similar: one PIF was detected on each of Chr1, Chr2, Chr7, and Chr10; and two were on Chr4 (Figure 1B,C). The results indicated that the distribution of PIFs was similar on chromosomes in sweet potato and its two diploid relatives.

2.3. Phylogenetic Analysis of PIFs in Sweet Potato and Its Two Diploid Relative

To study the evolutionary relationships of PIF proteins, an unrooted Maximum Likelihood (ML) phylogenetic tree was created based on multiple alignments of the 70 predicted PIF amino acid sequences (i.e., 8 in Arabidopsis thaliana, 7 in Camellia sinensis, 5 in Daucus carota, 6 in Ipomoea batatas, 6 in Ipomoea triloba, 6 in Ipomoea trifida, 7 in Malus domestica, 6 in Oryza sativa, 8 in Solanum lycopersicum, 7 in Solanum tuberosum, and 4 in Vitis vinifera, Supplementary Table S2). Based on the phylogenetic analysis, they were divided into four groups, PIF1 belonged to group I; PIF4 and PIF5 were in group II; PIF2, PIF3, and PIF6 were in group III; and PIF7 and PIF8 were in group IV (Figure 2). Within each group, all IbPIFs were clustered with their corresponding orthologs in I. triloba or I. trifida. For instance, in group I, IbPIF1.1 was clustered with I. triloba ortholog (ItbPIF1.1) and I. trifida ortholog (ItfPIF1.1), while IbPIF1.2 was clustered with I. triloba ortholog (ItbPIF1.2) and I. trifida ortholog (ItfPIF1.2). Moreover, the PIFs from sweet potato had the closest relationship with tomato and potato PIFs.
Furthermore, we predicted 10 motifs in the 70 PIF proteins using the MEME website (Supplementary Figures S1 and S2), where motif 1 and motif 3 contained core sequences of the bHLH and APB domains, respectively. All PIFs had motifs 1 to 4, which seemed to be conserved motifs in PIFs. Most PIFs in the same group had similar conserved motifs and motif distribution, especially in cultivated hexaploid sweet potato and its diploid wild relatives.

2.4. Conserved Domain and Exon–Intron Structure Analysis of PIFs in Sweet Potato and Its Two Diploid Relatives

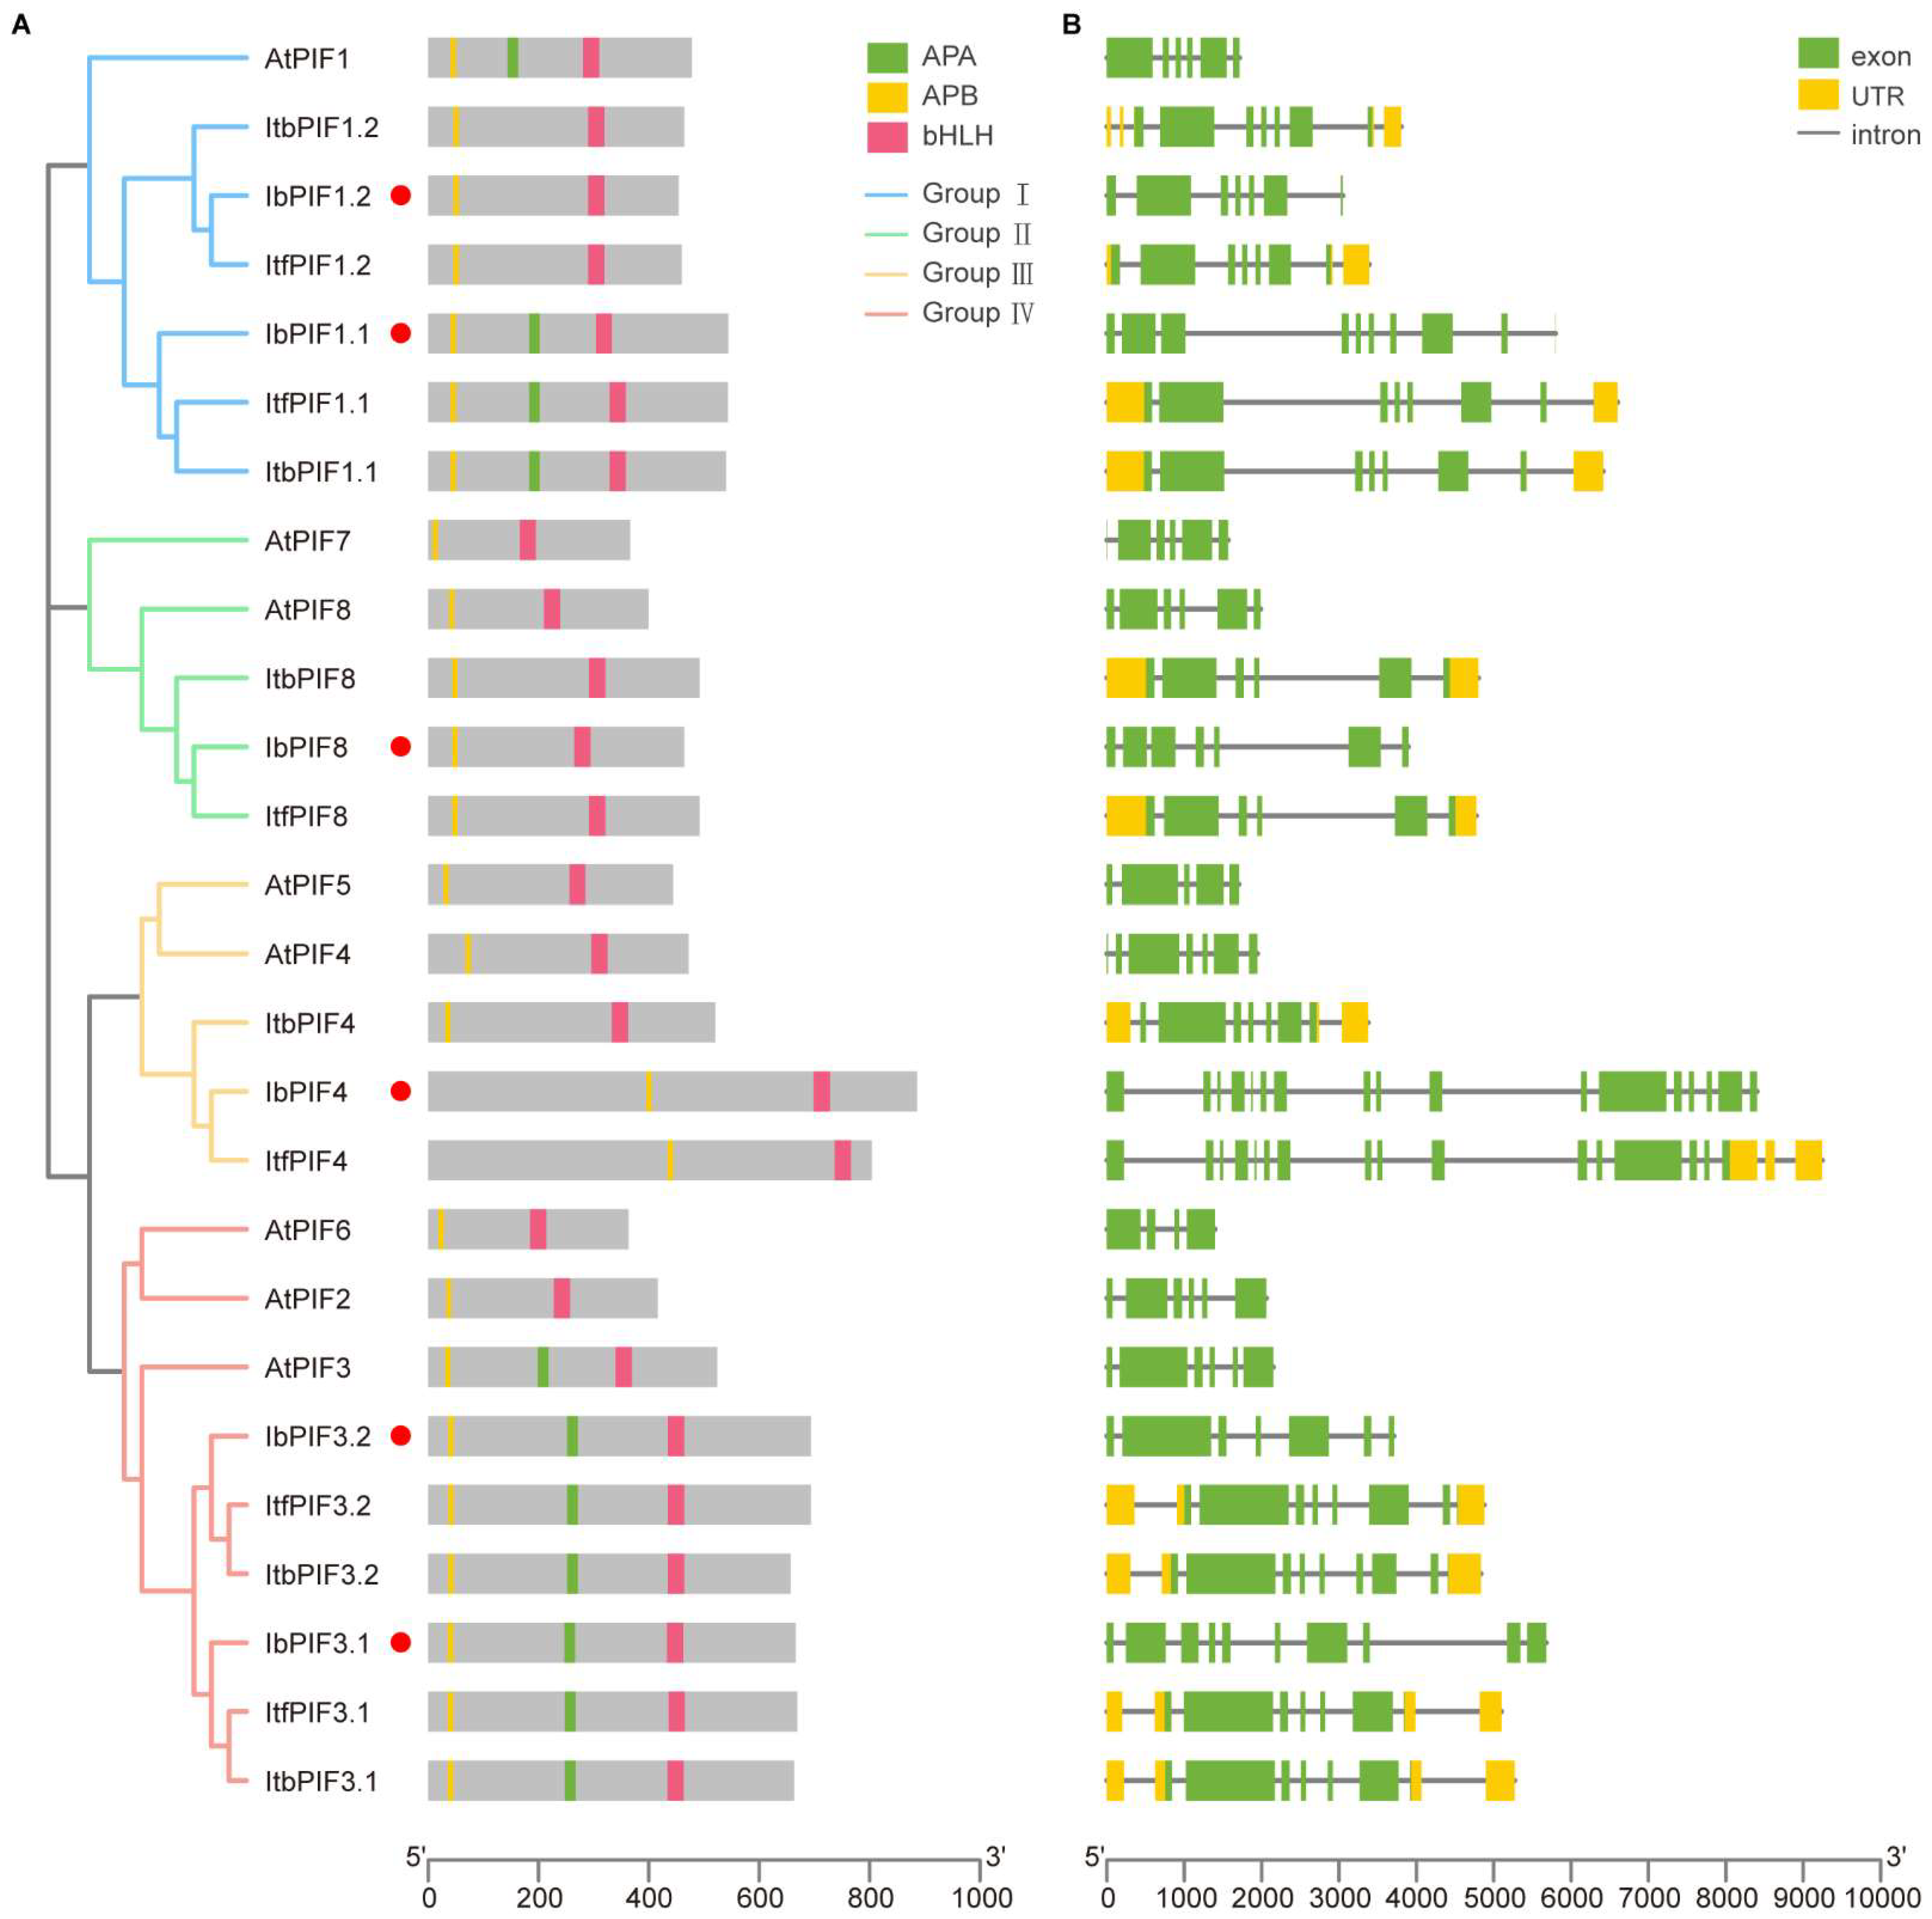
Protein domains and gene structure are important in analyzing and predicting gene functions. The presence of bHLH and APB domains is one of major characteristics of PIF members. Analysis of the 26 PIFs from A. thaliana, I. batatas, I. triloba, and I. trifida showed that all PIFs members contained both the bHLH and APB domains (Figure 3A); while IbPIF1.1, PIF3.1, and PIF3.2 contained the APA domain (Figure 3A).
The exon–intron structure of the 26 PIF genes were examined, in order to better understand the structural diversity of the PIFs (Figure 3B). Most PIF genes possessed six to seven exons. IbPIF4 contained the largest number of exons, at 17. Closely related members of each group usually had similar exon distribution models, with little difference in exon number and length. For example, the PIFs of group I had exons ranging from 6 to 9, group II ranged from 6 to 7, and group IV ranged from 6 to 10. In group III, we found a significant difference in the number of PIF homologous gene exons among I. batatas, I. triloba, and I. trifida; for example, ItbPIF4 possessed 7 exons, while ItfPIF4 possessed 16 exons and IbPIF4 possessed 17 exons.

2.5. cis-Element Analysis in the Promoter of PIFs in Sweet Potato and Its Two Diploid Relatives

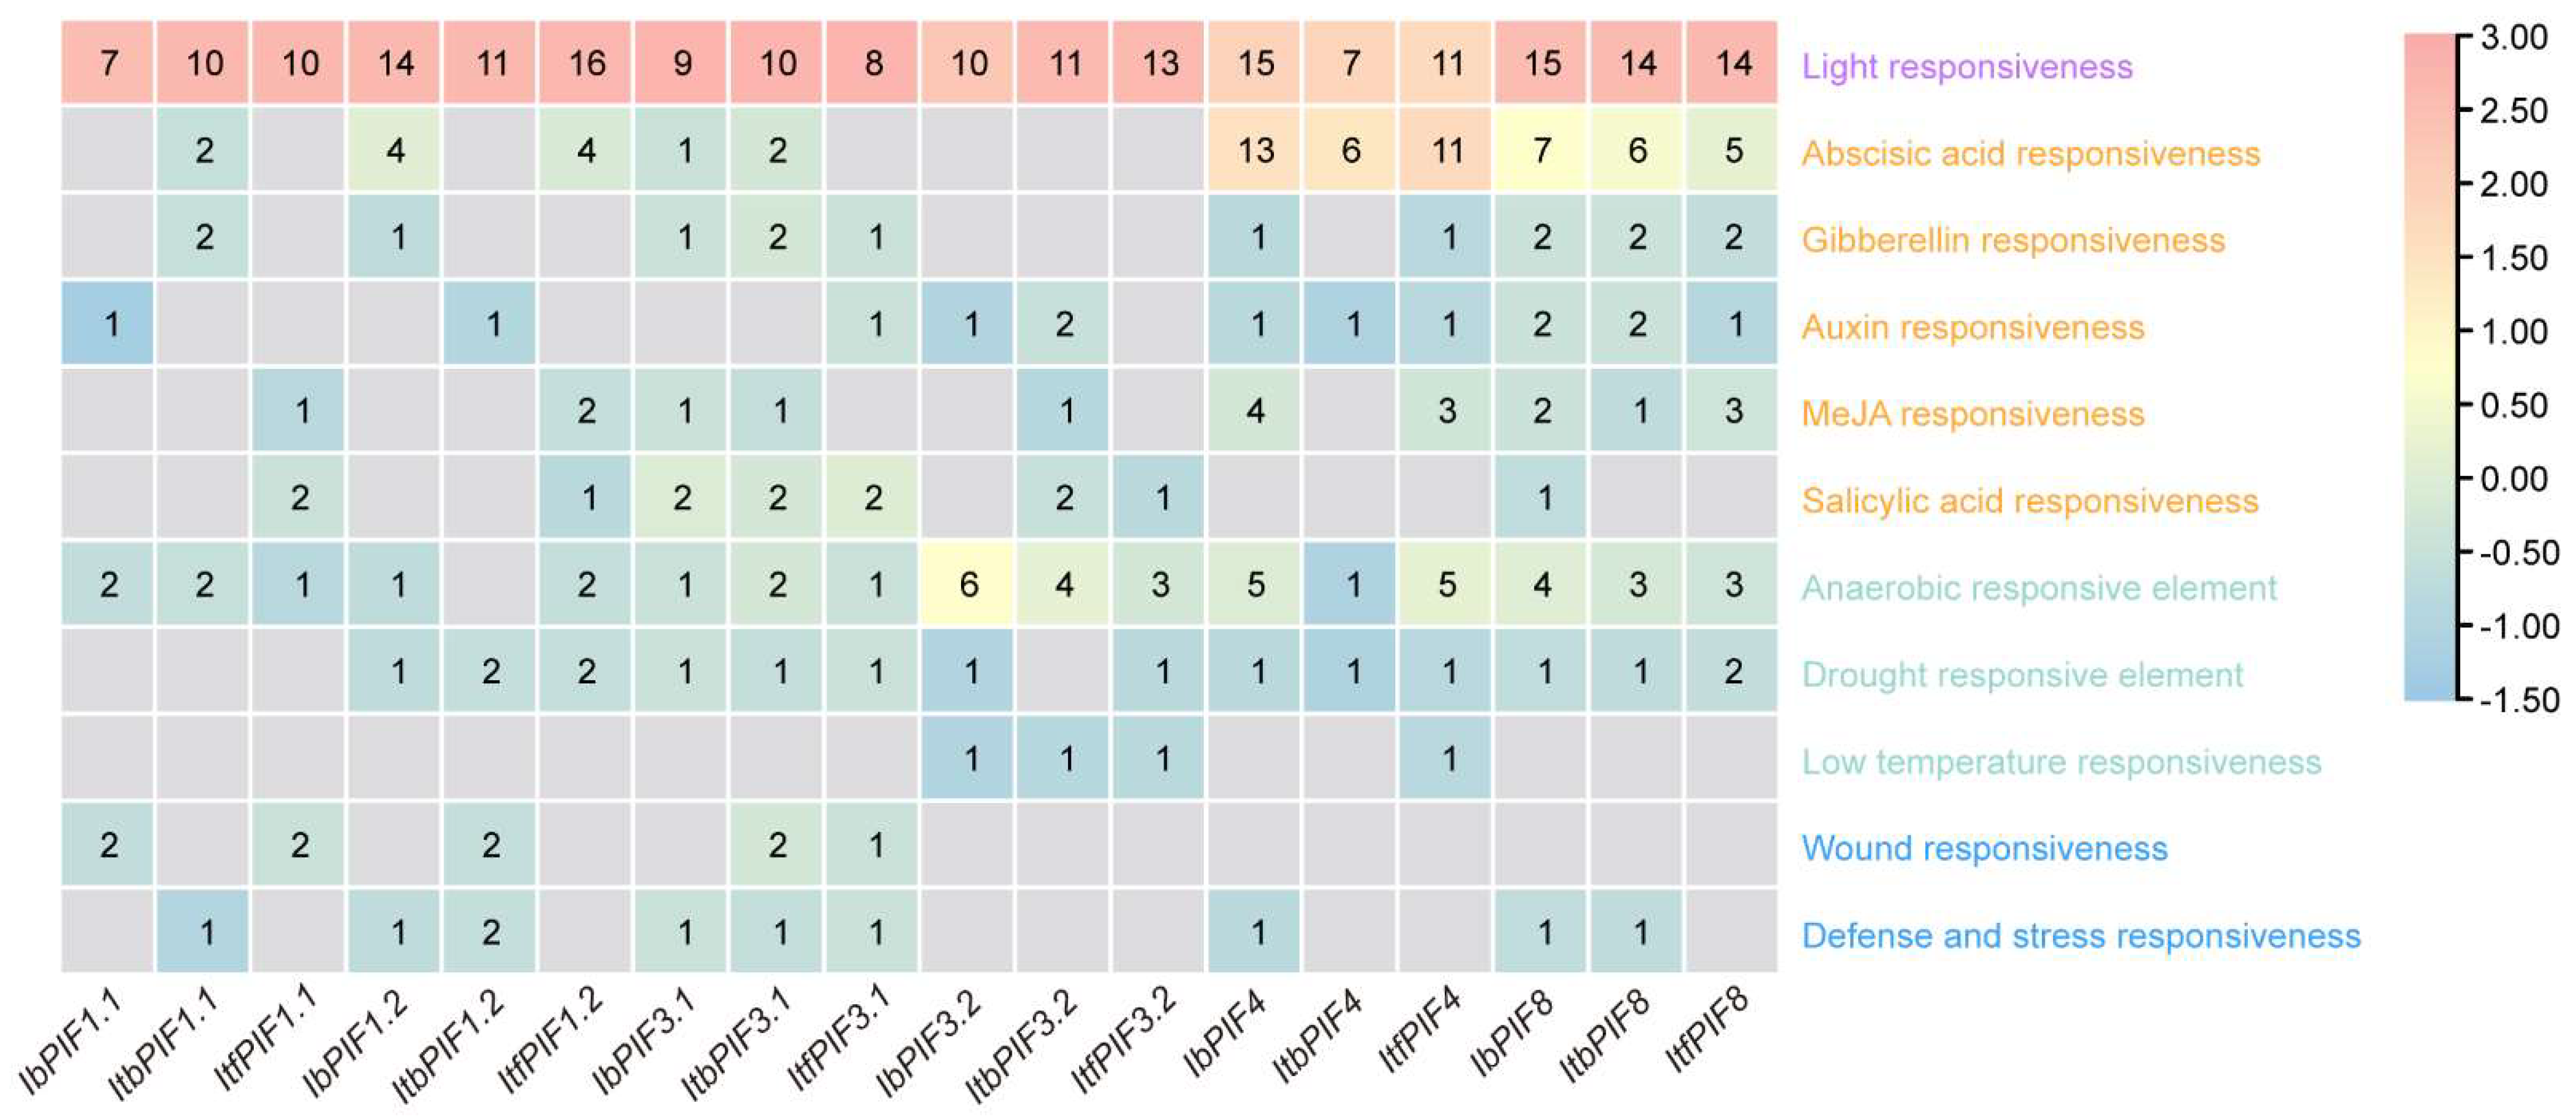
PIFs are involved in plant growth, development, and stress response, and cis-elements in the promoter region play a key role in expression of PIF genes in these processes. In order to further understand the transcriptional regulatory mechanisms of PIFs, 2000 bp upstream sequences of PIFs from I. batatas, I. triloba, and I. trifida were used to carry out cis-element analysis. The results showed that promoters of PIFs contained a variety of light-responsive elements including G-box (TACGAT), Box 4 (ATTAAT), ACE (CTAACGTATT), and LAMP (CTTTATCA) [54]; hormonal response elements including abscisic acid (ABA)-responsive element ABRE (ACGTG), gibberellin (GA)-responsive element GARE (TCTGTTG), auxin (AUX)-responsive element TGA (AACGAC), jasmonic acid (JA)-responsive element CGTCA, and salicylic acid (SA) TCA-responsive element (CCATCTTTTT) [55,56]. In addition, various elements responding to abiotic and biotic stresses were also found, such as anaerobic-responsive, drought-responsive, low-temperature-responsive, wound-responsive, and defense- and stress-responsive elements. The IbPIF3.1, IbPIF4, and IbPIF8 promoter regions contained a variety of stress-responsive elements, including drought-, and defense- and stress-responsive elements, whereas the cis-elements in the IbPIF1.1, IbPIF1.2, and IbPIF3.2 promoters were less diverse (Figure 4). Overall, the results indicated that the PIFs in sweet potato might participate in an intricate regulatory network to adapt to complicated and changeable environments.

2.6. Protein Interaction Network of IbPIFs in Sweet Potato

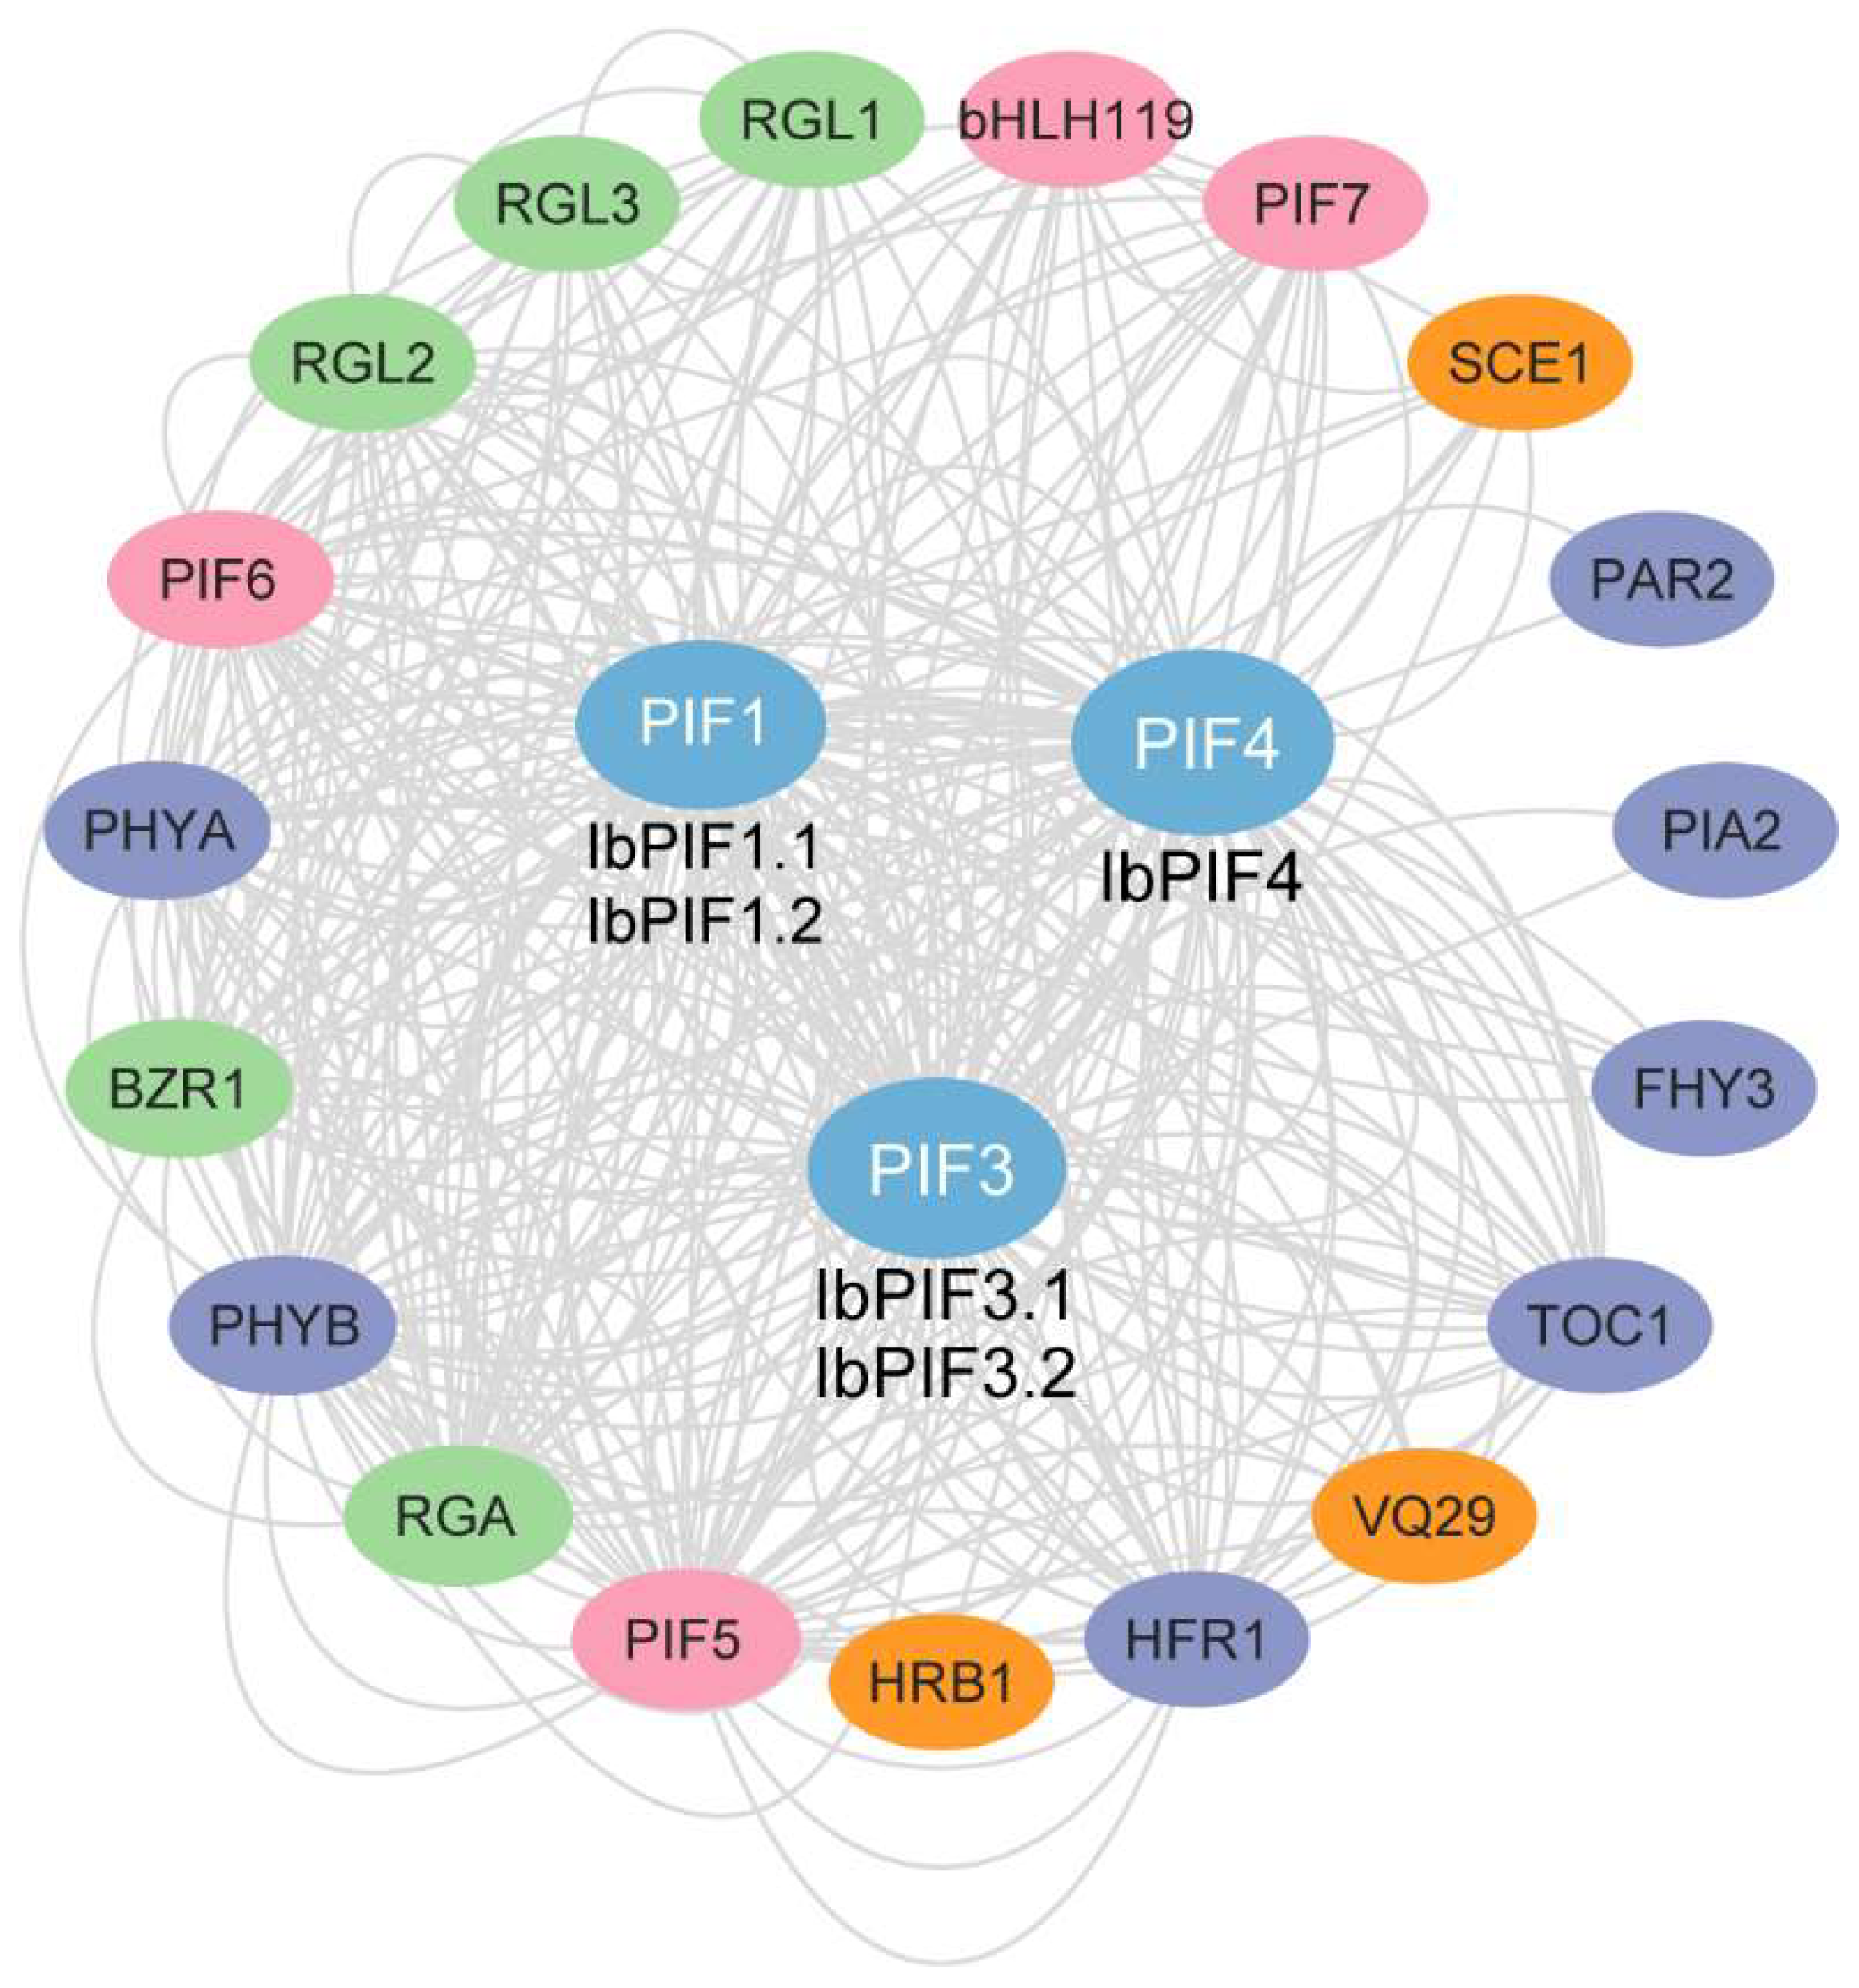
To investigate the potential regulatory network of IbPIFs, we constructed an IbPIF protein interaction network based on Arabidopsis orthologous proteins (Figure 5). Protein interaction prediction indicated that IbPIFs could interact with each other (i.e., PIF1, PIF3, PIF4, PIF5, and PIF7), and also interacted with bHLH family proteins (bHLH119). IbPIFs could interact with a variety of transcription factors to regulate light signaling pathways (i.e., PHYB, PHYA, PAR2, PIA2, FHY3, TOC1, and HFR1). In addition, IbPIFs could interact with other proteins to regulate hormone signaling, such as gibberellin signal transduction components (i.e., RGA, RGL1, RGL2, and RGL3) and brassinosteroid (BR) signaling pathway- related protein BZR1. IbPIF1 and IbPIF3 could interact with a VQ motif-containing protein (VQ29) which regulates various developmental processes and responses to biotic and abiotic stresses. IbPIF4 might interact with HRB1 in response to drought stress. IbPIF1 and IbPIF4 might interact with S-nitrosylation of the small ubiquitin-like modifier (SUMO)-conjugating enzyme 1 (SCE1) to regulate plant immunity. Overall, these results suggested that IbPIFs could participate in multiple regulatory networks interacting with related transcription factors and functional proteins.

2.7. Expression Analysis of PIFs in Sweet Potato and Its Two Diploid Relatives

2.7.1. Expression Analysis in Various Tissues

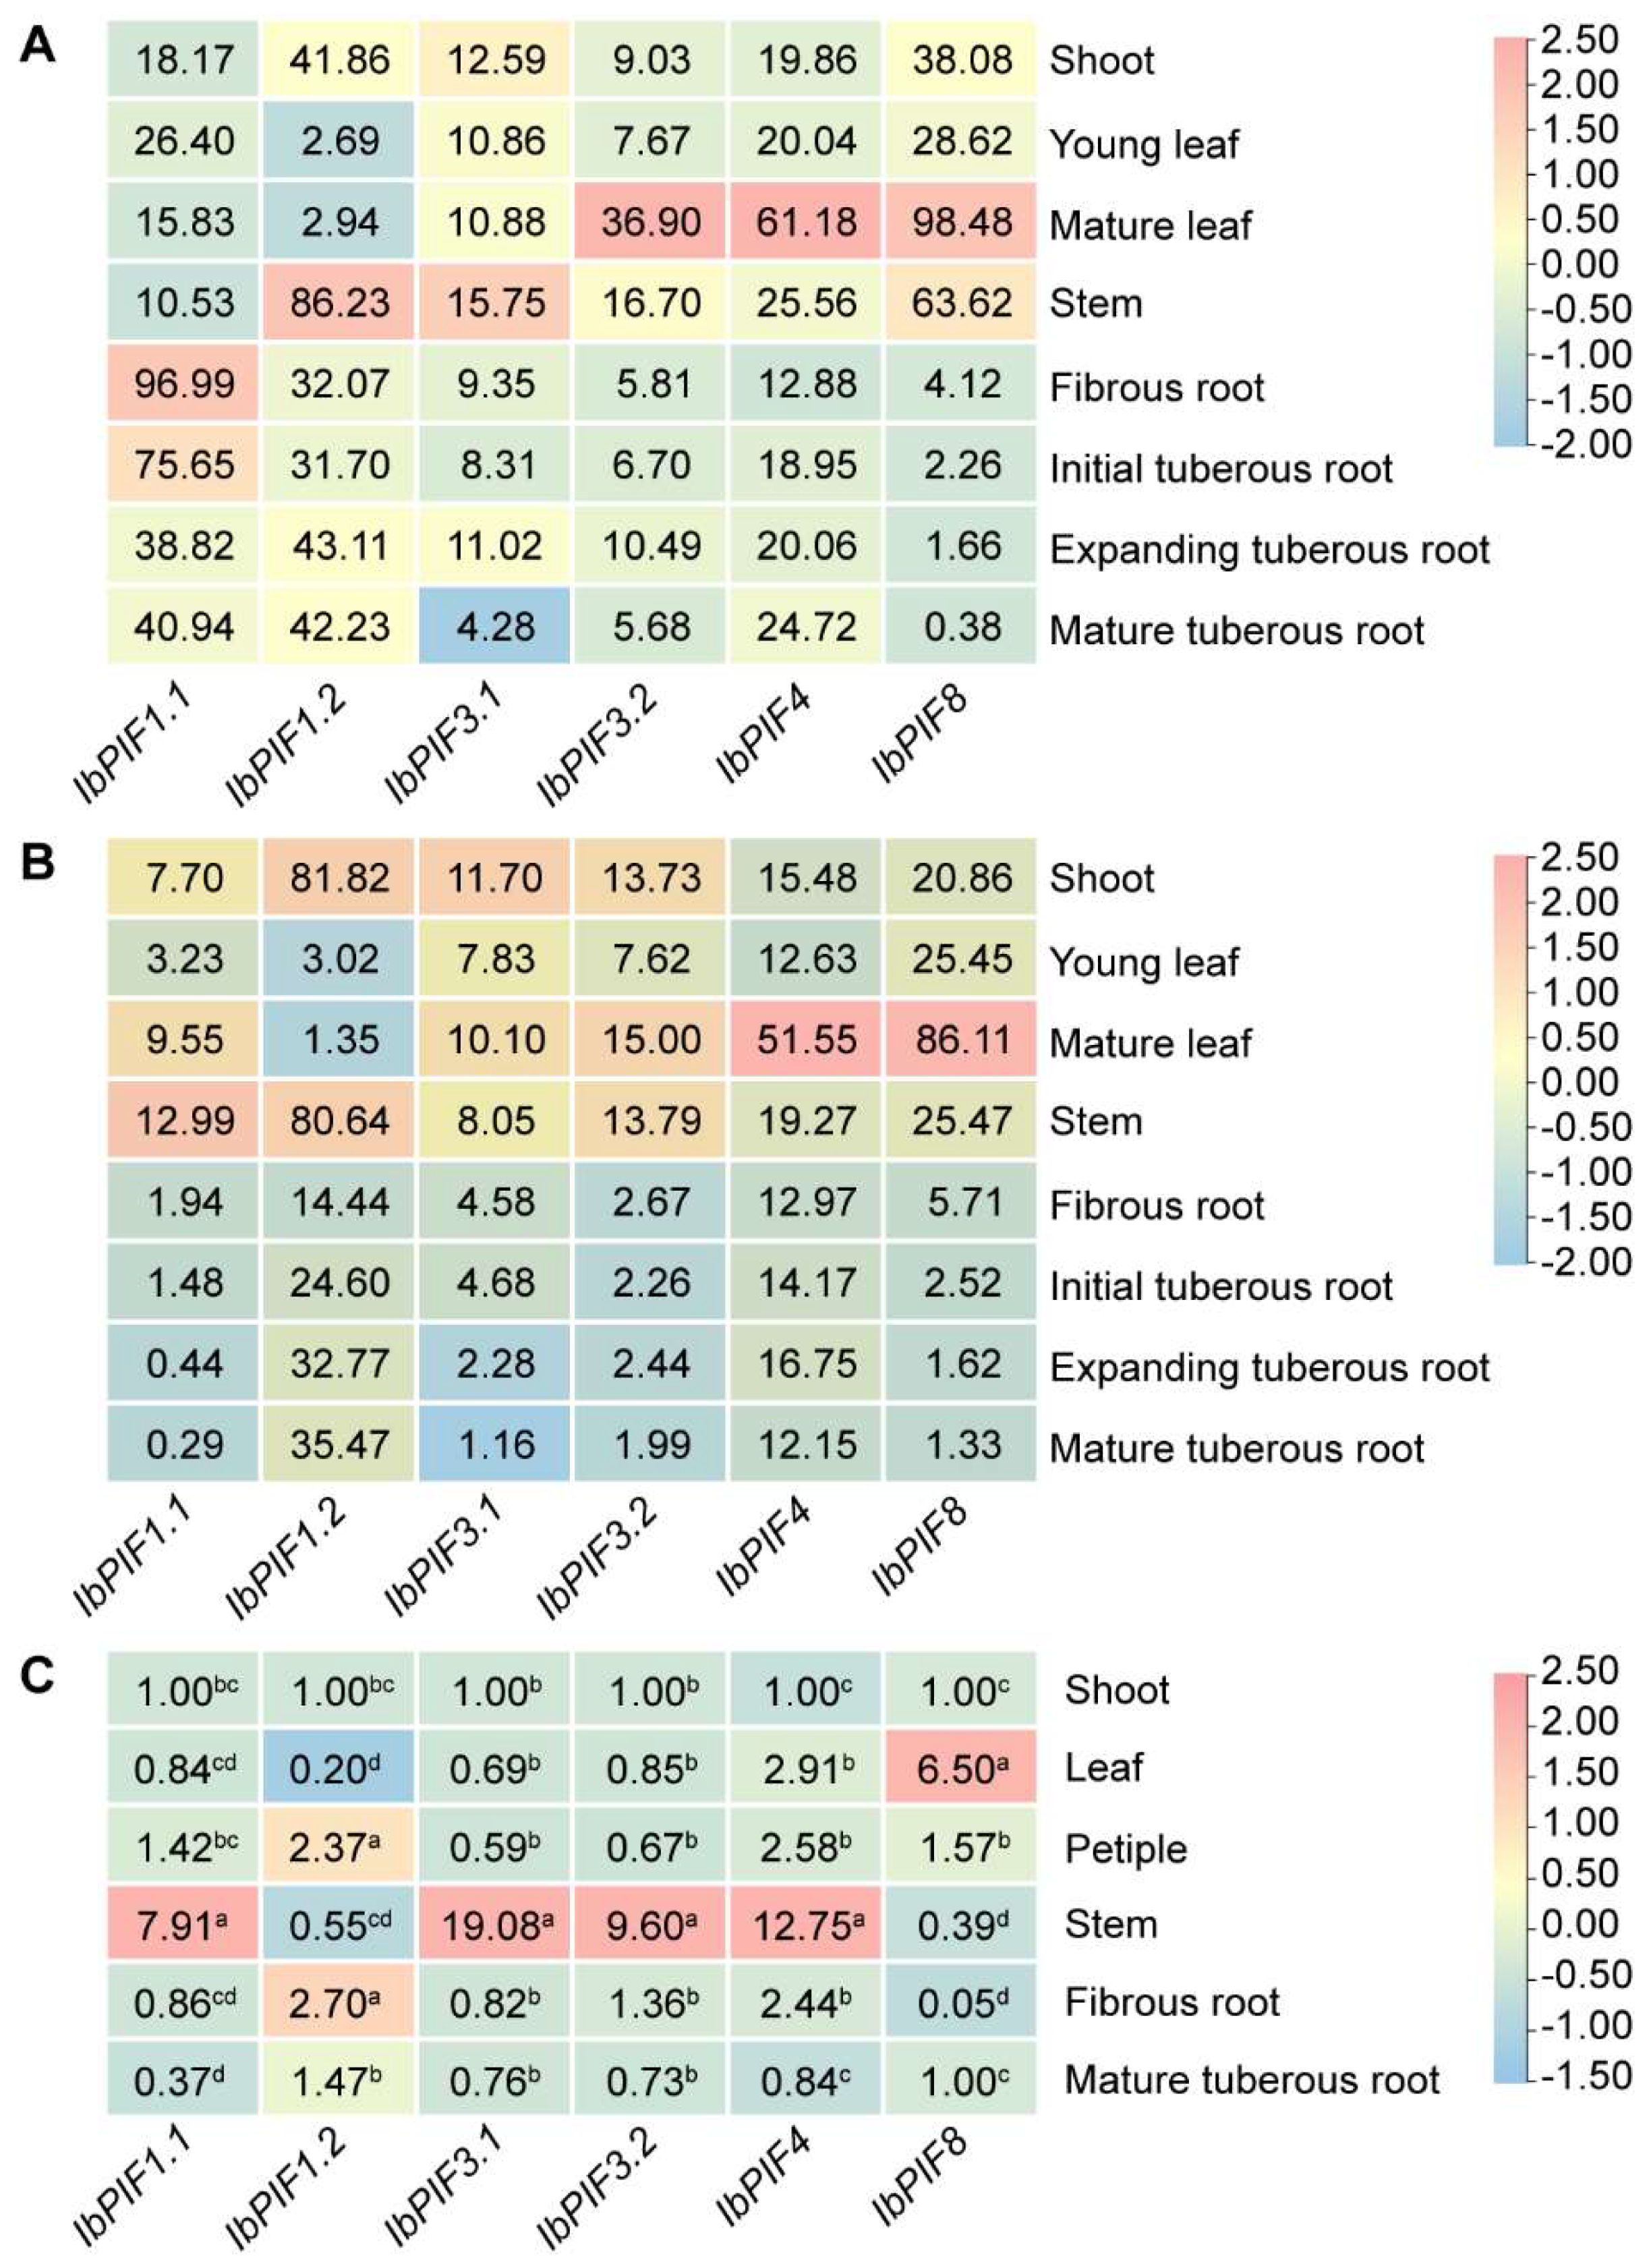
To investigate the potential biological functions of IbPIFs, RNA-seq of different tissues including shoot, young leaf, mature leaf, stem, fibrous root, initial tuberous root, expanding tuberous root, and mature tuberous root of Yan252 and Xuzi3 were downloaded. These PIF genes were expressed in different tissues, and showed tissue-specific expression. In Yan252 and Xuzi3, compared with the young leaf, IbPIF3.2, IbPIF4, and IbPIF8 demonstrated higher expression in mature leaf. IbPIF1.1, IbPIF3.1, and IbPIF8 presented a gradually down-regulated trend during root development (Figure 6A,B). In Yan252, IbPIF1.2 was highly expressed in stem, and IbPIF1.1 was predominantly expressed in the root (Figure 6A). However, IbPIF1.1 was primarily expressed in the stem of Xuzi3 (Figure 6B).
To explore the functions of ItbPIFs and ItfPIFs, their expression profiles were analyzed in six tissues (i.e., flower, flower bud, leaf, stem, root 1, and root 2) in I. triloba and I. trifida based on RNA-seq data (Supplementary Figure S3). In I. triloba, ItbPIF1.2 and ItbPIF3.2 presented a low expression level in all tissues, IbPIF3.1 had a higher expression level in flower bud, and ItbPIF4 was highly expressed in leaf (Supplementary Figure S3A). In I. trifida, ItfPIF8 showed higher expression levels in all tissues, compared to other ItfPIFs, which was inconsistent with that in I. triloba. ItfPIF1.1, ItfPIF3.1, and ItfPIF4 were highly expressed in leaf, whereas they showed low expression level in root. ItfPIF1.2 was highly expressed in stem (Supplementary Figure S3B). These results suggested that PIF genes play different roles in the sweet potato and its two diploid relatives.
To verify the RNA-seq results, qRT-PCR was conducted to measure the expression levels of IbPIF genes in six tissues (i.e., shoot, leaf, petiole, stem, fibrous root, and mature tuberous root). The qRT-PCR results showed that IbPIF1.2, IbPIF3.1, and IbPIF3.2 had lower expression in leaf, while IbPIF8 had higher expression in leaf, IbPIF1.1 and IbPIF3.1 had a gradually down-regulated trend during root development, and IbPIF4 was highly expressed in stem (Figure 6C). These results were roughly consistent with the RNA-seq analysis.

2.7.2. Expression Analysis under Hormone Treatment

The synthesis and metabolism of plant hormones are involved in all aspects of plant development. Therefore, it is essential to explore the expression pattern of PIFs under hormonal treatments. The expression of ItbPIFs and ItfPIFs were analyzed based on public RNA-seq data of I. triloba and I. trifida under ABA, GA3, and IAA treatments. In I. triloba, compared with hormone stress control, ItbPIFs were induced by at least one hormone (except ItbPIF8) (Supplementary Figure S4). Under ABA treatment, ItbPIF3.1 and ItbPIF3.2 were induced, while ItbPIF1.1 and ItbPIF4 were repressed. Under GA3 treatment, ItbPIF1.2 was up-regulated, and ItbPIF1.1, ItbPIF3.1, and ItbPIF3.2 were down-regulated. Under IAA treatment, ItbPIF3.1 and ItbPIF4 were up-regulated (Supplementary Figure S4A). In I. trifida, ItfPIF1.1, ItfPIF1.2, ItfPIF3.1, ItfPIF3.2, and ItfPIF4 showed different expression patterns under hormone treatment, compared with those in I. triloba. ItfPIF1.1 was up-regulated by ABA, while being repressed by GA3 and IAA. ItbPIF1.2 was induced by ABA. ItfPIF3.1 was up-regulated by GA3 and repressed by IAA. ItfPIF3.2 was repressed by ABA, GA3, and IAA. ItfPIF4 was repressed by ABA. ItfPIF8 was repressed by ABA, GA3, and IAA (Supplementary Figure S4B). Overall, the expression patterns of PIFs in the two diploid relatives in response to ABA, GA3, and IAA are different, suggesting that PIFs are involved in different hormonal pathways between I. triloba and I. trifida.
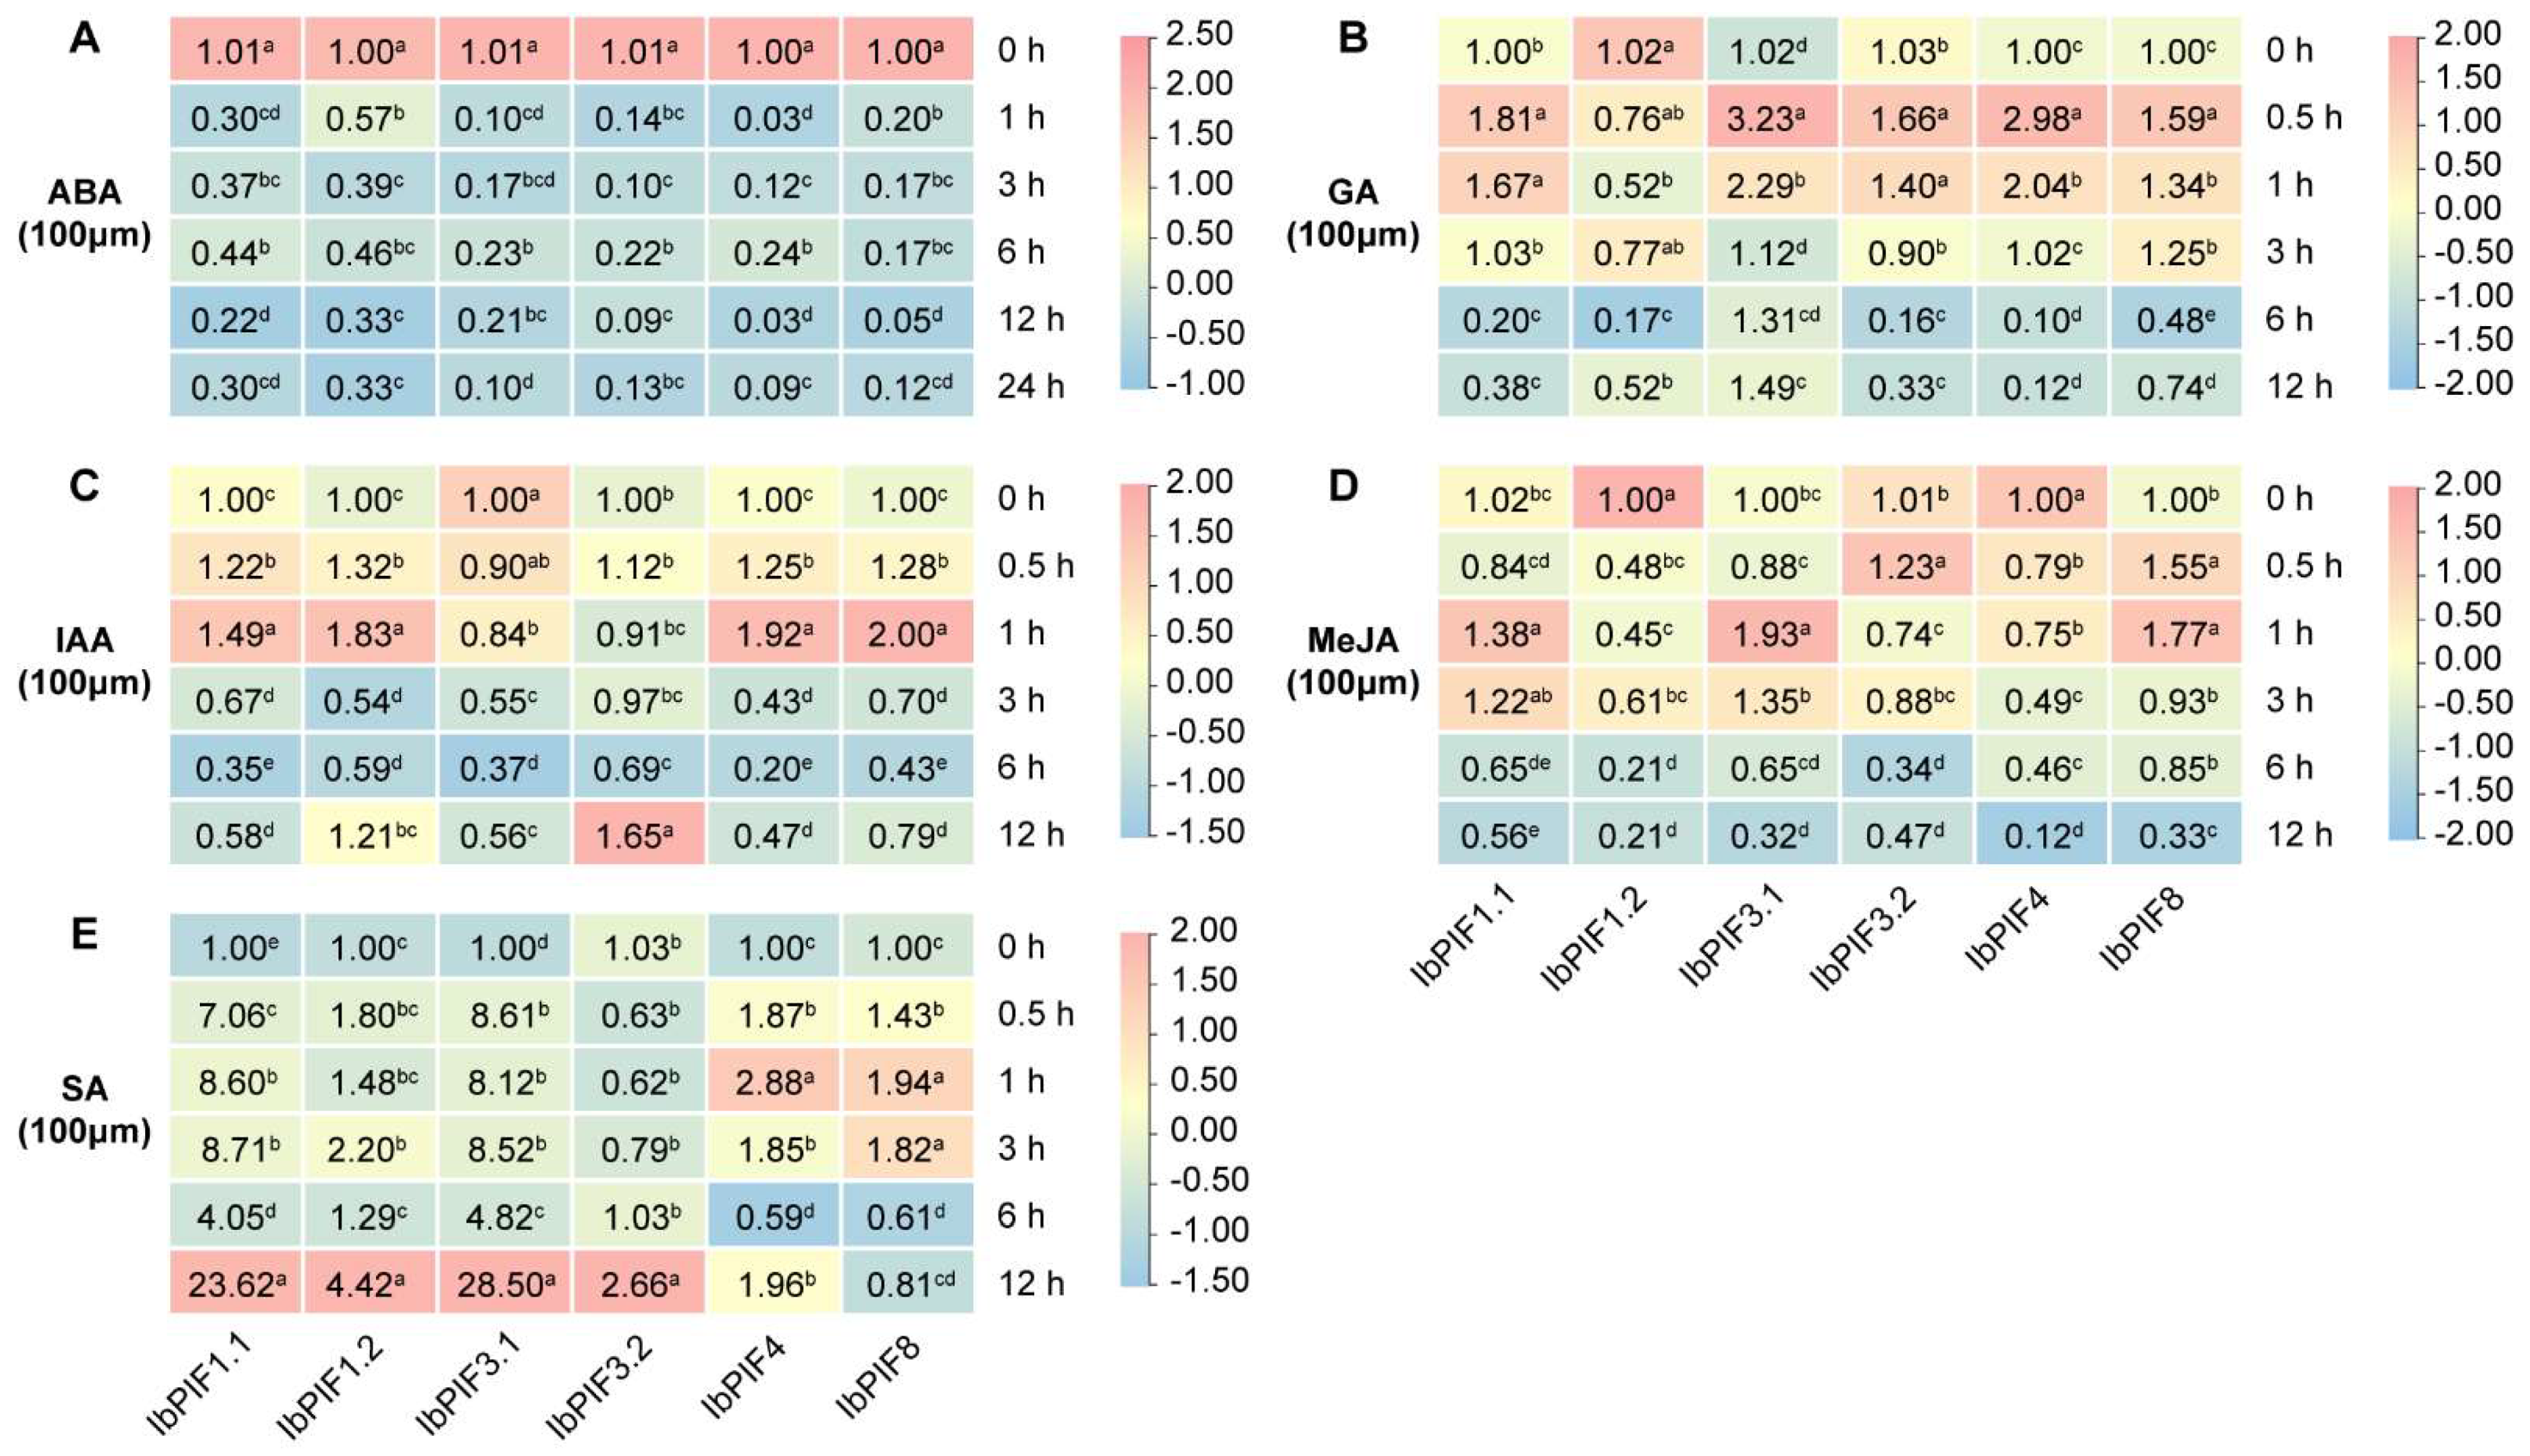
We next investigated the relative expression of IbPIFs after 0 h, 0.5 h, 1 h, 3 h, 6 h, and 12 h of the hormone treatments by qRT-PCR, involving ABA, GA, IAA, MeJA, and SA (Figure 7). Under ABA treatment, all IbPIFs were down-regulated (Figure 7A). Under GA treatment, the majority of IbPIFs were significantly induced without IbPIF1.2, and the maximum values appeared at 0.5 h (Figure 7B). Under IAA treatment, IbPIF1.1, IbPIF1.1, IbPIF1.2, IbPIF4, and IbPIF8 were significantly up-regulated, while IbPIF3.1 was repressed (Figure 7C). Under MeJA treatment, IbPIF1.1, IbPIF3.1, IbPIF3.2, and IbPIF8 were significantly up-regulated, while IbPIF1.2 and IbPIF4 were repressed (Figure 7D). When treated with SA, the expression levels of IbPIFs were significantly up-regulated. Among them, the expression levels of IbPIF1.1, IbPIF1.2, IbPIF3.1, and IbPIF3.2 reached the peak at 12 h, while the expression levels of IbPIF4 and IbPIF8 reached the peak at 1 h. It is worth noting that the relative expression levels of IbPIF1.1 and IbPIF3.1 increased by 23.62-fold and 28.5-fold under SA treatment, respectively (Figure 7E). Together, six IbPIF genes were found to respond to two or more hormones, indicating that IbPIFs may participate in the cross-talk between various hormones.

2.7.3. Expression Analysis under Abiotic Stresses

To explore the potential function of PIFs in responding to abiotic stress, we analyzed the expression patterns of PIFs using the RNA-seq data of I. triloba and I. trifida under salt, drought, cold, and heat stress treatments (Supplementary Figure S5). Under cold and heat treatments, all of the ItbPIF genes were down-regulated compared with the control in I. triloba (Supplementary Figure S5A). In I. triloba, ItbPIF3.1 was significantly up-regulated under salt and drought treatments. Under salt, drought, and cold treatments, the expression pattern of ItfPIF1.1, ItfFIF1.2, ItfPIF3.1, and ItfPIF4 in I. trifida was the same as that of homologous genes in I. triloba, while the expression pattern of ItfFIF3.2 and ItbPIF3.2 was opposite (Supplementary Figure S5B). These results indicated that the PIFs in I. triloba and I. trifida present both commonalities and differences in response to abiotic stresses.
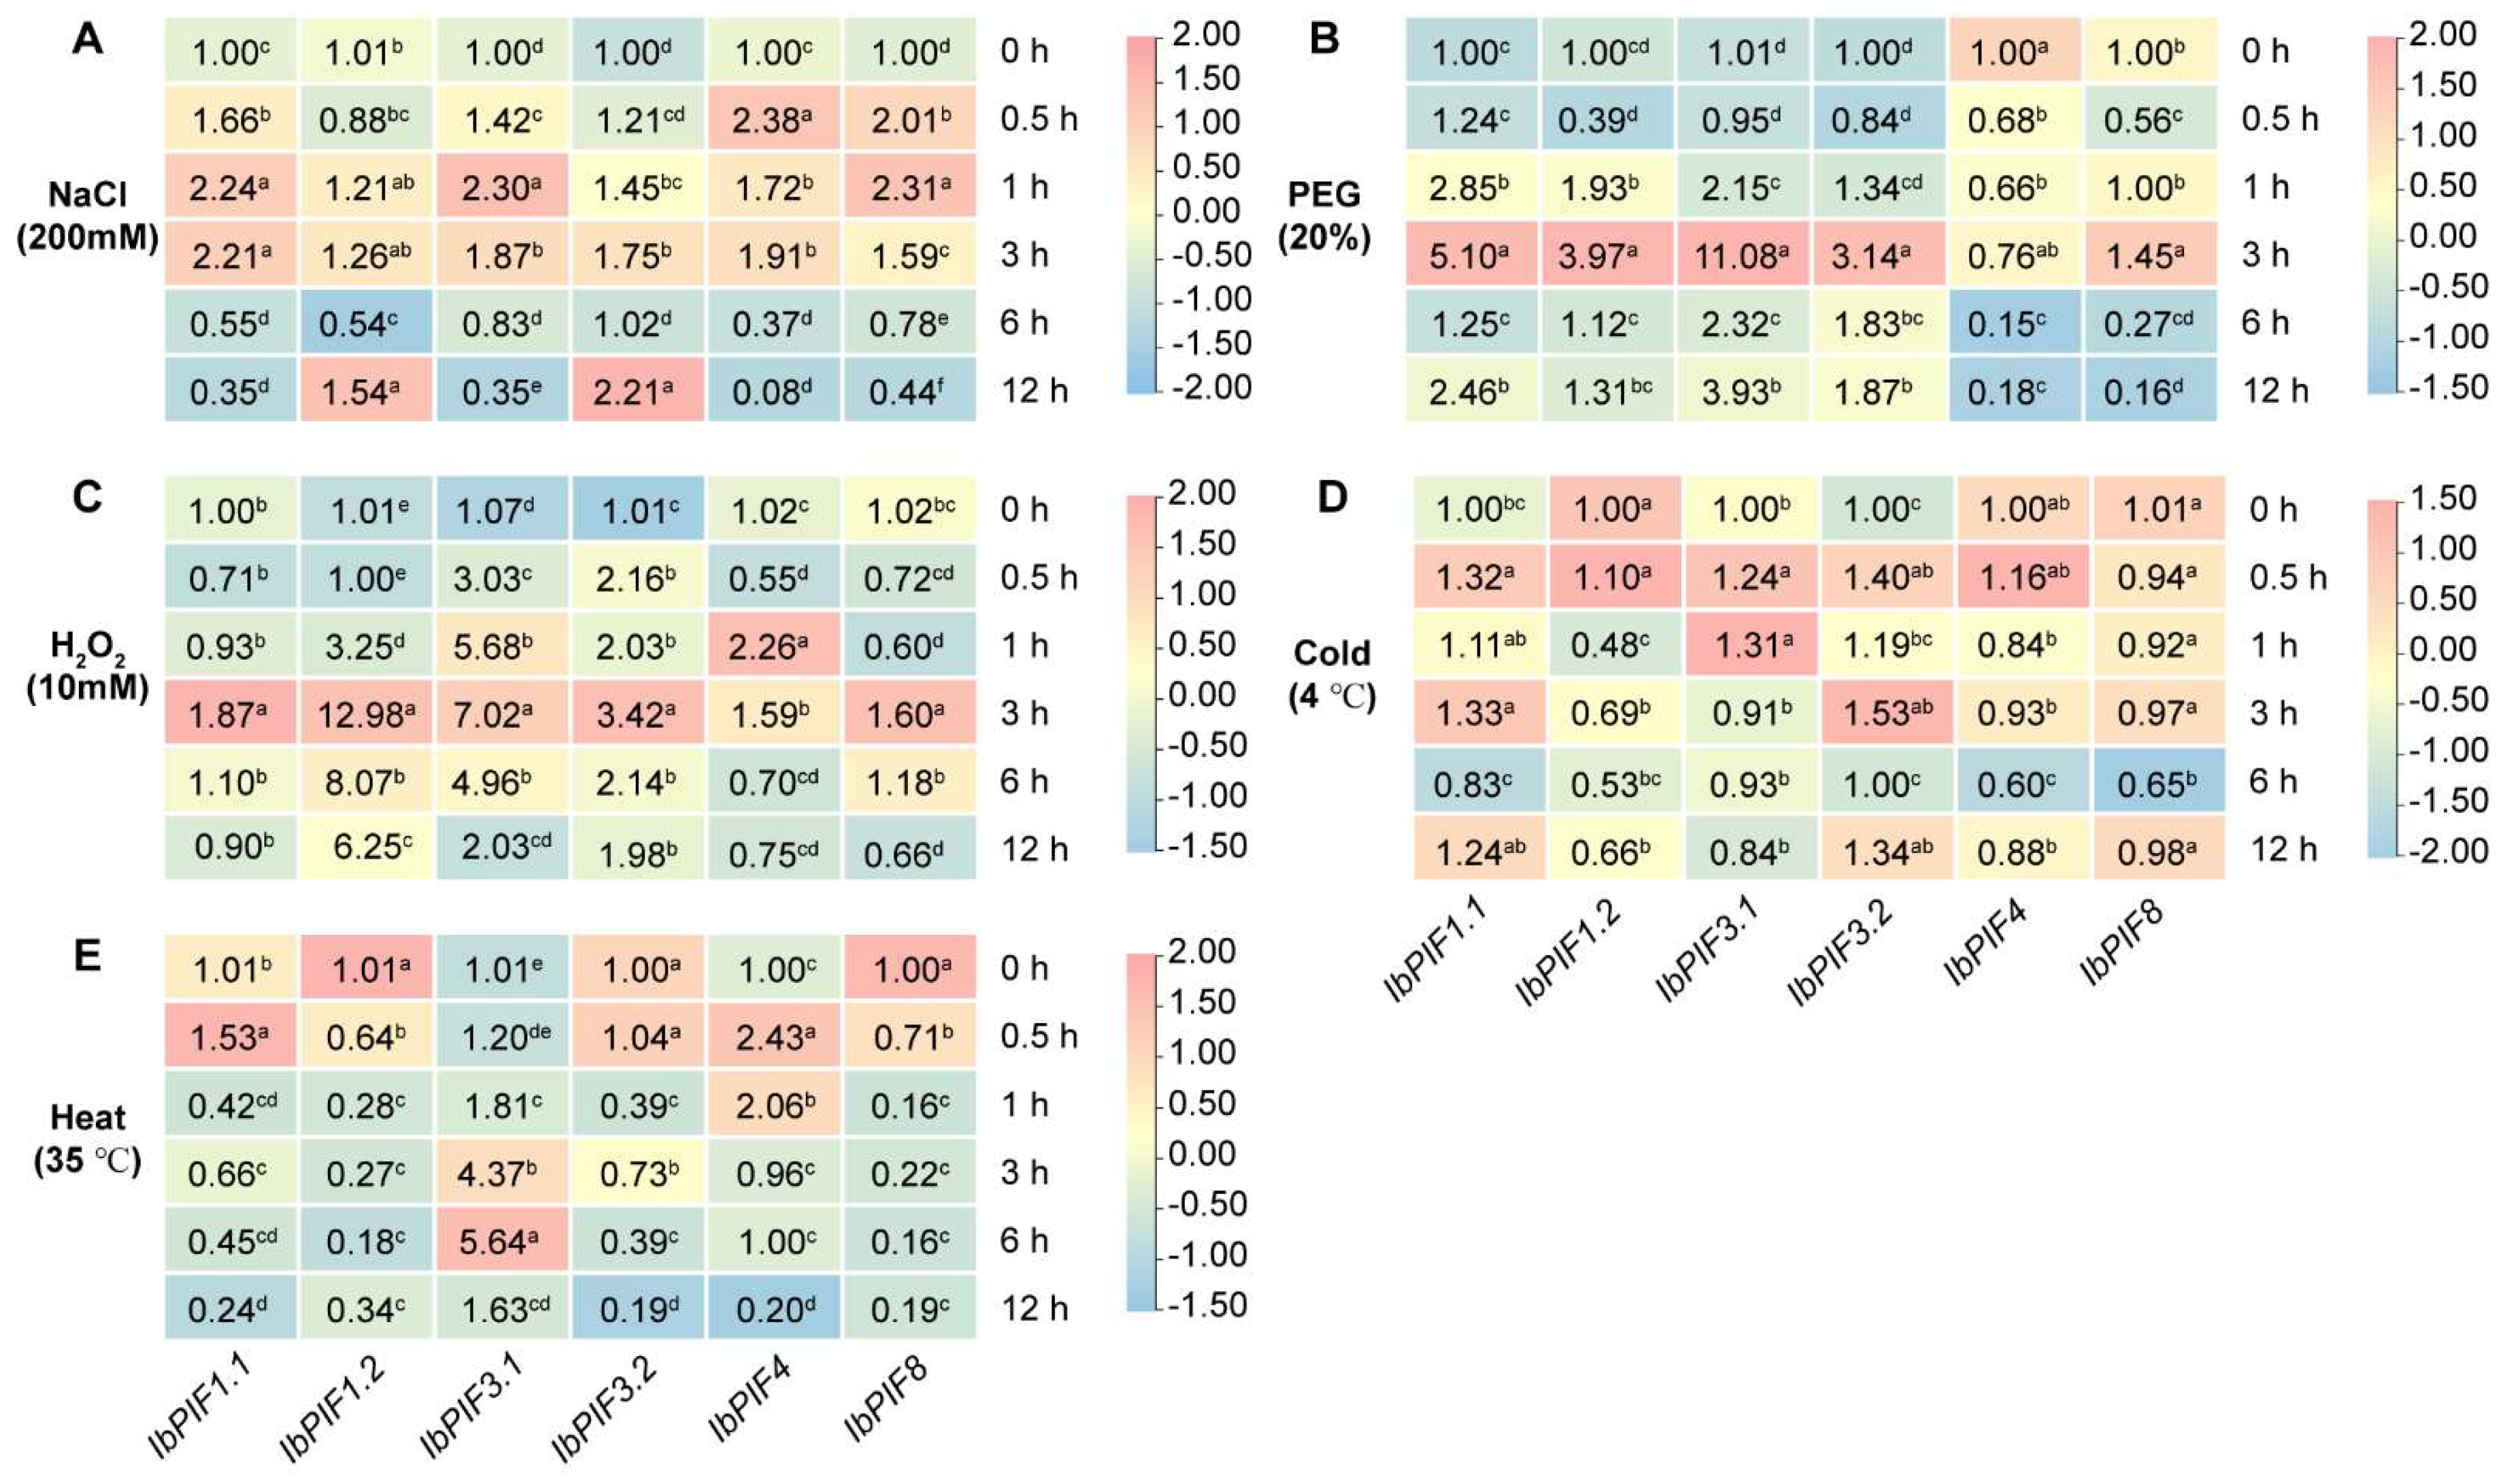
To further illustrate the effects of various abiotic stresses (i.e., NaCl, PEG, H2O2, cold, and heat) on the expression of PIF genes, we examined IbPIFs expression levels by qRT-PCR (Figure 8). Under salt stress treatment, all of the IbPIFs were up-regulated, with IbPIF1.1, IbPIF3.1, and IbPIF8 peaking at 1 h, with IbPIF1.2 and IbPIF3.2 peaking at 12 h, with IbPIF4 peaking at 0.5 h (Figure 8A). Under PEG stress treatment, IbPIF1.1, IbPIF1.2, IbPIF3.1, and IbPIF3.2 were up-regulated and peaked at 3 h; in particular, IbPIF3.1 was induced by more than 11.08-fold, while IbPIF4 was repressed (Figure 8B). Under H2O2 stress treatment, all IbPIFs were significantly up-regulated, with IbPIF1.2 especially induced by 12.98-fold (Figure 8C). Under cold stress treatment, more than half of the IbPIFs were induced, with IbPIF3.2 up-regulated by 1.53-fold, while IbPIF1.2 and IbPIF8 were repressed (Figure 8D). Under heat stress treatment, IbPIF3.1 was significantly up-regulated (by 5.64-fold) at 6 h, while IbPIF1.1 and IbPIF4 were up-regulated at 0.5 h (Figure 8E). In general, IbPIF3.1 was induced by all five abiotic stress treatments in sweet potato, while IbPIF8 was down-regulated under a majority of the abiotic stress treatments (PEG, H2O2, cold, and heat). These results indicated that IbPIFs might play a key role in abiotic stress resistance.

2.7.4. Expression Analysis under Biotic Stresses

To understand the role of PIF genes under biotic stress, we analyzed the expression patterns of PIFs based on public RNA-seq data under beta-aminobutyric acid and benzothiadiazole S-methylester biotic stress treatments [57,58] (Supplementary Figure S6). Under beta-aminobutyric acid biotic stress treatment, ItbPIF3.2 was significantly induced, while ItbPIF1.1, ItbPIF1.2, ItbPIF3.1, and ItbPIF4 were strongly suppressed. Under benzothiadiazole S-methylester biotic stress treatment, ItbPIF1.2 and ItbPIF3.1 were up-regulated, while ItbPIF1.1, ItbPIF3.2, and ItbPIF4 were down-regulated (Supplementary Figure S6A). Under benzothiadiazole S-methylester biotic stress treatment, the expression of most ItfPIF genes was suppressed except for ItfPIF1.2 and ItfPIF8 in I. trifida (Supplementary Figure S6B).
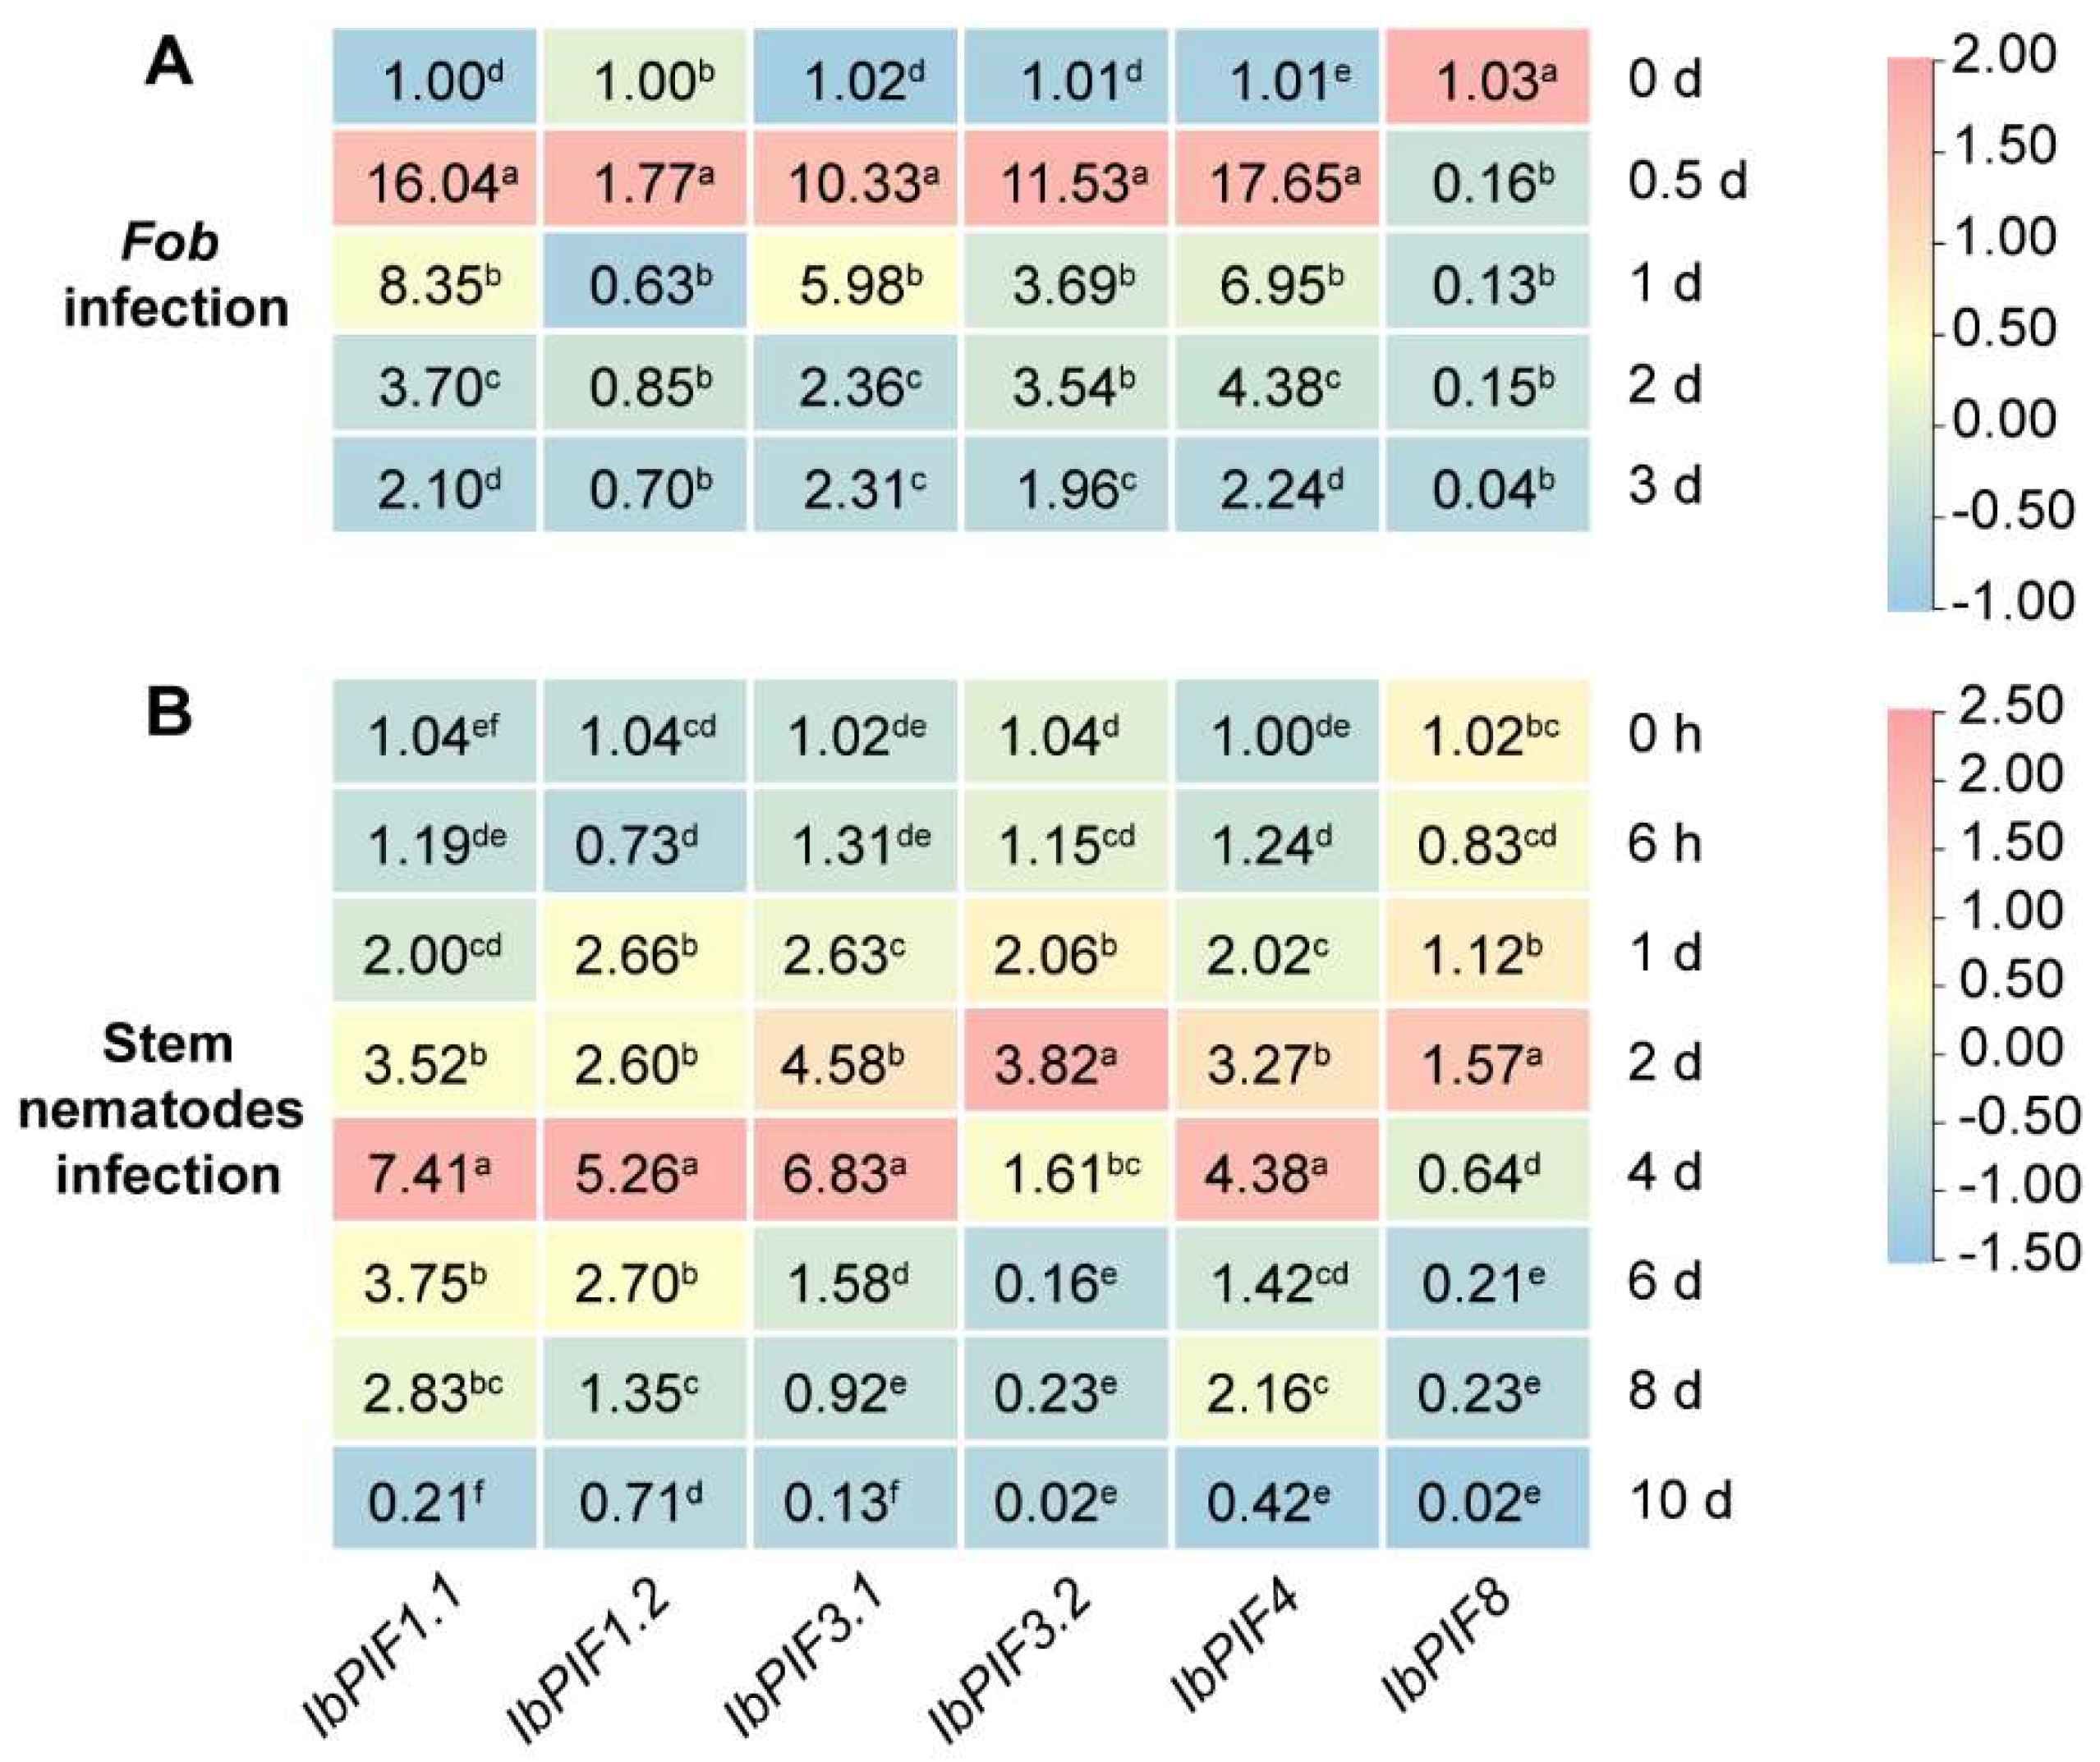
To investigate the possible functions of IbPIFs under biotic stress, expression profiling of PIF genes was further analyzed in response to two common sweet potato diseases: Fusarium wilt disease and stem nematodes. The expression patterns of IbPIF genes at various time points were analyzed by qRT-PCR (Figure 9). After Fob infection, except for IbPIF8, which was down-regulated, the other five genes were up-regulated at all four time points, whereas IbPIF1.1, IbPIF3.1, IbPIF3.2, and IbPIF4 were shown to be highly expressed and peaked at 0.5 d, after which they remained at a high level. The expression level of IbPIF1.2 was slightly up-regulated, but decreased more significantly later under Fob infection (Figure 9A). After stem nematode infection, the expression levels of IbPIF1.1, IbPIF1.2, IbPIF3.1, and IbPIF4 was significantly up-regulated and peaked at 4 d (Figure 9B). Meanwhile, the expression level of IbPIF3.2 was up-regulated and peaked at 2 d. The IbPIF3.1 was significantly up-regulated under abiotic and biotic stresses, so we selected IbPIF3.1 for further research.

2.8. Overexpression of IbPIF3.1 Enhanced Drought Tolerance of Tobacco

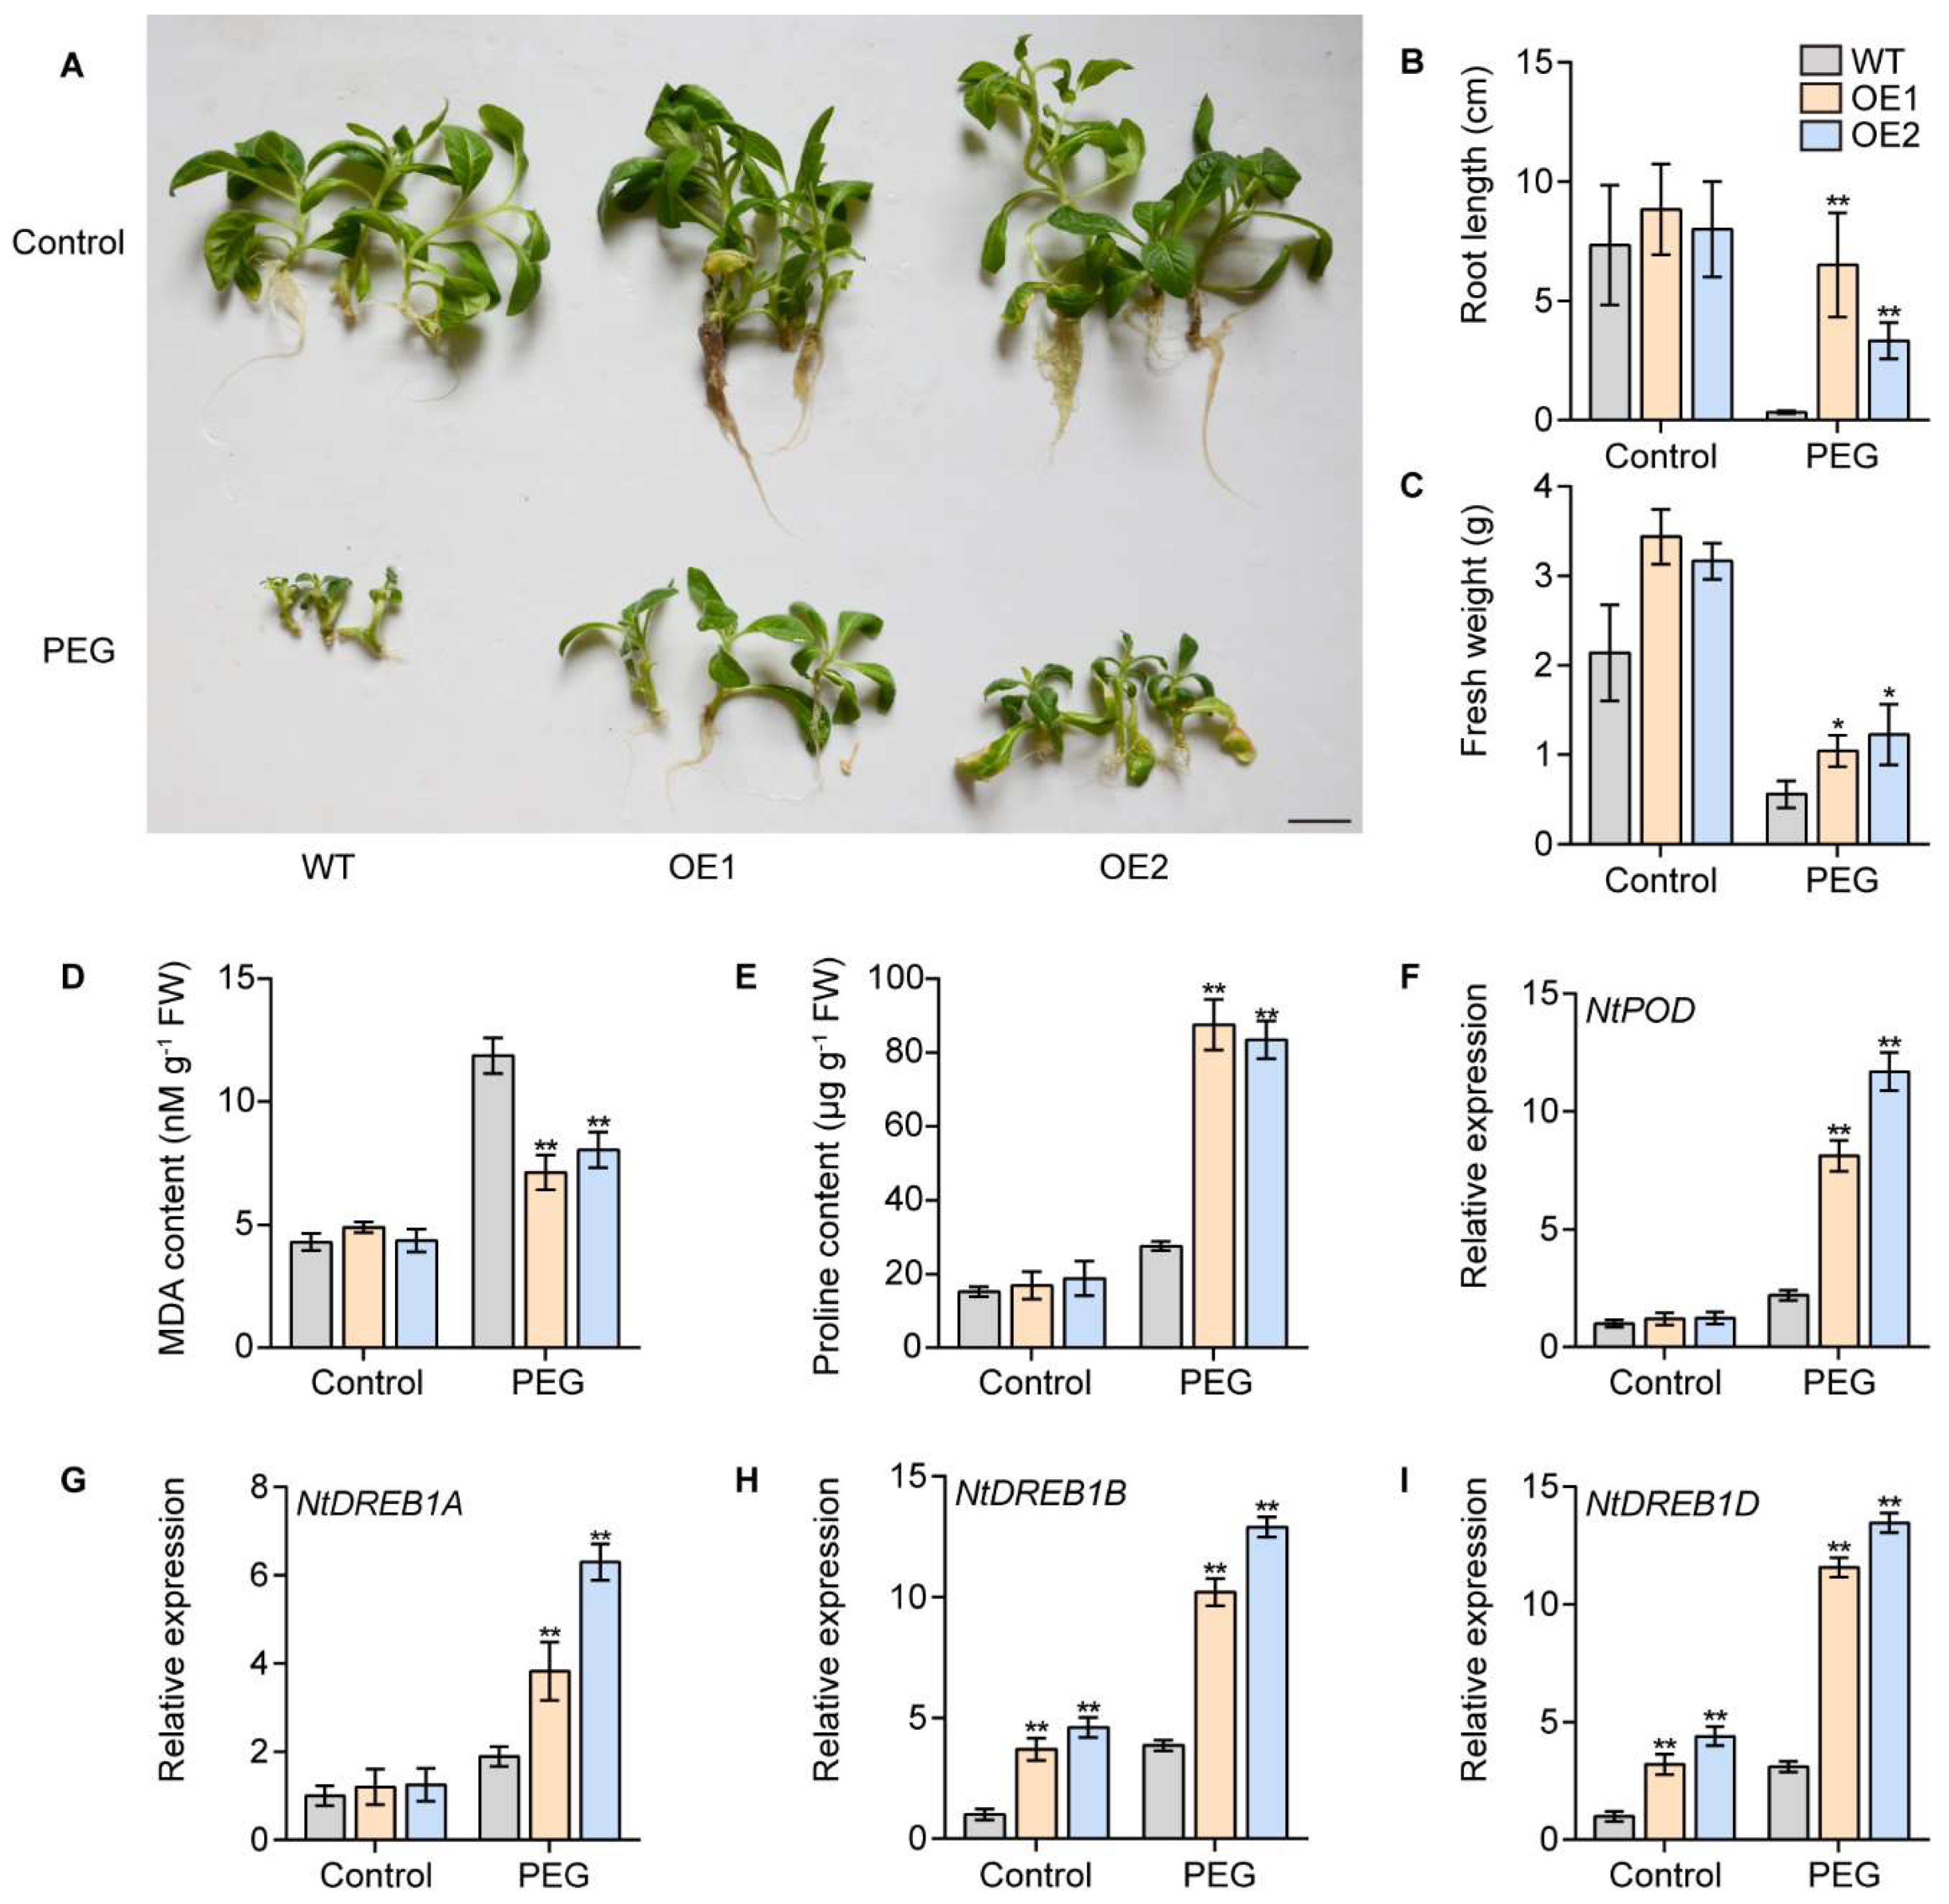
To verify the effects of IbPIF3.1 on abiotic stress, we obtained two transgenic lines of tobacco cv. Wisconsin 38 (W38) with overexpressed IbPIF3.1 (OE1 and OE2). Under normal growth conditions, there were no significant differences between WT and transgenic plants in terms of root length and fresh weight (Figure 10A). Under PEG treatment, WT displayed severe growth retardation, whereas IbPIF3.1-OE lines formed new roots, where the length of the roots (Figure 10B) and fresh weights (Figure 10C) were significantly higher than that of WT.
In order to assess the degree of cell damage, we measured the malondialdehyde (MDA) and proline content. Under PEG treatment, the MDA content was significantly higher in WT than IbPIF3.1-OE lines (Figure 10D), while the proline content in WT was significantly lower than in IbPIF3.1-OE lines (Figure 10E). Further analysis showed that the overexpression of IbPIF3.1 up-regulated the expression of stress-related genes NtPOD, NtDREB1A, NtDREB1B, and NtDREB1D under PEG treatment in transgenic plants (Figure 10F–I). These results suggested that overexpression of IbPIF3.1 enhanced drought tolerance of tobacco.

2.9. Overexpression of IbPIF3.1 Enhanced Fob Resistance of Tobacco

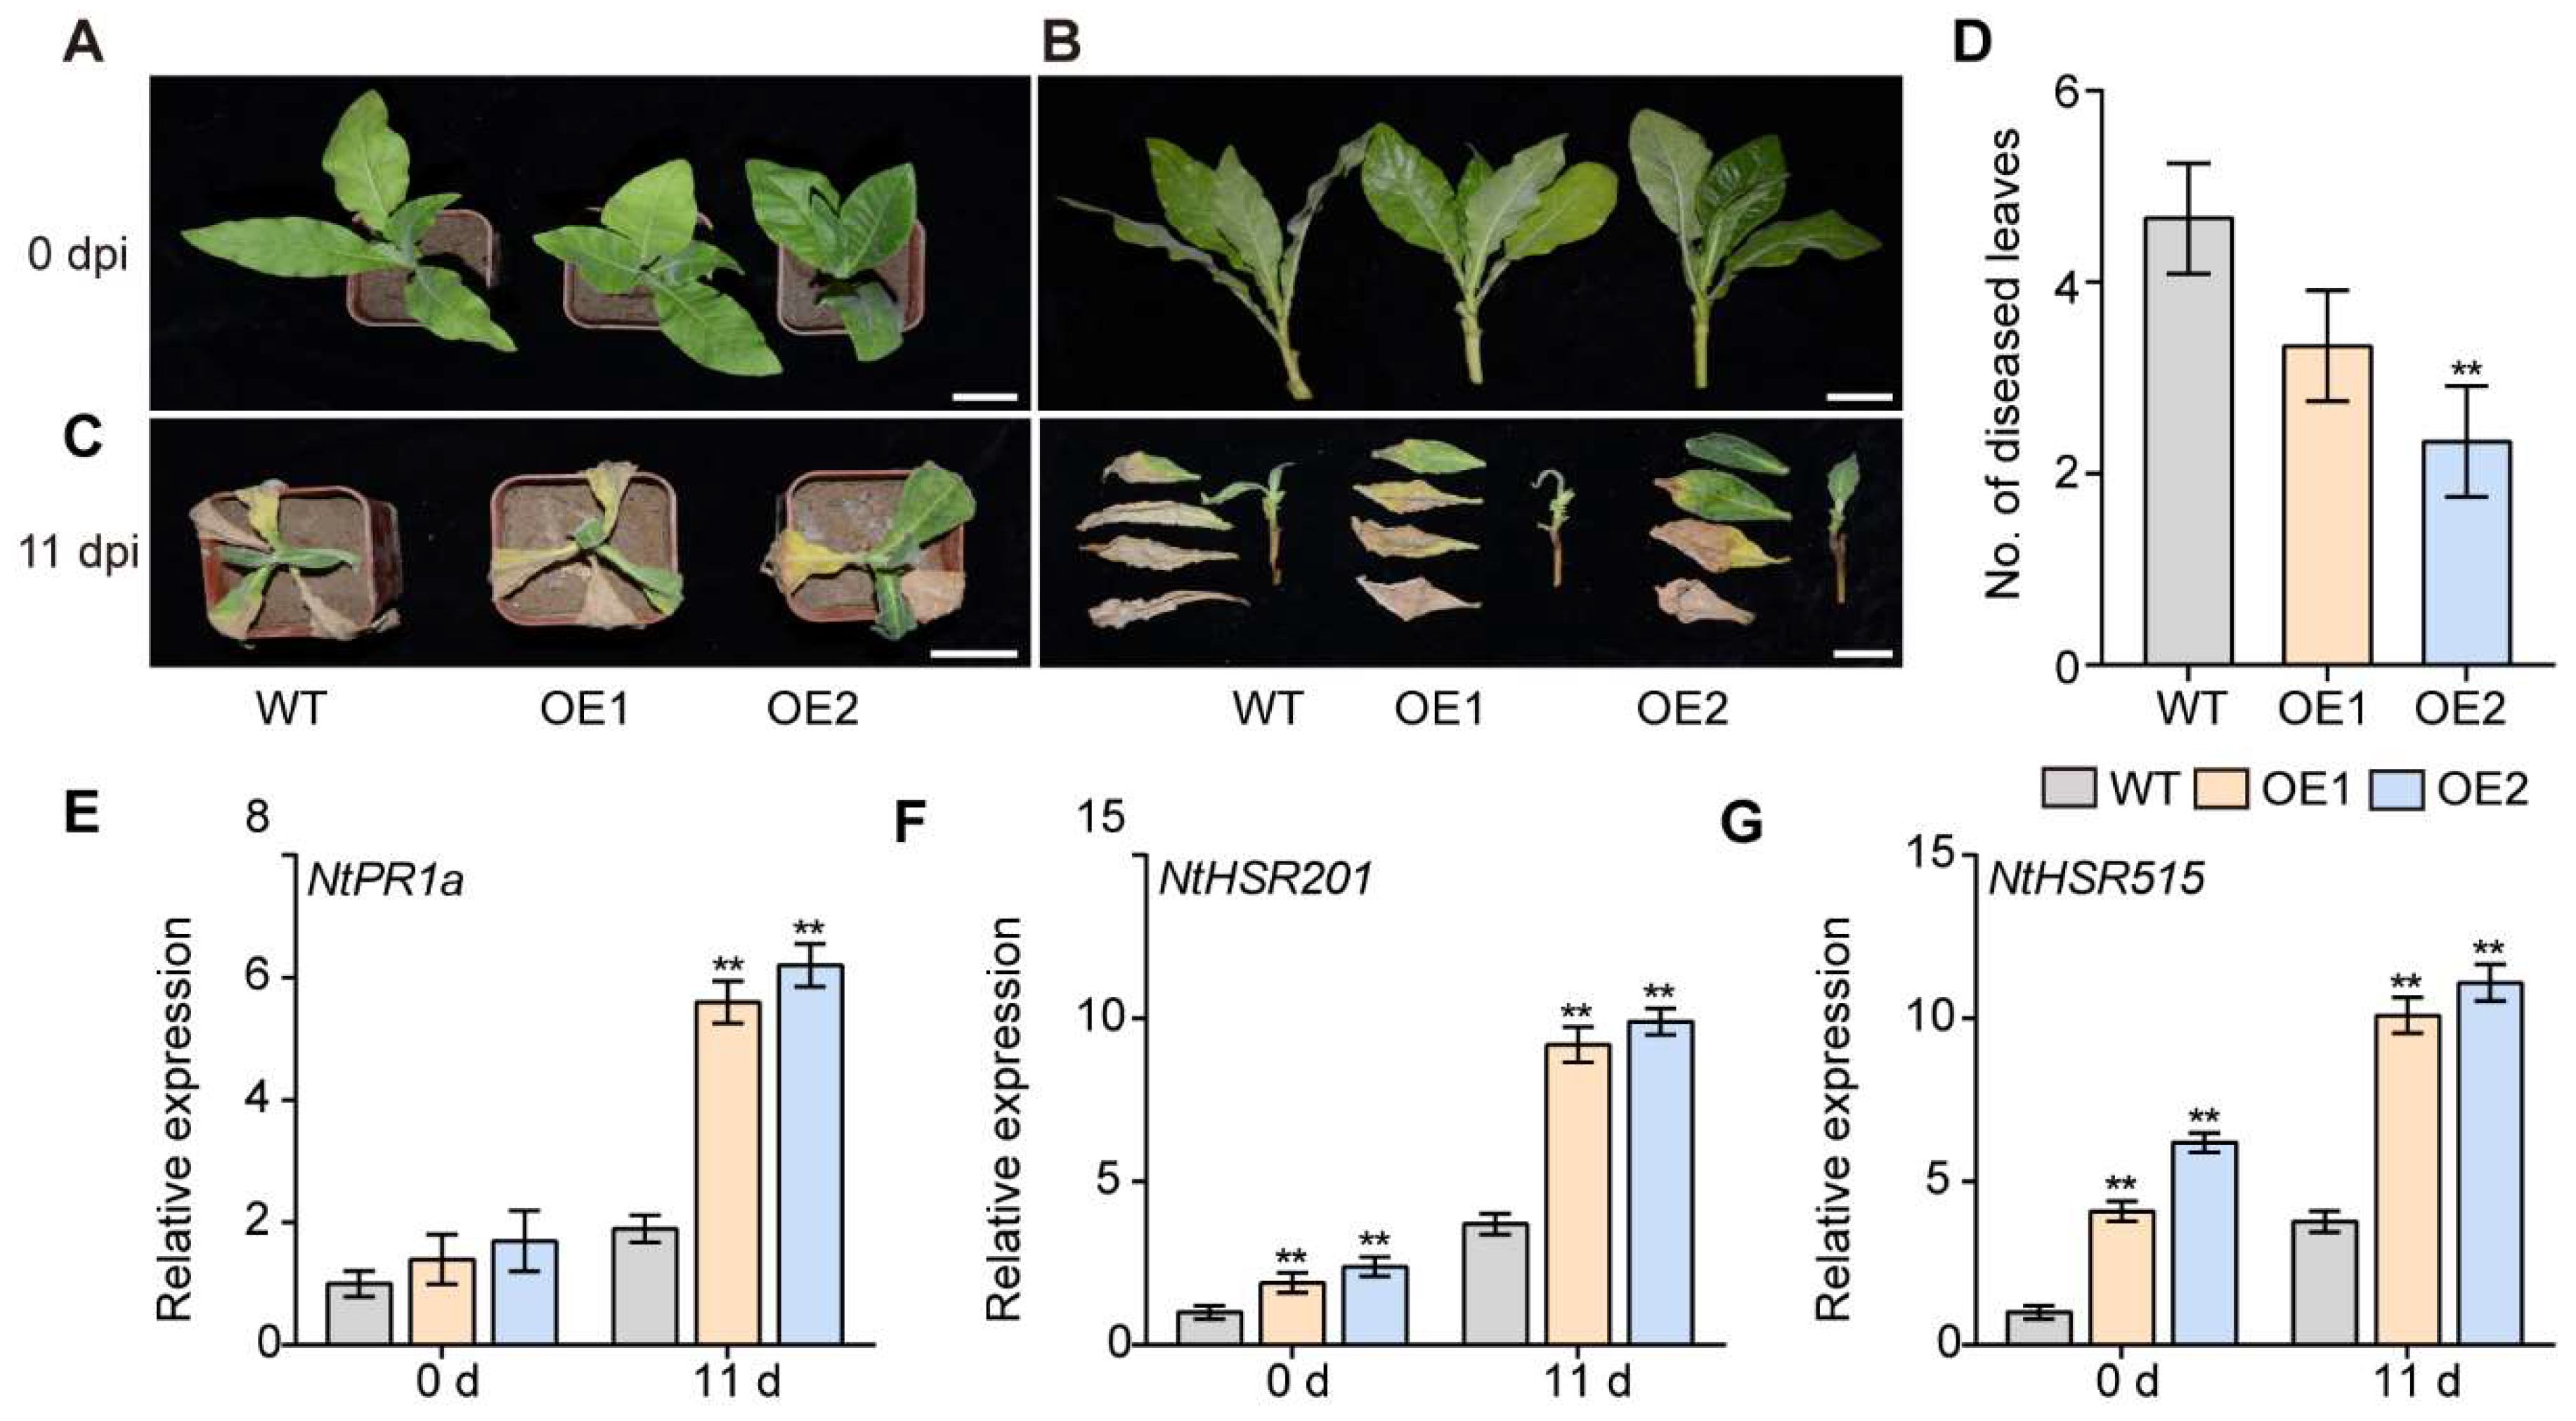
In order to further analyze the function of IbPIF3.1 in response to biotic stress, the IbPIF3.1-OE lines were infected with Fusarium wilt fungus. Before infection, there was no significant difference in morphology between WT and transgenic lines (Figure 11A,B). Eleven days after Fob infection, the leaves and stems of WT were withered and brown (Figure 11C). However, the withering degree of leaves and stems, and the number of diseased leaves of transgenic line OE2 were significantly lower than those of wild type, and maintained a good growth state (Figure 11D).
Further analysis showed that the overexpression of IbPIF3.1 up-regulated the expression salicylic-acid responsive gene NtPR1a and hyper-sensitive response relative genes NtHSR201 and NtHSR515 after Fob infection in transgenic plants (Figure 11E–G). Overall, the results suggested that IbPIF3.1 functions as a positive regulator of Fob resistance in tobacco.

3. Discussion

3.1. Identification and Evolution of PIFs Family

In this study, PIFs were identified in the cultivated hexaploid sweet potato and its two diploid relatives. The number of PIF genes in I. batatas was the same as that in its diploid relatives I. triloba (6) and I. trifida (6) (Figure 1, Supplementary Table S1). It is well known that cultivated sweet potato (I. batatas) originated from a hybrid between diploid and tetraploid ancestors, followed by a whole-genome duplication event. This process dates back to about 0.8 and 0.5 million years ago [52]. The number of PIF genes in sweet potato differs from that in other plants, such as Arabidopsis (8), rice (6), tea (7), tomato (8), grape (4), apple (7), potato (7), and carrot (5). According to the gene dosage balance hypothesis, genes in the same family are often functionally redundant [59]. Therefore, these quantitative differences might not affect the function of PIFs in plants. In this study, the results of phylogenetic analysis showed that IbPIFs had the closest relationship with tomato and potato PIFs (Figure 2). It is well known that sweet potato belongs to the family Convolvulaceae [53], and tomato and potato belong to the family Solanaceae. According to botanical classification, Solanaceae and Convolvulaceae belong to the Solanales [60,61]. Compared with other plants (in this study), they might have a closer relationship. In the future, it is possible to discover homologous genes from these closely related plant genomes and provide some reference for functional analysis.
PIFs directly interact with phytochrome to regulate the light signaling pathway, where phyA and phyB can specifically bind the APA and APB domains, respectively. In this study, we combined conserved domain analysis, and predicted motifs to further identify PIF family members in sweet potato [13,19]. All IbPIFs contained bHLH and APB domains. However, only IbPIF1.1, IbPIF3.1, and IbPF3.2 contained the APA domain (Figure 3A). The loss of the APA domain might lead to a loss of phyA binding ability, affecting light signal transduction [13].

3.2. The Expression of PIF Genes Was Tissue-Specific in Sweet Potato

In rice, OsPIL13 is highly expressed in the node portions of the stem nodes, and overexpression of OsPIL13 promotes internode elongation and reduces plant height [28]. ZmPIF1 and ZmPIF3 are highly expressed in pistils and leaves, and enhance grain yield by increasing the number of tillers and panicles [30,31,62]. SlPIF4 is highly expressed in tomato leaves and fruits and decreases significantly after ripening [63]. In this study, the expression level of PIFs were found to be higher in the stem and leaf (especially in mature leaf) of sweet potato and its two diploid relatives I. triloba and I. trifida, and low in root (Figure 6, Supplementary Figure S3). This is similar to the expression of DcPIFs, MdPIFs, and CaPIF genes [19,21,25]. Interestingly, the expression levels of IbPIF 1.1 and IbPIF3.1 were higher in the fibrous roots than in the tuberous roots in sweet potato (Figure 6). The difference in the expression of these genes might be related to the growth and development of sweet potato.

3.3. PIFs Play Important Roles in Hormone Signaling Pathways in Sweet Potato

In Arabidopsis, PIF3, RGA, and COI1 form a signal cascade to regulate plant defense and growth by interfering with JA and GA signals [64]. PIF can cooperate with JA and ethylene (ET) signaling to regulate Arabidopsis resistance to Beauveria bassiana [37]. In this study, we in silico predicted that IbPIFs could interact with hormone synthesis and signal transduction-related proteins, such as the GA signaling-related proteins RGA, RGL1, RGL2, and RGL3, and BR signaling pathway-related protein BZR1 (Figure 5). The complex interactions between PIFs and hormone signaling pathway proteins suggested that they might play an important role in regulating plant growth, development, and stress response.
PIFs are involved in multiple hormones signaling pathways [65], for example, AtPIF1 controls seed germination by regulating ABA and GA signaling pathways [66,67]. AtPIF4 and AtPIF5 can integrate light signals and auxin signaling pathways to regulate plant rhythmic growth [68]. In this study, we found that most PIF genes were induced by at least one hormone, and the promoter region of PIFs contained at least one hormone corresponding cis-element (Figure 4, Figure 7, Supplementary Figure S4). In sweet potato, IbPIF1.1, IbPIF3.2, and IbPIF8 were induced by GA, IAA, JA, and SA treatments (Figure 7). IbPIF3.1 and IbPIF4 were induced by GA, SA, and JA or IAA treatments (Figure 7). IbPIF1.2 was induced by IAA and SA treatments (Figure 7). In addition, we found that some of the sweet potato diploid relatives’ homologous PIF genes showed different expression patterns in response to ABA, GA, and IAA treatments. Under ABA treatment, ItbPIF1.2, ItfPIF1.2, ItbPIF3.1, and ItfPIF3.1 were up-regulated, while IbPIFs were not sensitive to ABA. Under GA or IAA treatment, IbPIF1.1 showed opposite expression trends compared with ItbPIF1.1, and ItfPIF1.1. Under GA or IAA treatment, the expression trend of ItbPIF3.1 was opposite to that of ItfPIF3.1 (Figure 7, Supplementary Figure S4). These results suggest that PIFs might be involved in the regulation network of different hormones in sweet potato and its wild relatives, thus affecting the growth and defense of plants.

3.4. PIF Genes Response to Multiple Stresses

OsPIL14 is significantly induced by salt stress; the overexpression of OsPIL14 enhances seedling growth under salt stress [69]. DcPIF3, ZmPIF1, and ZmPIF3 were induced by drought treatment, significantly enhancing the drought tolerance of transgenic plants [25,30,31]. AtPIF4 and AtPIF7 were up-regulated under heat and cold treatment, which negatively regulated the freezing resistance of Arabidopsis thaliana [32,70]. AtPIF1, AtPIF3, AtPIF4, and AtPIF5 were down-regulated after Botrytis inoculation, which negatively regulated the plant defense against Botrytis cinerea [37]. In this study, most PIFs were induced by salt, PEG, H2O2, cold, and heat stresses (Figure 8). For example, IbPIF4 was up-regulated 2.38-fold within 0.5 h under NaCl treatment (Figure 8A), IbPIF3.1 was up-regulated 11.08-fold within 3 h under PEG treatment (Figure 8B), IbPIF1.2 was up-regulated 12.98-fold within 3 h under H2O2 treatment (Figure 8C), IbPIF3.2 was up-regulated 1.53-fold within 3 h under cold treatment (Figure 8D), and IbPIF3.1 was up-regulated 5.64-fold within 6 h under heat treatment (Figure 8E). The two diploid relatives, ItbPIF1.1, ItbPIF3.1, ItfPIF1.1, and ItfPIF3.1 were up-regulated under NaCl and drought stress treatments, and ItfPIF3.2 was up-regulated under cold and heat stress treatments (Supplementary Figure S5). These results showed that PIFs might be involved in responses to abiotic stress in sweet potato and its wild relatives. In addition, the expression levels of IbPIF1.1, IbPIF1.2, IbPIF3.1, IbPIF3.2, and IbPIF4 were up-regulated and maintained at high level for several days in sweet potato after Fob and stem nematode infections (Figure 9). In the two diploid relatives, the expression of ItbPIF3.1, ItbPIF3.2, and ItfPIF8 genes were up-regulated under beta-aminobutyric acid and benzothiadiazole S-methylester biotic stresses treatment (Supplementary Figure S6).
Finally, we developed a preliminary understanding of the regulatory pathways in which PIF genes may be involved by RNA-seq and qRT-PCR. However, there were a few discrepancies between data obtained from the qRT-PCR and RNA-seq, since the respective homologous genes showed differential expression under stress in I. batatas, I. triloba, and I. trifida. These results may reflect the differences in responses to environment stress between cultivated and wild species [71,72]. Studies have found that some wild species are better able than cultivated species to resist biotic and abiotic stresses [73,74,75]. Therefore, the diploid relatives are valuable resources for the improvement of cultivated sweet potato [76].

3.5. Overexpressing IbPIF3.1 Significantly Enhanced Drought Tolerance and Fob Resistance of Tobacco

Some studies have reported that PIFs are closely associated with abiotic stress responses [77]. OsPIL15 interacts with OsHHO3 to directly activate OsABI5 expression and negatively regulate stomatal opening [78]. ZmPIF1 and ZmPIF3 enhance the drought tolerance of rice by reducing transpiration and the leaf water loss rate [30,31]. AtPIF1, AtPIF4, and AtPIF5 specifically bind to the G-box of the CBF gene and negatively regulate plant cold tolerance [32,33]. A recent study has found that phytochromes are also involved in this process. On the one hand, phyB directly activates CBF genes expression; on the other hand, phyB inhibits the interaction between PIF1, PIF4, PIF5, and CBF, further enhancing the cold tolerance of plants [79]. High temperature inactivates phyB, leading to accumulation of PIF4, thus promoting plant cell elongation and early flowering [80]. The overexpression of DcPIF3 can significantly improve drought and salt tolerance in Arabidopsis [25]. In this study, the expression of IbPIF3.1 was significantly up-regulated by NaCl, PEG, H2O2, cold, heat, Fob and stem nematodes, and its overexpression could significantly improve the drought resistance and Fusarium wilt resistance of transgenic tobacco (Figure 10 and Figure 11).
Drought can cause plant cells to produce excess reactive oxygen species (ROS) [81]. Excessive ROS can aggravate membrane lipid peroxidation, causing damage to the cell membrane, resulting in a large number of secondary products such as MDA in plants [82]. Some studies have shown that plants can improve stress resistance by accumulating osmotic adjustment substances, such as proline and soluble sugar, to regulate osmotic balance, activate the ROS scavenging system, and protect membrane integrity [83,84]. Antioxidant enzymes, such as SOD, POD, CAT, and APX, are employed to scavenge excessive ROS accumulated under abiotic stress in plants [85]. Previous studies have found that AtDREB1A and AtDREB2A play an important role in the abiotic stress response [86]. The overexpression of AtDREB2A transgenic lines improved the drought tolerance of Arabidopsis [87]. The overexpression of soybean GmDREB1 genes enhances drought and cold tolerance in transgenic wheat plants [88]. In this study, under drought stress, IbPIF3.1-OE lines had a lower MDA content and higher proline content than that of WT plants (Figure 10D,E). The qRT-PCR results showed that the expression of NtPOD, NtDREB1A, NtDREB1B, and NtDREB1D was significantly up-regulated in the IbPIF3.1-OE tobacco plants compared to WT under drought stress (Figure 10F–I). These results showed that overexpression of IbPIF3.1 could increase drought tolerance of the transgenic tobacco by improving reactive oxygen species (ROS) scavenging ability and modulating the expression of drought-related genes.
However, there has been little research on the molecular mechanisms of PIFs involved in biotic stress responses. In Arabidopsis, PIF4 positively regulates the temperature-induced suppression of defense responses to Pto DC3000 [36]. AtPIFs negatively regulate plant defenses against B. cinerea by directly repressing ERF1 expression [37]. Pathogen-related (PR) proteins are considered as major regulators of the defense system to increase plant disease resistance [89]. In wheat, TdPR1.2 gene expression was strongly induced by SA to inhibit the growth of bacteria and fungi [90]. Hypersensitivity reaction (HR) is an important defense mechanism of plants under biotic stress [91]. It was found that HSR201 and HSR515 in tobacco were closely related to hypersensitivity [92]. In this study, the expression of PR1a, HSR201, and HSR515 was significantly up-regulated in transgenic tobacco plants overexpressing IbPIF3.1 compared with WT after Fob infection (Figure 11E–G). These results suggested that the enhanced Fob resistance of the transgenic plants’ overexpressing IbPIF3.1 may be due to the increased expression of stress-related genes. Together, all of results indicated that PIFs are key signal integrators in biotic and abiotic pathways to regulate plant growth [62]. In order to better cope with future environmental challenges, the potential functions of PIFs need to be continuously explored.

4. Materials and Methods

4.1. Identification of PIFs

To identify the PIF genes in sweet potato, all protein sequences were acquired from Sweetpotato Genomics Resource (http://sweetpotato.uga.edu/index.shtml; accessed on 15 September 2022) and Ipomoea Batatas Genome Browser (http://public-genomes-ngs.molgen.mpg.de/sweetpotato/; accessed on 15 September 2022). Then, we downloaded the protein sequence of Arabidopsis PIFs from the TAIR Arabidopsis database (https://www.arabidopsis.org/; accessed on 15 September 2022) and blasted the homologous sequence against the sweet potato genome database. All obtained sequences next used the SMART program (https://smart.embl.de/; accessed on 17 September 2022) and Conserved Domain Database (https://www.ncbi.nlm.nih.gov/Struture/cdd/wrpsb.cgi; accessed on 17 September 2022) to confirm the presence of conserved bHLH and APB domains.

4.2. Protein Properties Prediction and Chromosomal Distribution of PIFs

The physiological and biochemical properties of IbPIF proteins, including molecular weight, isoelectric point, unstable index, and hydrophilicity, were determined using the ExPASy (https://web.expasy.org/compute_pi/; accessed on 19 September 2022). The subcellular localization of IbPIFs was predicted using WoLF PSORT (https://www.genscript.com/wolf-psort.html; accessed on 19 September 2022).
The IbPIFs, ItbPIFs, and ItfPIFs were separately mapped to the I. batatas, I. triloba, and I. trifida chromosomes based on the chromosomal locations provided in the Sweetpotato Genomics Resource (http://sweetpotato.uga.edu/index.shtml; accessed on 22 September 2022). The visualization was created using the TBtools software [93].

4.3. Phylogenetic Analysis of PIFs

All PIFs amino acid sequences of A. thaliana (At), C. sinensis (Cs), D. carota (Dc), I. batatas (Ib), I. triloba (Itb), I. trifida (Itf), M. domestica (Md), O. sativa (Os), S. lycopersicum (Sl), S. tuberosum (St), and V. vinifera (Vv) were aligned using ClustalX with default settings. A ML phylogenetic tree of the PIFs was constructed by MEGA 11.0 with the bootstrap test of 1000 [94]. The phylogenetic tree was constructed using ChiPlot (https://www.chiplot.online/; accessed on 26 September 2022).

4.4. Motifs Identification and Conserved Domain Analysis of PIFs

The conserved motifs of PIFs were analyzed using MEME (https://meme-suite.org/meme/tools/meme; accessed on 20 September 2022), where the maximum number of motif parameters was set to 10. The conserved domains and exon–intron structure of PIFs were visualized using the TBtools software.

4.5. Protein Interaction Network of PIFs

The protein interaction network of PIFs was predicted by GeneMAINA (http://genemania.org/; accessed on 1 October 2022) and String (https://www.string-db.org/; medium confidence 0.400; accessed on 1 October 2022), based on Arabidopsis orthologous proteins. The protein–protein interaction (PPI) network and node network diagrams were constructed using the Cytoscape software 3.2 (Institute for Systems Biology, Seattle, WA, USA) [95].

4.6. The qRT-PCR Analysis of PIFs

The stem nematode-tolerant sweet potato cv. Lushu 3 was used for qRT-PCR analysis in this study. In vitro grown Lushu 3 plants were cultured on Murashige and Skoog (MS) medium at 27 ± 1 °C under a photoperiod consisting of 13 h of cool-white, fluorescent light at 54 μmol m−2 s−1 and 11 h of darkness. The in vitro plantlets were subsequently cultivated in a field at the campus of China Agricultural University, Beijing, China.
The shoots, leaves, petioles, stems, fibrous root, and mature tuberous root of 3-month-old field-grown Lushu 3 plants were used for expression analysis of various tissues. For the expression analysis of hormone and abiotic treatment, four-week-old in vitro-grown plants were transferred into half strength MS medium containing 100 μM ABA, 100 μM GA, 100 μM IAA, 100 μM MeJA, 100 μM SA, 200 mM NaCl, 20% PEG6000, 10 mM H2O2, 4 °C or 35 °C for treatment, and the leaves were sampled at 0, 0.5, 1, 3, 6, and 12 h after treatment. For expression analysis after Fob infection (detailed in Section 4.9), fresh leaves of Lushu 3 were sampled at 0 d, 0.5 d, 1 d, 2 d, and 3 d after inoculation with Fob [43]. For expression analysis after stem nematode infection, the roots of Lushu 3 were sampled at 0 h, 6 h, 1 d, 2 d, 4 d, 6 d, 8 d, and 10 d after 500 sweet potato stem nematode infection, respectively [41]. Three independent biological replicates were conducted, each with three plants.
Total RNA was extracted using the TRIzol method (Invitrogen, Carlsbad, CA, USA). The reaction mixture was composed of first-strand cDNA, primer mix, and SYBR Green Real-Time PCR Master Mix (TaKaRa Biotech Dalian, China; code: DRR037A) to a final volume of 20 μL. A sweet potato actin gene (GenBank AY905538, 20, 5, 21) was used as an internal control. The relative gene expression levels were quantified with the comparative CT method. The specific primers used in qRT-PCR analysis are listed in Supplemental Table S3. The qRT-PCR was conducted using the SYBR detection protocol on 7500 Real-Time PCR instrument (Applied Biosystems, Foster City, CA, USA). The heat maps of the gene expression profiles were constructed using the TBtools software.

4.7. Transcriptome Analysis

The RNA-seq data of ItbPIFs and ItfPIFs in I. triloba and I. trifida were downloaded from the Sweetpotato Genomics Resource (http://sweetpotato.uga.edu/index.shtml; accessed on 10 December 2022) [53]. The RNA-seq data of IbPIFs in Yan252 and Xuzi3 were obtained from related research [96]. The expression levels of PIFs were calculated as fragments per kilobase of exon per million fragments mapped (FPKM). The heat maps were constructed using the TBtools software.

4.8. Production of Transgenic Tobacco Plants

The CDS of IbPIF3.1 was amplified from Lushu 3 and inserted into pBI121 binary vector (Supplemental Table S3). The 35S-IbPIF3.1-NOS expression cassette was excised from the pBI121-IbPIF3.1 vector and integrated to the pCAMBIA3301 vector, in order to obtain the overexpression vector pC3301-121-IbPIF3.1. This recombinant plasmid was transferred into N. tabacum cv. W38 by A. tumefaciens-mediated transformation method, in order to generate T0 transgenic tobacco lines overexpressing IbPIF3.1. Transgenic lines were verified by PCR amplification and qRT-PCR analysis [43].

4.9. PEG Stress Treatment

In vitro-grown IbPIF3.1-OE lines and WT were cultured on MS medium with or without (control) 20% PEG6000 at 27 ± 1 °C under a photoperiod consisting of 13 h of cool-white, fluorescent light at 54 μmol m−2 s−1 and 11 h of darkness. After four weeks, the root length and fresh weight were measured. Meanwhile, their leaf formation was investigated, and proline and MDA contents were measured [42]. Three independent biological replicates were conducted, each with three plants. The expression of stress-related genes was analyzed by qRT-PCR by above-mentioned method. The specific primers used in qRT-PCR analysis are listed in Supplemental Table S3.

4.10. Fusarium Wilt Resistance Assay

The Fob fungal culture was homogenized on a PDA plate, suspended in sterilized water, and adjusted to a spore density of 1.5 × 10⁷ mL−1. Then, 40-day-old IbPIF3.1-OE lines and WT cuttings (without roots) were immersed into the spore solution for 30 min and incubated into sterilized sand moistened with sterilized Hoagland solution [43]. After 11 days, the number of diseased leaves was recorded. Three independent biological replicates were conducted, each with three plants. The expression of stress-related genes was analyzed by qRT-PCR by above-mentioned method. The specific primers used in qRT-PCR analysis are listed in Supplemental Table S3.

5. Conclusions

In this study, PIF genes from sweet potato and its two diploid relatives were identified, and their protein properties, chromosomal location, phylogenetic relationships, gene structure, promoter cis-elements, protein interaction network, and expression patterns were comprehensively and systematically investigated. Our research revealed that IbPIFs participate in plant growth and development, as well as responses to abiotic and biotic stresses. The functional analysis results indicated that the overexpression of IbPIF3.1 significantly improves the drought tolerance and Fusarium wilt resistance of transgenic tobacco plants. This study lays a foundation for further analysis of the function of PIF genes and is of great significance for the stress-resistant genetic engineering of sweet potato.

Supplementary Materials

The following supporting information can be downloaded at: https://www.mdpi.com/article/10.3390/ijms24044092/s1.

Author Contributions

H.Z. (Hong Zhai) and N.N. conceived and designed the research. N.N., J.H., S.S. and Y.C. performed the experiments. N.N., Z.Z., H.Z. (Huan Zhang) and S.G. analyzed the data. H.Z. (Hong Zhai) and N.N. wrote the paper. N.Z., S.G., S.H., Q.L. and H.Z. (Hong Zhai) revised the paper. All authors have read and agreed to the published version of the manuscript.

Funding

This research was funded by the National Natural Science Foundation of China (31872878), and the Earmarked Fund for CARS-10-Sweetpotato.

Institutional Review Board Statement

Not applicable.

Informed Consent Statement

Not applicable.

Data Availability Statement

The data presented in this study are available on request from the corresponding author.

Conflicts of Interest

The authors declare no conflict of interest.

References

  1. Bae, G.; Choi, G. Decoding of light signals by plant phytochromes and their interacting proteins. Annu. Rev. Plant Biol. 2008, 59, 281–311. [Google Scholar] [CrossRef] [PubMed] [Green Version]
  2. Roeber, V.M.; Bajaj, I.; Rohde, M.; Schmulling, T.; Cortleven, A. Light acts as a stressor and influences abiotic and biotic stress responses in plants. Plant Cell Environ. 2021, 44, 645–664. [Google Scholar] [CrossRef] [PubMed]
  3. Hoang, Q.T.N.; Han, Y.J.; Kim, J.I. Plant Phytochromes and their Phosphorylation. Int. J. Mol. Sci. 2019, 20, 3450. [Google Scholar] [CrossRef] [PubMed] [Green Version]
  4. Li, F.W.; Mathews, S. Evolutionary aspects of plant photoreceptors. J. Plant Res. 2016, 129, 115–122. [Google Scholar] [CrossRef] [PubMed]
  5. Quail, P.H. Phytochrome photosensory signalling networks. Nat. Rev. Mol. Cell Biol. 2002, 3, 85–93. [Google Scholar] [CrossRef] [PubMed]
  6. Cashmore, A.R.; Jarillo, J.A.; Wu, Y.J.; Liu, D.M. Cryptochromes: Blue light receptors for plants and animals. Science 1999, 284, 760–765. [Google Scholar] [CrossRef]
  7. Chen, M.; Chory, J. Phytochrome signaling mechanisms and the control of plant development. Trends Cell Biol. 2011, 21, 664–671. [Google Scholar] [CrossRef] [Green Version]
  8. Gururani, M.A.; Ganesan, M.; Song, P.S. Photo-biotechnology as a tool to improve agronomic traits in crops. Biotechnol. Adv. 2015, 33, 53–63. [Google Scholar] [CrossRef]
  9. Carvalho, R.F.; Campos, M.L.; Azevedo, R.A. The Role of Phytochrome in Stress Tolerance. J. Integr. Plant Biol. 2011, 53, 920–929. [Google Scholar] [CrossRef]
  10. Ballare, C.L. Light Regulation of Plant Defense. Annu. Rev. Plant Biol. 2014, 65, 335–363. [Google Scholar] [CrossRef]
  11. Paik, I.; Kathare, P.K.; Kim, J.I.; Huq, E. Expanding Roles of PIFs in Signal Integration from Multiple Processes. Mol. Plant 2017, 10, 1035–1046. [Google Scholar] [CrossRef] [PubMed] [Green Version]
  12. Possart, A.; Xu, T.F.; Paik, I.; Hanke, S.; Keim, S.; Hermann, H.M.; Wolf, L.; Hiss, M.; Becker, C.; Huq, E.; et al. Characterization of Phytochrome Interacting Factors from the Moss Physcomitrella patens Illustrates Conservation of Phytochrome Signaling Modules in Land Plants. Plant Cell 2017, 29, 310–330. [Google Scholar] [CrossRef] [PubMed] [Green Version]
  13. Pham, V.N.; Kathare, P.K.; Huq, E. Phytochromes and Phytochrome Interacting Factors. Plant Physiol. 2018, 176, 1025–1038. [Google Scholar] [CrossRef] [Green Version]
  14. Leivar, P.; Monte, E. PIFs: Systems Integrators in Plant Development. Plant Cell 2014, 26, 56–78. [Google Scholar] [CrossRef] [PubMed] [Green Version]
  15. Leivar, P.; Quail, P.H. PIFs: Pivotal components in a cellular signaling hub. Trends Plant Sci. 2011, 16, 19–28. [Google Scholar] [CrossRef] [PubMed] [Green Version]
  16. Inoue, K.; Nishihama, R.; Kataoka, H.; Hosaka, M.; Manabe, R.; Nomoto, M.; Tada, Y.; Ishizaki, K.; Kohchi, T. Phytochrome Signaling Is Mediated by Phytochrome Interacting Factor in the Liverwort Marchantia polymorpha. Plant Cell 2016, 28, 1406–1421. [Google Scholar] [CrossRef] [Green Version]
  17. Rosado, D.; Gramegna, G.; Cruz, A.; Lira, B.S.; Freschi, L.; de Setta, N.; Rossi, M. Phytochrome Interacting Factors (PIFs) in Solanum lycopersicum: Diversity, Evolutionary History and Expression Profiling during Different Developmental Processes. PLoS ONE 2016, 11, 0165929. [Google Scholar] [CrossRef] [Green Version]
  18. Zhang, K.K.; Zheng, T.; Zhu, X.D.; Jiu, S.T.; Liu, Z.J.; Guan, L.; Jia, H.F.; Fang, J.G. Genome-Wide Identification of PIFs in Grapes (Vitis vinifera L.) and Their Transcriptional Analysis under Lighting/Shading Conditions. Genes 2018, 9, 451. [Google Scholar] [CrossRef] [Green Version]
  19. Zheng, P.F.; Wang, X.; Yang, Y.Y.; You, C.X.; Zhang, Z.L.; Hao, Y.J. Identification of Phytochrome-Interacting Factor Family Members and Functional Analysis of MdPIF4 in Malus domestica. Int. J. Mol. Sci. 2020, 21, 7350. [Google Scholar] [CrossRef]
  20. Zhang, X.N.; Xiong, L.G.; Luo, Y.; Wen, B.B.; Wang, K.B.; Liu, Z.H.; Huang, J.A.; Li, J. Identification, Molecular Characteristic, and Expression Analysis of PIFs Related to Chlorophyll Metabolism in Tea Plant (Camellia sinensis). Int. J. Mol. Sci. 2021, 22, 10949. [Google Scholar] [CrossRef]
  21. Yang, Y.X.; Guang, Y.L.; Wang, F.; Chen, Y.; Yang, W.T.; Xiao, X.F.; Luo, S.; Zhou, Y. Characterization of Phytochrome-Interacting Factor Genes in Pepper and Functional Analysis of CaPIF8 in Cold and Salt Stress. Front. Plant Sci. 2021, 12, 746517. [Google Scholar] [CrossRef] [PubMed]
  22. Wang, X.; Liu, Y.; Huai, D.X.; Chen, Y.N.; Jiang, Y.F.; Ding, Y.B.; Kang, Y.P.; Wang, Z.H.; Yan, L.Y.; Jiang, H.F.; et al. Genome-wide identification of peanut PIF family genes and their potential roles in early pod development. Gene 2021, 781, 145539. [Google Scholar] [CrossRef] [PubMed]
  23. Jian, H.; Shang, L.; Jin, Z.; Ding, Y.; Li, Y.; Wang, J.; Hu, B.; Vadim, K.; Lyu, D. Genome-wide identification and characterization of PIF genes and their response to high temperature stress in potato. Zuo Wu Xue Bao 2022, 48, 86–98. [Google Scholar] [CrossRef]
  24. Li, W.Q.; Liu, Y.; Wang, W.P.; Liu, J.C.; Yao, M.Y.; Guan, M.; Guan, C.Y.; He, X. Phytochrome-interacting factor (PIF) in rapeseed (Brassica napus L.): Genome-wide identification, evolution and expression analyses during abiotic stress, light quality and vernalization. Int. J. Biol. Macromol. 2021, 180, 14–27. [Google Scholar] [CrossRef] [PubMed]
  25. Wang, X.R.; Wang, Y.H.; Jia, M.; Zhang, R.R.; Liu, H.; Xu, Z.S.; Xiong, A.S. The phytochrome-interacting factor DcPIF3 of carrot plays a positive role in drought stress by increasing endogenous ABA level in Arabidopsis. Plant Sci. 2022, 322, 111367. [Google Scholar] [CrossRef]
  26. Leivar, P.; Monte, E.; Al-Sady, B.; Carle, C.; Storer, A.; Alonso, J.M.; Ecker, J.R.; Quail, P.H. The Arabidopsis Phytochrome-Interacting Factor PIF7, Together with PIF3 and PIF4, Regulates Responses to Prolonged Red Light by Modulating phyB Levels. Plant Cell 2008, 20, 337–352. [Google Scholar] [CrossRef] [Green Version]
  27. Zhang, Y.; Wu, Z.C.; Feng, M.; Chen, J.W.; Qin, M.Z.; Wang, W.R.; Bao, Y.; Xu, Q.; Ye, Y.; Ma, C.; et al. The circadian-controlled PIF8-BBX28 module regulates petal senescence in rose flowers by governing mitochondrial ROS homeostasis at night. Plant Cell 2021, 33, 2716–2735. [Google Scholar] [CrossRef]
  28. Todaka, D.; Nakashima, K.; Maruyama, K.; Kidokoro, S.; Osakabe, Y.; Ito, Y.; Matsukura, S.; Fujita, Y.; Yoshiwara, K.; Ohme-Takagi, M.; et al. Rice phytochrome-interacting factor-like protein OsPIL1 functions as a key regulator of internode elongation and induces a morphological response to drought stress. Proc. Natl. Acad. Sci. USA 2012, 109, 15947–15952. [Google Scholar] [CrossRef] [Green Version]
  29. Gramegna, G.; Rosado, D.; Carranza, A.P.S.; Cruz, A.B.; Simon-Moya, M.; Llorente, B.; Rodriguez-Concepcion, M.; Freschi, L.; Rossi, M. Phytochrome-Interacting Factor 3 mediates light-dependent induction of tocopherol biosynthesis during tomato fruit ripening. Plant Cell Environ. 2019, 42, 1328–1339. [Google Scholar] [CrossRef]
  30. Gao, Y.; Wu, M.Q.; Zhang, M.J.; Jiang, W.; Ren, X.Y.; Liang, E.X.; Zhang, D.P.; Zhang, C.Q.; Xiao, N.; Li, Y.; et al. A maize phytochrome-interacting factors protein ZmPIF1 enhances drought tolerance by inducing stomatal closure and improves grain yield in Oryza sativa. Plant Biotechnol. J. 2018, 16, 1375–1387. [Google Scholar] [CrossRef] [Green Version]
  31. Gao, Y.; Jiang, W.; Dai, Y.; Xiao, N.; Zhang, C.Q.; Li, H.; Lu, Y.; Wu, M.Q.; Tao, X.Y.; Deng, D.X.; et al. A maize phytochrome-interacting factor 3 improves drought and salt stress tolerance in rice. Plant Mol. Biol. 2015, 87, 413–428. [Google Scholar] [CrossRef]
  32. Lee, C.M.; Thomashow, M.F. Photoperiodic regulation of the C-repeat binding factor (CBF) cold acclimation pathway and freezing tolerance in Arabidopsis thaliana. Proc. Natl. Acad. Sci. USA 2012, 109, 15054–15059. [Google Scholar] [CrossRef] [PubMed] [Green Version]
  33. Kidokoro, S.; Maruyama, K.; Nakashima, K.; Imura, Y.; Narusaka, Y.; Shinwari, Z.K.; Osakabe, Y.; Fujita, Y.; Mizoi, J.; Shinozaki, K.; et al. The Phytochrome-Interacting Factor PIF7 Negatively Regulates DREB1 Expression under Circadian Control in Arabidopsis. Plant Physiol. 2009, 151, 2046–2057. [Google Scholar] [CrossRef] [PubMed] [Green Version]
  34. Liu, Y.K.; Dang, P.Y.; Liu, L.X.; He, C.Z. Cold acclimation by the CBF-COR pathway in a changing climate: Lessons from Arabidopsis thaliana. Plant Cell Rep. 2019, 38, 511–519. [Google Scholar] [CrossRef] [PubMed] [Green Version]
  35. Zhao, H.; Bao, Y. PIF4: Integrator of light and temperature cues in plant growth. Plant Sci. 2021, 313, 111086. [Google Scholar] [CrossRef] [PubMed]
  36. Gangappa, S.N.; Berriri, S.; Kumar, S.V. PIF4 Coordinates Thermosensory Growth and Immunity in Arabidopsis. Curr. Biol. 2017, 27, 243–249. [Google Scholar] [CrossRef] [PubMed] [Green Version]
  37. Xiang, S.Y.; Wu, S.G.; Zhang, H.Y.; Mou, M.H.; Chen, Y.L.; Li, D.B.; Wang, H.P.; Chen, L.G.; Yu, D.Q. The PIFs Redundantly Control Plant Defense Response against Botrytis cinerea in Arabidopsis. Plants 2020, 9, 1246. [Google Scholar] [CrossRef] [PubMed]
  38. Ji, X.; Du, Y.X.; Li, F.; Sun, H.Z.; Zhang, J.; Li, J.Z.; Peng, T.; Xin, Z.Y.; Zhao, Q.Z. The basic helix-loop-helix transcription factor, OsPIL15, regulates grain size via directly targeting a purine permease gene OsPUP7 in rice. Plant Biotechnol. J. 2019, 17, 1527–1537. [Google Scholar] [CrossRef] [Green Version]
  39. Bovell-Benjamin, A.C. Sweet Potato: Sweet potato: A review of its past, present, and future role in human nutrition. Adv. Food Nutr. Res. 2007, 52, 1–59. [Google Scholar] [CrossRef]
  40. Behera, S.; Chauhan, V.B.S.; Pati, K.; Bansode, V.; Nedunchezhiyan, M.; Verma, A.K.; Monalisa, K.; Naik, P.K.; Naik, S.K. Biology and biotechnological aspect of sweet potato (Ipomoea batatas L.): A commercially important tuber crop. Planta 2022, 256, 40. [Google Scholar] [CrossRef]
  41. Zhai, H.; Wang, F.B.; Si, Z.Z.; Huo, J.X.; Xing, L.; An, Y.Y.; He, S.Z.; Liu, Q.C. A myo-inositol-1-phosphate synthase gene, IbMIPS1, enhances salt and drought tolerance and stem nematode resistance in transgenic sweet potato. Plant Biotechnol. J. 2016, 14, 592–602. [Google Scholar] [CrossRef] [PubMed]
  42. Zhang, H.; Gao, X.R.; Zhi, Y.H.; Li, X.; Zhang, Q.; Niu, J.B.; Wang, J.; Zhai, H.; Zhao, N.; Li, J.G.; et al. A non-tandem CCCH-type zinc-finger protein, IbC3H18, functions as a nuclear transcriptional activator and enhances abiotic stress tolerance in sweet potato. New Phytol. 2019, 223, 1918–1936. [Google Scholar] [CrossRef] [PubMed]
  43. Zhang, H.; Zhang, Q.; Zhai, H.; Gao, S.P.; Yang, L.; Wang, Z.; Xu, Y.T.; Huo, J.X.; Ren, Z.T.; Zhao, N.; et al. IbBBX24 Promotes the Jasmonic Acid Pathway and Enhances Fusarium Wilt Resistance in Sweet Potato. Plant Cell 2020, 32, 1102–1123. [Google Scholar] [CrossRef] [PubMed]
  44. Sun, S.F.; Li, X.; Gao, S.P.; Nie, N.; Zhang, H.; Yang, Y.F.; He, S.Z.; Liu, Q.C.; Zhai, H. A Novel WRKY Transcription Factor from Ipomoea trifida, ItfWRKY70, Confers Drought Tolerance in Sweet Potato. Int. J. Mol. Sci. 2022, 23, 686. [Google Scholar] [CrossRef]
  45. Xue, L.Y.; Wei, Z.H.; Zhai, H.; Xing, S.H.; Wang, Y.X.; He, S.Z.; Gao, S.P.; Zhao, N.; Zhang, H.; Liu, Q.C. The IbPYL8-IbbHLH66-IbbHLH118 complex mediates the abscisic acid-dependent drought response in sweet potato. New Phytol. 2022, 236, 2151–2171. [Google Scholar] [CrossRef]
  46. Zhao, H.Y.; Zhao, H.Q.; Hu, Y.F.; Zhang, S.S.; He, S.Z.; Zhang, H.; Zhao, N.; Liu, Q.C.; Gao, S.P.; Zhai, H. Expression of the Sweet Potato MYB Transcription Factor IbMYB48 Confers Salt and Drought Tolerance in Arabidopsis. Genes 2022, 13, 1883. [Google Scholar] [CrossRef]
  47. Gordon, T.R. Fusarium oxysporum and the Fusarium Wilt Syndrome. Annu. Rev. Phytopathol. 2017, 55, 23–39. [Google Scholar] [CrossRef]
  48. Lin, S.Q.; Yang, Z.J.; Huang, B.F.; Bi, C.Y.; Huang, X.F.; Chen, G.T.; Nijiati, N.; Chen, X.Y. Comparative proteomic analysis of the sweetpotato provides insights into response mechanisms to Fusarium oxysporum f. sp. batatas. Sci. Rep. 2020, 10, 21368. [Google Scholar] [CrossRef]
  49. Engler, J.D.; Favery, B.; Engler, G.; Abad, P. Loss of susceptibility as an alternative for nematode resistance. Curr. Opin. Biotechnol. 2005, 16, 112–117. [Google Scholar] [CrossRef]
  50. Li, Y.; Wang, Y.N.; Zhang, H.; Zhang, Q.; Zhai, H.; Liu, Q.C.; He, S.Z. The Plasma Membrane-Localized Sucrose Transporter IbSWEET10 Contributes to the Resistance of Sweet Potato to Fusarium oxysporum. Front. Plant Sci. 2017, 8, 197. [Google Scholar] [CrossRef] [Green Version]
  51. Lyu, R.Q.; Ahmed, S.; Fan, W.J.; Yang, J.; Wu, X.Y.; Zhou, W.Z.; Zhang, P.; Yuan, L.; Wang, H.X. Engineering Properties of Sweet Potato Starch for Industrial Applications by Biotechnological Techniques including Genome Editing. Int. J. Mol. Sci. 2021, 22, 9533. [Google Scholar] [CrossRef] [PubMed]
  52. Yang, J.; Moeinzadeh, M.H.; Kuhl, H.; Helmuth, J.; Xiao, P.; Haas, S.; Liu, G.L.; Zheng, J.L.; Sun, Z.; Fan, W.J.; et al. Haplotype-resolved sweet potato genome traces back its hexaploidization history. Nat. Plants 2017, 3, 696–703. [Google Scholar] [CrossRef] [PubMed]
  53. Wu, S.; Lau, K.H.; Cao, Q.H.; Hamilton, J.P.; Sun, H.H.; Zhou, C.X.; Eserman, L.; Gemenet, D.C.; Olukolu, B.A.; Wang, H.Y.; et al. Genome sequences of two diploid wild relatives of cultivated sweetpotato reveal targets for genetic improvement. Nat. Commun. 2018, 9, 4580. [Google Scholar] [CrossRef] [PubMed] [Green Version]
  54. Zhang, M.; Wang, Z.F.; Jian, S.G. Functional Characterization of Heat Shock Factor (CrHsf) Families Provide Comprehensive Insight into the Adaptive Mechanisms of Canavalia rosea (Sw.) DC. to Tropical Coral Islands. Int. J. Mol. Sci. 2022, 23, 12357. [Google Scholar] [CrossRef] [PubMed]
  55. Oh, D.H.; Dassanayake, M.; Haas, J.S.; Kropornika, A.; Wright, C.; d’Urzo, M.P.; Hong, H.; Ali, S.; Hernandez, A.; Lambert, G.M.; et al. Genome structures and halophyte-specific gene expression of the extremophile Thellungiella parvula in comparison with Thellungiella salsuginea (Thellungiella halophila) and Arabidopsis. Plant Physiol. 2010, 154, 1040–1052. [Google Scholar] [CrossRef] [PubMed] [Green Version]
  56. Chu, Z.N.; Wang, X.; Li, Y.; Yu, H.Y.; Li, J.H.; Lu, Y.G.; Li, H.X.; Ouyang, B. Genomic Organization, Phylogenetic and Expression Analysis of the B-BOX Gene Family in Tomato. Front. Plant Sci. 2016, 7, 1552. [Google Scholar] [CrossRef] [PubMed] [Green Version]
  57. Koen, E.; Trapet, P.; Brule, D.; Kulik, A.; Klinguer, A.; Atauri-Miranda, L.; Meunier-Prest, R.; Boni, G.; Glauser, G.; Mauch-Mani, B.; et al. beta-Aminobutyric acid (BABA)-induced resistance in Arabidopsis thaliana: Link with iron homeostasis. Mol. Plant Microbe. Interact. 2014, 27, 1226–1240. [Google Scholar] [CrossRef] [Green Version]
  58. Meier, S.; Bastian, R.; Donaldson, L.; Murray, S.; Bajic, V.; Gehring, C. Co-expression and promoter content analyses assign a role in biotic and abiotic stress responses to plant natriuretic peptides. BMC Plant Biol. 2008, 8, 24. [Google Scholar] [CrossRef] [Green Version]
  59. Wagner, A. Distributed robustness versus redundancy as causes of mutational robustness. Bioessays 2005, 27, 176–188. [Google Scholar] [CrossRef]
  60. Fernandez-Pozo, N.; Menda, N.; Edwards, J.D.; Saha, S.; Tecle, I.Y.; Strickler, S.R.; Bombarely, A.; Fisher-York, T.; Pujar, A.; Foerster, H.; et al. The Sol Genomics Network (SGN)-from genotype to phenotype to breeding. Nucleic. Acids Res. 2015, 43, D1036–D1041. [Google Scholar] [CrossRef]
  61. Kaltenegger, E.; Eich, E.; Ober, D. Evolution of Homospermidine Synthase in the Convolvulaceae: A Story of Gene Duplication, Gene Loss, and Periods of Various Selection Pressures. Plant Cell 2013, 25, 1213–1227. [Google Scholar] [CrossRef] [PubMed] [Green Version]
  62. Gao, Y.; Wu, M.Q.; Zhang, M.J.; Jiang, W.; Liang, E.X.; Zhang, D.P.; Zhang, C.Q.; Xiao, N.; Chen, J.M. Roles of a maize phytochrome-interacting factors protein ZmPIF3 in regulation of drought stress responses by controlling stomatal closure in transgenic rice without yield penalty. Plant Mol. Biol. 2018, 97, 311–323. [Google Scholar] [CrossRef] [PubMed]
  63. Rosado, D.; Trench, B.; Bianchetti, R.; Zuccarelli, R.; Alves, F.R.R.; Purgatto, E.; Floh, E.I.S.; Nogueira, F.T.S.; Freschi, L.; Rossi, M. Downregulation of Phytochrome-Interacting Factor 4 Influences Plant Development and Fruit Production. Plant Physiol. 2019, 181, 1360–1370. [Google Scholar] [CrossRef] [PubMed]
  64. Yang, D.L.; Yao, J.; Mei, C.S.; Tong, X.H.; Zeng, L.J.; Li, Q.; Xiao, L.T.; Sun, T.P.; Li, J.G.; Deng, X.W.; et al. Plant hormone jasmonate prioritizes defense over growth by interfering with gibberellin signaling cascade. Proc. Natl. Acad. Sci. USA 2012, 109, E1192–E1200. [Google Scholar] [CrossRef] [PubMed] [Green Version]
  65. Verma, V.; Ravindran, P.; Kumar, P.P. Plant hormone-mediated regulation of stress responses. BMC Plant Biol. 2016, 16, 86. [Google Scholar] [CrossRef] [Green Version]
  66. Gabriele, S.; Rizza, A.; Martone, J.; Circelli, P.; Costantino, P.; Vittorioso, P. The Dof protein DAG1 mediates PIL5 activity on seed germination by negatively regulating GA biosynthetic gene AtGA3ox1. Plant J. 2010, 61, 312–323. [Google Scholar] [CrossRef]
  67. Kim, J.; Kang, H.; Park, J.; Kim, W.; Yoo, J.; Lee, N.; Kim, J.; Yoon, T.Y.; Choi, G. PIF1-Interacting Transcription Factors and Their Binding Sequence Elements Determine the in Vivo Targeting Sites of PIF1. Plant Cell 2016, 28, 1388–1405. [Google Scholar] [CrossRef] [PubMed] [Green Version]
  68. Nozue, K.; Harmer, S.L.; Maloof, J.N. Genomic Analysis of Circadian Clock-, Light-, and Growth-Correlated Genes Reveals Phytochrome-Interacting Factor5 as a Modulator of Auxin Signaling in Arabidopsis. Plant Physiol. 2011, 156, 357–372. [Google Scholar] [CrossRef] [Green Version]
  69. Mo, W.; Tang, W.; Du, Y.; Jing, Y.; Bu, Q.; Lin, R. Phytochrome-Interacting Factor-Like14 and Slender Rice1 Interaction Controls Seedling Growth under Salt Stress. Plant Physiol. 2020, 184, 506–517. [Google Scholar] [CrossRef]
  70. Fiorucci, A.S.; Galvao, V.C.; Ince, Y.C.; Boccaccini, A.; Goyal, A.; Petrolati, L.A.; Trevisan, M.; Fankhauser, C. Phytochrome Interacting Factor 7 is important for early responses to elevated temperature in Arabidopsis seedlings. New Phytol. 2020, 226, 50–58. [Google Scholar] [CrossRef] [Green Version]
  71. Bertioli, D.J.; Cannon, S.B.; Froenicke, L.; Huang, G.D.; Farmer, A.D.; Cannon, E.K.S.; Liu, X.; Gao, D.Y.; Clevenger, J.; Dash, S.; et al. The genome sequences of Arachis duranensis and Arachis ipaensis, the diploid ancestors of cultivated peanut. Nat. Genet. 2016, 48, 438–446. [Google Scholar] [CrossRef] [PubMed]
  72. Praz, C.R.; Bourras, S.; Zeng, F.; Sanchez-Martin, J.; Menardo, F.; Xue, M.; Yang, L.; Roffler, S.; Boni, R.; Herren, G.; et al. AvrPm2 encodes an RNase-like avirulence effector which is conserved in the two different specialized forms of wheat and rye powdery mildew fungus (vol 213, pg 1301, 2017). New Phytol. 2019, 222, 2038. [Google Scholar] [CrossRef] [Green Version]
  73. Cao, A.H.; Xing, L.P.; Wang, X.Y.; Yang, X.M.; Wang, W.; Sun, Y.L.; Qian, C.; Ni, J.L.; Chen, Y.P.; Liu, D.J.; et al. Serine/threonine kinase gene Stpk-V, a key member of powdery mildew resistance gene Pm21, confers powdery mildew resistance in wheat. Proc. Natl. Acad. Sci. USA 2011, 108, 7727–7732. [Google Scholar] [CrossRef] [PubMed] [Green Version]
  74. Reuscher, S.; Furuta, T.; Bessho-Uehara, K.; Cosi, M.; Jena, K.K.; Toyoda, A.; Fujiyama, A.; Kurata, N.; Ashikari, M. Assembling the genome of the African wild rice Oryza longistaminata by exploiting synteny in closely related Oryza species. Commun. Biol. 2018, 1, 162. [Google Scholar] [CrossRef] [Green Version]
  75. Li, J.H.; Chen, C.R.; Wei, J.J.; Pan, Y.; Su, C.G.; Zhang, X.G. SpPKE1, a Multiple Stress-Responsive Gene Confers Salt Tolerance in Tomato and Tobacco. Int. J. Mol. Sci. 2019, 20, 2478. [Google Scholar] [CrossRef] [Green Version]
  76. Si, Z.Z.; Wang, L.J.; Qiao, Y.K.; Roychowdhury, R.; Ji, Z.X.; Zhang, K.; Han, J.L. Genome-wide comparative analysis of the nucleotide-binding site-encoding genes in four Ipomoea species. Front. Plant Sci. 2022, 13, 723. [Google Scholar] [CrossRef]
  77. Zhou, J.M.; Zhang, Y.L. Plant Immunity: Danger Perception and Signaling. Cell 2020, 181, 978–989. [Google Scholar] [CrossRef]
  78. Li, Q.; Zhou, L.Y.; Chen, Y.N.; Xiao, N.; Zhang, D.P.; Zhang, M.J.; Wang, W.G.; Zhang, C.Q.; Zhang, A.N.; Li, H.; et al. Phytochrome interacting factor regulates stomatal aperture by coordinating red light and abscisic acid. Plant Cell 2022, 34, 4293–4312. [Google Scholar] [CrossRef]
  79. Jiang, B.C.; Shi, Y.T.; Peng, Y.; Jia, Y.X.; Yan, Y.; Dong, X.J.; Li, H.; Dong, J.; Li, J.G.; Gong, Z.Z.; et al. Cold-Induced CBF-PIF3 Interaction Enhances Freezing Tolerance by Stabilizing the phyB Thermosensor in Arabidopsis. Mol. Plant 2020, 13, 894–906. [Google Scholar] [CrossRef]
  80. Thines, B.C.; Youn, Y.W.; Duarte, M.I.; Harmon, F.G. The time of day effects of warm temperature on flowering time involve PIF4 and PIF5. J. Exp. Bot. 2014, 65, 1141–1151. [Google Scholar] [CrossRef]
  81. Basu, S.; Ramegowda, V.; Kumar, A.; Pereira, A. Plant adaptation to drought stress. F1000Research 2016, 5, 1554. [Google Scholar] [CrossRef] [PubMed]
  82. Moore, K.; Roberts, L.J. Measurement of lipid peroxidation. Curr. Protoc. Toxicol. 1998, 28, 659–671. [Google Scholar] [CrossRef]
  83. Farmer, E.E.; Mueller, M.J. ROS-Mediated Lipid Peroxidation and RES-Activated Signaling. Annu. Rev. Plant Biol. 2013, 64, 429–450. [Google Scholar] [CrossRef] [PubMed]
  84. Furlan, A.L.; Bianucci, E.; Giordano, W.; Castro, S.; Becker, D.F. Proline metabolic dynamics and implications in drought tolerance of peanut plants. Plant Physiol. Biochem. 2020, 151, 566–578. [Google Scholar] [CrossRef] [PubMed]
  85. Blokhina, O.; Virolainen, E.; Fagerstedt, K.V. Antioxidants, oxidative damage and oxygen deprivation stress: A review. Ann. Bot. 2003, 91, 179–194. [Google Scholar] [CrossRef] [PubMed] [Green Version]
  86. Liu, Q.; Kasuga, M.; Sakuma, Y.; Abe, H.; Miura, S.; Yamaguchi-Shinozaki, K.; Shinozaki, K. Two transcription factors, DREB1 and DREB2, with an EREBP/AP2 DNA binding domain separate two cellular signal transduction pathways in drought- and low-temperature-responsive gene expression, respectively, in Arabidopsis. Plant Cell 1998, 10, 1391–1406. [Google Scholar] [CrossRef] [PubMed] [Green Version]
  87. Sakuma, Y.; Maruyama, K.; Osakabe, Y.; Qin, F.; Seki, M.; Shinozaki, K.; Yamaguchi-Shinozaki, K. Functional analysis of an Arabidopsis transcription factor, DREB2A, involved in drought-responsive gene expression. Plant Cell 2006, 18, 1292–1309. [Google Scholar] [CrossRef] [Green Version]
  88. Zhou, Y.B.; Chen, M.; Guo, J.K.; Wang, Y.X.; Min, D.H.; Jiang, Q.Y.; Ji, H.T.; Huang, C.Y.; Wei, W.; Xu, H.J.; et al. Overexpression of soybean DREB1 enhances drought stress tolerance of transgenic wheat in the field. J. Exp. Bot. 2020, 71, 1842–1857. [Google Scholar] [CrossRef]
  89. Sudisha, J.; Sharathchandra, R.G.; Amruthesh, K.N.; Kumar, A.; Shetty, H.S. Pathogenesis Related Proteins in Plant Defense Response. In Plant Defence: Biological Control; Progress in Biological Control; Springer: Dordrecht, The Netherlands, 2012; Volume 12, pp. 379–403. [Google Scholar] [CrossRef]
  90. Ghorbel, M.; Zribi, I.; Missaoui, K.; Drira-Fakhfekh, M.; Azzouzi, B.; Brini, F. Differential regulation of the durum wheat Pathogenesis-related protein (PR1) by Calmodulin TdCaM1.3 protein. Mol. Biol. Rep. 2021, 48, 347–362. [Google Scholar] [CrossRef]
  91. Coll, N.S.; Epple, P.; Dangl, J.L. Programmed cell death in the plant immune system. Cell Death Differ. 2011, 18, 1247–1256. [Google Scholar] [CrossRef] [Green Version]
  92. Czernic, P.; Huang, H.C.; Marco, Y. Characterization of hsr201 and hsr515, two tobacco genes preferentially expressed during the hypersensitive reaction provoked by phytopathogenic bacteria. Plant Mol. Biol. 1996, 31, 255–265. [Google Scholar] [CrossRef] [PubMed]
  93. Chen, C.; Chen, H.; Zhang, Y.; Thomas, H.R.; Frank, M.H.; He, Y.; Xia, R. TBtools: An Integrative Toolkit Developed for Interactive Analyses of Big Biological Data. Mol. Plant 2020, 13, 1194–1202. [Google Scholar] [CrossRef] [PubMed]
  94. Kumar, S.; Stecher, G.; Li, M.; Knyaz, C.; Tamura, K. MEGA X: Molecular Evolutionary Genetics Analysis across Computing Platforms. Mol. Biol. Evol. 2018, 35, 1547–1549. [Google Scholar] [CrossRef]
  95. Kohl, M.; Wiese, S.; Warscheid, B. Cytoscape: Software for Visualization and Analysis of Biological Networks. Methods Mol. Biol. 2011, 696, 291–303. [Google Scholar] [CrossRef] [PubMed]
  96. Sun, H.Y.; Mei, J.Z.; Zhao, W.W.; Hou, W.Q.; Zhang, Y.; Xu, T.; Wu, S.Y.; Zhang, L. Phylogenetic Analysis of the SQUAMOSA Promoter-Binding Protein-Like Genes in Four Ipomoea Species and Expression Profiling of the IbSPLs during Storage Root Development in Sweet Potato (Ipomoea batatas). Front. Plant Sci. 2022, 12, 3291. [Google Scholar] [CrossRef] [PubMed]
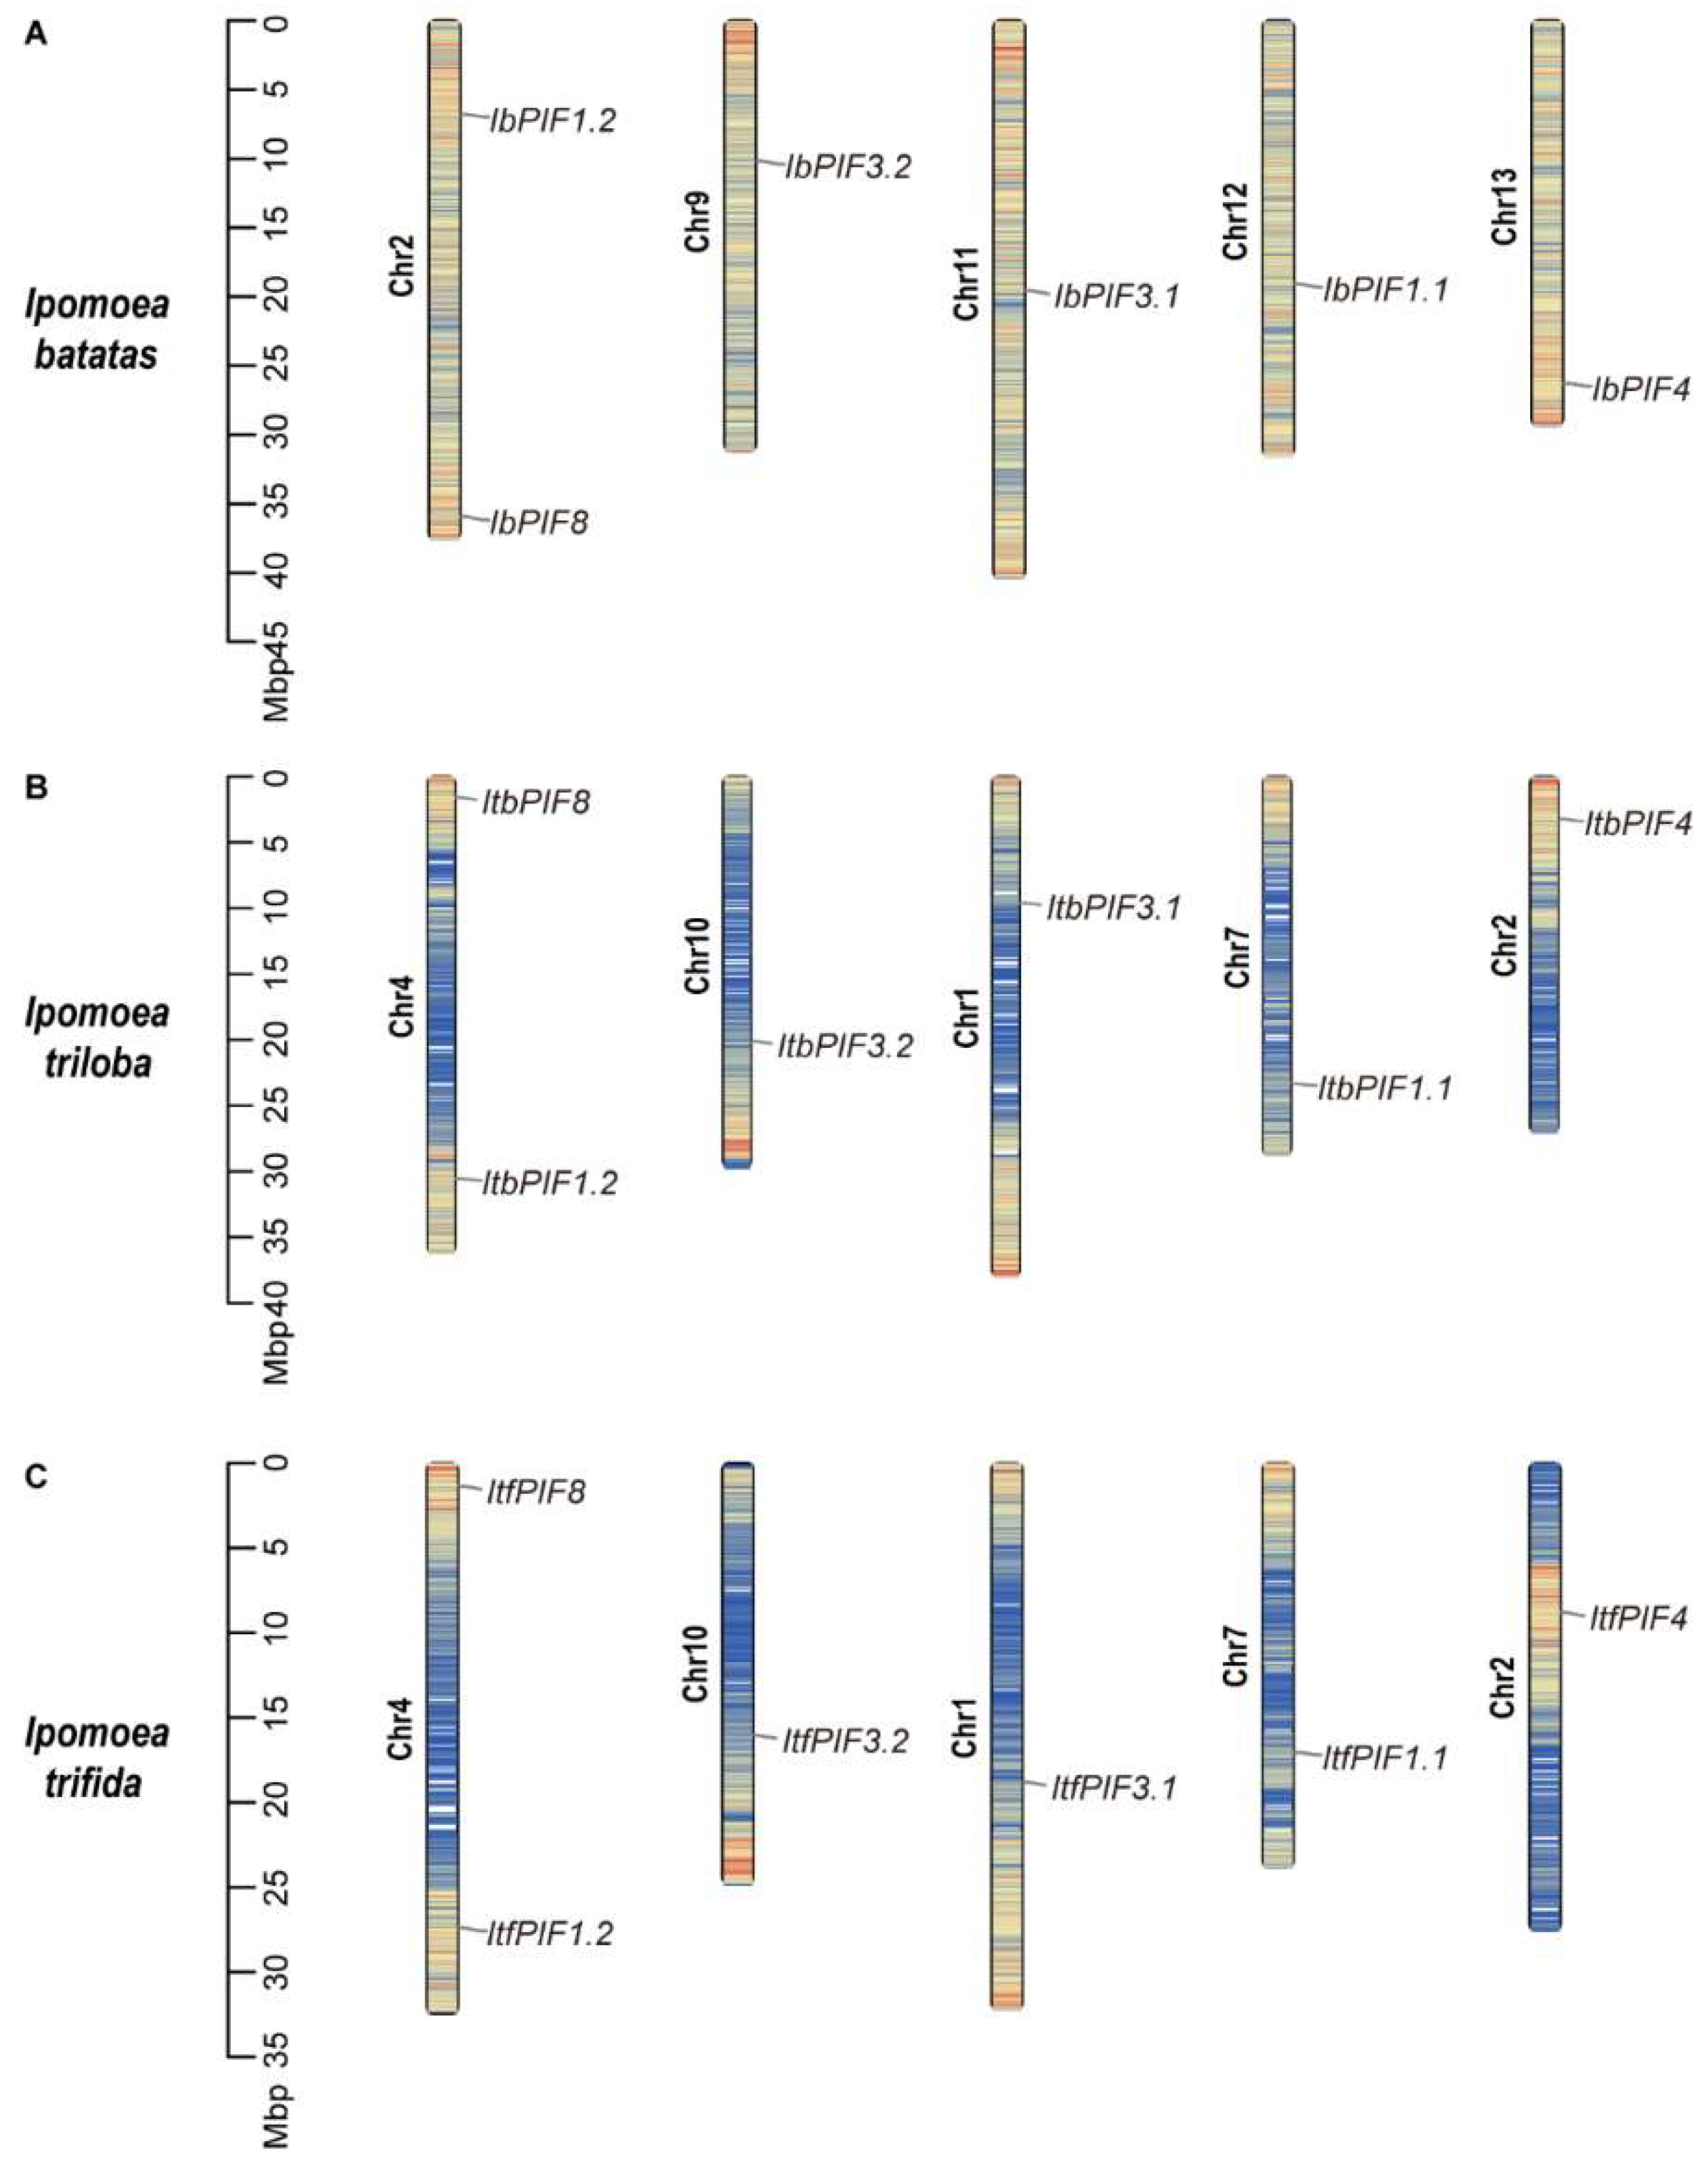
Figure 1. Chromosomal location and distribution of PIF genes in (A) I. batatas; (B) I. triloba; and (C) I. trifida. The bars represent chromosomes, the chromosome numbers are displayed on the left side, and the gene names are displayed on the right side. The relative chromosomal location of each PIF gene is marked with the black line at the right side.
Ijms 24 04092 g001
Figure 2. Phylogenetic analysis of the PIF families in A. thaliana, C. sinensis, D. carota, I. batatas, I. triloba, I. trifida, M. domestica, O. sativa, S. lycopersicum, S. tuberosum, and V. vinifera. A total of 70 PIFs were divided into four groups (groups I–IV), according to the evolutionary distance. The blue circles represent the eight AtPIFs in A. thaliana. The pink squares represent the seven CsPIFs in C. sinensis. The blue stars represent the five DcPIFs in D. carota. The red rhombus represents the six IbPIFs in I. batatas. The purple circles represent the six ItbPIFs in I. triloba. The indigotin squares represent the six ItfPIFs in I. trifida. The dark green stars represent the seven MdPIFs in M. domestica. The yellow rhombus represents the six OsPIFs in O. sativa. The orange circles represent the eight SlPIFs in S. lycopersicum. The brown squares represent the seven StPIFs in S. tuberosum. The light green stars represent the four VvPIFs in V. vinifera.
Ijms 24 04092 g002
Figure 3. The phylogenetic tree showing that PIFs are distributed into four groups on the left. The red circle represents the IbPIFs. (A) Conserved domain structure of PIFs in A. thaliana, I. batatas, I. triloba, and I. trifida. The yellow, green, and pink boxes represent the APB domain, APA domain, and bHLH domain, respectively; and (B) exon–intron structure of PIFs in A. thaliana, I. batatas, I. triloba, and I. trifida. The yellow boxes, green boxes, and grey lines represent the UTR, exons, and introns, respectively.
Ijms 24 04092 g003
Figure 4. Analysis of cis-elements of IbPIFs in I. batatas, I. triloba, and I. trifida. The degree of red color represents the number of cis-elements upstream of the PIFs.
Ijms 24 04092 g004
Figure 5. Functional interaction networks of IbPIFs in I. batatas according to orthologues in A. thaliana. Network nodes represent proteins, and lines represent protein–protein associations.
Ijms 24 04092 g005
Figure 6. Gene expression patterns of IbPIFs in different tissues (shoot, young leaf, mature leaf, stem, fibrous root, initial tuberous root, expanding tuberous root, and mature tuberous root) of (A) Yan252 and (B) Xuzi3, as determined by RNA-seq. Log2(FPKM + 1) is shown in the boxes. (C) Gene expression patterns of IbPIFs in shoot, petiole, leaf, stem, fibrous root, and mature tuberous root of I. batatas. The values were determined by qRT-PCR from three biological replicates consisting of pools of three plants, and the results were analyzed using the comparative CT method. The expression at 0 h in each treatment was considered “1”. The fold change is shown in the boxes. Different lowercase letters indicate a significant difference of each IbPIFs at p < 0.05 based on Student’s t-test.
Ijms 24 04092 g006
Figure 7. Gene expression patterns of IbPIFs in response to different phytohormones in I. batatas: (A) ABA; (B) GA; (C) IAA; (D) MeJA; and (E) SA. The values were determined by qRT-PCR from three biological replicates consisting of pools of three plants, and the results were analyzed using the comparative CT method. The expression at 0 h in each treatment was considered “1”. The fold change is shown in the boxes. Different lowercase letters indicate a significant difference of each IbPIFs at p < 0.05 based on Student’s t-test.
Ijms 24 04092 g007
Figure 8. Gene expression patterns of IbPIFs of I. batatas in response to abiotic stresses: (A) NaCl; (B) PEG; (C) H2O2; (D) cold; and (E) heat. The values were determined by qRT-PCR from three biological replicates consisting of pools of three plants, and the results were analyzed using the comparative CT method. The expression at 0 h in each treatment was considered “1”. The fold change is shown in the boxes. Different lowercase letters indicate a significant difference of each IbPIFs at p < 0.05 based on Student’s t-test.
Ijms 24 04092 g008
Figure 9. Gene expression patterns of IbPIFs of I. batatas in response to biotic stresses: (A) Fob infection; and (B) stem nematode infection. The values were determined by qRT-PCR from three biological replicates consisting of pools of three plants, and the results were analyzed using the comparative CT method. The expression at 0 h in each treatment was considered “1”. The fold change is shown in the boxes. Different lowercase letters indicate a significant difference of each IbPIFs at p < 0.05 based on Student’s t–test.
Ijms 24 04092 g009
Figure 10. Drought tolerance identification of WT and IbPIF3.1-OE transgenic tobacco plants cultured on MS medium without (control) or with 20% PEG6000 for 4 weeks: (A) phenotypes; (B) root length; (C) fresh weight (scale bar = 2.5 cm); (D) MDA content; and (E) proline content in the leaves of plants after 4 weeks of treatment. Transcript levels of (F) NtPOD; (G) NtDREB1A; (H) NtDREB1B; and (I) NtDREB1D in the leaves of plants after 4 weeks of treatment. The transcript levels of the genes in WT without treatment control were set to 1. The values were determined by qRT-PCR from three biological replicates consisting of pools of three leaves. The error bars indicate ± SD (n = 3). *, p < 0.05; **, p < 0.01; Student’s t–test.
Ijms 24 04092 g010
Figure 11. Development of plant disease symptoms in WT and IbPIF3.2-OE transgenic tobacco plants after Fob inoculation. W38 and IbPIF3.1-OE transgenic plants were inoculated with Fob spores at a density of 1.5 × 10⁷ mL−1 for 11 d: (A,B) phenotypes; (C) development of disease symptoms in leaves of WT and IbPIF3.1-OE transgenic tobacco lines after Fob inoculation (scale bar = 2.5 cm); (D) the number of diseased leaves in WT and IbPIF3.1-OE transgenic tobacco lines at 11 d; and transcript levels of (E) NtPR1a; (F) NtHSR201; and (G) NtHSR515 in WT and IbPIF3.1-OE transgenic tobacco lines. The transcript levels of genes in WT before inoculation were set to 1. The values were determined by qRT-PCR from three biological replicates consisting of pools of three leaves. The error bars indicate ± SD (n = 3). **, p < 0.01; Student’s t–test.
Ijms 24 04092 g011
Table 1. Characterization of IbPIFs in sweet potato.
Gene IDGeneCDSProteinGenomicMWpIInstabilityGravySubcellularBest
Hits
Arabidopsis
Name(bp)(aa)(bp)(kDa)Gene ID
Ib12g49455IbPIF1.11635544802559.5345.7962.27−0.583nucleusAtPIF1At2g20180
Ib02g5235IbPIF1.21365454327548.7285.2955.99−0.508nucleusAtPIF1At2g20180
Ib11g44153IbPIF3.1209769867586635.9854.32−0.58nucleusAtPIF3At1g09530
Ib09g35474IbPIF3.2208569448256577.1756.32−0.581nucleusAtPIF3At1g09530
Ib13g54841IbPIF42661886867197.0316.5843.27−0.518nucleusAtPIF4At2g43010
Ib02g9143IbPIF81395464450049.176.5554.59−0.545nucleusAtPIF8At4g00050
CDS, coding sequence; MW, molecular weight; pI, isoelectric point.
Disclaimer/Publisher’s Note: The statements, opinions and data contained in all publications are solely those of the individual author(s) and contributor(s) and not of MDPI and/or the editor(s). MDPI and/or the editor(s) disclaim responsibility for any injury to people or property resulting from any ideas, methods, instructions or products referred to in the content.