Article

Genome-Wide Identification and Expression Analysis of the Ammonium Transporter Family Genes in Soybean

1
National Key Laboratory of Crop Genetic Improvement, College of Plant Science and Technology, Huazhong Agricultural University, Wuhan 430070, China
2
Hubei Hongshan Laboratory, College of Plant Science and Technology, Huazhong Agricultural University, Wuhan 430070, China
*
Authors to whom correspondence should be addressed.
Int. J. Mol. Sci. 2023, 24(4), 3991; https://doi.org/10.3390/ijms24043991
Submission received: 15 January 2023 / Revised: 4 February 2023 / Accepted: 14 February 2023 / Published: 16 February 2023
(This article belongs to the Special Issue Genetics and Novel Techniques for Soybean Yield Enhancement)

Abstract

:
Ammonium transporters (AMTs) are responsible for ammonium absorption and utilization in plants. As a high-nitrogen-demand crop and a legume, soybean can also obtain ammonium from symbiotic root nodules in which nitrogen-fixing rhizobia convert atmospheric nitrogen (N2) into ammonium. Although increasing evidence implicates vital roles of ammonium transport in soybean, no systematic analyses of AMTs in soybean (named GmAMTs) or functional analyses of GmAMTs are available. In this study, we aimed to identify all GmAMT family genes and gain a better understanding of the characteristics of GmAMT genes in soybean. Here, due to the improved genome assembly and annotation of soybean, we tried to generate a phylogenetic tree of 16 GmAMTs based on new information. Consistent with reported data, GmAMT family members can be divided into two subfamilies of GmAMT1 (6 genes) and GmAMT2 (10 genes). Interestingly, unlike Arabidopsis, which has only one AMT2, soybean has substantially increased the number of GmAMT2s, suggesting enhanced demand for ammonium transport. These genes were distributed on nine chromosomes, of which GmAMT1.3, GmAMT1.4, and GmAMT1.5 were three tandem repeat genes. The gene structures and conserved protein motifs of the GmAMT1 and GmAMT2 subfamilies were different. All the GmAMTs were membrane proteins with varying numbers of transmembrane domains ranging from 4 to 11. Promoter analysis found that these GmAMT genes have phytohormone-, circadian control-, and organ expression-related cis-elements in their promoters, and notably, there were nodulation-specific and nitrogen-responsive elements in the promoters of the GmAMT1 and GmAMT2 genes. Further expression data showed that these GmAMT family genes exhibited different spatiotemporal expression patterns across tissues and organs. In addition, GmAMT1.1, GmAMT1.2, GmAMT2.2, and GmAMT2.3 were responsive to nitrogen treatment, while GmAMT1.2, GmAMT1.3, GmAMT1.4, GmAMT1.5, GmAMT1.6, GmAMT2.1, GmAMT2.2, GmAMT2.3, GmAMT3.1, and GmAMT4.6 showed circadian rhythms in transcription. RT-qPCR validated the expression patterns of GmAMTs in response to different forms of nitrogen and exogenous ABA treatments. Gene expression analysis also confirmed that GmAMTs are regulated by key nodulation gene GmNINa, indicating a role of GmAMTs in symbiosis. Together, these data indicate that GmAMTs may differentially and/or redundantly regulate ammonium transport during plant development and in response to environmental factors. These findings provide a basis for future research on the functions of GmAMTs and the mechanisms through which GmAMTs regulate ammonium metabolism and nodulation in soybean.

1. Introduction

Nitrogen is an essential nutrient element for plant growth and development, and an important component of amino acids and nucleic acids. Ammonium and nitrate are two main nitrogen sources for plants in soils. As sessile organisms, plants have evolved a variety of adaptive mechanisms that enable them to respond to their internal nitrogen status and external nitrogen availability [1]. Plants prefer to take up ammonium nitrogen as a nutrient source in the presence of both ammonium and nitrate or in ammonium-rich flooded or acidic soils [2,3,4]. Ammonium is sensed by plants, and a signal transduction cascade is then activated to link nutrient availability with the proper plant response. The ammonium transporter is an important carrier for plants to absorb and utilize ammonium, and can balance the concentrations of ammonium in plants by regulating ammonium uptake from the environments [5] and mediating the transport of ammonium in the organs and tissues of plants [6,7]. The first plant ammonium transporter (AMT) was identified in Arabidopsis and could functionally complement a yeast mutant defective in ammonium uptake [8]. The ammonium transporters in plants are mainly divided into two subfamilies: AMT1 and AMT2. AMT2 subfamily members are less homologous to the members of the AMT1 subfamily, but they have high homology with AmtB in Escherichia coli and Mep in yeast, belonging to the MEP subfamily [9,10]. Plant AMT proteins are mainly localized on the cell membrane and generally have 11–12 transmembrane domains [11]. According to kinetic experiments, AMTs in plants can be divided into high- and low- affinity ammonium transporters [12,13,14], which tightly and dynamically regulate ammonium uptake in plant growth and development.
The concentrations of ammonium in soils are generally less than 1 mM [3]. Thus, the absorption of ammonium nitrogen by plants occurs mainly through a high-affinity ammonium transport system. In Arabidopsis, all six AMTs (5 in the AMT1 subfamily and 1 in the AMT2 subfamily) are high-affinity ammonium transporters [12,15]. Among them, AtAMT1.1, AtAMT1.2, AtAMT1.3, and AtAMT1.5 are mainly expressed in roots, including root hairs, and their expression is induced by low nitrogen [12,13,16,17]. Loss-of-function mutations in AMT1.1, AMT1.2 and AMT1.3 reduced the ammonium uptake capacity by 90% in Arabidopsis roots, demonstrating that these AMT1s are the main uptake system for plants to obtain ammonium nitrogen from the environment [12]. In contrast, AMT2 is not involved in the acquisition of ammonium nitrogen from soil by Arabidopsis plants. Upon ammonium treatment, AMT2 is mainly expressed in the stele sheath and participates in the transport of ammonium from roots to shoots [6]. AMT expression is also detected in leaves, petioles, and stems in various plants, such as tomato (Solanum lycopersicum L.) [18], rice (Oryza sativa L.) [19], maize (Zea mays L.) [20], and poplar (Populus L.) [21], and losses of function in some of these genes cause great reductions in aboveground biomass [20,22,23]. It is apparent that AMTs are differentially expressed and participate in ammonium transport therein.
In addition to the spatiotemporal expression and action of these AMTs, some AMT genes appear to be regulated by the circadian clock. For example, AtAMT1.3 showed a typical type of diurnal change pattern. The expression of AtAMT1.3 increased significantly, and the absorption of ammonium peaked at the end of daytime light, while the absorption of ammonium gradually decreased with decreasing light intensity [2]. Rhythm regulation was also observed for LeAMT1.2 and LeAMT1.3 in tomato [18]. Nutrient uptake and metabolism are regulated by the biological clock [24]. These particular AMTs may be responsible for rhythmic changes in ammonium uptake and remobilization and assimilation during day and night. Notably, AMTs are also involved in other biological processes, such as plant–microbe interactions. For example, AMT1.1, AMT1.3, and AMT2.3 are involved in plant responses to pathogens in rice and wheat [25,26,27]. Furthermore, there is now increasing evidence that AMTs are involved in plant–microbe symbiosis. It has been reported that LjAMT2.1 and LjAMT2.2 in Lotus japonicus and MtAMT2.3 in Medicago truncatula may participate in ammonium transport from symbiotic host plants to nitrogen-fixing rhizobia and arbuscular mycorrhizae (AM) [28,29,30]. Therefore, AMTs play essential roles in helping plants acquire sufficient ammonium for plant development and environmental adaptation.
Soybean (Glycine max) is the most important crop in the world, with high quality and quantity of plant proteins and oils. Soybeans can interact with rhizobia to form root nodules in which rhizobia convert N2 in the air into ammonium to obtain most of the nitrogen for plant growth [31]. They are also able to uptake ammonium and nitrate from soils to meet high nitrogen requirements [32]. However, the understanding of ammonium sensing, transport, and assimilation is limited. GmSAT1 (symbiotic ammonium transporter 1), which was originally identified as an ammonium transporter [33], is actually a membrane-localized basic helix-loop-helix (bHLH) transcription factor that indirectly regulates ammonium transport in nodules [34]. To date, only one study has shown that five GmAMT genes (GmAMT1.4, GmAMT3.1, GmAMT4.1, GmAMT4.3, and GmAMT4.4) were induced by AM in soybean roots, and among them GmAMT4.1 may be involved in the transport of ammonium between AM and host cells because of its specific expression and localization in the branch region of periarbuscular membranes [35]. Although soybean has a more complex regulation of ammonium acquisition and assimilation than staple crops, we know very little about ammonium sensing, uptake, and remobilization, which are the first critical steps in ammonium metabolism. There has been no systematic research on the GmAMT family genes; in particular, to date, none of the GmAMT genes have been functionally characterized in soybean.
In this study, we conducted a systematic analysis of ammonium transporter proteins in soybean. In addition to the conserved GmAMTs, soybean also has legume-specific AMTs. We also analyzed the structures of GmAMT genes and proteins and provided detailed information on cis elements in these GmAMT promoters. Furthermore, we presented the spatiotemporal expression patterns of GmAMT genes and their expression in response to internal and external factors. Our results provide a theoretical basis for future in-depth studies on the function and regulatory mechanisms by which GmAMTs regulate ammonium uptake and metabolism to enhance the yield and quality of soybean.

2. Results

2.1. Identification of GmAMT Family Proteins in Soybean

Due to the improved genome assembly and annotation, to identify the AMT family proteins in soybean, we performed a BLAST search for the conserved domain of Ammonium_transp in the Pfam database and identified a total of 16 AMTs (GmAMTs) in the soybean genome, which is consistent with a previous study [35]. However, the amino acid sequences of some of GmAMT family proteins, including GmAMT1.6, GmAMT4.1, GmAMT4.2, GmAMT4.4, GmAMT4.5, and GmAMT4.6, appeared to be different from those in the old version of the JGI G. max genome database (Glyma1.0). To gain a better understanding of the evolution of these GmAMTs, we also retrieved 6 AMTs from Arabidopsis thaliana, 12 from Oryza sativa (rice), 11 from Medicago truncatula, and 8 from Lotus japonicus (Supplementary Data 1). As shown in Figure S1, the phylogenetic relationship of AMT members in different species appeared to be consistent with that of reported data [35]. Phylogenetic tree analysis revealed that these 53 plant AMTs were divided into two subfamilies: 22 and 31 in the AMT1 and AMT2 subfamilies, respectively. The numbers of AMT1 proteins in these legumes and nonlegume plants did not vary greatly, ranging from three in Medicago truncatula and rice to five in Arabidopsis thaliana and Lotus japonicus, and six in soybean. Interestingly, only a single copy of AMT2 has remained in Arabidopsis; however, the numbers of AMT2s have increased substantially from 5 to 10 in the rest of the plant species, with soybean encoding the most (Figure S1). Among these legume and nonlegume plants, soybean has evolved more AMTs, especially GmAMT2s, suggesting that soybean may have evolved a more complex ammonium transport system to meet the needs of extensive intra- and intercellular ammonium transport in plants.
Further analysis revealed that the AMTs in each subfamily can be divided into different clades with varied numbers in different species (Figure S1). There are four clades (I–IV) for AMT1 proteins, and four clades (V–VIII) for AMT2s. Some clades have AMTs from only one species (I from Medicago truncatula), while others contain AMTs from multiple plants. Among them, clades IV and VIII have one or several AMT1(s) and AMT2(s) from all five species, respectively. For soybean, six GmAMT1 proteins fell mainly into II (GmAMT1.3, GmAMT1.4, GmAMT1.5, and GmAMT1.6) and IV clusters (GmAMT1.1 and GmAMT1.2), while 10 GmAMT2s fell into the clades V (GmAMT4.4), VI (GmAMT4.1, GmAMT4.2, GmAMT4.3, GmAMT4.5, and GmAMT4.6), VII (GmAMT3.1), and VIII (GmAMT2.1 to GmAMT2.3). It is worth noting that clade V contains only AMT2s from legumes, suggesting that these AMT2s may have divergent structures and functions.

2.2. Characteristics of GmAMT Proteins

As these GmAMTs belong to different subfamilies and clades, we hypothesized that these proteins may have varied protein sequences and structures. Indeed, the lengths of these GmAMT proteins varied from 218 aa (GmAMT1.6) to 525 aa (GmAMT1.5), with the molecular weights from 23.315 kDa to 56.108 kDa. These GmAMTs also had different predicted protein isoelectric points (PIs). The PI values of GmAMT1.4, GmAMT1.6, GmAMT2.2, and GmAMT2.3 were greater than 8; the PI values of GmAMT4.1, GmAMT4.5 and GmAMT4.6 were less than 6; and the PI values of other AMT proteins were between 6.25 and 7.71 (Table S1).
We further analyzed the structures of GmAMT proteins, including the conserved motifs and conserved domain (Ammonium_transp) of GmAMTs according to the evolutionary relationships (Figure 1). First, we found a total of 10 conserved motifs of AMTs in these GmAMTs (Figure 1A,B and Figure S2). Among them, motifs 1, 2, 3, 4, 5, 7, 8, and 9 belong to the ammonium_transp domain, and motifs 10 and 6 belong to the N- and C-terminal conserved motifs of AMT proteins (Figure S3). Motifs 1, 2, 3, 5, and 6 are common to most AMT proteins, indicating that these motifs may be the characteristic motifs of ammonium transporters. Motifs 7, 8, 9, and 10 are unique to the AMT1 subfamily, while motif 4 is unique to the AMT2 subfamily proteins (Figure 1A,B).
We then performed a conservative domain analysis. All 16 GmAMTs contain the conserved Ammonium_transp domain, but GmAMT1.6 in the AMT1 subfamily and GmAMT4.1, GmAMT4.2, and GmAMT4.6 in the AMT2 subfamily do not have the complete Ammonium_transp domain (Figure 1C). The Ammonium_transp domain is essential for ammonium transport activity [36], and the lack of the critical Ammonium_transp domain in GmAMT1.6, GmAMT4.1, GmAMT4.2, and GmAMT4.6 suggests that they may have altered functions in soybean. Next, we analyzed the transmembrane domains, which are essential for the membrane localization and transporter activity. We found that all GmAMTs contain conserved transmembrane domains (Figure S4). Among them, GmAMT2.1, GmAMT2.2, GmAMT2.3, GmAMT3.1, and GmAMT4.5 have 11 transmembrane domains; GmAMT1.5, GmAMT4.3, and GmAMT4.4 have 10 transmembrane domains; GmAMT1.1, GmAMT1.2, GmAMT1.3, and GmAMT1.4 have 9 transmembrane domains; GmAMT4.2 has 8 transmembrane domains; GmAMT1.6 and GmAMT4.1 have 5 transmembrane domains; and GmAMT4.6 has only 4 transmembrane domains. These GmAMT proteins have variable N- and C-termini. Subcellular localization prediction analysis revealed that the majority of GmAMTs (10/16) were mainly located on the plasma membrane, while the remaining 6 may be localized on the membranes of chloroplasts (GmAMT1.1 and GmAMT1.6), cytoplasm (GmAMT1.2, GmAMT4.5, and GmAMT4.6), and vacuoles (GmAMT4.1) (Table S1). The differences in physicochemical properties and subcellular localizations indicate that these GmAMTs may be involved in ammonium transport at different sites in the cell.

2.3. Chromosome Distribution and Gene Replication of GmAMT Family Genes

Next, we analyzed the distribution of 16 GmAMT genes on chromosomes and found that they were distributed on only nine chromosomes (Chr), including Chr1, Chr2, Chr5, Chr7, Chr9, Chr10, Chr18, Chr19, and Chr20 (Figure 2). GmAMT1 subfamily genes were distributed on chromosomes 10 and 20. Of the four GmAMT1 genes on chromosome 10, GmAMT1.3, GmAMT1.4, and GmAMT1.5 are tandem repeat genes. Ten GmAMT2 subfamily genes were evenly distributed on nine chromosomes and some of them were positioned at the ends of chromosomes. Different chromosomal distribution patterns of GmAMT genes may be related to their functions.
Because Arabidopsis has only one AMT2, while soybean has evolved 10 GmAMT2 genes, we attempted to decipher the co-evolution relationship of these AMT2s through a collinearity analysis of AMTs in Arabidopsis and soybean (Figure 3 and Figure S5). The results showed that GmAMT2.1, GmAMT2.2, and GmAMT2.3 in soybean were orthologous to AtAMT2 in Arabidopsis, indicating that GmAMT2.1, GmAMT2.2, and GmAMT2.3 may retain the same function as AtAMT2, which encodes a high-affinity plasma membrane ammonium transporter [15]. Synteny analysis also showed that GmAMT2.1, GmAMT2.2, and GmAMT2.3 were orthologous to one gene in Medicago (Medtr7g069640) and two genes in Rice (LOC_Os11g01410 and LOC_Os12g01420) and Lotus (Lj1g0012871 and Lj3g0009637), respectively (Figure 3 and Figure S5). Three paralogous genes, GmAMT2.1, GmAMT2.2 and GmAMT2.3, were distributed on Chr1, Chr7, and Chr18. The soybean genome experienced two whole-genome duplications [37]. Thus, it is likely that these paralogous genes evolved during whole-genome duplications and differentially and/or redundantly modulate ammonium transport across the plasma membrane in soybean. Notably, the remaining seven GmAMT2 genes were distributed on six chromosomes, and there was only one gene on Chr5 (GmAMT3.1, Glyma.05G196500), Chr9 (GmAMT4.1, Glyma.09G281600), Chr10 (GmAMT4.6, Glyma.10G030800), Chr19 (GmAMT4.3, Glyma.19G244400), and Chr20 (GmAMT4.2, Glyma.20G004100), except for Chr2 with 2 genes (GmAMT4.4, Glyma.02G043700 and GmAMT4.5, and Glyma.02G143600) (Figure 2). Together with the fact that these GmAMT2 genes encode the new GmAMT2 proteins belonging to special clades VII and VIII (Figure S1), these data suggest that soybean may have a more complex ammonium transport system.
To reveal the evolutionary history of GmAMT family genes, we analyzed the selection types of duplicate gene pairs in GmAMT family genes using the Ka/Ks ratio (the ratio of nonsynonymous to synonymous substitutions). Ka/Ks < 1 and > 1 indicate that gene pairs have experienced negative and positive selection, respectively, while Ka/Ks = 1 indicates neutral selection of the genes [38]. We found that the Ka/Ks ratios of most gene pairs were less than 1, suggesting that the majority of GmAMT genes have experienced negative selection. Only one gene pair, GmAMT4.2 and GmAMT1.1, had a Ka/Ks ratio greater than 1 (Table S2), indicating that GmAMT4.2 and GmAMT1.1 may undergo positive selection and are important for the evolution of soybean.

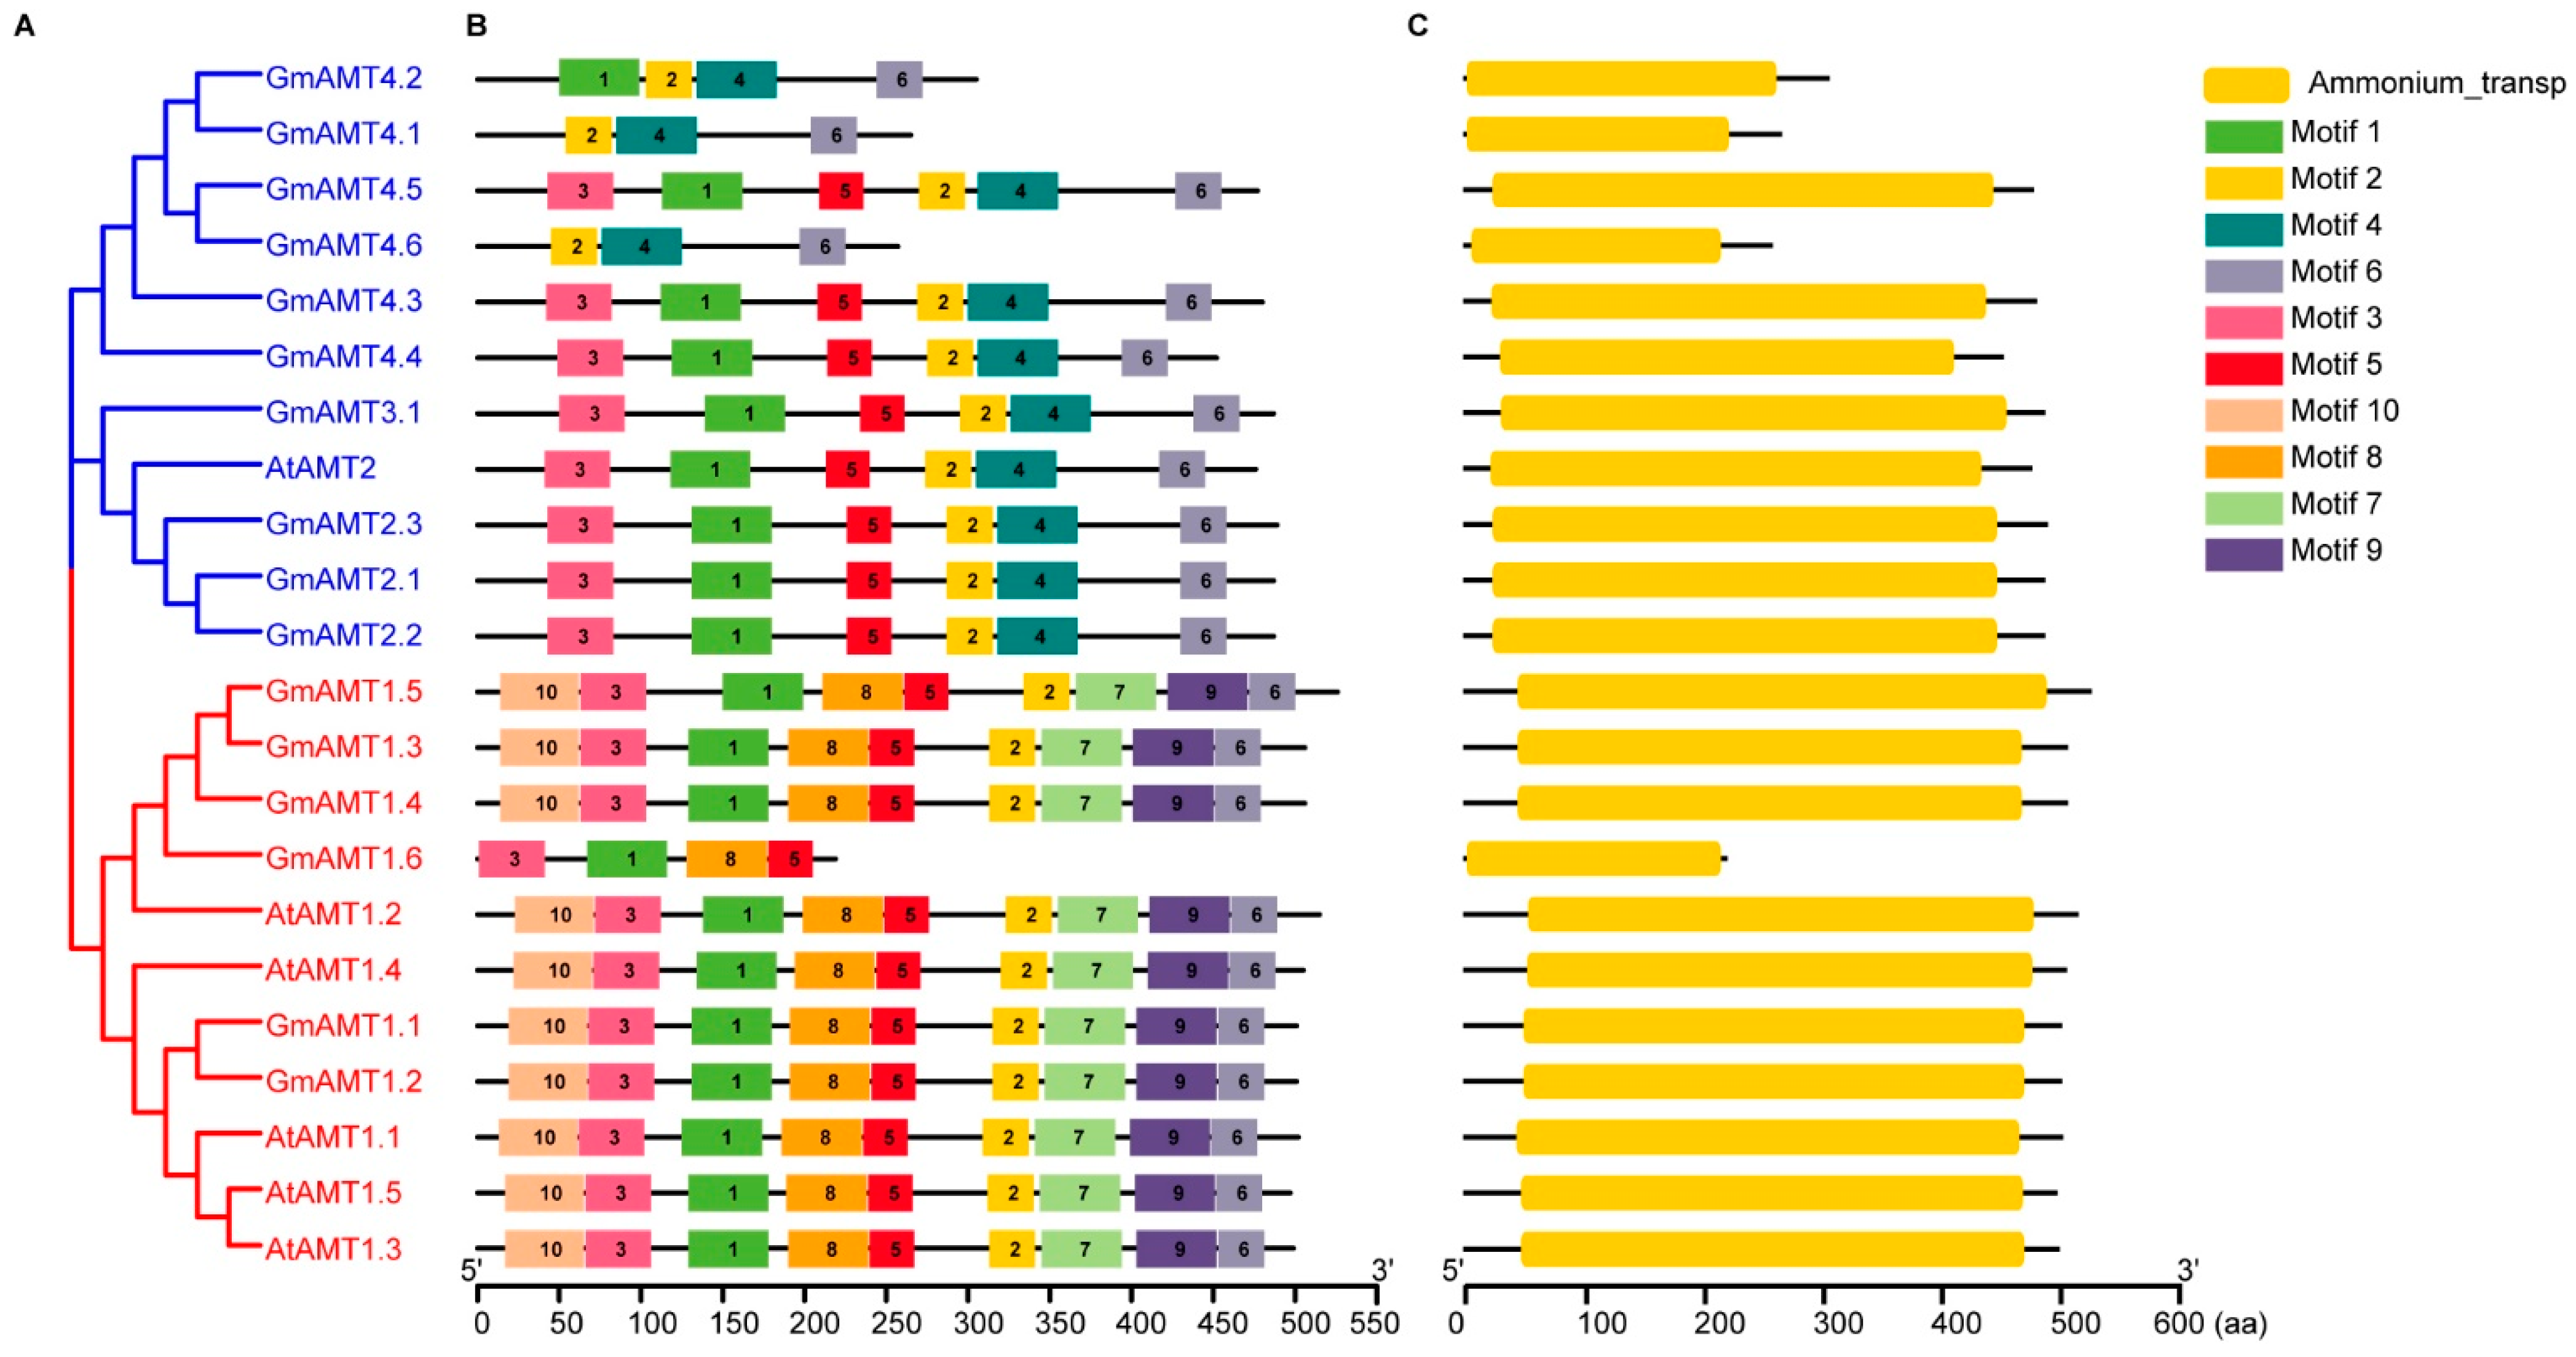
2.4. Gene Structure Analysis of GmAMT Genes

To better understand the structural changes in GmAMT1s and GmAMT2s during evolution, we reanalyzed the gene structures of these GmAMTs. Interestingly, the exon–intron structures of GmAMT1.6, GmAMT4.1, GmAMT4.2, GmAMT4.4, GmAMT4.5, and GmAMT4.6 are different from those in a previous study [35]. The results showed that GmAMT1 and GmAMT2 subfamily genes differ greatly in their gene structures (Figure 4A,B, Supplementary Data 2 and 3). The biggest difference is that all GmAMT1 subfamily genes have no introns, which is consistent with the AtAMT1 genes in Arabidopsis. In addition, all six GmAMT1s have untranslated regions (UTRs), which is different from some Arabidopsis AtAMT1s (AtAMT1.4 and AtAMT1.5) that lack UTRs. In sharp contrast, among GmAMT2 genes, all the genes contain introns, exons, and UTR regions, with the exception of GmAMT4.2, which lacks introns, and GmAMT4.3, which lacks UTRs. Notably, unlike the coding region of AtAMT2, which contains four introns and five exons, GmAMT2 subfamily genes have varied numbers of introns and exons ranging from zero to three. Among them, GmAMT2.1, GmAMT2.2, GmAMT2.3, and GmAMT4.4 have three introns; GmAMT3.1, GmAMT4.3, and GmAMT4.5 have two; GmAMT4.1 and GmAMT4.6 have only one; and GmAMT4.2 has no intron. Furthermore, the lengths of UTRs were also somewhat different among these AMT2 genes. These structural differences resulted in different lengths (657–1578 bp) of the coding sequences of these genes (Table S1). Together, these results indicate that each AMT subfamily gene has relatively conserved gene structures, and these AMT genes with different introns and UTRs are likely to be regulated at posttranscriptional levels.
The promoter is an essential component of one gene where transcription is initiated and regulated. Therefore, we analyzed the promoters of the GmAMT1 and GmAMT2 genes. We obtained the 2 kb promoters of all AMT genes in soybean and Arabidopsis and analyzed the conserved motifs of the promoters. The results showed that the promoter sequences of all these GmAMT family genes were highly different (Figure 4C and Figure S6, Supplementary Data 4). Among the 10 motifs identified from 22 AMT genes, motif 2 was very conserved and existed on 20 GmAMT promoter sequences except those of GmAMT2.3 and GmAMT3.1. The results indicate that motif 2 is likely an important regulatory element for the majority of GmAMTs that mediate the conserved biological processes. Interestingly, the same motifs (Motifs 1–10) were found in the promoters of GmAMT1.3, GmAMT1.4, and GmAMT1.5, which is consistent with the close evolutionary relationship of these three genes. In addition, the motifs on the promoter of GmAMT1.6 were almost identical to those of GmAMT1.3, GmAMT.4, and GmAMT1.5 except for motif 9, suggesting that GmAMT1.6 may have similar expression patterns to GmAMT1.3, GmAMT1.4, and GmAMT1.5 and participate in similar biological processes. In contrast, different motifs were identified on other GmAMT promoter sequences, indicating that these genes might have different expression patterns and divergent functions.

2.5. Promoter Cis-Element Analysis of GmAMTs

Promoters contain various short cis-acting regulatory elements necessary to assemble the transcriptional machinery and to regulate expression levels and functions. To explore the expression features and potential functions of GmAMT genes, we analyzed cis-acting elements in the promoters of GmAMT genes. The comprehensive data showed that GmAMT promoters have various cis-elements that respond to growth hormones (mainly abscisic acid, gibberellin, auxin, jasmonic acid, and salicylic acid), endogenous cues related to plant growth and development (circadian control, zeatin metabolism, conserved sequences in alpha-amylase promoters, and meristem and endosperm expression), and environmental stresses (e.g., light response elements, defense and stress, anaerobic induction, drought stress, and low temperature stress-related elements) (Figure 5A, Table S3). Notably, all GmAMT promoters have cis elements responsive to light and anaerobic conditions, suggesting an essential role of these GmAMT genes in plant adaptation to these conditions in soybean. In addition, we noticed that each gene promoter contains response element(s) to phytohormone(s) with varied numbers ranging from 1 to 5, indicating that these GmAMT genes are under the regulation of hormone(s) and are involved in hormone-mediated biological processes.
In addition, we found that 16 genes had different combinations of cis elements in their promoters (Figure 5A, Table S3). For example, 7 of 16 GmAMT genes (GmAMT1.1, GmAMT1.3, GmAMT1.4, GmAMT1.5, GmAMT2.2, GmAMT2.3, and GmAMT3.1) contain circadian rhythm-related cis-elements in their promoters, 5 of them (GmAMT1.6, GmAMT2.1, GmAMT3.1, GmAMT4.4, and GmAMT4.5) contain zeatin metabolism-related elements, and 7 genes (GmAMT1.3, GmAMT1.4, GmAMT1.5, GmAMT2.1. GmAMT3.1, GmAMT4.4, and GmAMT4.6) have cis-elements related to meristem expression in their promoters. Furthermore, we found that the promoters of eight genes (GmAMT1.2, GmAMT1.4, GmAMT2.1, GmAMT2.2, GmAMT2.3, GmAMT4.1, GmAMT4.2, and GmAMT4.5) have cis-elements related to plant defense, while eight genes share the cis-elements related to plant response to drought (GmAMT1.1, GmAMT4.1, GmAMT4.2, GmAMT4.3, and GmAMT4.6) and low-temperature stress (GmAMT2.3, GmAMT4.3 and GmAMT4.4) in their promoters, respectively.
Since GmAMTs are mainly responsible for ammonium sensing and metabolism, we speculated that some GmAMT genes are involved in the nitrogen response and symbiotic nitrogen fixation. Therefore, we analyzed the cis-elements related to plant response to nitrogen and symbiotic nodulation. As expected, all GmAMT promoters contain nodule specificity elements (AAAGAT and CTCTT) [39] and NIN (Nodule Inception) binding site (NBS) cis elements for NINs and NLPs (NIN-like proteins) [40,41,42,43] (Figure 5B), suggesting crucial roles of these GmAMT genes in nodulation and nitrogen response. Taken together, these results suggest that GmAMT genes are likely to show different spatial and temporal expression patterns during development and in response to the environmental conditions.

2.6. Expression of GmAMT Family Genes during Soybean Development

To assess the possible roles of GmAMTs in soybean development, we carried out spatial and temporal expression analyses during soybean growth and development. The expression of these genes was evaluated using RNA-seq data from the Soybean Expression Atlas [44]. As shown in Figure 6, tissue-specific expression patterns were observed in some of GmAMT genes. Interestingly, GmAMT4.2 and GmAMT4.4 were specifically expressed in seeds and flowers, respectively, while GmAMT4.1 was expressed at higher levels in both flowers and seeds. Furthermore, we found that some GmAMT family genes were highly expressed in underground tissues of soybean plants. Among them, GmAMT3.1 was mainly expressed in roots and nodules, while GmAMT1.6 was specifically expressed in nodules. In contrast, other GmAMT genes were mainly expressed in aboveground tissues. For example, GmAMT2.1 and GmAMT2.2 were highly expressed in shoot tissues, while GmAMT1.3, GmAMT1.4, and GmAMT1.5 were mainly expressed in leaves. The different spatial and temporal expression patterns of soybean GmAMT family genes suggest the GmAMT genes differentially and collaboratively mediate ammonium transport in soybean development.

2.7. Diurnal Changes of GmAMT Gene Expression

The circadian clock generates transcriptional oscillations of many genes and regulates a wide array of metabolic processes and plant growth. As there are circadian control elements on the promoters of some GmAMT genes, we hypothesized that these genes are under the control of the diurnal change to regulate ammonium transport and metabolism during the day and night. To prove this possibility, we used RNA-seq data from the JGI Plant Gene Atlas [45] to analyze the day–night expression levels of GmAMT family genes in leaves and nodules (Figure 7 and Figure S7). In leaves, the expression of most GmAMT1 subfamily genes (GmAMT1.2, GmAMT1.3, GmAMT1.4, GmAMT1.5, and GmAMT1.6) and four genes in the GmAMT2 subfamily (GmAMT2.1, GmAMT2.2, GmAMT2.3, and GmAMT4.6) showed a typical diurnal variation. Interestingly, these GmAMT genes in two subfamilies showed opposite expression trends in day and night. The expression levels of GmAMT1.2, GmAMT1.3, GmAMT1.4, GmAMT1.5, and GmAMT1.6 increased gradually in the daytime, reached the highest levels at night, and then gradually decreased back to the lowest levels before dawn. In contrast, the expression levels of GmAMT2.1, GmAMT2.2, GmAMT2.3, and GmAMT4.6 decreased gradually during the daytime and increased gradually at night (Figure 7A). In nodules, the expression of the GmAMT genes appeared to be less regulated by the diurnal change, but GmAMT1 and GmAMT2 subfamily genes also showed opposite patterns during day and night. Among the GmAMT1 genes, the transcription levels of GmAMT1.3 and GmAMT1.4 were lower in the daytime but higher at night, whereas the expression levels of GmAMT2.1, GmAMT2.2, GmAMT2.3, and GmAMT3.1 were higher in the daytime but lower at night (Figure 7B). Diurnal control of GmAMT gene expression suggests that these genes might be responsible for rhythmic changes in ammonium transport and nitrogen metabolism in leaves and nodules of soybean.

2.8. Expression of GmAMT Genes under Different Nitrogen Treatments

Soybeans can take up both ammonium and nitrate in soils to meet their nitrogen requirements. We assumed that the GmAMT genes are affected by both ammonium and nitrate. For this, we first analyzed the RNA-seq data from the JGI Plant Gene Atlas to determine how the GmAMT family genes respond to different types of nitrogen in roots and leaves. The GmAMT family genes showed different expression patterns in the roots and leaves of soybean plants treated with 10 mM concentrations of different nitrogen sources for 28 days (Figure 8). In roots, the expression levels of GmAMT1.2, GmAMT1.4, GmAMT2.3, and GmAMT4.2 were greatly upregulated by ammonium, nitrate, and urea, whereas the expression levels of GmAMT1.1, GmAMT1.3, GmAMT1.6, GmAMT2.1, GmAMT2.2, and GmAMT4.5 were downregulated by these nitrogen fertilizers. The expression levels of GmAMT4.1 and GmAMT4.4 were significantly upregulated under ammonium treatment (Figure 8A). In leaves, GmAMT1.3, GmAMT1.4, GmAMT1.5, GmAMT2.2, and GmAMT2.3 were upregulated under ammonium, nitrate, and urea conditions, while the expression levels of GmAMT1.6 and GmAMT4.1 were downregulated by these nitrogen fertilizers. In addition, some GmAMT genes displayed particular expression patterns in response to different forms of nitrogen. Notably, GmAMT1.2, GmAMT4.4, and GmAMT4.6 were specifically induced by urea, while GmAMT4.2 was induced by ammonium and suppressed by nitrate and urea (Figure 8B). It is apparently visible that GmAMTs showed different gene expression responses to different forms of nitrogen in the roots and leaves. These results suggest that the GmAMT genes may redundantly and coordinately control the absorption and utilization of nitrogen in soybean.

2.9. Expression Verification of GmAMTs in Development and Response to Low Nitrogen

To verify the tissue expression patterns of GmAMTs, we performed quantitative PCR to analyze the expression patterns of GmAMT family genes in different tissues of soybean collected 24 days after rhizobial (Bradyrhizobium diazoefficiens USDA110) inoculation (Figure 9A–H). Indeed, these GmAMTs showed different tissue/organ expression patterns, consistent with the RNA-seq data. Among them, GmAMT1.1 and GmAMT3.1 were highly expressed in roots (Figure 9A,H). The highest transcript levels of GmAMT1.2, GmAMT1.3, GmAMT1.4, and GmAMT1.5 were detected in leaves, while relatively lower expression levels of these genes were detected in roots and nodules (Figure 9B–E). Notably, GmAMT1.6 and GmAMT2.3 appeared to be specifically expressed in root nodules (Figure 9F,G). These results confirmed the differential expression of GmAMT genes during plant growth and development in soybean.
Next, we analyzed the expression patterns of eight putative nitrogen-responsive GmAMT genes in the roots and leaves (four each) of plants treated with 1 mM (low nitrogen) and 5 mM (moderate nitrogen) ammonium or nitrate as the nitrogen source for 1 and 3 days. We found that these selected genes were responsive to short-term treatments of low and moderate nitrogen, although the exact expression patterns were different from those in response to long-term normal nitrogen (10 mM) treatment (Figure 9I–P). In roots, compared with the No-N treatment, the expression of GmAMT1.1 was specifically and rapidly induced by low ammonium treatment (1 mM) at 1 day after treatment, while GmAMT1.2 were highly upregulated in roots under low ammonium and moderate nitrate conditions (Figure 9I,J). GmAMT2.2 was highly induced in roots by both low ammonium and nitrate at 1 day after treatment, but was significantly suppressed by moderate ammonium and nitrate at 3 days after treatment (Figure 9K). The expression of GmAMT2.3 in roots was induced by low and moderate nitrate nitrogen at 1 day after treatment, whereas its expression in roots was markedly suppressed by moderate ammonium nitrogen (Figure 9L). Furthermore, we analyzed the expression patterns of four nitrogen-responsive GmAMTs in leaves. Interestingly, compared with the no-nitrogen treatment, GmAMT1.3, GmAMT1.5, and GmAMT2.3 showed similar patterns in response to nitrogen. The expression levels of these genes were rapidly and significantly upregulated by low nitrogen regardless of the nitrogen form at 1 day after treatments, but they were only induced by higher ammonium (Figure 9M–O). In comparison, GmAMT4.1 was induced by moderate levels of both ammonium and nitrate nitrogen at 1 day but decreased with prolonged low-nitrogen treatments (Figure 9P). These results confirm that these GmAMTs are responsive to low nitrogen at transcription and may participate in nitrogen uptake and allocation in different tissues in response to the fluctuations in environmental nitrogen levels.

2.10. Expression Verification of GmAMTs under ABA Treatment

Due to the fact that there are ABA-responsive elements in the promoters of 13 GmAMTs (Figure 5A, Table S3), we hypothesized that these genes may be involved in plant response to ABA. To test the hypothesis, we analyzed the expression levels of GmAMTs in soybean roots treated with 50 μM ABA at 1–3 h. As shown in Figure 10, the ABA-responsive gene GmABI5b was highly induced by ABA and reached the highest level at 3 h, suggesting that ABA and plant response were effective. As expected, most GmAMTs members with ABRE cis elements in their promoters were responsive to exogenous ABA treatment except GmAMT4.1 (Figure 10). Among 16 GmAMT genes, the expression of 12 GmAMTs (GmAMT1.1, GmAMT1.2, GmAMT1.3, GmAMT1.5, GmAMT2.1, GmAMT2.2, GmAMT2.3, GmAMT3.1, GmAMT4.3, GmAMT4.4, GmAMT4.5, and GmAMT4.6) was rapidly induced by ABA at 1 h after treatment, while GmAMT1.4, GmAMT1.6, and GmAMT4.2 did not respond to ABA treatment. Notably, GmAMT1.2 and GmAMT3.1 showed a similar ABA induction expression pattern to GmABI5b, whereas GmAMT1.1, GmAMT1.3, GmAMT1.4, GmAMT1.5, GmAMT1.6, GmAMT2.3, GmAMT4.2, GmAMT4.4, and GmAMT4.6 were strongly down-regulated compared with that of the control (Figure 10). These results suggest that the majority of GmAMTs family members may be regulated by ABA at transcription levels and mediate plant response to abiotic stresses.

2.11. Expression of GmAMTS Is Regulated by GmNINa

GmNINa (soybean Nodule inception a) is the key transcription factor essential for nodulation and symbiotic nitrogen fixation in soybean [46,47,48]. Because the putative GmNINa binding sites were identified in the promoter regions of all GmAMTs genes (Figure 5B), we attempted to investigate whether GmAMTs are regulated by GmNINa during nodulation. We generated the composite plants with transgenic hairy roots overexpressing GmNINa (GmNINa-OE) and GmNINa-SRDX (GmNINa silencing) and examined the expression levels of GmAMTs during nodulation. As shown in Figure 11 and Figure S8, GmNINa showed a different influence on 16 GmAMT genes. The expression of 14 GmAMT genes was affected except GmAMT1.2 and GmAMT4.6. Among them, the expression levels of GmAMT1.1, GmAMT1.3, GmAMT1.5, GmAMT2.1, GmAMT2.2, GmAMT2.3, GmAMT3.1, GmAMT4.1, and GmAMT4.2 were significantly downregulated in both GmNINa-OE and GmNINa-SRDX transgenic roots at 3 days after rhizobial inoculation, whereas GmAMT1.4 was markedly upregulated in both GmNINa-OE and GmNINa-SRDX roots. However, GmAMT4.3, GmAMT4.4, and GmAMT4.5 exhibited different expression patterns. The expression of these three GmAMT genes remained unchanged in GmNINa-OE roots, but GmAMT4.3 and GmAMT4.4, and GmAMT4.5 were strongly down-regualted and up-regulated in the GmNINa-SDRX hairy roots, respectively. These results indicated that the majority of these GmAMTs members might function as downstream components of GmNINa in soybean nodulation.

3. Discussion

The AMT gene was first recognized as an ammonium transporter gene in Arabidopsis [8], and molecular genetic analyses also proved that AMTs are ammonium sensors that can sense the signal for cell–cell communication during plant growth and development of Arabidopsis and rice [6,49]. Several AMT homologues have also been shown to play crucial roles in ammonium transport in legumes, such as Medicago truncatula and Lotus japonicus [28,29,30]. For example, LjAMT2.1 was specifically localized on the bacterial perimembranes of nodules [28], while LjAMT2;2 transports ammonium during arbuscular mycorrhizal fungi symbiosis but not rhizobial symbiosis [29]. This implies that an ancient AMT gene family may be involved in more biological processes in legumes. Soybean is an important legume crop; however, no data are available to explain how GmAMT genes evolved and the potential functions of GmAMT homologues. In this study, we performed a genome-wide analysis to identify 16 GmAMT family genes that belong to two subfamilies and different clusters. The systematic analysis results of features, structures of GmAMT genes, and coding proteins and expression patterns point to plesiomorphic roles of soybean AMT genes during plant development and plant response to environmental conditions.
Soybean has the highest number of GmAMT family genes compared with nonlegume (Arabidopsis and rice) and legume (Medicago truncatula and Lotus japonicus) model plants (Figure S1). There are 16 GmAMT family genes, while the number of AMT genes in other plants vary from 6 (Arabidopsis) to 12 (rice). The increased number of GmAMT genes is likely due to two whole-genome duplications [37]. However, the numbers of genes in the GmAMT1 and GmAMT2 subfamilies of GmAMT family genes did not increase in parallel. Compared with the single copy of the AMT2 gene in Arabidopsis, soybean has 10 GmAMT2 genes. Our phylogenetic analysis results show that in addition to the conserved GmAMT2 in clade VIII, soybean evolved GmAMT3;1, which is highly homologous to rice OsAMT3 in clade VII, and importantly, soybean-specific GmAMT4.1, GmAMT4.2, and GmAMT4.4 are present in clade V and VI (Figure S1). These findings suggest that the special evolutionary pattern of soybean AMT family genes is likely to confer plants with a higher ability to sense and utilize ammonium during development and to adapt to growth environments. Furthermore, although the majority of GmAMT proteins contain conserved motifs of AMT family proteins, their physicochemical properties, structures, and transmembrane domains vary significantly. For example, four GmAMT proteins (GmAMT1.6, GmAMT4.1, GmAMT4.2, and GmAMT4.6) do not have the complete conserved Ammonium_transp domain (Figure 1), which is essential for ammonium transport activity [36], suggesting that these GmAMT proteins might have new functions. However, similar with the mechanism reported in rice [25,50], these homologous GmAMT proteins might form heteromeric complexes with other AMT proteins containing conserved Ammonium_transp domains to mediate NH4+ transport activity under normal conditions or in response to environmental stimuli, such as diurnal change, or nitrogen or ABA treatment. Moreover, GmAMT proteins have different numbers of transmembrane domains (Figure S4), and the predicted subcellular localization includes the plasma membrane and the membranes of vacuoles and chloroplasts (Table S1). This suggests that these GmAMTs may be responsible for ammonium distribution to different subcellular regions.
In addition to the changes in gene number and protein characteristics, we found that the GmAMT genes are also highly variable in gene structure (Figure 4A,B). First, all GmAMT1 genes do not have introns, which is same as the Arabidopsis AMT1.1. However, unlike Arabidopsis AMT1.4 and AMT1.5, all GmAMT1 genes have UTRs. Second, all GmAMT2 genes contain introns, exons, and UTRs, except GmAMT4.2 and GmAMT4.3. Third, the lengths of the introns, exons, and UTRs vary among these GmAMT2 genes. Introns are usually involved in the regulation of gene expression and/or RNA stability [51]. Mutations in critical regions in gene structure, including coding sequence site and upstream region, may alter the expression patterns and function of members of gene family under evolution events [52,53]. The lack of introns in the AMT1 subfamily genes suggests that the expression of these genes is basically regulated at the transcriptional level. Large variations in the length and number of introns in different AMT2 subfamily genes indicate that these genes may undergo more complicated regulation, such as alternative splicing, mRNA transport, or chromatin assembly, which have been reported previously [54,55]. Last, these GmAMT genes are different in the conserved motifs and cis-regulatory elements of their promoters (Figure 4C, Figure 5 and Table S3). It is well known that the promoter is the driver of a gene, and the cis elements in a promoter determine the spatiotemporal expression of a gene [56]. AMT proteins are in charge of ammonium transport [10,36], and it is conceivable that these GmAMT genes are responsive to nitrogen availability and the forms of nitrogen. Unexpectedly, we found that all GmAMT genes share cis-elements responsive to light and anaerobic conditions and contain different cis-elements related to endogenous and exogenous cues. The results suggest that all GmAMT genes are likely regulated by light and anaerobic conditions. In addition, these GmAMT genes are under the control of different factors during soybean development and responses to environmental conditions, thereby coordinately regulating ammonium uptake and metabolism.
Our expression analyses reveal that these GmAMT genes are indeed differentially expressed in different tissues/organs during soybean development and in response to various stimuli (Figure S9). For example, the majority of GmAMT1s (GmAMT1.3, GmAMT1.4, and GmAMT1.5) were mainly expressed in leaves, while most GmAMT2s (GmAMT4.1 and GmAMT4.3, GmAMT4.4, GmAMT2.3, and GmAMT3.1) were highly expressed in flowers, roots, and nodules (Figure 6 and Figure 9A–H). It is likely that these GmAMT genes are functionally differentiated at the transcriptional level. Interestingly, we found that many GmAMT genes (GmAMT1.2-1.6, GmAMT2.1, GmAMT2.2, GmAMT2.3, and GmAMT4.6) are under diurnal control (Figure 7). Nutrient metabolism and plant growth are tightly regulated by the circadian clock, including nitrogen absorption and metabolism [2,24]. Our results suggest that transcriptional oscillations of these GmAMT genes in different tissues and organs are involved in the regulation of ammonium transport and metabolism during the day and night.
The key role of AMT genes is in the control of ammonium sensing and uptake [3,10,36]. In this study, we found that these GmAMT genes are differentially expressed in response to ammonium, nitrate, and urea, and this conclusion is supported by the existence of nitrogen-related cis-elements (Figure 5B and Figure 8). Interestingly, these GmAMT genes are not only responsive to ammonium; some of them are regulated by all forms of nitrogen, while some of them are responsive to only one or two forms of nitrogen (Figure 8 and Figure 9I–P). These results suggest that GmAMTs may differentially and redundantly regulate plant responses to different nitrogen forms. It is worth noting that plants often face low-nitrogen conditions that limit plant development and crop yields. Our results that show that GmAMT genes are differentially expressed in roots and leaves in response to low and moderate ammonium and nitrate (Figure 9I–P) implicate an important role of these GmAMT genes in plant adaptation to low-nitrogen conditions. As a sessile organism, soybean constantly encounters unfavorable environmental stresses, such as drought and salt stress. Soybean plants have to coordinate nitrogen metabolism with stress response, allowing better plant growth [57,58]. Our results showed that most GmAMT genes contain ABRE cis elements in their promoters and their expression is regulated by ABA (Figure 5A, Figure 10 and Table S3). Our results support the notion that ABA signaling may enhance the function of GmAMTs through regulating their transcription. Differential expression of GmAMTs in response to ABA suggests that these GmAMT genes may redundantly or coordinately regulate ammonium uptake, thereby obtaining sufficient nitrogen for their growth under stress conditions. In addition, we found that many GmAMT genes may be regulated by nodulation signaling. There are putative GmNINa binding sites in their promoter regions, and most importantly, alterations in GmNINa expression affect the expression of most GmAMTs (Figure 5B and Figure 11). Thus, we conclude that GmAMT genes play crucial roles in the control of absorption, assimilation, and remobilization of nitrogen in soybean under normal condition or different environmental conditions. Further genetic and molecular analyses will establish the molecular link between GmAMTs and ammonium uptake with stress signaling and/or nodulation signaling.
In summary, this study provides a comprehensive understanding of AMT genes and proteins in soybean. We also explore the potential functions of the GmAMT family genes involved in plant growth and development, the circadian rhythms of nitrogen metabolism, plant responses to nitrogen availability, and environmental stresses (Figure S9). It is apparent that GmAMT genes are involved in ammonium uptake and assimilation and are essential for plant development and adaptation to insufficient nitrogen in growth environments. Future studies need to focus on the functions of these GmAMT genes to help elucidate the genetic regulatory mechanisms integrating ammonium sensing, uptake and remobilization and assimilation into plant growth, and environmental adaptation in soybean as well as in other plants.

4. Materials and Methods

4.1. Identification of AMT Genes in Different Species

The genomic information and annotation files of Arabidopsis thaliana [59], Oryza sativa [60], Medicago truncatula [61], Lotus japonicus [62] and Glycine max [63] were downloaded from the Phytozome database (https://phytozome-next.jgi.doe.gov/, accessed on 5 October 2022). The hidden Markov model (HMM) of the conserved protein domain Ammonium_transp (PF00909) was downloaded from the Pfam database (http://pfam-legacy.xfam.org/ accessed on 5 October 2022) [64]. A simple HMM search of TBtools software [65] was used to obtain ammonium transporters in different species. AMTs without conserved Ammonium_transp domains were removed according to the NCBI Conserved Domain Database (NCBI-CDD) tool (https://www.ncbi.nlm.nih.gov/Structure/cdd/wrpsb.cgi accessed on 5 October 2022) [66].

4.2. Phylogenetic Tree Analysis of AMTs

The full-length amino acid sequences of AMTs from Arabidopsis thaliana, Oryza sativa, Medicago truncatula, Lotus japonicus, and Glycine max were downloaded from the Phytozome database. The amino acid sequences of AMTs were aligned by MEGA-X software [67], and a phylogenetic tree was constructed by the maximum-likelihood method (ML). Bootstrap analysis was calculated for 1000 replicates. The evolutionary tree was visualized on the web-based tool Interactive Tree Of Life (iTOL, https://itol.embl.de/ accessed on 5 October 2022) [68].

4.3. Physicochemical Properties and Transmembrane Structure Analysis of GmAMT Proteins

The molecular weights (kDa) and isoelectric points (pI) of GmAMT family proteins were obtained through the ExPASy website (https://web.expasy.org/protparam/ accessed on 6 October 2022) [69]. Prediction of subcellular localization of AMT family proteins was performed using the online website WOLF PSORT (https://www.genscript.com/wolf-psort.html accessed on 6 October 2022) [70]. Transmembrane structure prediction of GmAMT proteins was performed using the TMHMM website (https://services.healthtech.dtu.dk/service.php?TMHMM-2.0 accessed on 6 October 2022) [71].

4.4. Gene Structure, Conserved Motif and Conserved Protein Domain Analyses of AMTs

The promoter sequences, CDSs, genomic sequences, and amino acid sequences of AMTs were obtained from the Phytozome database. The gene structures of AMTs were analyzed using the GSDS2.0 website (Gene Structure Display Server, http://gsds.gao-lab.org/ accessed on 8 October 2022) [72]. The MEME (https://meme-suite.org/meme/tools/meme accessed on 8 October 2022) online tool [73,74] was used to identify the conserved motifs in the promoter regions of AMT genes and AMT amino acid sequences. The conserved domains of AMT proteins were analyzed by the NCBI CD-search tool (https://www.ncbi.nlm.nih.gov/Structure/cdd/wrpsb.cgi accessed on 5 October 2022) [75]. TBtools software was used to integrate the phylogenetic tree, gene structures, and conserved motifs identified in the promoters and AMT proteins and the conserved domains [65].

4.5. Chromosome Localization Analysis and Ka/Ks Analyses

The GFF file of the soybean genome was downloaded from the Phytozome database. The chromosome gene density and GmAMT locations on chromosomes were displayed using TBtools. The DnaSP6 tool was used to analyze the ratio of nonsynonymous substitutions (Ka) to synonymous substitutions (Ks) of gene pairs (Ka/Ks) [76]. The Ka/Ks value can be used as a molecular indicator of nucleic acid evolution to determine whether GmAMT genes have undergone selective pressure [38].

4.6. Synteny Analysis of AMT Genes

Collinearity analysis of AMT family genes was performed using TBtools software [65]. Arabidopsis thaliana, Oryza sativa, Lotus japonicus, Medicago truncatula, and Glycine max genomes were compared using One-Step MCScanX-Super Fast (default parameters e-value < 1e−3), and all possible collinear gene pairs between chromosomes were calculated. TBtools was used to map the collinearity graphs and meanwhile highlight the AMT genes on the graphs.

4.7. Cis-Element Analysis of GmAMT Promoter Regions

The 2 kb promoter sequences of GmAMTs upstream of the start codons were obtained from the Phytozome database. The cis-elements in the promoter regions of 16 GmAMT genes were analyzed using the PlantCARE online website (https://bioinformatics.psb.ugent.be/webtools/plantcare/html/ accessed on 8 October 2022) [77]. The data were visualized by TBtools [65].

4.8. Expression Analysis of the GmAMT Genes in Soybean

Tissue expression data of GmAMT genes were downloaded from the Soybean Expression Atlas (https://venanciogroup.uenf.br/cgi-bin/gmax_atlas/index.cgi accessed on 10 October 2022) [44]. GmAMT gene expression data in response to different nitrogen treatments or diurnal variation were obtained from the JGI Plant Gene Atlas (https://plantgeneatlas.jgi.doe.gov/ accessed on 10 October 2022) [45]. Gene expression heatmaps were constructed by TBtools software [65].

4.9. Plant Materials and Growth Conditions

Seeds from soybean (Glycine max) cultivar Williams 82 (Wm82) were sown in vermiculite soaked in nitrogen-free BD nutrient solution as described by Broughton and Dilworth [78] and cultured in a greenhouse under controlled conditions with a 16 h light/8 h dark program at 26 °C, a light intensity of 200 μmol/m2/s, and 60% relative humidity. Distilled water and BD nutrient solution were alternatively used to irrigate soybean plants every 5 days.
To analyze tissue-specific gene expression, 8-day-old plants were inoculated with Bradyrhizobium diazoefficiens USDA110 (OD600 = 0.08, 30 mL per plant). Different tissues, including leaves, stems, roots, and nodule tissues, were taken at 24 days after rhizobium inoculation.
For samples treated with different nitrogen conditions, 8-day-old soybean plants were treated with 1 mM and 5 mM nitrate nitrogen and ammonium nitrogen, respectively. The leaves and roots were taken at 1 and 3 days after treatment for subsequent experiments.
For samples treated with ABA, 8-day-old soybean plants were pretreated with 10 mM PBS solution (pH7.4) for 8 h (4 plants/150 mL solution), then treated with 50 μM ABA (4 plants/150 mL solution). The experimental method was improved according to Guo et al. description [79]. The roots were taken at 1 and 3 h after treatment for subsequent experiments. GmABI5b is a homologous gene of Arabidopsis AtABI5, which was used as a classic ABA-inducible gene [80].

4.10. Soybean Hairy Root Transformation

Soybean hairy root transformation was done using Agrobacterium rhizogenes K599 carrying GmNINa-pMDC32 (GmNINa-OE), GmNINa-SRDX-pMDC32 (GmNINa-SRDX) or pMDC32 (Empty vector) plasmid according to methods described by Wang et al. [81]. The composite plants were inoculated with USDA110 (OD600 = 0.08) at 10 days after transplantation (30 mL per plant). Three days after being inoculated with USDA110, the transgenic hairy roots were taken for analyzing gene expression. The primers of GmNINaCDS or GmNINaUTR were used for analyzing GmNINa expression in transgenic hairy roots having GmNINaOE or GmNINa-SRDX, respectively [82].

4.11. RNA Extraction and RT-qPCR

To assay the expression of GmAMT genes, total RNA was extracted from different samples using TRIpure reagent (Aidlab Biotechnologies). cDNA was synthesized from the RNA by a reverse transcription reagent kit (Hifair® II 1st Strand cDNA Synthesis SuperMix for qPCR (gDNA digester plus), YEASEN). Real-time quantitative PCR was performed using Hieff® qPCR SYBR Green Master Mix (No Rox) (YEASEN). GmELF1b was used as an internal control gene [83]. Gene-specific primers are listed in Table S4.

5. Conclusions

In this study, we gained a better understanding of ammonium transporter proteins in soybean. Except for the conserved GmAMTs, the number of GmAMT family members increased, and legume-specific AMTs were identified. The gene structures and the conserved motifs of GmAMT1 and GmAMT2 members appeared to be different based on the results of cis-element analysis and gene expression patterns in different tissues and in response to nitrogen treatment and ABA. GmAMTs might be involved in ammonium uptake and assimilation and may also be required for soybean plastic development under nitrogen deficiency conditions and in response to environmental stresses. Based on the result of the occurrence of cis-elements and gene expression data, some GmAMTs members have the potent function to participate in symbiosis downstream of GmNINa. These data not only provide important clues for further studies on the conserved and legume-specific function of GmAMTs but also provide insights into the molecular mechanisms involved in the regulation of GmAMTs in soybean.

Supplementary Materials

The following supporting information can be downloaded at: https://www.mdpi.com/article/10.3390/ijms24043991/s1.

Author Contributions

X.L. conceived and designed the work. W.Y., X.D., Y.Z. and Z.Y. performed the bioinformatic analyses and RT-qPCR analyses. Y.W. and X.L. wrote the paper. All authors have read and agreed to the published version of the manuscript.

Funding

This research was funded by the Laboratory of Lingnan Modern Agriculture Project (NZ2021013), the National Natural Science Foundation of China (31961133029 and 31730066), and the Huazhong Agricultural University Scientific & Technological Self-innovation Foundation, grant number 2015RC014.

Institutional Review Board Statement

Not applicable.

Informed Consent Statement

Not applicable.

Data Availability Statement

The datasets used and/or analyzed during the current study are available from the corresponding author on reasonable request. However, most of the data are shown in the Supplementary files.

Acknowledgments

We thank Xutong Wang in our laboratory for his help in the bioinformatic analysis. We also want to thank the lab members for their help in conducting the experiments related to this work.

Conflicts of Interest

The authors declare no conflict of interest.

References

  1. Jahan, S.; Wahocho, N.; Laghari, G.; Laghari, A.; Bhabhan, G.; HussainTalpur, K.; Ahmed, T.; Wahocho, S.; Lashari, A. Role of nitrogen for plant growth and development: A review. Adv. Environ. Biol. 2016, 10, 209–218. [Google Scholar]
  2. Gazzarrini, S.; Lejay, L.; Gojon, A.; Ninnemann, O.; Frommer, W.B.; von Wirén, N. Three functional transporters for constitutive, diurnally regulated, and starvation-induced uptake of ammonium into Arabidopsis roots. Plant Cell 1999, 11, 937–947. [Google Scholar] [CrossRef] [PubMed] [Green Version]
  3. Hao, D.-L.; Zhou, J.-Y.; Yang, S.-Y.; Qi, W.; Yang, K.-J.; Su, Y.-H. Function and regulation of ammonium transporters in plants. Int. J. Mol. Sci. 2020, 21, 3557. [Google Scholar] [CrossRef] [PubMed]
  4. Zhang, J.; Cai, Z.; Müller, C. Terrestrial N cycling associated with climate and plant-specific N preferences: A review. Eur. J. Soil Sci. 2018, 69, 488–501. [Google Scholar] [CrossRef] [Green Version]
  5. Ludewig, U.; Neuhauser, B.; Dynowski, M. Molecular mechanisms of ammonium transport and accumulation in plants. FEBS Lett. 2007, 581, 2301–2308. [Google Scholar] [CrossRef] [Green Version]
  6. Giehl, R.; Laginha, A.; Duan, F.; Rentsch, D.; Yuan, L.; von Wirén, N. A critical role of AMT2;1 in root-to-shoot translocation of ammonium in Arabidopsis. Mol. Plant 2017, 10, 1449–1460. [Google Scholar] [CrossRef]
  7. Yuan, L.; Graff, L.; Loque, D.; Kojima, S.; Tsuchiya, Y.N.; Takahashi, H.; von Wirén, N. AtAMT1;4, a pollen-specific high-affinity ammonium transporter of the plasma membrane in Arabidopsis. Plant Cell Physiol. 2009, 50, 13–25. [Google Scholar] [CrossRef]
  8. Ninnemann, O.; Jauniaux, J.C.; Frommer, W.B. Identification of a high affinity NH4+ transporter from plants. EMBO J. 1994, 13, 3464–3471. [Google Scholar] [CrossRef]
  9. Sohlenkamp, C.; Shelden, M.; Howitt, S.; Udvardi, M. Characterization of Arabidopsis AtAMT2, a novel ammonium transporter in plants. FEBS Lett. 2000, 467, 273–278. [Google Scholar] [CrossRef] [Green Version]
  10. Howitt, S.M.; Udvardi, M.K. Structure, function and regulation of ammonium transporters in plants. Biochim. Biophys. Acta Biomembr. 2000, 1465, 152–170. [Google Scholar] [CrossRef] [Green Version]
  11. Andrade, S.L.; Einsle, O. The Amt/Mep/Rh family of ammonium transport proteins. Mol. Membr. Biol. 2007, 24, 357–365. [Google Scholar] [CrossRef]
  12. Yuan, L.; Loque, D.; Kojima, S.; Rauch, S.; Ishiyama, K.; Inoue, E.; Takahashi, H.; von Wirén, N. The organization of high-affinity ammonium uptake in Arabidopsis roots depends on the spatial arrangement and biochemical properties of AMT1-type transporters. Plant Cell 2007, 19, 2636–2652. [Google Scholar] [CrossRef] [PubMed] [Green Version]
  13. Loque, D.; Yuan, L.; Kojima, S.; Gojon, A.; Wirth, J.; Gazzarrini, S.; Ishiyama, K.; Takahashi, H.; von Wirén, N. Additive contribution of AMT1;1 and AMT1;3 to high-affinity ammonium uptake across the plasma membrane of nitrogen-deficient Arabidopsis roots. Plant J. 2006, 48, 522–534. [Google Scholar] [CrossRef] [PubMed]
  14. Kiba, T.; Krapp, A. Plant nitrogen acquisition under low availability: Regulation of uptake and root architecture. Plant Cell Physiol. 2016, 57, 707–714. [Google Scholar] [CrossRef] [Green Version]
  15. Sohlenkamp, C.; Wood, C.C.; Roeb, G.W.; Udvardi, M.K. Characterization of Arabidopsis AtAMT2, a high-affinity ammonium transporter of the plasma membrane. Plant Physiol. 2002, 130, 1788–1796. [Google Scholar] [CrossRef] [PubMed] [Green Version]
  16. Mayer, M.; Ludewig, U. Role of AMT1;1 in NH4+ acquisition in Arabidopsis thaliana. Plant Biol. 2006, 8, 522–528. [Google Scholar] [CrossRef] [PubMed]
  17. Shelden, M.C.; Dong, B.; de Bruxelles, G.L.; Trevaskis, B.; Whelan, J.; Ryan, P.R.; Howitt, S.M.; Udvardi, M.K. Arabidopsis ammonium transporters, AtAMT1;1 and AtAMT1;2, have different biochemical properties and functional roles. Plant Soil 2001, 231, 151–160. [Google Scholar] [CrossRef]
  18. Von Wirén, N.; Lauter, F.R.; Ninnemann, O.; Gillissen, B.; Walch-Liu, P.; Engels, C.; Jost, W.; Frommer, W.B. Differential regulation of three functional ammonium transporter genes by nitrogen in root hairs and by light in leaves of tomato. Plant J. 2000, 21, 167–175. [Google Scholar] [CrossRef]
  19. Li, C.; Tang, Z.; Wei, J.; Qu, H.; Xie, Y.; Xu, G. The OsAMT1.1 gene functions in ammonium uptake and ammonium-potassium homeostasis over low and high ammonium concentration ranges. J. Genet. Genom. 2016, 43, 639–649. [Google Scholar] [CrossRef]
  20. Gu, R.; Duan, F.; An, X.; Zhang, F.; von Wirén, N.; Yuan, L. Characterization of AMT-mediated high-affinity ammonium uptake in roots of maize (Zea mays L.). Plant Cell Physiol. 2013, 54, 1515–1524. [Google Scholar] [CrossRef]
  21. Couturier, J.; Montanini, B.; Martin, F.; Brun, A.; Blaudez, D.; Chalot, M. The expanded family of ammonium transporters in the perennial poplar plant. New Phytol. 2007, 174, 137–150. [Google Scholar] [CrossRef] [PubMed]
  22. Ranathunge, K.; El-Kereamy, A.; Gidda, S.; Bi, Y.M.; Rothstein, S.J. AMT1;1 transgenic rice plants with enhanced NH4+ permeability show superior growth and higher yield under optimal and suboptimal NH4+ conditions. J. Exp. Bot. 2014, 65, 965–979. [Google Scholar] [CrossRef] [PubMed] [Green Version]
  23. Bao, A.; Liang, Z.; Zhao, Z.; Cai, H. Overexpressing of OsAMT1-3, a high affinity ammonium transporter gene, modifies rice growth and carbon-nitrogen metabolic status. Int. J. Mol. Sci. 2015, 16, 9037–9063. [Google Scholar] [CrossRef] [Green Version]
  24. Hsu, P.Y.; Harmer, S.L. Wheels within wheels: The plant circadian system. Trends Plant Sci. 2014, 19, 240–249. [Google Scholar] [CrossRef] [PubMed] [Green Version]
  25. Wu, X.X.; Yuan, D.P.; Chen, H.; Kumar, V.; Kang, S.M.; Jia, B.; Xuan, Y.H. Ammonium transporter 1 increases rice resistance to sheath blight by promoting nitrogen assimilation and ethylene signalling. Plant Biotechnol. J. 2022, 20, 1085–1097. [Google Scholar] [CrossRef] [PubMed]
  26. Li, T.; Liao, K.; Xu, X.; Gao, Y.; Wang, Z.; Zhu, X.; Jia, B.; Xuan, Y. Wheat ammonium transporter (AMT) gene family: Diversity and possible role in host-pathogen interaction with stem rust. Front. Plant Sci. 2017, 8, 1637. [Google Scholar] [CrossRef] [Green Version]
  27. Jiang, J.; Zhao, J.; Duan, W.; Tian, S.; Wang, X.; Zhuang, H.; Fu, J.; Kang, Z. TaAMT2;3a, a wheat AMT2-type ammonium transporter, facilitates the infection of stripe rust fungus on wheat. BMC Plant Biol. 2019, 19, 239. [Google Scholar] [CrossRef] [Green Version]
  28. Simon-Rosin, U.; Wood, C.; Udvardi, M.K. Molecular and cellular characterisation of LjAMT2;1, an ammonium transporter from the model legume Lotus japonicus. Plant Mol. Biol. 2003, 51, 99–108. [Google Scholar] [CrossRef]
  29. Guether, M.; Neuhauser, B.; Balestrini, R.; Dynowski, M.; Ludewig, U.; Bonfante, P. A mycorrhizal-specific ammonium transporter from Lotus japonicus acquires nitrogen released by arbuscular mycorrhizal fungi. Plant Physiol. 2009, 150, 73–83. [Google Scholar] [CrossRef] [Green Version]
  30. Breuillin-Sessoms, F.; Floss, D.S.; Gomez, S.K.; Pumplin, N.; Ding, Y.; Levesque-Tremblay, V.; Noar, R.D.; Daniels, D.A.; Bravo, A.; Eaglesham, J.B.; et al. Suppression of arbuscule degeneration in Medicago truncatula phosphate transporter 4 mutants is dependent on the ammonium transporter 2 family protein AMT2;3. Plant Cell 2015, 27, 1352–1366. [Google Scholar] [CrossRef] [Green Version]
  31. Coskan, A.; Dog, K. Symbiotic nitrogen fixation in soybean. In Soybean Physiology and Biochemistry; El-Shemy, H., Ed.; Süleyman Demirel University: Isparta Merkez, Turkey; Mustafa Kemal University: Antakya, Turkey, 2011; pp. 167–182. [Google Scholar]
  32. Salvagiotti, F.; Cassman, K.G.; Specht, J.E.; Walters, D.T.; Weiss, A.; Dobermann, A. Nitrogen uptake, fixation and response to fertilizer N in soybeans: A review. Field Crops Res. 2008, 108, 1–13. [Google Scholar] [CrossRef] [Green Version]
  33. Kaiser, B.N.; Finnegan, P.M.; Tyerman, S.D.; Whitehead, L.F.; Bergersen, F.J.; Day, D.A.; Udvardi, M.K. Characterization of an ammonium transport protein from the peribacteroid membrane of soybean nodules. Science 1998, 281, 1202–1206. [Google Scholar] [CrossRef] [PubMed]
  34. Chiasson, D.M.; Loughlin, P.C.; Mazurkiewicz, D.; Mohammadidehcheshmeh, M.; Fedorova, E.E.; Okamoto, M.; McLean, E.; Glass, A.D.; Smith, S.E.; Bisseling, T.; et al. Soybean SAT1 (Symbiotic Ammonium Transporter 1) encodes a bHLH transcription factor involved in nodule growth and NH4+ transport. Proc. Natl. Acad. Sci. USA 2014, 111, 4814–4819. [Google Scholar] [CrossRef] [PubMed] [Green Version]
  35. Kobae, Y.; Tamura, Y.; Takai, S.; Banba, M.; Hata, S. Localized expression of arbuscular mycorrhiza-inducible ammonium transporters in soybean. Plant Cell Physiol. 2010, 51, 1411–1415. [Google Scholar] [CrossRef] [PubMed]
  36. Li, X.D.; Lupo, D.; Zheng, L.; Winkler, F. Structural and functional insights into the AmtB/Mep/Rh protein family. Transfus. Clin. Biol. 2006, 13, 65–69. [Google Scholar] [CrossRef]
  37. Shoemaker, R.C.; Polzin, K.; Labate, J.; Specht, J.; Brummer, E.C.; Olson, T.; Young, N.; Concibido, V.; Wilcox, J.; Tamulonis, J.P.; et al. Genome duplication in soybean (Glycine subgenus soja). Genetics 1996, 144, 329–338. [Google Scholar] [CrossRef]
  38. Hurst, L.D. The Ka/Ks ratio: Diagnosing the form of sequence evolution. Trends Genet. 2002, 18, 486–487. [Google Scholar] [CrossRef]
  39. Stougaard, J.; Jørgensen, J.-E.; Christensen, T.; Kühle, A.; Marcker, K.A. Interdependence and nodule specificity of cis-acting regulatory elements in the soybean leghemoglobin lbc3 and N23 gene promoters. Mol. Gen. Genet. 1990, 220, 353–360. [Google Scholar] [CrossRef]
  40. Schauser, L.; Roussis, A.; Stiller, J.; Stougaard, J. A plant regulator controlling development of symbiotic root nodules. Nature 1999, 402, 191–195. [Google Scholar] [CrossRef]
  41. Schauser, L.; Wieloch, W.; Stougaard, J. Evolution of NIN-like proteins in Arabidopsis, rice, and Lotus japonicus. J. Mol. Evol. 2005, 60, 229–237. [Google Scholar] [CrossRef]
  42. Nishida, H.; Tanaka, S.; Handa, Y.; Ito, M.; Sakamoto, Y.; Matsunaga, S.; Betsuyaku, S.; Miura, K.; Soyano, T.; Kawaguchi, M.; et al. A NIN-LIKE PROTEIN mediates nitrate-induced control of root nodule symbiosis in Lotus japonicus. Nat. Commun. 2018, 9, 499. [Google Scholar] [CrossRef] [PubMed] [Green Version]
  43. Nishida, H.; Nosaki, S.; Suzuki, T.; Ito, M.; Miyakawa, T.; Nomoto, M.; Tada, Y.; Miura, K.; Tanokura, M.; Kawaguchi, M.; et al. Different DNA-binding specificities of NLP and NIN transcription factors underlie nitrate-induced control of root nodulation. Plant Cell 2021, 33, 2340–2359. [Google Scholar] [CrossRef] [PubMed]
  44. Machado, F.B.; Moharana, K.C.; Almeida-Silva, F.; Gazara, R.K.; Pedrosa-Silva, F.; Coelho, F.S.; Grativol, C.; Venancio, T.M. Systematic analysis of 1298 RNA-Seq samples and construction of a comprehensive soybean (Glycine max) expression atlas. Plant J. 2020, 103, 1894–1909. [Google Scholar] [CrossRef] [PubMed]
  45. Sreedasyam, A.; Plott, C.; Hossain, M.S.; Lovell, J.T.; Grimwood, J.; Jenkins, J.W.; Daum, C.; Barry, K.; Carlson, J.; Shu, S.; et al. JGI Plant Gene Atlas: An updateable transcriptome resource to improve structural annotations and functional gene descriptions across the plant kingdom. bioRxiv 2022. [Google Scholar] [CrossRef]
  46. Jiang, S.; Jardinaud, M.-F.; Gao, J.; Pecrix, Y.; Wen, J.; Mysore, K.; Xu, P.; Sanchez-Canizares, C.; Ruan, Y.; Li, Q.; et al. NIN-like protein transcription factors regulate leghemoglobin genes in legume nodules. Science 2021, 374, 625–628. [Google Scholar] [CrossRef]
  47. Liu, J.; Bisseling, T. Evolution of NIN and NIN-like genes in relation to nodule symbiosis. Genes 2020, 11, 777. [Google Scholar] [CrossRef]
  48. Wang, L.; Sun, Z.; Su, C.; Wang, Y.; Yan, Q.; Chen, J.; Ott, T.; Li, X. A GmNINa-miR172c-NNC1 regulatory network coordinates the nodulation and autoregulation of nodulation pathways in soybean. Mol. Plant 2019, 12, 1211–1226. [Google Scholar] [CrossRef] [Green Version]
  49. Luo, L.; Zhu, M.; Jia, L.; Xie, Y.; Wang, Z.; Xuan, W. Ammonium transporters cooperatively regulate rice crown root formation responding to ammonium nitrogen. J. Exp. Bot. 2022, 73, 3671–3685. [Google Scholar] [CrossRef]
  50. Yuan, L.; Gu, R.; Xuan, Y.; Smith-Valle, E.; Loque, D.; Frommer, W.B.; von Wiren, N. Allosteric regulation of transport activity by heterotrimerization of Arabidopsis ammonium transporter complexes in vivo. Plant Cell 2013, 25, 974–984. [Google Scholar] [CrossRef] [Green Version]
  51. Shaul, O. How introns enhance gene expression. Int. J. Biochem. Cell Biol. 2017, 91, 145–155. [Google Scholar] [CrossRef]
  52. Heidari, P.; Puresmaeli, F.; Mora-Poblete, F. Genome-wide identification and molecular evolution of the magnesium transporter (MGT) gene family in Citrullus lanatus and Cucumis sativus. Agronomy 2022, 12, 2253. [Google Scholar] [CrossRef]
  53. Yaghobi, M.; Heidari, P. Genome-wide analysis of aquaporin gene family in Triticum turgidum and itsexpression profile in response to salt stress. Genes 2023, 14, 202. [Google Scholar] [CrossRef] [PubMed]
  54. Zhao, Y.; Sun, J.; Xu, P.; Zhang, R.; Li, L. Intron-mediated alternative splicing of WOOD-ASSOCIATED NAC TRANSCRIPTION FACTOR1B regulates cell wall thickening during fiber development in Populus species. Plant Physiol. 2014, 164, 765–776. [Google Scholar] [CrossRef] [PubMed] [Green Version]
  55. Jo, B.S.; Choi, S.S. Introns: The functional benefits of introns in genomes. Genom. Inform. 2015, 13, 112–118. [Google Scholar] [CrossRef] [Green Version]
  56. Hernandez-Garcia, C.M.; Finer, J.J. Identification and validation of promoters and cis-acting regulatory elements. Plant Sci. 2014, 217–218, 109–119. [Google Scholar] [CrossRef] [Green Version]
  57. Wang, R.; Zeng, J.; Chen, K.; Ding, Q.; Shen, Q.; Wang, M.; Guo, S. Nitrogen improves plant cooling capacity under increased environmental temperature. Plant Soil 2022, 472, 329–344. [Google Scholar] [CrossRef]
  58. Sajjad, N.; Bhat, E.A.; Shah, D.; Manzoor, I.; Noor, W.; Shah, S.; Hassan, S.; Ali, R. Nitrogen uptake, assimilation, and mobilization in plants under abiotic stress. In Transporters and Plant Osmotic Stress; Roychoudhury, A., Tripathi, D.K., Deshmukh, R., Eds.; Academic Press: Cambridge, MA, USA, 2021; pp. 215–233. [Google Scholar]
  59. Lamesch, P.; Berardini, T.Z.; Li, D.; Swarbreck, D.; Wilks, C.; Sasidharan, R.; Muller, R.; Dreher, K.; Alexander, D.L.; Garcia-Hernandez, M.; et al. The Arabidopsis Information Resource (TAIR): Improved gene annotation and new tools. Nucleic Acids Res. 2012, 40, D1202–D1210. [Google Scholar] [CrossRef]
  60. Ouyang, S.; Zhu, W.; Hamilton, J.; Lin, H.; Campbell, M.; Childs, K.; Thibaud-Nissen, F.; Malek, R.L.; Lee, Y.; Zheng, L.; et al. The TIGR Rice Genome Annotation Resource: Improvements and new features. Nucleic Acids Res. 2007, 35, D883–D887. [Google Scholar] [CrossRef] [Green Version]
  61. Tang, H.; Krishnakumar, V.; Bidwell, S.; Rosen, B.; Chan, A.; Zhou, S.; Gentzbittel, L.; Childs, K.L.; Yandell, M.; Gundlach, H.; et al. An improved genome release (version Mt4.0) for the model legume Medicago truncatula. BMC Genom. 2014, 15, 312. [Google Scholar] [CrossRef] [Green Version]
  62. Li, H.; Jiang, F.; Wu, P.; Wang, K.; Cao, Y. A high-quality genome sequence of model legume Lotus japonicus (MG-20) provides insights into the evolution of root nodule symbiosis. Genes 2020, 11, 483. [Google Scholar] [CrossRef]
  63. Valliyodan, B.; Cannon, S.B.; Bayer, P.E.; Shu, S.; Brown, A.V.; Ren, L.; Jenkins, J.; Chung, C.Y.; Chan, T.F.; Daum, C.G.; et al. Construction and comparison of three reference-quality genome assemblies for soybean. Plant J. 2019, 100, 1066–1082. [Google Scholar] [CrossRef] [PubMed]
  64. El-Gebali, S.; Mistry, J.; Bateman, A.; Eddy, S.R.; Luciani, A.; Potter, S.C.; Qureshi, M.; Richardson, L.J.; Salazar, G.A.; Smart, A.; et al. The Pfam protein families database in 2019. Nucleic Acids Res. 2019, 47, D427–D432. [Google Scholar] [CrossRef] [PubMed]
  65. Chen, C.; Chen, H.; Zhang, Y.; Thomas, H.R.; Frank, M.H.; He, Y.; Xia, R. TBtools: An integrative toolkit developed for interactive analyses of big biological data. Mol. Plant 2020, 13, 1194–1202. [Google Scholar] [CrossRef] [PubMed]
  66. Lu, S.; Wang, J.; Chitsaz, F.; Derbyshire, M.K.; Geer, R.C.; Gonzales, N.R.; Gwadz, M.; Hurwitz, D.I.; Marchler, G.H.; Song, J.S.; et al. CDD/SPARCLE: The conserved domain database in 2020. Nucleic Acids Res. 2020, 48, D265–D268. [Google Scholar] [CrossRef] [PubMed] [Green Version]
  67. Kumar, S.; Stecher, G.; Li, M.; Knyaz, C.; Tamura, K.; Battistuzzi, F.U. MEGA X: Molecular Evolutionary Genetics Analysis across computing platforms. Mol. Biol. Evol. 2018, 35, 1547–1549. [Google Scholar] [CrossRef]
  68. Letunic, I.; Bork, P. Interactive Tree Of Life (iTOL) v5: An online tool for phylogenetic tree display and annotation. Nucleic Acids Res. 2021, 49, W293–W296. [Google Scholar] [CrossRef]
  69. Artimo, P.; Jonnalagedda, M.; Arnold, K.; Baratin, D.; Csardi, G.; de Castro, E.; Duvaud, S.; Flegel, V.; Fortier, A.; Gasteiger, E.; et al. ExPASy: SIB bioinformatics resource portal. Nucleic Acids Res. 2012, 40, W597–W603. [Google Scholar] [CrossRef]
  70. Horton, P.; Park, K.J.; Obayashi, T.; Fujita, N.; Harada, H.; Adams-Collier, C.J.; Nakai, K. WoLF PSORT: Protein localization predictor. Nucleic Acids Res. 2007, 35, W585–W587. [Google Scholar] [CrossRef] [Green Version]
  71. Krogh, A.; Larsson, B.; von Heijne, G.; Sonnhammer, E.L. Predicting transmembrane protein topology with a hidden Markov model: Application to complete genomes. J. Mol. Biol. 2001, 305, 567–580. [Google Scholar] [CrossRef] [Green Version]
  72. Hu, B.; Jin, J.; Guo, A.Y.; Zhang, H.; Luo, J.; Gao, G. GSDS 2.0: An upgraded gene feature visualization server. Bioinformatics 2015, 31, 1296–1297. [Google Scholar] [CrossRef] [Green Version]
  73. Bailey, T.L.; Boden, M.; Buske, F.A.; Frith, M.; Grant, C.E.; Clementi, L.; Ren, J.; Li, W.W.; Noble, W.S. MEME SUITE: Tools for motif discovery and searching. Nucleic Acids Res. 2009, 37, W202–W208. [Google Scholar] [CrossRef] [PubMed]
  74. Bailey, T.L.; Elkan, C. Fitting a mixture model by expectation maximization to discover motifs in biopolymers. In Proceedings of the 2nd International Conference on Intelligent Systems for Molecular Biology, Stanford, CA, USA, 14–17 August 1994; pp. 28–36. [Google Scholar]
  75. Marchler-Bauer, A.; Bryant, S.H. CD-Search: Protein domain annotations on the fly. Nucleic Acids Res. 2004, 32, W327–W331. [Google Scholar] [CrossRef] [PubMed]
  76. Rozas, J.; Ferrer-Mata, A.; Sanchez-DelBarrio, J.C.; Guirao-Rico, S.; Librado, P.; Ramos-Onsins, S.E.; Sanchez-Gracia, A. DnaSP 6: DNA Sequence Polymorphism analysis of large data sets. Mol. Biol. Evol. 2017, 34, 3299–3302. [Google Scholar] [CrossRef]
  77. Lescot, M.; Déhais, P.; Thijs, G.; Marchal, K.; Moreau, Y.; Van de Peer, Y.; Rouzé, P.; Rombauts, S. PlantCARE, a database of plant cis-acting regulatory elements and a portal to tools for in silico analysis of promoter sequences. Nucleic Acids Res. 2002, 30, 325–327. [Google Scholar] [CrossRef]
  78. Broughton, W.J.; Dilworth, M.J. Control of leghaemoglobin synthesis in snake beans. Biochem. J. 1971, 125, 1075–1080. [Google Scholar] [CrossRef] [PubMed] [Green Version]
  79. Guo, D.; Liang, J.; Li, L. Abscisic acid (ABA) inhibition of lateral root formation involves endogenous ABA biosynthesis in Arachis hypogaea L. Plant Growth Regul. 2009, 58, 173–179. [Google Scholar] [CrossRef]
  80. Finkelstein, R.R.; Lynch, T.J. The Arabidopsis abscisic acid response gene ABI5 encodes a basic leucine zipper. Plant Cell 2000, 12, 599–609. [Google Scholar] [CrossRef] [Green Version]
  81. Wang, Y.; Wang, L.; Zou, Y.; Chen, L.; Cai, Z.M.; Zhang, S.L.; Zhao, F.; Tian, Y.P.; Jiang, Q.; Ferguson, B.J.; et al. Soybean miR172c targets the repressive AP2 transcription factor NNC1 to activate ENOD40 expression and regulate nodule initiation. Plant Cell 2014, 26, 4782–4801. [Google Scholar] [CrossRef] [Green Version]
  82. Ji, H.; Xiao, R.; Lyu, X.; Chen, J.; Zhang, X.; Wang, Z.; Deng, Z.; Wang, Y.; Wang, H.; Li, R.; et al. Differential light-dependent regulation of soybean nodulation by papilionoid-specific HY5 homologs. Curr. Biol. 2022, 32, 783–795. [Google Scholar] [CrossRef]
  83. Jian, B.; Liu, B.; Bi, Y.; Hou, W.; Wu, C.; Han, T. Validation of internal control for gene expression study in soybean by quantitative real-time PCR. BMC Mol. Biol. 2008, 9, 59. [Google Scholar] [CrossRef] [Green Version]
Figure 1. Conserved protein motifs and conserved domain analysis of AMTs in soybean and Arabidopsis. (A) An unrooted phylogenetic tree was constructed by MEGA X software using the maximum-likelihood method. The blue and red branches represent the AMT2 and AMT1 subfamilies, respectively. (B) Conserved motif analysis of AMT amino acid sequences by the MEME online website. Different colors represent different motifs. (C) Conserved domain analysis of AMT proteins by the NCBI CD-search tool.
Ijms 24 03991 g001
Figure 2. Chromosomal distribution analysis of GmAMT genes. The genome visualization tool of TBtools was used to map the chromosomal distribution of GmAMT genes. The colors of the bars indicate soybean chromosomes, and the color gradients in chromosomes represent gene density. Gene names were marked on each chromosome. GmAMT1 and GmAMT2 subfamily genes are highlighted with red and blue colors, respectively. The scale bar is presented on the left side.
Ijms 24 03991 g002
Figure 3. Synteny analysis of AMT genes among Arabidopsis, soybean and Medicago. One Step MCScanX on TBtools was used to analyse gene duplication. Grey lines in the background indicate the collinear blocks within the genomes of soybean, Arabidopsis and Medicago. The blue lines indicate the syntenic AMT gene pairs.
Ijms 24 03991 g003
Figure 4. Gene structures and promoter-conserved motif analysis of the AMT family in soybean and Arabidopsis. (A) Phylogenetic tree analysis of AMTs in Arabidopsis and soybean. Maximum-likelihood trees were constructed by MEGA-X software with 1000-fold bootstrap resampling. The red and blue branches represent the AMT1 and AMT2 subfamilies, respectively. (B) Gene structure analysis of AMT genes by the GSDS 2.0 online website. The yellow boxes represent CDS regions, blue boxes represent UTR regions, and black lines represent intron regions. (C) The conserved motifs of AMT promoters in soybean and Arabidopsis were analyzed by the MEME website. Different colors represent different conserved motifs. The 2 kb promoters of AMT genes in soybean and Arabidopsis were obtained from the Phytozome database.
Ijms 24 03991 g004
Figure 5. Cis-element analysis of GmAMT promoters. Sequences 2 kb upstream of the transcription initiation site were downloaded from Phytozome and used to analyze the cis-elements. (A) The cis-acting elements of 16 AMT promoters in soybean were analyzed by PlantCARE website. (B) Cis-acting element analysis of nodule specificity and NIN-binding sites in GmAMT promoters. Cis-acting elements with similar regulatory functions are indicated by the same color.
Ijms 24 03991 g005
Figure 6. Heatmap of GmAMT expression in different tissues using RNA-seq data. The RNA-seq data were downloaded from the Soybean Expression Atlas website [44]. The color scale represents the normalized TPM value.
Ijms 24 03991 g006
Figure 7. Day–night variations in gene expression of GmAMT family genes by RNA-seq data. The FPKM data of GmAMT genes were collected from the JGI Plant Gene Atlas [45]. The day–night expression patterns of GmAMTs in leaves (A) and nodules (B). Dark periods are highlighted as shaded columns.
Ijms 24 03991 g007
Figure 8. Expression patterns of GmAMTs in response to different forms of nitrogen treatment based on RNA-seq data. The GmAMT data were collected from the JGI Plant Gene Atlas [45] and shown by heatmaps with clustering created based on the normalized FPKM values of GmAMT genes in roots (A) and leaves (B). The white color represents NA (not available).
Ijms 24 03991 g008
Figure 9. Gene expression analysis of GmAMTs in different tissues and in response to different nitrogen treatments by RT-qPCR. (AH) Detection of GmAMT expression in leaves, stems, roots, and nodules at 24 days after rhizobial inoculation. The expression patterns of GmAMTs were analyzed in roots (IL) and leaves (MP) under different nitrogen sources (NH4+-ammonium nitrogen, NO3-nitrate nitrogen, No-N: nitrogen free BD solution) and concentrations (1 mM and 5 mM) at 1 day (blue bars) or 3 days (red bars). GmELF1b was used as a reference gene. The relative gene expression levels were calculated using the method of 2-ΔΔCq to express the ratio between the GmAMTs and reference GmELF1B. The data were analyzed using student’s t-test for significant differences (*, p < 0.05; **, p < 0.01; ***, p < 0.001; ****, p < 0.0001). Different letters represent significant differences (Tukey’s test, p < 0.05).
Ijms 24 03991 g009
Figure 10. Gene expression analysis of GmAMTs in response to exogenous ABA treatment. RT-qPCR was used to analyze the expression of GmAMTs in roots treated with 50 μM ABA for 1 and 3 h. GmABI5b was used as a positive control. GmELF1b was used as a reference gene. The data were analyzed using student’s t-test for statistically significant differences (*, p < 0.05; **, p < 0.01; ***, p < 0.001; ****, p < 0.0001; ns, no significance).
Ijms 24 03991 g010
Figure 11. Effect of GmNINa on the expression levels of GmAMT genes. Detection of GmAMTs expression was done by RT-qPCR in hairy roots with empty vector (EV), 35S:GmNINa (GmNINa-OE) or 35S:GmNINa-SRDX (GmNINa-SRDX) at 3 days after rhizobial inoculation. The normalization was performed using GmELF1b. The statistically significant differences between groups were analyzed using student’s t-test (*, p < 0.05; **, p < 0.01; ***, p < 0.001; ****, p < 0.0001; ns, No significance).
Ijms 24 03991 g011
Disclaimer/Publisher’s Note: The statements, opinions and data contained in all publications are solely those of the individual author(s) and contributor(s) and not of MDPI and/or the editor(s). MDPI and/or the editor(s) disclaim responsibility for any injury to people or property resulting from any ideas, methods, instructions or products referred to in the content.

