Article

Genome-Wide Identification, Characterization, and Expression Analysis of SPIRAL1 Family Genes in Legume Species

1
Department of Grassland Science, College of Forestry and Landscape Architecture, South China Agricultural University, Guangzhou 510642, China
2
College of Life Sciences, South China Agricultural University, Guangzhou 510642, China
3
Guangdong Subcenter of the National Center for Soybean Improvement, College of Agriculture, South China Agricultural University, Guangzhou 510642, China
4
Guangdong Laboratory for Lingnan Modern Agriculture, Guangzhou 510642, China
*
Authors to whom correspondence should be addressed.
These authors contributed equally to this work.
Int. J. Mol. Sci. 2023, 24(4), 3958; https://doi.org/10.3390/ijms24043958
Submission received: 14 January 2023 / Revised: 2 February 2023 / Accepted: 6 February 2023 / Published: 16 February 2023
(This article belongs to the Section Molecular Plant Sciences)

Abstract

:
The SPIRAL1 (SPR1) gene family encodes microtubule-associated proteins that are essential for the anisotropic growth of plant cells and abiotic stress resistance. Currently, little is known about the characteristics and roles of the gene family outside of Arabidopsis thaliana. This study intended to investigate the SPR1 gene family in legumes. In contrast to that of A. thaliana, the gene family has undergone shrinking in the model legume species Medicago truncatula and Glycine max. While the orthologues of SPR1 were lost, very few SPR1-Like (SP1L) genes were identified given the genome size of the two species. Specifically, the M. truncatula and G. max genomes only harbor two MtSP1L and eight GmSP1L genes, respectively. Multiple sequence alignment showed that all these members contain conserved N- and C-terminal regions. Phylogenetic analysis clustered the legume SP1L proteins into three clades. The SP1L genes showed similar exon-intron organizations and similar architectures in their conserved motifs. Many essential cis-elements are present in the promoter regions of the MtSP1L and GmSP1L genes associated with growth and development, plant hormones, light, and stress. The expression analysis revealed that clade 1 and clade 2 SP1L genes have relatively high expression in all tested tissues in Medicago and soybean, suggesting their function in plant growth and development. MtSP1L-2, as well as clade 1 and clade 2 GmSP1L genes, display a light-dependent expression pattern. The SP1L genes in clade 2 (MtSP1L-2, GmSP1L-3, and GmSP1L-4) were significantly induced by sodium chloride treatment, suggesting a potential role in the salt-stress response. Our research provides essential information for the functional studies of SP1L genes in legume species in the future.

1. Introduction

Microtubules (MTs) are one of the three major cytoskeletal elements in eukaryotic cells. Microtubules are composed of α- and β-tubulin dimers. Typically, 13 protofilaments assemble into tubular microtubule structures [1]. Microtubules perform essential roles in many aspects of a plant cell, including cell division, directional cell expansion, formation of cell walls, and morphogenesis. For instance, cortical MTs, which are anchored to the inner surface of a plasma membrane during interphase, played an important role in defining the final shape of differentiated plant cells by guiding cellulose microfibril deposition and controlling anisotropic cell expansion [2,3,4,5,6,7,8]. Similar to other eukaryotes, the structure of plant MTs is modulated not only by various developmental cues, but also by environmental signals and stress conditions [9,10,11]. Rearrangement of cortical MT arrays has been observed after pathogen attack or exposure to extreme temperature, dehydration, and hyper salinity, indicating the great importance of MTs in biotic and abiotic stresses [12,13,14,15,16,17].
SPIRAL1 (SPR1; At2g03680) is a plant-specific MT-associated protein (MAP) belonging to a six-member family with overlapping functions in Arabidopsis thaliana [18,19,20,21]. In A. thaliana cells, SPR1 is localized to the MT lattice and partially accumulates at the growing plus ends of MTs, forming an extended comet that is much longer than the END BINDING1 (EB1) comet [19,22]. The spr1 mutant shows right-handed helical growth in roots and etiolated hypocotyls, and it exhibits an abnormal cortical MT array with a left-handed helical pitch [21]. The six SPR1 family genes in A. thaliana share high sequence similarity in the N- and C-terminal regions, and they act redundantly in maintaining anisotropic growth in rapidly elongating cells [18]. In addition to its roles in regulating plant development, SPR1 also plays a key role in the response to abiotic stress-induced MT disassembly [10,11]. SPR1 is degraded by the 26S proteasome, and its degradation rate is accelerated in response to salt stress, thus facilitating MT disassembly and new MT network formation for better survival in high salinity conditions [11]. In addition, SPR1 is also involved in the response to drought stress. SPR1 acts as the phosphorylated substrate of OPEN STOMATA 1 (OST1), facilitates microtubule disassembly in guard cells, and sequentially avoids water loss by controlling stomatal closure [10].
The legume family (Leguminosae) is one of the largest families of Angiosperms, with more than 19,500 species [23,24]. Many legumes are important food crops, providing highly nutritious sources of protein and micronutrients for human beings. Soybean (Glycine max) is a worldwide important crop legume that contains significant amounts of protein, oil, and micronutrients. Medicago truncatula is a close relative of alfalfa (M. sativa), the famous forage legume. Currently, soybean and M. truncatula have been used as models for understanding growth and development in legumes.
In this study, the SPR1 family genes were identified in Leguminosae and analyzed in two species, M. truncatula and G. max. Multiple sequence alignment, phylogenetic relationships, gene structure, protein motifs, cis-acting elements, protein folding, chromosome location, and collinearity were systematically analyzed. The expression of SPR1-Likes (SP1Ls) in different organs and tissues was analyzed in M. truncatula and G. max grown in white-light and dark conditions. To explore the role of legume SP1Ls in the saline stress response, we also analyzed the expression of SP1Ls in response to salt stress in M. truncatula and G. max. We found that clade 1 and clade 2 SP1Ls are substantially expressed in all tested tissues of Medicago and soybean and display a light-dependent expression pattern. Additionally, clade 2 SP1Ls were significantly induced by saline stress.

2. Results

2.1. Identification and Phylogenetic Analysis of SPIRAL1-like (SP1L) Genes in Legume Species

A total of 126 SP1L-related sequences were obtained from 29 species of Leguminosae. The characteristics of the identified proteins, including chromosome location, CDS and protein length, molecular weight (MW), and isoelectric point (pI), are listed in Supplementary Table S1. Based on the current genome annotation, the number of SP1L members ranged from one (Vigna radiata) to eleven (G. dolichocarpa). Protein sequence lengths ranged from 69 (Glydo.01G000671) to 177 (Phalu.04G0000041500) amino acids, corresponding to MWs of between 6.60 kDa and 18.34 kDa, with an average of 11.09 kDa. The pIs varied from 4.47 (Aradu_6Y48C, Arahy_J0K3K7, Arahy_W61CSA, and Araip_5XB02) to 9.78 (Cerca_209S17695). All the data suggested a high variability among SP1L genes in the legume species genomes. Sequence-based phylogenetic analysis showed that the Leguminosae SP1L proteins were grouped into three distinct clusters (Figure 1). The two SP1Ls in M. truncatula are grouped in clade 1 (MtSP1L-1) and clade 2 (MtSP1L-2), respectively. G. max has eight SP1L candidates which are distributed in all three clades as follows: GmSP1L-1 and GmSP1L-2 belong to clade 1, GmSP1L-3 and GmSP1L-4 belong to clade 2, and GmSP1L-5 to GmSP1L -8 belong to clade 3. The length of the predicted proteins of MtSP1Ls and GmSP1Ls varied from 104 to 139 aa and 87 to 130 aa, respectively. The pI values of the two MtSP1Ls were 9.16 and 9.26, and they displayed a wider range in soybean (Table 1). The corresponding MWs of MtSP1Ls and GmSP1Ls ranged from 1.01 to 1.36 and from 0.92 to 1.24 kDa, respectively.
In order to clarify the orthologous relationship among AtSP1Ls, MtSP1Ls, and GmSP1Ls, we performed maximum likelihood (ML) phylogenetic analyses for the SP1L genes from A. thaliana, M. truncatula, and G. max (Supplementary Figure S1). Consistent with the phylogenetic relationships illustrated in Figure 1, all the legume SP1Ls were grouped into three clusters. With the bootstrap support value of 0.945, AtSP1L-5 of A. thaliana was grouped into clade 3, which also contained GmSP1L-5, GmSP1L-6, GmSP1L-7, and GmSP1L-8. However, the other five AtSP1L genes were located relatively far from the legume SP1Ls in the phylogenetic distance and were not able to cluster with the legume genes (Figure 1 and Supplementary Figure S1).

2.2. Multiple Sequence Alignment of SP1L Genes in Medicago, Soybean, and Arabidopsis

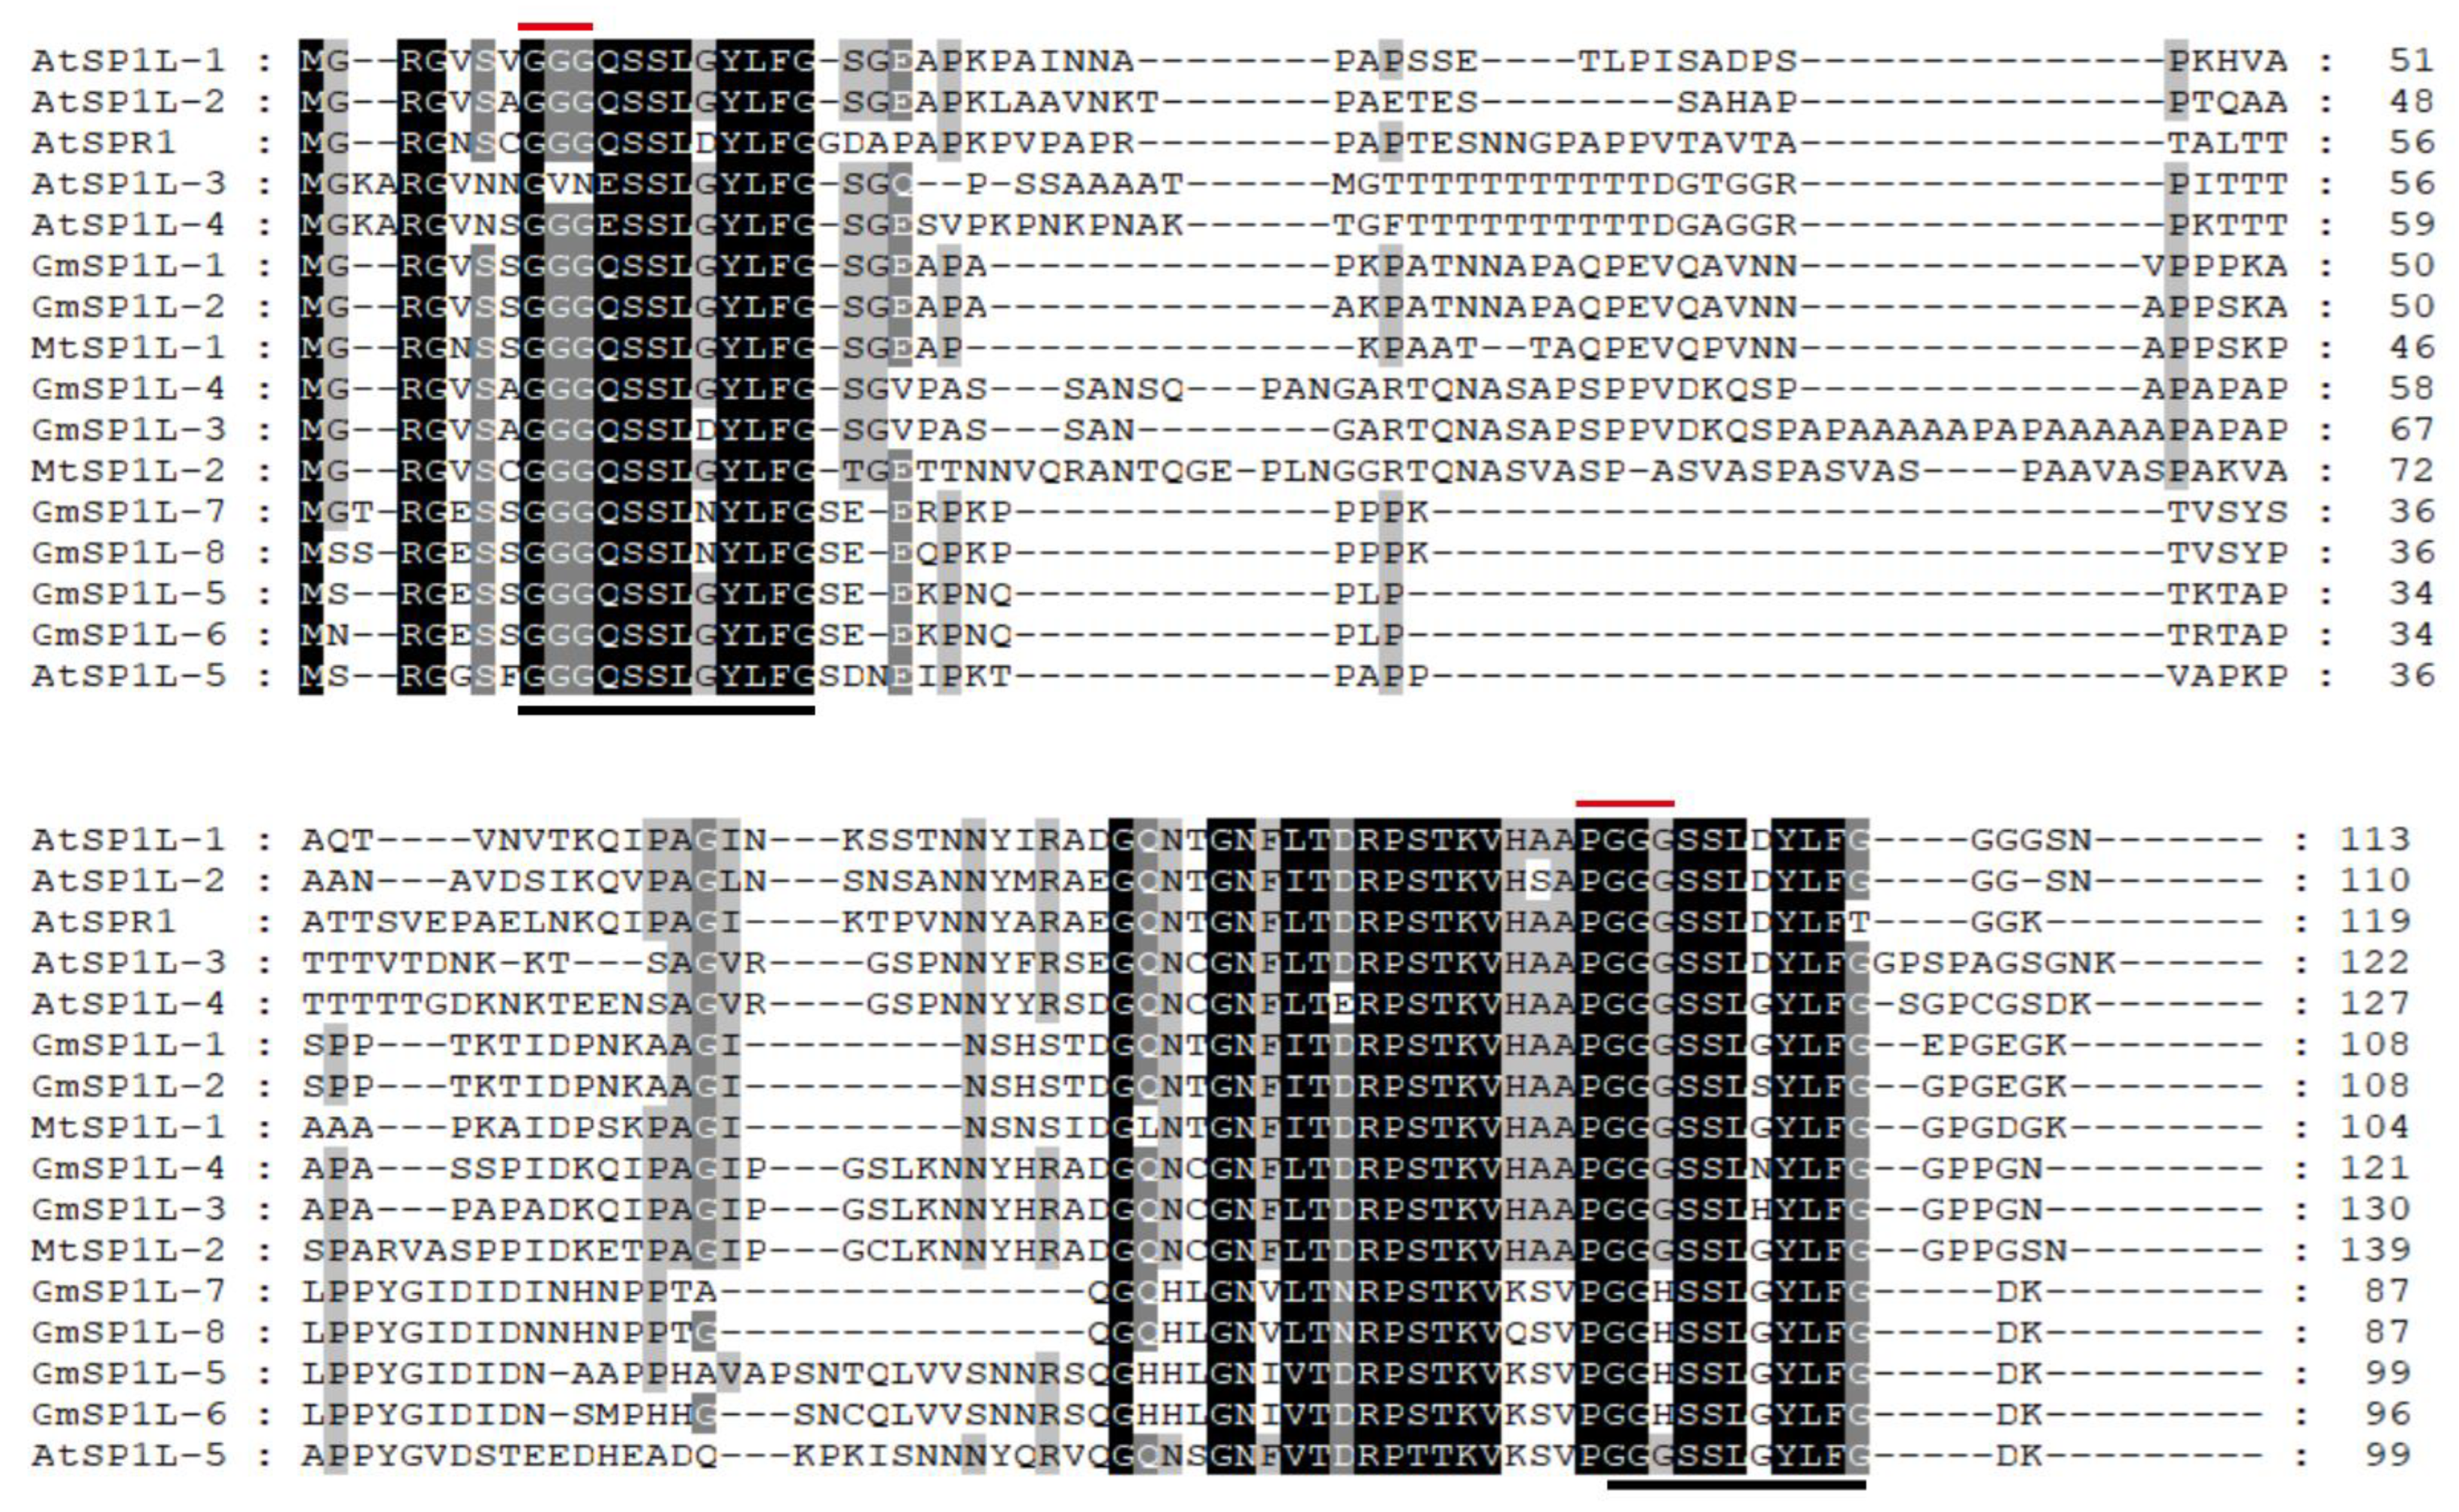
To further investigate the conserved regions of the SP1L proteins, multiple protein sequence alignments were conducted. The SP1L proteins in M. truncatula and G. max shared high sequence similarity with the AtSP1Ls in the N- and C-terminal regions, whereas the central sequences were poorly conserved (Figure 2). Further, a highly conserved direct repeat sequence was present at the N-terminal and C-terminal ends of the MtSP1L and GmSP1L proteins, with the consensus motif being GG(G/H)(Q/-)SSL(G/D/N/S/H)YLFG (Figure 2, underlined with solid lines). At the N-terminal and C-terminal of these two direct repeat sequences, a Gly-Gly-Gly (GGG) motif and a Pro-Gly-Gly-Gly (PGGG) motif were present, and these are likely responsible for MT binding in many mammalian MAPs [20,25]. These results indicate that a similar pattern of conservation exists between the Brassicaceae SP1L and Leguminosae homologs.
The secondary structures of the AtSP1L, MtSP1L, and GmSP1L proteins were predicted. The results showed that the SPR1L genes in these three species all showed very simple 2D structures (Supplementary Table S2). Only AtSPR1, AtSPR5, MtSP1L-1, and GmSP1L-4 had alpha helices, ranging from 3.31–8.4%. The extended strands found in AtSP1L-3 (16.39%) and AtSP1L-4 (14.17%) were absent in the MtSP1L and GmSP1L proteins. The 310-helices were found in some SP1L proteins of A. thaliana and G. max (AtSP1l-2, AtSP1L-4, AtSP1L-5, and GmSP1L-1), ranging from 2.36–4.04%, but they were absent in the MtSP1Ls. Other than that, the rest of the regions took up a great proportion of the SP1L proteins, which were composed of turns (8.05–22.13%), bend regions (8.2–16.09%), and other states (53.28–77.08%). Furthermore, the 3D structures of the six AtSP1L, two MtSP1L, and eight GmSP1L proteins were predicted using AlphaFold2 [26], and they are shown in Supplementary Figure S2. The five obtained AlphaFold models of each SP1L protein displayed a similar folding pattern. These results show that genes in the same clades share a great similarity in terms of protein configuration, which implies a similar functions of these proteins.

2.3. Analysis of Gene Structure and Conserved Motifs in SP1L Genes

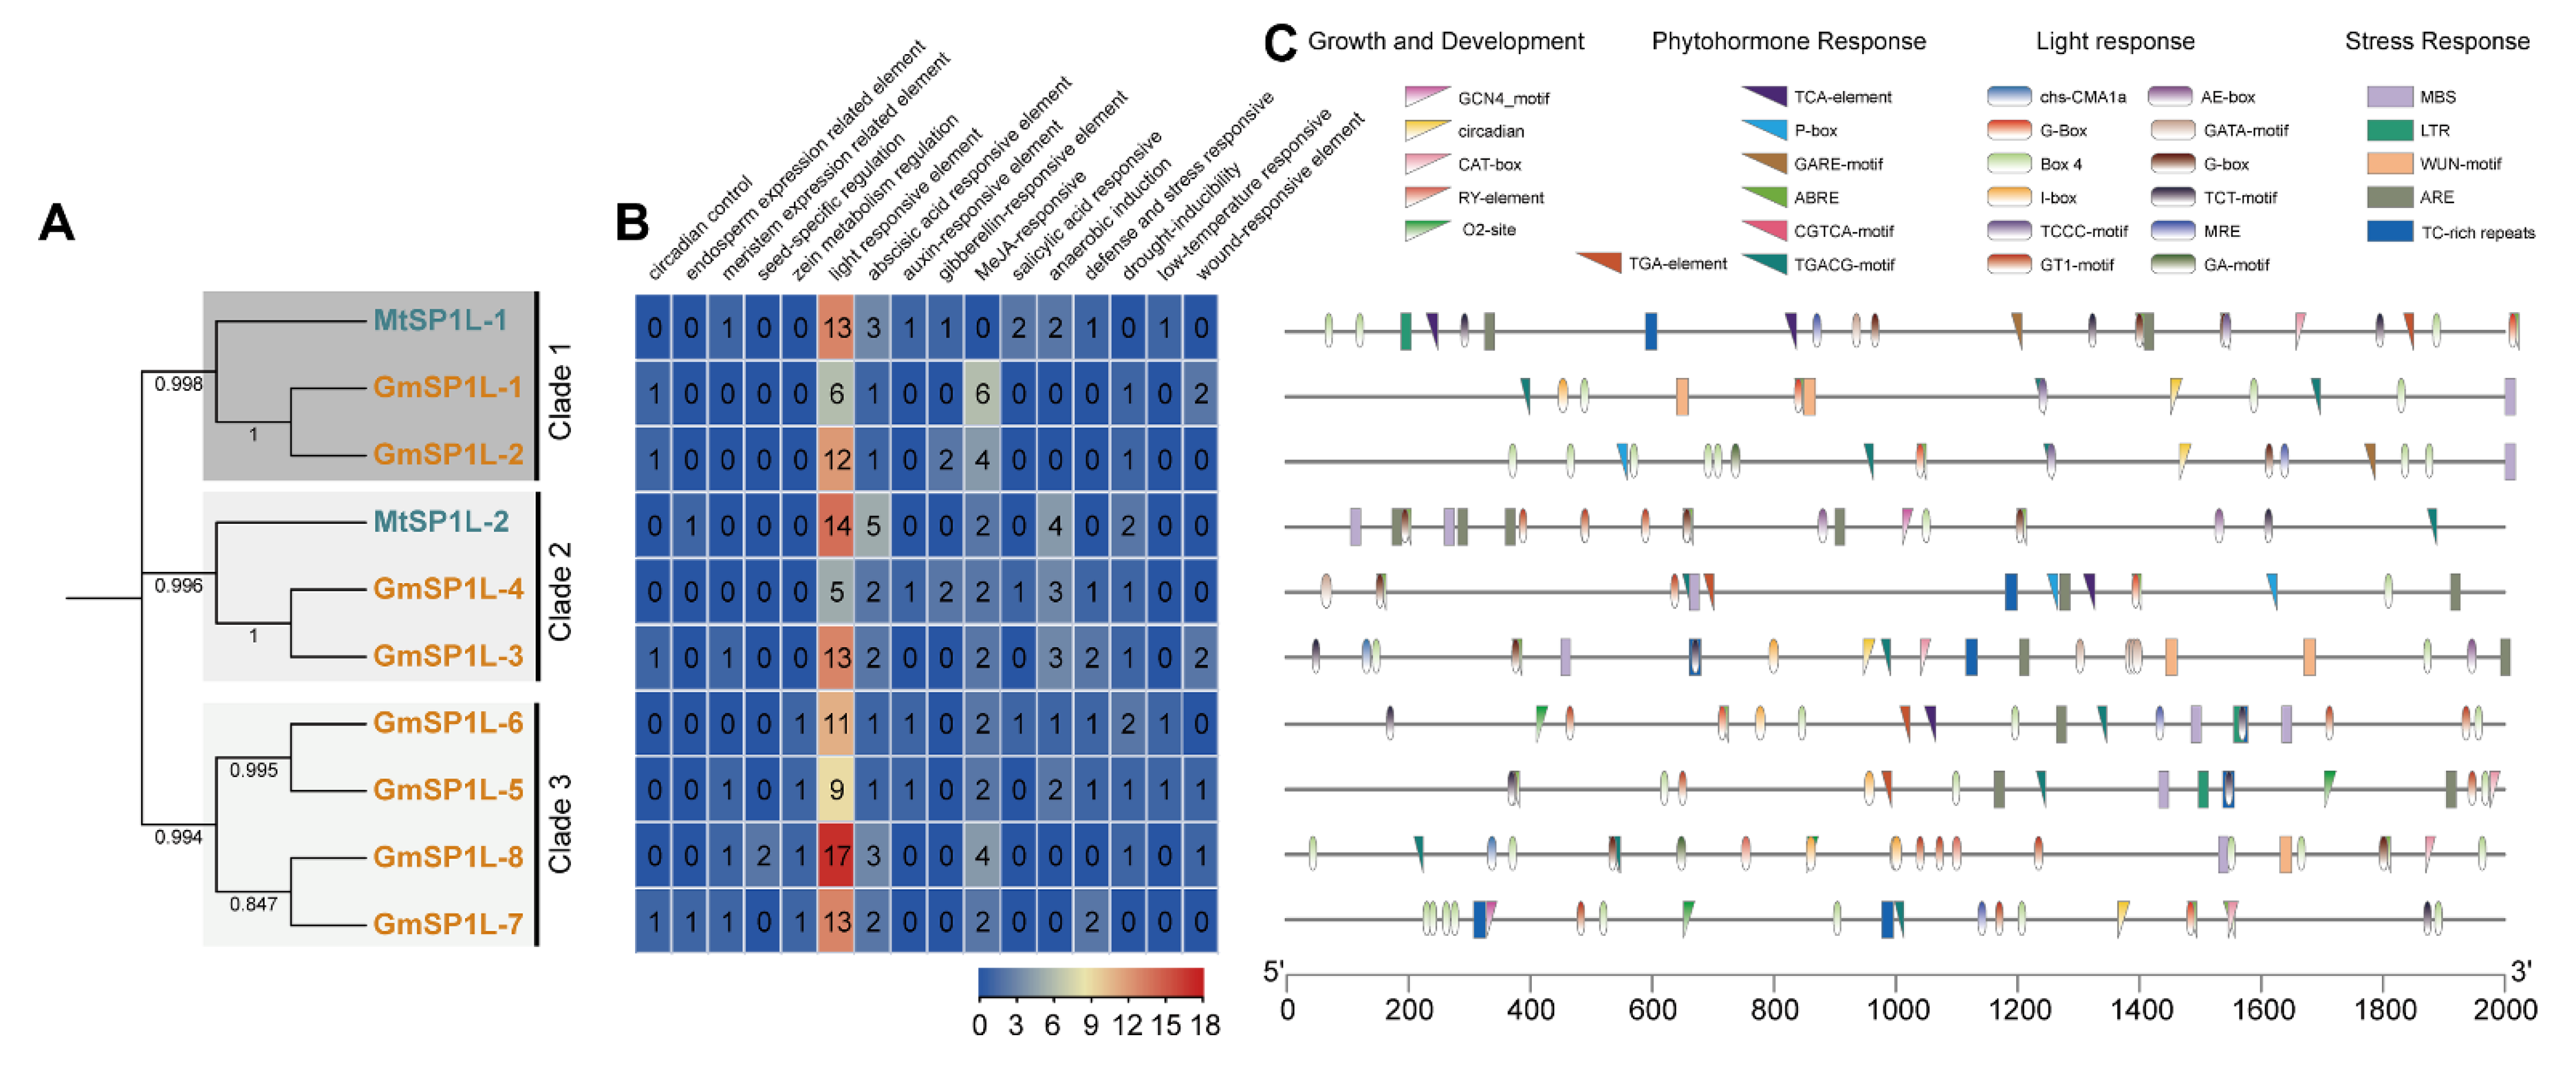
We next analyzed the gene structure and conserved motifs for the identified SP1L genes. As shown in Figure 3, the genes of the MtSP1Ls and GmSP1Ls all had one intron and two exons, which was consistent with those in the AtSP1Ls (Figure 3B). These results demonstrated that the AtSP1Ls, MtSP1Ls, and GmSP1Ls exhibited conserved intron/exon structures.
Five conserved motifs in the SP1L proteins of A. thaliana, M. truncatula, and G. max were identified (Supplementary Figure S3), and their positions are shown in Figure 3C. Most of them had similar motif positions and types. All SP1L members contained motifs 1 and 2. Three members of clade 1 and GmSP1L-3 and GmSP1L-4 in clade 2 contained an additional motif 3, whereas GmSP1L-5 and GmSP1L-6 in clade 3 contained motif 4. The proteins that shared similar motif compositions are likely to have the same gene functions.

2.4. Analyses of the Chromosomal Distribution and Synteny in the SP1L Genes in Medicago and Soybean

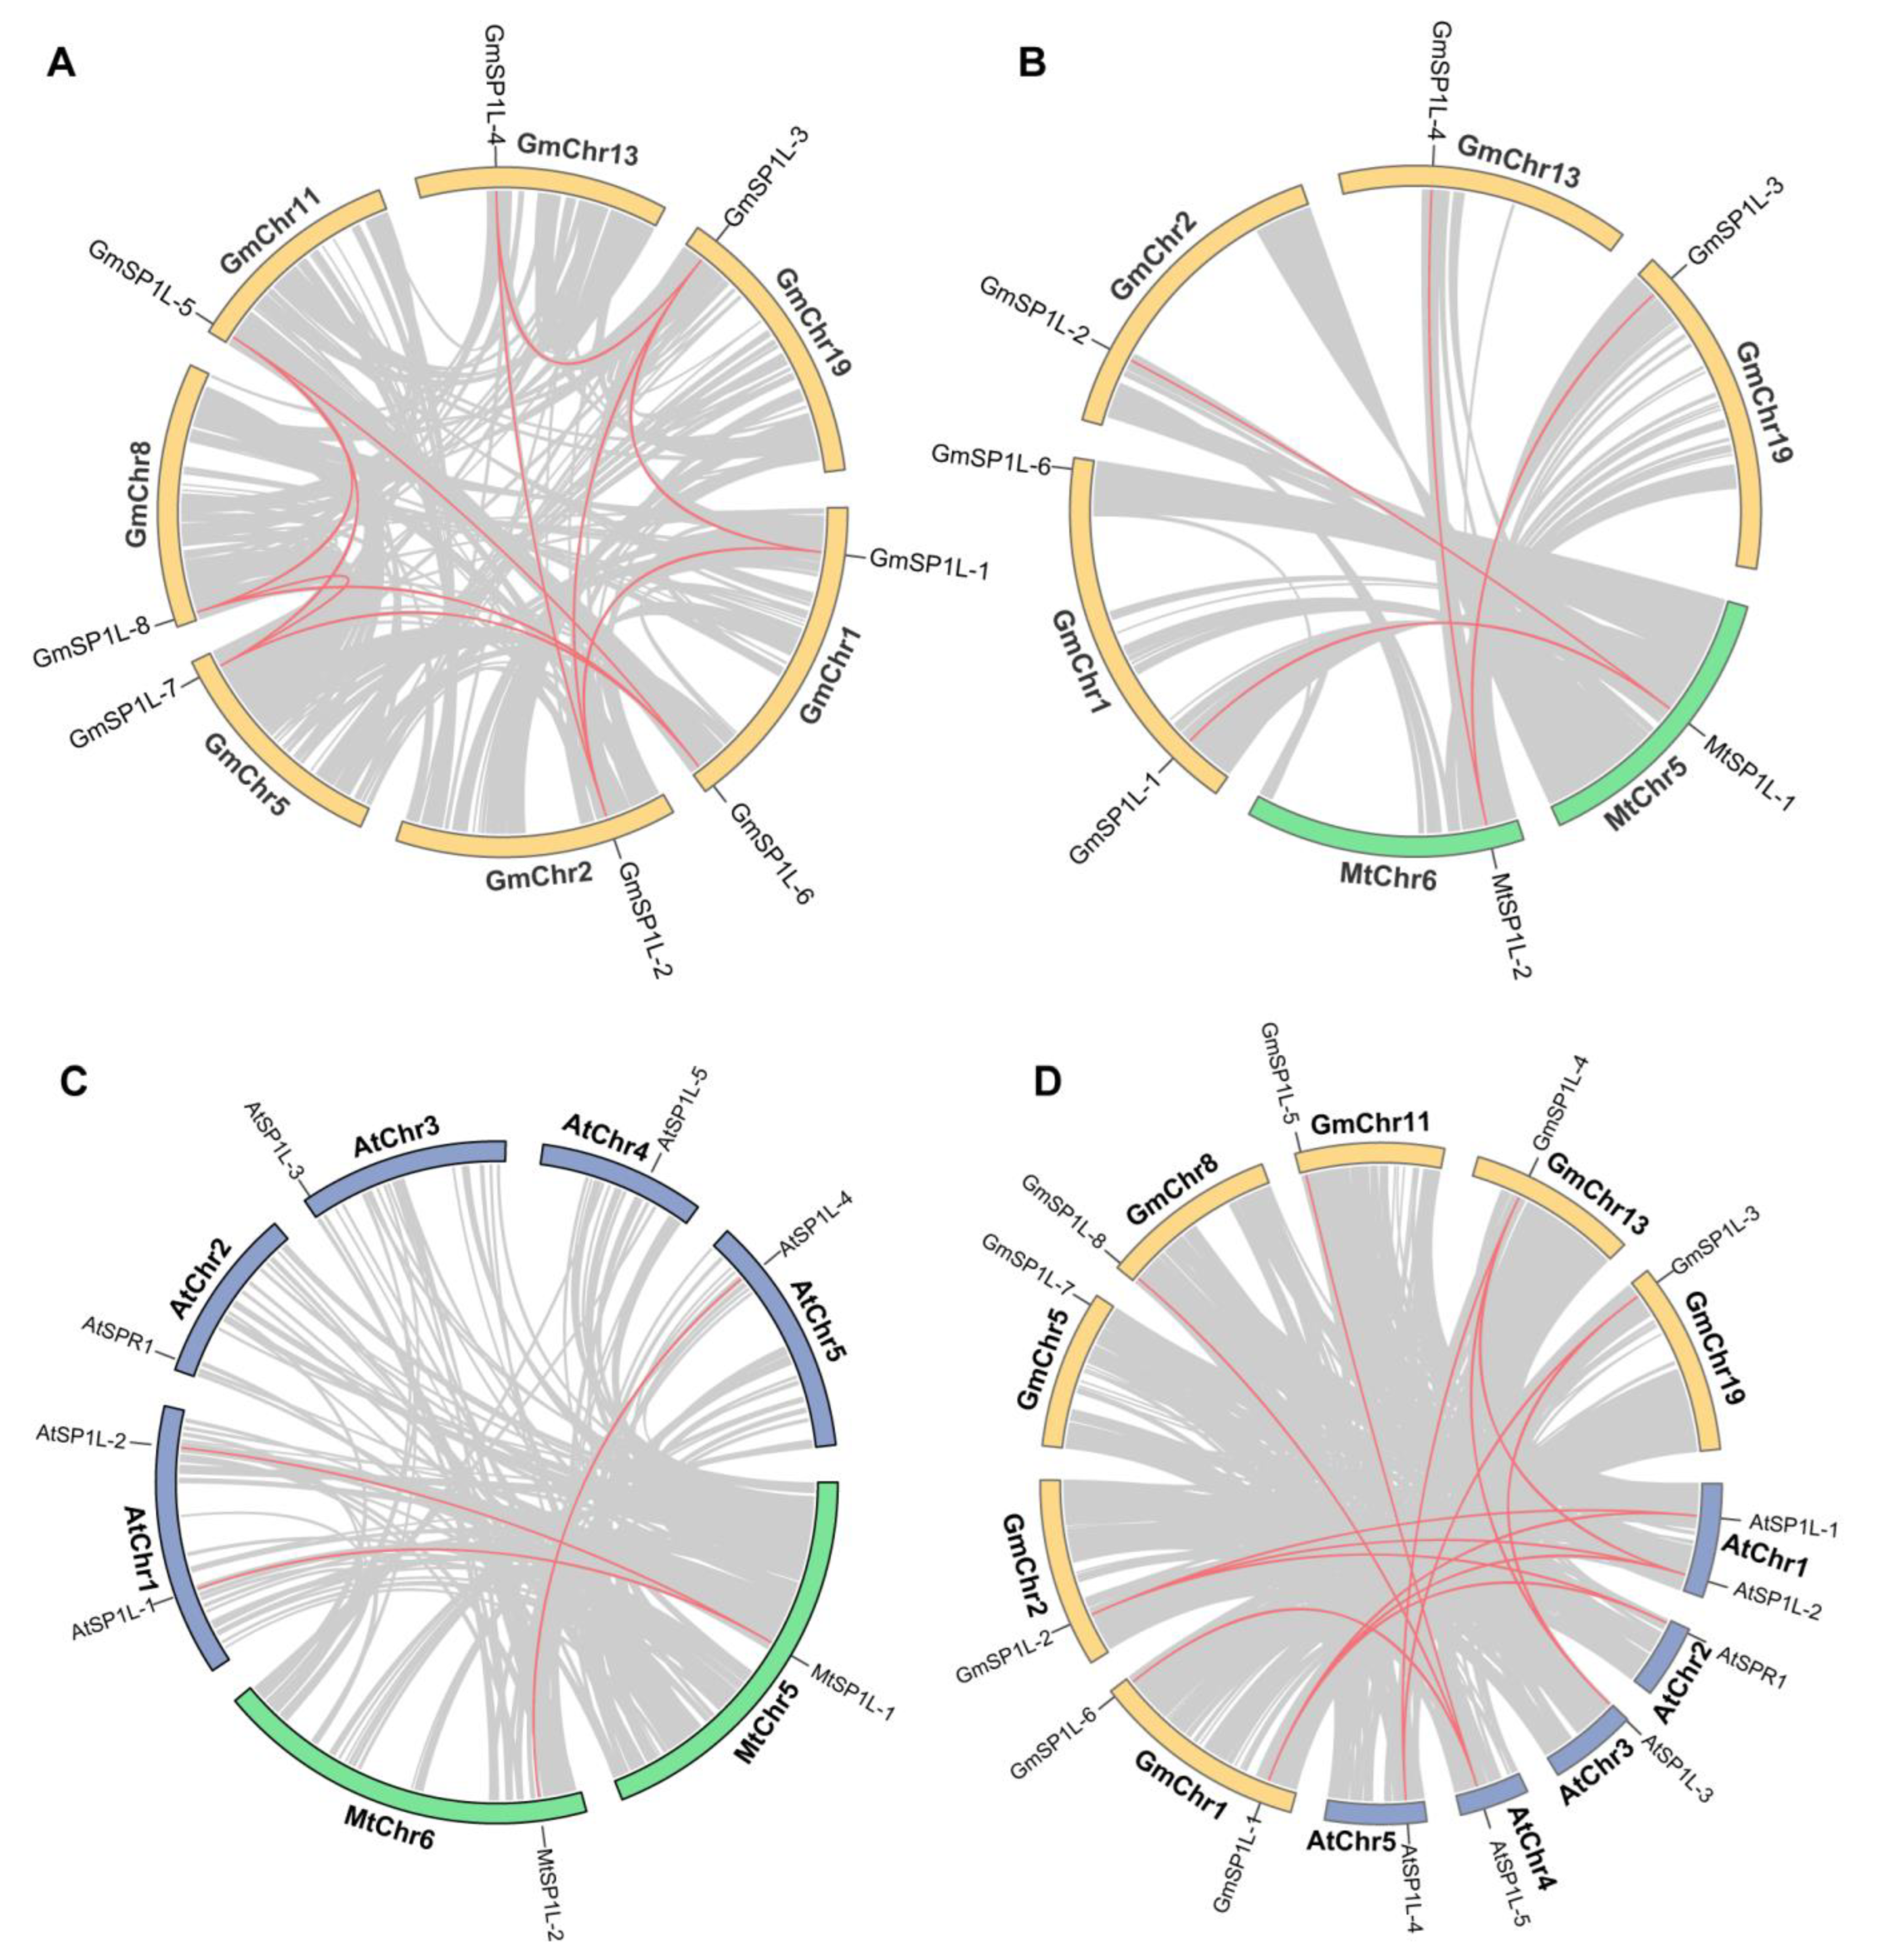
As illustrated in Figure 4A, eight GmSP1L genes were disproportionately distributed across the seven chromosomes of G. max. GmSP1L-1 and GmSP1L-6 were distributed on the same chromosome (Chr1), while other homologous genes were distributed on six different chromosomes (Chr2, 5, 8, 11, 13, and 19). In M. truncatula, the two SP1L homologous genes were distributed on Chr5 and Chr6, respectively (Figure 4B).
Syntenic blocks within the G. max genome were examined to identify relationships among the GmSP1L genes and potential gene duplication events. Eleven gene pairs were found in the G. max genome, and they were located on different chromosomes (Figure 4A), indicating that segmental duplications in these regions likely contributed to the expansion of the GmSP1L family.
Three comparative syntenic maps of the SP1L genes were constructed at the genome-wide level across the three species (M. truncatula, G. max, and A. thaliana) (Figure 4B–D). Four syntenic gene pairs were identified between M. truncatula and G. max: MtSP1L-1 is the orthologous gene of GmSP1L-1 and GmSP1L-2, and MtSP1L-2 is the orthologous gene of GmSP1L-3 and GmSP1L-4 (Figure 4B). These orthologous pairs may have existed before the ancestral divergence. A total of only three syntenic gene pairs were identified between Arabidopsis and M. truncatula: MtSP1L-1 is homologous to AtSP1L-1 and AtSP1L-2, while MtSP1L-2 is homologous to AtSP1L-4 (Figure 4C). In addition, 14 pairs of syntenic genes were found between the genome of G. max and A. thaliana, as shown in Figure 4D.

2.5. Analysis of the Cis-Elements in the Promoter Sequences of the SP1L Genes in Medicago and Soybean

The cis-acting elements are important for the binding of transcription factors, which control the expression of their downstream target genes. The promoter sequences of 2000 bp for the two MtSP1L and eight GmSP1L genes were analyzed. A total of 231 putative cis-acting elements were identified in the promoter regions of these SP1L genes (Supplementary Table S3). Overall, the promoters of the MtSP1L and GmSP1L genes contained various cis-acting elements with different numbers. All these identified cis-elements were classified into four groups based on their participation in various biological processes: plant growth and development (17), phytohormone responsive (60), light-responsive (113), and stress-responsive (41) (Figure 5 and Supplementary Table S3). Compared to the other three groups, light-responsive-related cis-acting elements (i.e., G-box, Box 4, and the TCT motif) were found at a very high frequency in all Mt and Gm SP1L genes (Figure 5B), indicating that these genes’ expression and function may be light-dependent. In addition, several stress-related promoter regions were also identified in the Mt and Gm SP1L genes, including anaerobic induction (15), wound induction (5), drought (10), low-temperature (3), and defense (8). Moreover, the primary factors related to growth and development included meristem-related (5), seed-related (2), circadian-related (4), zein metabolism-related (4), and endosperm expression (2) cis-acting elements, and the hormone-related elements included methyl jasmonate (MeJA) (26), abscisic acid (ABA) (21), ethylene (81), gibberellin (GA) (5), salicylic acid (SA) (4), and auxin (4) -responsive regulators, which were also identified in the MtSP1Ls and GmSP1Ls promoters. These results suggest that various cis-acting promoter elements may regulate the expression of the MtSP1L and GmSP1L genes during plant growth and stress responses.

2.6. Expression Patterns of SP1L Genes in Various Tissues of M. truncatula and G. max

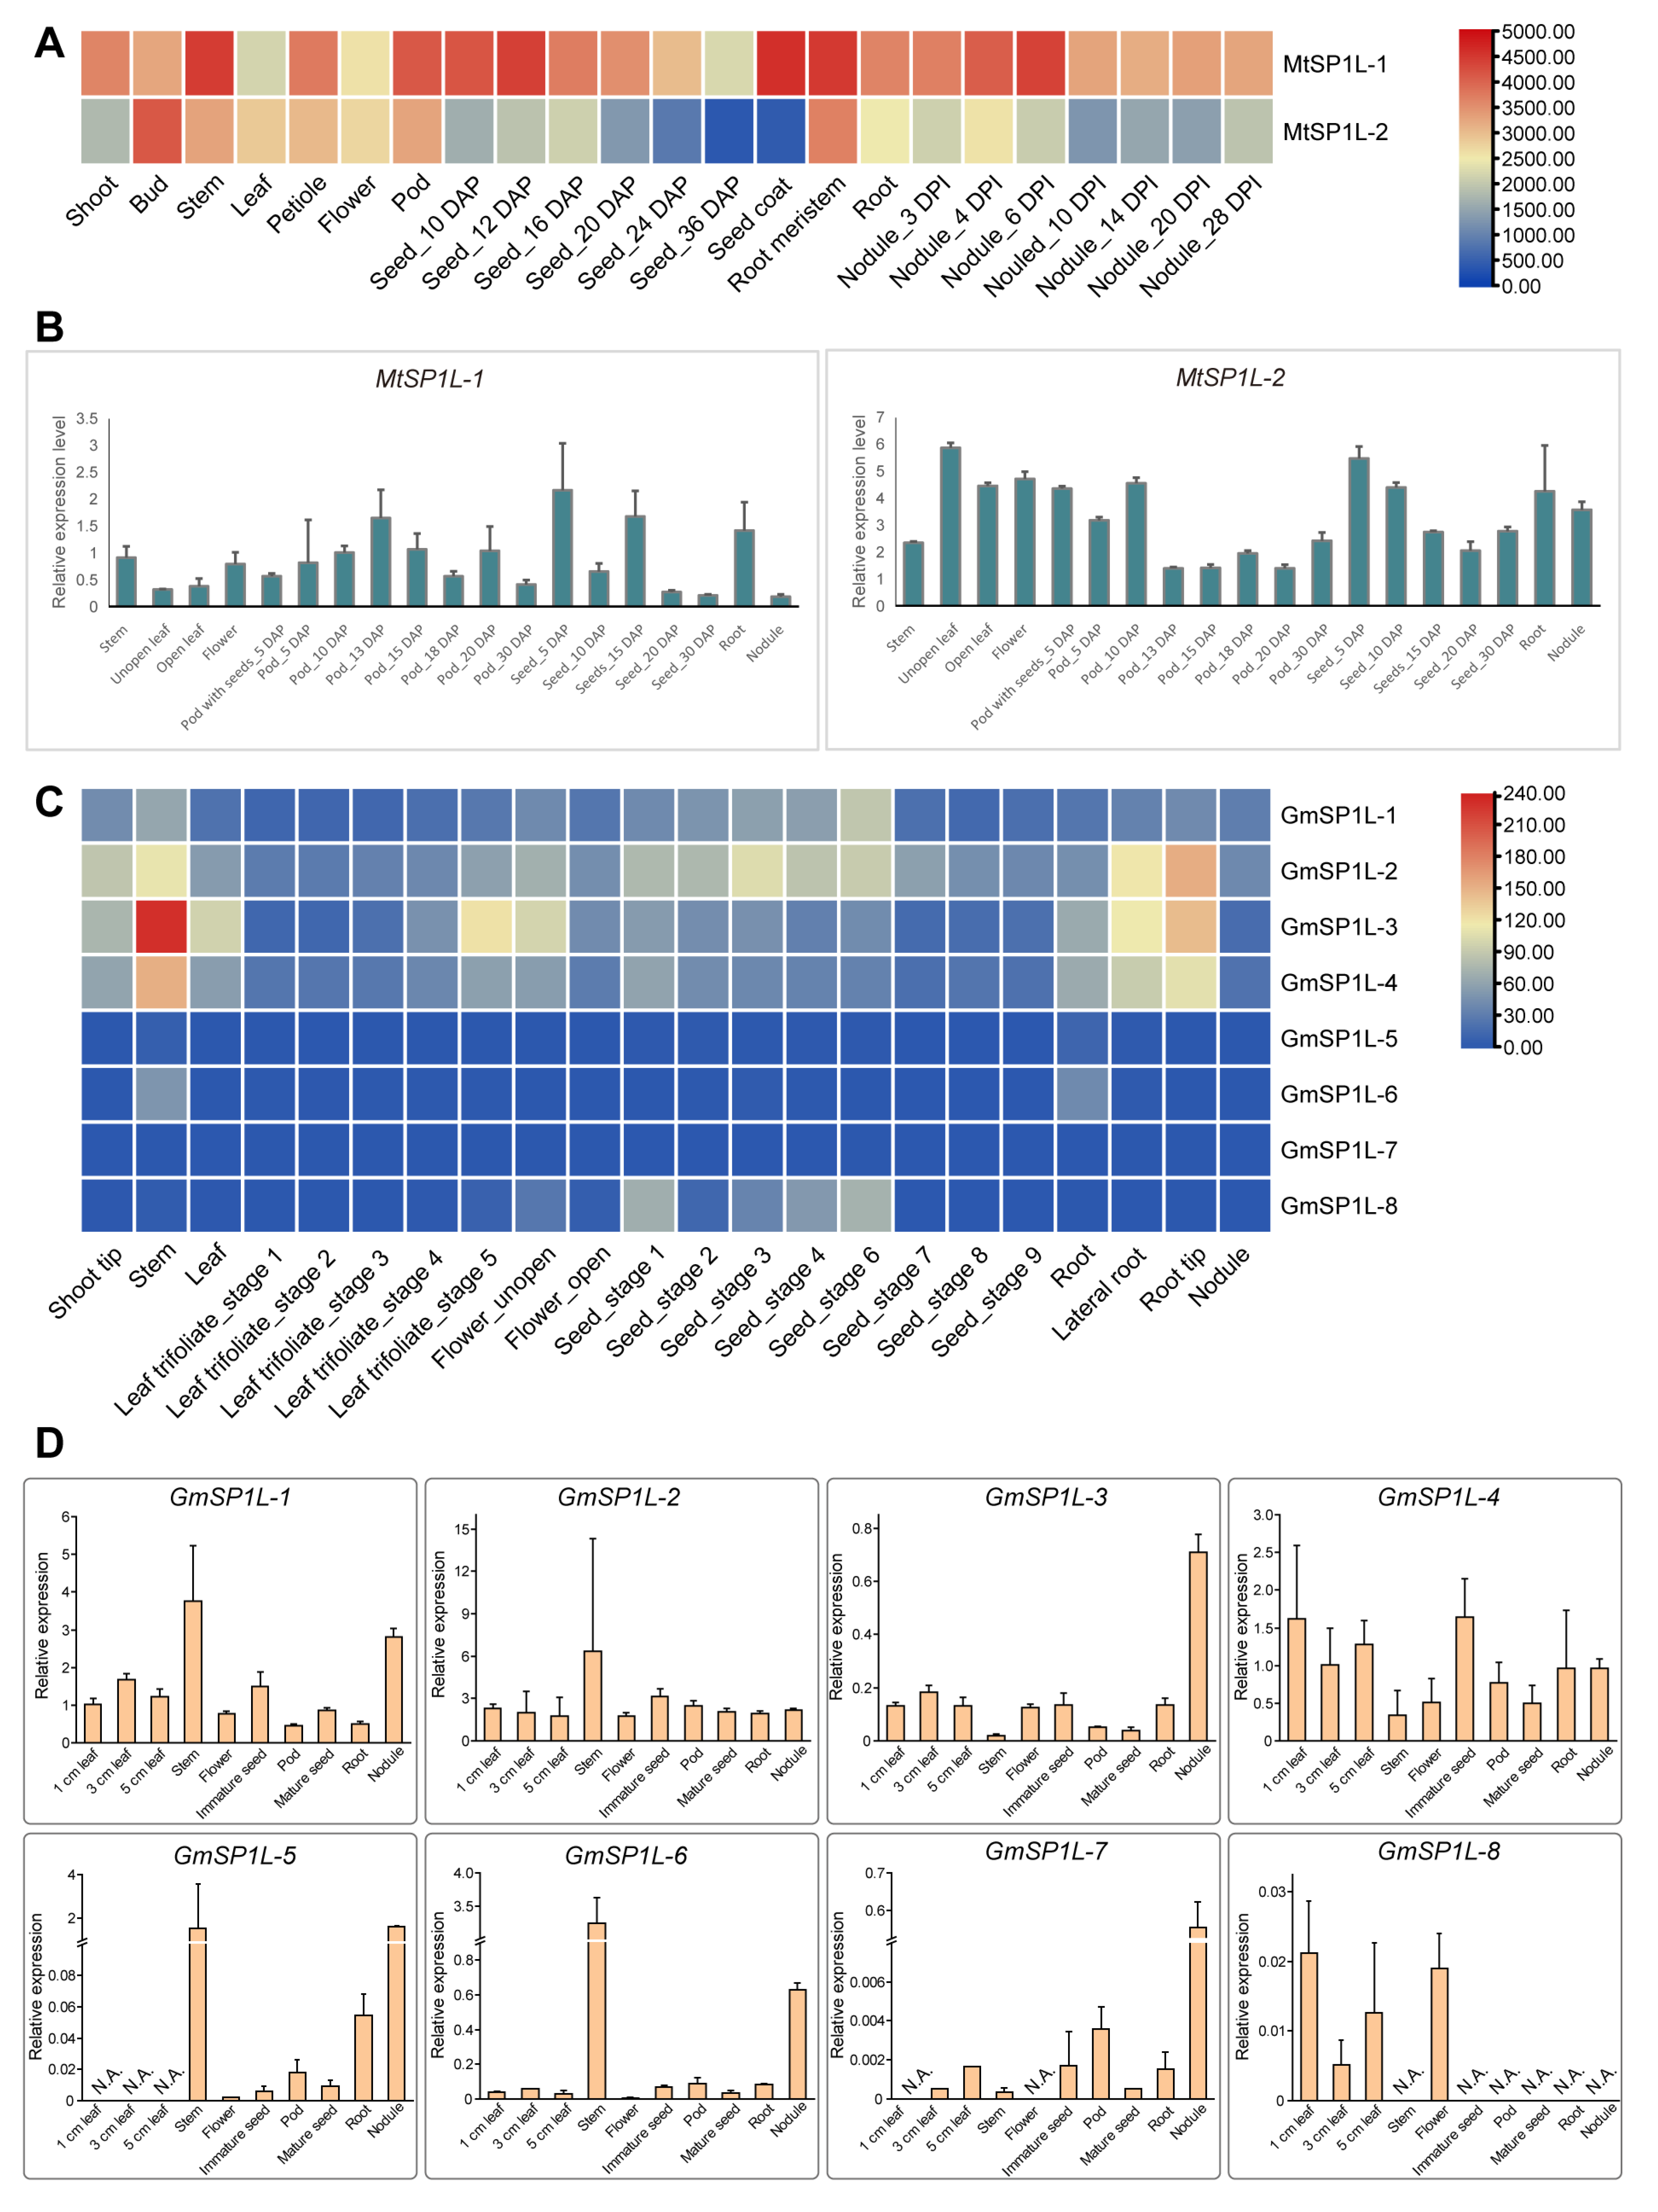
To understand the expression patterns of the SP1L genes in various tissues of M. truncatula, the expression profiles in the GeneChip dataset were investigated. It was shown that both of the MtSP1L genes displayed specific expression in all tested tissues or organs in various developmental stages, including shoots, vegetative buds, stems, leaves, flowers, pods, seeds, roots, and nodules (Figure 6A). Furthermore, the qRT-PCR-based tissue-specific transcript abundance analysis of seven tissues (stems, leaves, flowers, pods, seeds, roots, and nodules) with different stages was conducted with gene-specific primers, and the transcript expression levels of two Medicago SP1L genes are shown in Figure 6B. Both transcripts of MtSP1L-1 and MtSP1L-2 were detected in all organs, suggesting their potential roles in plant growth and development in Medicago.
In soybean, the data from Phytozome showed that clade 1 (GmSP1L-1 and GmSP1L-2) and clade 2 (GmSP1L-3 and GmSP1L-4) genes had relatively higher expression levels and were detected in all tested tissues; however, clade 3 GmSP1Ls (GmSP1L-5, GmSP1L-6, GmSP1L-7, and GmSP1L-8) showed a relatively lower expression (Figure 6C). The results of the qRT-PCR show that the clade 1 and clade 2 genes had clear differential expression in different organs, and some of them exhibited highly tissue-specific expression, while the expression levels of the clade 3 GmSP1Ls were too low to be detected in most of the tissues, but they were selectively expressed in particular tissues or organs (Figure 6D). The results of the qRT-PCR were generally consistent with the published data, with some exceptions, for example, in the qRT-PCR data, the maximum expressions of the GmSP1L-1 gene were in stems, GmSP1L-3 were in nodules, GmSP1L-5 and GmSP1L-6 were in stems and nodules, and GmSP1L-7 were in nodules; while in the Phytozome data, the maximum expressions of the GmSP1L-1 gene were in the seeds of stage 6 and for GmSP1L-3 in the stems, and GmSP1L-5 and GmSP1L-7 showed no expression in any tissues. These differences may have resulted from the different timing of the sampling.
In conclusion, the results indicated that the clade 1 and clade 2 SP1L genes in M. truncatula and G. max may play a significant role in plant growth, while the clade 3 gene may be redundant and less important in organ development in legumes.

2.7. Comparison of SP1Ls’ Expression Patterns in the Light- and Dark-Grown Hypocotyls in M. truncatula and G. max

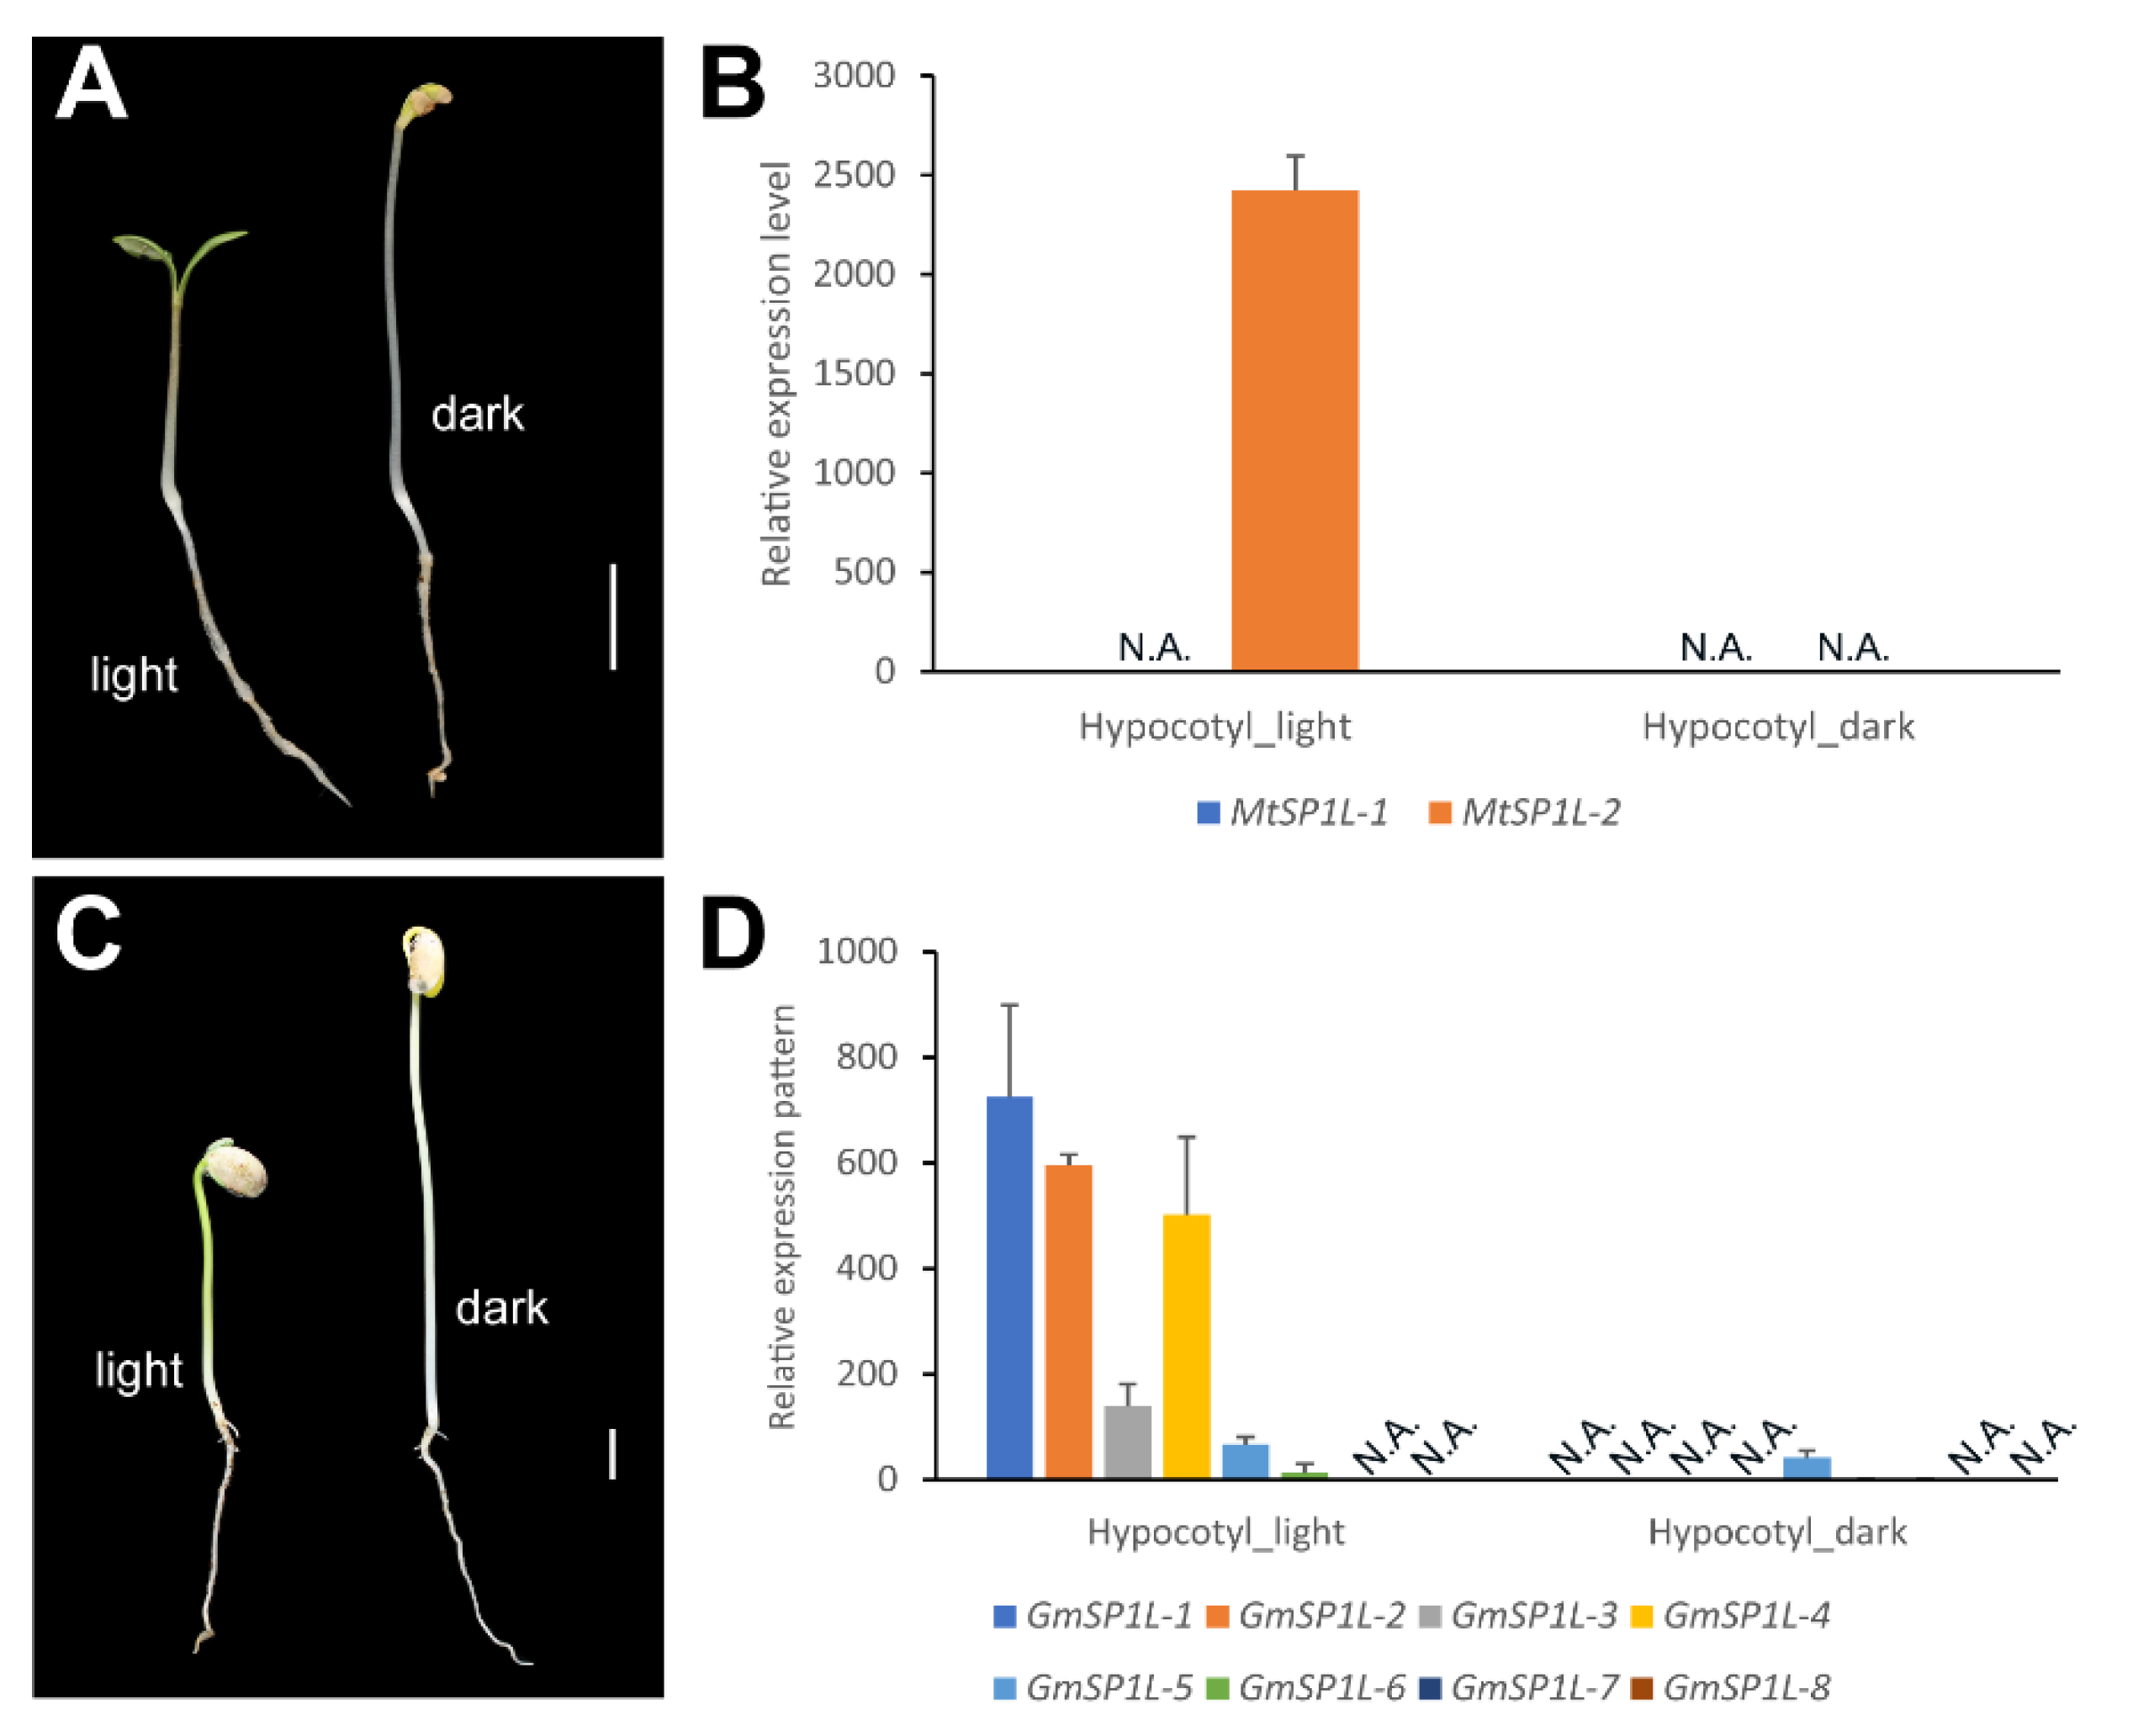
To investigate the gene expression patterns in response to light, we performed a comparative expression analysis for the SP1Ls in the hypocotyls of seedlings under white light and dark conditions (Figure 7). In both M. truncatula and G. max, hypocotyls of the dark-grown seedlings elongated rapidly after five days of growth, and they were much longer than those grown in the white light on the fifth day (Figure 7A,C). This was coincident with the phenomenon in Arabidopsis, which has been reported before [27]. In M. truncatula, the transcript level of MtSP1L-1 was not influenced in response to light, as they were not detected in hypocotyls in either the light or dark conditions, while MtSP1L-2 displayed a significantly higher expression level in white light than in darkness (Figure 7B). In G. max, the SP1L genes in clade 1 and clade 2 were expressed differentially under different light conditions. Specifically, the expression levels of clade 1 and 2 GmSP1Ls in the light-grown hypocotyls were higher than those of the dark-grown hypocotyls. In contrast, the clade 3 GmSP1L genes (GmSP1L-5, GmSP1L-6, GmSP1L-7, and GmSP1L-8) showed no response to light, and they displayed relatively lower expression levels in the hypocotyls grown in both light and dark conditions (Figure 7D). These results indicated that the expression levels of MtSP1L-2 in Medicago, as well as those of GmSP1L-1, GmSP1L-2, GmSP1L-3, and GmSP1L-4 in soybean, are light-dependent in the respective hypocotyls.

2.8. The Expression of SP1Ls under Saline Stress

The expression levels of the MtSP1L and GmSP1L genes were analyzed under sodium chloride treatments by qRT-PCR analysis. Most SP1Ls were induced at different levels (Figure 8). The expression level of MtSP1L-2 was induced more than five-fold in the roots after sodium chloride treatment (Figure 8A). The orthologous genes of MtSP1L-2 in soybean, GmSP1L-3, and GmSP1L-4 had a similar salt-induced expression pattern. The expression level of GmSP1L-3 was induced by more than 2.5- to 7-fold in leaves, roots, and stems after a sodium chloride treatment, and the expression level of GmSP1L-4 was induced by more than three-fold in roots after a sodium chloride treatment (Figure 8B). Moreover, the expression levels of the GmSP1L-1 genes were transiently elevated under a sodium chloride treatment, while the expression levels of MtSP1L-1 and GmSP1L-2 were reduced after a sodium chloride treatment. The overall expression levels of clade 3 genes were relatively low, which is consistent with the results shown above (Figure 6D, Figure 7D and Figure 8B). Overall, the results revealed that the SP1L genes in clade 2 were likely to be involved in salt stress responses in legume species.

3. Discussion

During genome evolution, gene duplication and gene loss events can contribute to the contraction and expansion of gene families. Genome changes can be linked to evolutionary processes that result in environmental niche adaptation [28]. Contrary to the common view of a larger gene family size in legumes than in Arabidopsis [29,30,31,32], the BLASTp and phylogenetic analyses in this study revealed that the SPR1 gene family in many legume species is smaller than its counterpart in Arabidopsis (Figure 1 and Supplementary Table S1), indicating the contraction of the SPR1 gene family in legume genomes. In addition, SPR1, which plays a significant role in plant growth and abiotic stress in Arabidopsis, was absent in the M. truncatula and G. max genomes. Currently, it is unclear why SPR1 has been lost in legumes, though it may have been caused by changes in the living environment such that this gene is no longer essential for the plants’ fitness [28]. Additionally, other SP1Ls may have replaced the function of SPR1 in legumes.
Many MAPs, including the SPR1 family, are likely to have functional redundancy among members of their multigene families. In Arabidopsis, the overexpression of each SP1L rescued the helical growth phenotype of spr1, indicating that the six members of SPR1 family proteins share the same biochemical functions in maintaining the cortical MT organization essential for anisotropic cell growth [18]. In Leguminosae, the number of putative SP1L genes varies from one (V. radiata) to eleven (G. dolichocarpa) (Figure 1 and Supplementary Table S1). The soybean (G. max) genome is known to have a high degree of redundancy as a result of both whole genome duplication and tandem gene arrays. Up to eight GmSP1L members are identified in G. max, while there are only two MtSP1L genes in the M. truncatula genome. It is interesting to note that clade 3 SP1L genes are lacking in both the M. truncatula and M. sative genomes (Figure 1). According to the expression pattern analysis, the GmSP1L genes in clade 3, including GmSP1L-5, GmSP1L-6, GmSP1L-7, and GmSP1L-8, are rarely expressed in most organs or tissues (Figure 6C,D). Moreover, their expression levels are nearly undetectable in etiolated hypocotyls (Figure 7D), and they were not induced by salt stress (Figure 8B), suggesting that the clade 3 SP1L genes are less important in legume species. In addition, it is likely that the eight GmSP1Ls and two MtSP1Ls function redundantly in plant development and growth, especially in members of the same clade which evolved from recent common ancestors and show similar gene structures and expression patterns.
Photomorphogenesis is light-mediated development through which plants are able to develop growth patterns in response to the light spectrum [33]. For plants germinating in soil, hypocotyl elongation is essential for initiating autotrophic growth by exposing them to light [27]. Previous studies have shown that in rapidly elongating cells of etiolated hypocotyls, more SPR1 proteins are required to align the cortical MT arrays transversely when the cells expand vertically [18]. Thus, in Arabidopsis, the helical hypocotyls of spr1 mutant are found in dark-grown seedlings but not in light-grown seedlings [20]. The function of the SP1L gene in light-regulated cell expansion has been confirmed in Salix matsudana (Salicaceae) [34]. SPR1 in S. matsudana (SmSPR1) interacts with the COP9 signalosome subunit 5A (CSN5A) and ELONGATED HYPOCOTYL 5 (HY5), further demonstrating the involvement of the SP1L genes in light-regulated pathways [34]. In this study, we found that the SP1L genes in M. truncatula and G. max had an extremely high frequency of light-responsive-related cis-acting elements in the promoter regions (Figure 5B), which suggests that these genes may be light-dependently expressed. MtSP1L-2 and GmSP1L-1 to -4 expression levels are much higher in light-grown hypocotyls than in dark-grown hypocotyls (Figure 7B,D). Though this finding is the opposite of SPR1 in Arabidopsis [18], it is consistent with AtSP1L-2, which was found in light-grown hypocotyls but not in dark-grown seedlings [18]. The differences in expression patterns may result from some special regulatory elements, modifications in their promoters, or functional segregation during evolution. As stabilized MTs are essential for maintaining the shape of cells, the light-dependent expression of SP1Ls genes may be relevant to the inhibition of hypocotyl elongation by light.
Salinity is a serious threat to agriculture, affecting plant growth and crop yields [35]. In legumes, rhizobia are known to be very sensitive to salinity. Thus, symbiotic interaction will be largely affected by salt stress, leading to a reduction in nodule number and limited nitrogen fixation [36,37]. In Medicago, short-term salinity stress was shown to affect the realignment of MTs from transverse to parallel [38], suggesting the involvement of MTs in the salt-stress response. The mechanisms by which SPR1 is degraded by the 26S proteasome in response to salt stress, which then induces disassembly of the cortical microtubules, have been well-studied in Arabidopsis. It has been shown that SPR1 depletion in response to salt is, indeed, the result of a posttranscriptional mechanism, and the SPR1 mRNA level did not change in response to salt stress treatments [11]. In contrast, in legume species, a significant induction of clade 2 SP1L genes was detected after sodium chloride treatments (Figure 7). These results indicate that the SP1L genes from legumes may play a different role in response to saline stress, which is interesting and should be investigated in the future.

4. Materials and Methods

4.1. Identification of the SP1L Proteins in Legume Genomes

To identify SP1L proteins in legume species, we conducted BLASTp searches against the Legume genome database LIS (the Legume Information System, https://www.legumeinfo.org/, accessed on 21 May 2022) using previously reported Arabidopsis SPR1 and SP1L proteins as query sequences. The ProtParam web tool (SIB Swiss Institute of Bioinformatics, Lausanne, Switzerland, http://web.expasy.org/protparam/, accessed on 15 June 2022) was used to determine the molecular weights (Wts) and theoretical isoelectric points (pIs) of the identified SP1L proteins.

4.2. Phylogenetic Analysis and Multiple Sequence Alignment

The phylogenetic tree of the SP1Ls in legumes was constructed using PhyloSuite v1.2.2 [39]. In PhyloSuite, the full-length protein sequences of all AtSP1Ls and SP1Ls from legume species were aligned with MAFFT [40]. The optimal model JTT+R3 was calculated by Modelfinder [41] based on the Bayesian information criterion (BIC) standard. ML phylogenies were inferred using IQ-TREE [42] under the JTT+R3 model with 10,000 ultrafast bootstraps [43]. The ML phylogenetic analysis for the SP1Ls from A. thaliana, M. truncatula, and G. max was conducted using MEGA-X [44] with 1000 standard bootstrap replicates. The online software iTOL v6.6 (https://itol.embl.de/, accessed on 29 June 2022) was used to modify the phylogenetic trees [45]. Multiple protein sequence alignments of the SP1Ls were analyzed using ClustalX2 [46] and displayed via GeneDoc [47].

4.3. Gene Structure and Motif Analysis

The conserved motifs were identified by selecting motifs from the MEME program v5.1.0 (Multiple Expectation Maximization for Motif Elicitation, University of Nevada, Reno and University of Washington, USA, http://meme-suite.org/tools/meme, accessed on 22 October 2022), with the motif number set as 20 and the width range of 10 to 200 amino acids (aa). The exon-intron structures were retrieved from the gene annotation files. The visualizations of the exon–intron positions and conserved motifs were executed through the TBtools software [48], and the color was adjusted with Adobe Illustrator.

4.4. 3D Structural Analysis of the SP1L Proteins

The secondary structures were predicted with the SOPMA model. Protein folding analysis was carried out using Alphafold2 on the Google Colab platform (https://colab.research.google.com/github/sokrypton/ColabFold/blob/main/AlphaFold2.ipynb, accessed on 5 November 2022) [26]. UCSF ChimeraX was used to display the 3D structures of the SP1L proteins [49].

4.5. Analyses of the Chromosome Locations and Collinearity of the AtSP1L, MtSP1L, and GmSP1L Genes

The chromosome locations of the SP1L genes were obtained from the genome annotation data. The Multiple Collinear Scan Toolkit (MCScanX) was used to analyze the gene duplication events using default parameters [50]. The intraspecific synteny relationship (M. truncatula and G. max) and interspecific synteny relationships (M. truncatula and G. max, M. truncatula and A. thaliana, and G. max and A. thaliana) were analyzed.

4.6. Cis-Acting Elements Analysis

The promoter sequences (2 kb upstream of the translation start site) of the MtSP1L and GmSP1L genes were identified using the TBtools software [48], and the cis-elements in the promoters regions were predicted with the online program PlantCARE (http://bioinformatics.psb.ugent.be/webtools/plantcare/html/, accessed on 13 October 2022) [51]. TBtools was used to visualize the cis-acting elements of all the SP1L genes of M. truncatula and G. max [48].

4.7. Plant Materials

The M. truncatula (R108 ecotype) and G. max (Williams 82 and Guizao 1) plants used in this study were stored in the Department of Grassland Science, College of Forestry and Landscape Architecture, South China Agricultural University. The plants were grown in a growth chamber at 25 °C under a photoperiod of 16 h/8 h in a light/dark regime (80 µmol photons m−2s−1) and 80–90% humidity. Stems, leaves, flowers, pods, seeds, roots, and nodules of the mature M. truncatula (R108) and G. max (Williams 82) plants were collected separately. All samples were frozen in liquid nitrogen once collected and stored at −80 °C for subsequent RNA extraction and qRT-PCR analysis. To investigate the expression patterns of the SP1L genes in response to light, the seeds (R108 and Williams 82) were germinated under white light or dark conditions. When the cotyledons extended, the hypocotyls of each treatment were collected. The salt stress assays were carried out following the protocol in the Medicago truncatula handbook [52]. The germinated seeds (R108 and Guizao 1) were transferred to pots with a 3:1 mix of perlite and sand. The seedlings were irrigated with Hoagland solution. After 10 days of growth, the treatment group was irrigated with a 150 mM sodium chloride solution and then, 24 h later, the plant materials of M. truncatula (R108; leaves and roots) and G. max (Guizao 1; stems, leaves, and roots) were collected for subsequent analysis.

4.8. Analysis of the Expression Levels of the SP1L Genes in the Different Organs and Tissues of M. truncatula and G. max

The GeneChip data of two MtSP1L genes were downloaded from the M. truncatula Gene Expression Atlas (https://lipm-browsers.toulouse.inra.fr/pub/expressionAtlas/app/mtgeav3/, accessed on 11 November 2022) [53,54]. The FPKM of eight GmSP1Ls in different tissues were downloaded from Phytozome v13 (https://phytozome-next.jgi.doe.gov/, accessed on 22 November 2022). Heatmaps were generated using TBtools [48]. For the qRT-PCR analysis, the total RNAs were extracted using the Total RNA Extraction Reagent (Vazyme, Nanjing, China) according to the manufacturer’s instructions. First-strand cDNA synthesis was performed using EasyScript One-Step gDNA Removal and a cDNA Synthesis SuperMix kit (TransGen Biotech, Beijing, China). The qRT-PCRs were carried out using a 2×ChamQ Universal SYBR qPCR Master Mix (Vazyme, Nanjing, China) on a CFX96 Real-Time PCR Detection System (Bio-Rad, Hercules, CA, USA). MtACTIN (Medtr3g095530), and GmACTIN (Glyma.18G290800) was used as the endogenous control, respectively. The reaction was carried out as follows: 94 °C for 30 s, followed by 40 cycles of 5 s at 94 °C and 34 s at 60 °C. The relative expression levels of the genes were determined using the comparative 2−∆∆Ct method [55]. Error bars represented the standard deviation. The primer sequences used in this study are shown in Table S4.

5. Conclusions

This study analyzed the SPR1 gene family on a genome-wide scale in legume species. In contrast to Arabidopsis, this gene family has undergone shrinking in the two model legume species M. truncatula and G. max. The orthologues of SPR1 were lost, and very few SP1L genes were identified given the genome size of the two species. These genes show high similarity in the N- and C-terminal regions, whereas the central sequences are poorly conserved. The phylogenetic analysis grouped the SP1L proteins into three clades, and the genes in the same clades share a great similarity in gene structures, protein motifs, cis-acting elements, and protein folding. The SP1L genes in clade 1 and clade 2 were highly expressed in all organs and tissues, while the clade 3 SP1Ls showed relatively lower expression levels in the examined tissues. Moreover, we found that the SP1L genes are sensitive to light conditions or salt-stress in M. truncatula and G. max. To conclude, this study has provided essential information for further functional studies of SP1L genes in legume species.

Supplementary Materials

The following supporting information can be downloaded at: https://www.mdpi.com/article/10.3390/ijms24043958/s1.

Author Contributions

Conceptualization, L.G.; methodology, Q.Y. and J.L.; investigation, Q.Y., J.L., J.J., F.L., Z.Z., X.Y., and M.L.; writing—original draft preparation, Q.Y. and J.L.; writing—review and editing, L.G. and I.A.; supervision, L.G.; funding acquisition, Q.Y. and L.G. All authors have read and agreed to the published version of the manuscript.

Funding

This research was funded by the China Postdoctoral Science Foundation, grant number 2021M701261, and the Guangdong Basic and Applied Basic Research Foundation, grant number 2021A1515110137.

Institutional Review Board Statement

Not applicable.

Informed Consent Statement

Not applicable.

Data Availability Statement

Not applicable.

Acknowledgments

We thank Xingang Li (College of Agriculture, SCAU) for helping with the salt-stress treatments for soybean, and we thank Huan Du (College of Life Science, SCAU) for providing the cDNA of various tissues in soybean.

Conflicts of Interest

The authors declare no conflict of interest.

References

  1. Ledbetter, M.C.; Porter, K.R. Morphology of microtubules of plant cell. Science 1964, 144, 872–874. [Google Scholar] [CrossRef] [PubMed]
  2. Yuan, M.; Shaw, P.J.; Warn, R.M.; Lloyd, C.W. Dynamic reorientation of cortical microtubules, from transverse to longitudinal, in living plant cells. Proc. Natl. Acad. Sci. USA 1994, 91, 6050–6053. [Google Scholar] [CrossRef] [PubMed] [Green Version]
  3. Foster, R.; Mattsson, O.; Mundy, J. Plants flex their skeletons. Trends Plant Sci. 2003, 8, 202–204. [Google Scholar] [CrossRef] [PubMed]
  4. Sugimoto, K.; Himmelspach, R.; Williamson, R.E.; Wasteneys, G.O. Mutation or drug-dependent microtubule disruption causes radial swelling without altering parallel cellulose microfibril deposition in Arabidopsis root cells. Plant Cell 2003, 15, 1414–1429. [Google Scholar] [CrossRef] [Green Version]
  5. Hashimoto, T.; Kato, T. Cortical control of plant microtubules. Curr. Opin. Plant Biol. 2006, 9, 5–11. [Google Scholar] [CrossRef]
  6. Bringmann, M.; Li, E.; Sampathkumar, A.; Kocabek, T.; Hauser, M.T.; Persson, S. POM-POM2/cellulose synthase interacting1 is essential for the functional association of cellulose synthase and microtubules in Arabidopsis. Plant Cell 2012, 24, 163–177. [Google Scholar] [CrossRef] [Green Version]
  7. Kesten, C.; Wallmann, A.; Schneider, R.; McFarlane, H.E.; Diehl, A.; Khan, G.A.; van Rossum, B.J.; Lampugnani, E.R.; Szymanski, W.G.; Cremer, N.; et al. The companion of cellulose synthase 1 confers salt tolerance through a Tau-like mechanism in plants. Nat. Commun. 2019, 10, 857. [Google Scholar] [CrossRef] [Green Version]
  8. Buschmann, H.; Borchers, A. Handedness in plant cell expansion: A mutant perspective on helical growth. New Phytol. 2020, 225, 53–69. [Google Scholar] [CrossRef]
  9. Kumar, S.; Jeevaraj, T.; Yunus, M.H.; Chakraborty, S.; Chakraborty, N. The plant cytoskeleton takes center stage in abiotic stress responses and resilience. Plant Cell Environ. 2023, 46, 5–22. [Google Scholar] [CrossRef]
  10. Wang, P.; Qi, S.; Wang, X.; Dou, L.; Jia, M.A.; Mao, T.; Guo, Y.; Wang, X. The OPEN STOMATA1-SPIRAL1 module regulates microtubule stability during abscisic acid-induced stomatal closure in Arabidopsis. Plant Cell 2022, 35, 260–278. [Google Scholar] [CrossRef]
  11. Wang, S.; Kurepa, J.; Hashimoto, T.; Smalle, J.A. Salt stress-induced disassembly of Arabidopsis cortical microtubule arrays involves 26S proteasome-dependent degradation of SPIRAL1. Plant Cell 2011, 23, 3412–3427. [Google Scholar] [CrossRef] [PubMed] [Green Version]
  12. Sivaguru, M.; Pike, S.; Gassmann, W.; Baskin, T.I. Aluminum rapidly depolymerizes cortical microtubules and depolarizes the plasma membrane: Evidence that these responses are mediated by a glutamate receptor. Plant Cell Physiol. 2003, 44, 667–675. [Google Scholar] [CrossRef] [PubMed] [Green Version]
  13. Abdrakhamanova, A.; Wang, Q.Y.; Khokhlova, L.; Nick, P. Is microtubule disassembly a trigger for cold acclimation? Plant Cell Physiol. 2003, 44, 676–686. [Google Scholar] [CrossRef] [PubMed] [Green Version]
  14. Takemoto, D.; Hardham, A.R. The cytoskeleton as a regulator and target of biotic interactions in plants. Plant Physiol. 2004, 136, 3864–3876. [Google Scholar] [CrossRef] [Green Version]
  15. Nick, P. Signaling to the microtubular cytoskeleton in plants. In International Review of Cytology; Academic Press: Cambridge, MA, USA, 1998; Volume 184, pp. 33–80. [Google Scholar]
  16. Komis, G.; Apostolakos, P.; Galatis, B. Hyperosmotic stress induces formation of tubulin macrotubules in root-tip cells of Triticum turgidum: Their probable involvement in protoplast volume control. Plant Cell Physiol. 2002, 43, 911–922. [Google Scholar] [CrossRef] [Green Version]
  17. Wang, C.; Li, J.; Yuan, M. Salt tolerance requires cortical microtubule reorganization in Arabidopsis. Plant Cell Physiol. 2007, 48, 1534–1547. [Google Scholar] [CrossRef] [Green Version]
  18. Nakajima, K.; Kawamura, T.; Hashimoto, T. Role of the SPIRAL1 gene family in anisotropic growth of Arabidopsis thaliana. Plant Cell Physiol. 2006, 47, 513–522. [Google Scholar] [CrossRef]
  19. Sedbrook, J.C.; Ehrhardt, D.W.; Fisher, S.E.; Scheible, W.R.; Somerville, C.R. The Arabidopsis sku6/spiral1 gene encodes a plus end-localized microtubule-interacting protein involved in directional cell expansion. Plant Cell 2004, 16, 1506–1520. [Google Scholar] [CrossRef] [Green Version]
  20. Nakajima, K.; Furutani, I.; Tachimoto, H.; Matsubara, H.; Hashimoto, T. SPIRAL1 encodes a plant-specific microtubule-localized protein required for directional control of rapidly expanding Arabidopsis cells. Plant Cell 2004, 16, 1178–1190. [Google Scholar] [CrossRef] [Green Version]
  21. Furutani, I. The SPIRAL genes are required for directional control of cell elongation in Arabidopsis thaliana. Development 2000, 127, 4443–4453. [Google Scholar] [CrossRef]
  22. Galva, C.; Kirik, V.; Lindeboom, J.J.; Kaloriti, D.; Rancour, D.M.; Hussey, P.J.; Bednarek, S.Y.; Ehrhardt, D.W.; Sedbrook, J.C. The microtubule plus-end tracking proteins SPR1 and EB1b interact to maintain polar cell elongation and directional organ growth in Arabidopsis. Plant Cell 2014, 26, 4409–4425. [Google Scholar] [CrossRef] [PubMed] [Green Version]
  23. Azani, N.; Babineau, M.; Bailey, C.D.; Banks, H.; Barbosa, A.; Pinto, R.B.; Boatwright, J.; Borges, L.; Brown, G.; Bruneau, A.; et al. A new subfamily classification of the Leguminosae based on a taxonomically comprehensive phylogeny—The Legume Phylogeny Working Group (LPWG). Taxon 2017, 66, 44–77. [Google Scholar] [CrossRef] [Green Version]
  24. Lewis, G.; Schrire, B.; Mackinder, B.; Loch, M. Legumes of the World; Royal Botanic Gardens, Kew: Richmond, UK, 2005. [Google Scholar]
  25. Hyams, J.S.; Lloyd, C.W. Microtubules; Wiley-Liss: New York, NY, USA, 1994; Volume 9. [Google Scholar]
  26. Ruff, K.M.; Pappu, R.V. AlphaFold and implications for intrinsically disordered proteins. J. Mol. Biol. 2021, 433, 167208. [Google Scholar] [PubMed]
  27. Gendreau, E.; Traas, J.; Desnos, T.; Grandjean, O.; Caboche, M.; Hofte, H. Cellular basis of hypocotyl growth in Arabidopsis thaliana. Plant Physiol. 1997, 114, 295–305. [Google Scholar] [CrossRef] [Green Version]
  28. Demuth, J.P.; Hahn, M.W. The life and death of gene families. Bioessays 2009, 31, 29–39. [Google Scholar] [CrossRef]
  29. Jia, B.; Wang, Y.; Zhang, D.; Li, W.; Cui, H.; Jin, J.; Cai, X.; Shen, Y.; Wu, S.; Guo, Y.; et al. Genome-wide identification, characterization and expression analysis of soybean CHYR gene family. Int. J. Mol. Sci. 2021, 22, 12192. [Google Scholar] [CrossRef]
  30. Meng, J.; Peng, M.; Yang, J.; Zhao, Y.; Hu, J.; Zhu, Y.; He, H. Genome-wide analysis of the Cyclin gene family and their expression profile in Medicago truncatula. Int. J. Mol. Sci. 2020, 21, 9430. [Google Scholar] [CrossRef]
  31. Jiao, Z.; Wang, L.; Du, H.; Wang, Y.; Wang, W.; Liu, J.; Huang, J.; Huang, W.; Ge, L. Genome-wide study of C2H2 zinc finger gene family in Medicago truncatula. BMC Plant Biol. 2020, 20, 401. [Google Scholar] [CrossRef]
  32. Cai, Z.; Xian, P.; Lin, R.; Cheng, Y.; Lian, T.; Ma, Q.; Nian, H. Characterization of the soybean GmIREG family genes and the function of GmIREG3 in conferring tolerance to Aluminum stress. Int. J. Mol. Sci. 2020, 21, 497. [Google Scholar] [CrossRef] [Green Version]
  33. Chen, M.; Chory, J.; Fankhauser, C. Light signal transduction in higher plants. Annu. Rev. Genet. 2004, 38, 87–117. [Google Scholar] [CrossRef] [Green Version]
  34. Liu, X.; Zhang, J.; Sui, J.; Luo, Y.; Rao, G. The Salix SmSPR1 involved in light-regulated cell expansion by modulating microtubule arrangement. Front. Cell Dev. Biol. 2019, 7, 309. [Google Scholar] [CrossRef] [Green Version]
  35. Carter, D.L. Problems of salinity in agriculture. In Plants in Saline Environments; Springer: Berlin/Heidelberg, Germany, 1975; pp. 25–35. [Google Scholar]
  36. Duzan, H.M.; Zhou, X.; Souleimanov, A.; Smith, D.L. Perception of Bradyrhizobium japonicum Nod factor by soybean [Glycine max (L.) Merr.] root hairs under abiotic stress conditions. J. Exp. Bot. 2004, 55, 2641–2646. [Google Scholar] [CrossRef] [PubMed] [Green Version]
  37. Zahran, H.H. Rhizobium-legume symbiosis and nitrogen fixation under severe conditions and in an arid climate. Microbiol. Mol. Biol. Rev. 1999, 63, 968–989. [Google Scholar] [CrossRef] [PubMed] [Green Version]
  38. Lazareva, E.M.; Baranova, E.N.; Smirnova, E.A. Reorganization of interphase microtubules in root cells of Medicago sativa L. during acclimation to osmotic and salt stress. Cell Tissue Biol. 2017, 11, 324–334. [Google Scholar] [CrossRef]
  39. Zhang, D.; Gao, F.; Jakovlic, I.; Zou, H.; Zhang, J.; Li, W.X.; Wang, G.T. PhyloSuite: An integrated and scalable desktop platform for streamlined molecular sequence data management and evolutionary phylogenetics studies. Mol. Ecol. Resour. 2020, 20, 348–355. [Google Scholar] [CrossRef]
  40. Katoh, K.; Standley, D.M. MAFFT multiple sequence alignment software version 7: Improvements in performance and usability. Mol. Biol. Evol. 2013, 30, 772–780. [Google Scholar] [CrossRef] [Green Version]
  41. Kalyaanamoorthy, S.; Minh, B.Q.; Wong, T.K.; Von Haeseler, A.; Jermiin, L.S. ModelFinder: Fast model selection for accurate phylogenetic estimates. Nat. Methods 2017, 14, 587–589. [Google Scholar] [CrossRef] [Green Version]
  42. Nguyen, L.-T.; Schmidt, H.A.; Von Haeseler, A.; Minh, B.Q. IQ-TREE: A fast and effective stochastic algorithm for estimating maximum-likelihood phylogenies. Mol. Biol. Evol. 2015, 32, 268–274. [Google Scholar] [CrossRef]
  43. Minh, B.Q.; Nguyen, M.A.T.; von Haeseler, A. Ultrafast approximation for phylogenetic bootstrap. Mol. Biol. Evol. 2013, 30, 1188–1195. [Google Scholar] [CrossRef] [Green Version]
  44. Kumar, S.; Stecher, G.; Li, M.; Knyaz, C.; Tamura, K. MEGA X: Molecular evolutionary genetics analysis across computing platforms. Mol. Biol. Evol. 2018, 35, 1547. [Google Scholar] [CrossRef]
  45. Letunic, I.; Bork, P. Interactive Tree Of Life (iTOL) v4: Recent updates and new developments. Nucleic Acids Res. 2019, 47, W256–W259. [Google Scholar] [CrossRef] [PubMed] [Green Version]
  46. Larkin, M.A.; Blackshields, G.; Brown, N.P.; Chenna, R.; McGettigan, P.A.; McWilliam, H.; Valentin, F.; Wallace, I.M.; Wilm, A.; Lopez, R. Clustal W and Clustal X version 2.0. Bioinformatics 2007, 23, 2947–2948. [Google Scholar] [CrossRef] [PubMed] [Green Version]
  47. Nicholas, K.B.; Nicholas, H.B.; Deerfield, D.W. GeneDoc: Analysis and visualization of genetic variation. EMBnet News 1997, 4, 1–14. [Google Scholar]
  48. Chen, C.; Chen, H.; Zhang, Y.; Thomas, H.R.; Frank, M.H.; He, Y.; Xia, R. TBtools: An integrative toolkit developed for interactive analyses of big biological data. Mol. Plant 2020, 13, 1194–1202. [Google Scholar] [CrossRef] [PubMed]
  49. Pettersen, E.F.; Goddard, T.D.; Huang, C.C.; Meng, E.C.; Couch, G.S.; Croll, T.I.; Morris, J.H.; Ferrin, T.E. UCSF ChimeraX: Structure visualization for researchers, educators, and developers. Protein Sci. 2021, 30, 70–82. [Google Scholar] [CrossRef]
  50. Wang, Y.; Tang, H.; DeBarry, J.D.; Tan, X.; Li, J.; Wang, X.; Lee, T.-h.; Jin, H.; Marler, B.; Guo, H. MCScanX: A toolkit for detection and evolutionary analysis of gene synteny and collinearity. Nucleic Acids Res. 2012, 40, e49. [Google Scholar] [CrossRef] [Green Version]
  51. Lescot, M.; Déhais, P.; Thijs, G.; Marchal, K.; Moreau, Y.; Van de Peer, Y.; Rouzé, P.; Rombauts, S. PlantCARE, a database of plant cis-acting regulatory elements and a portal to tools for in silico analysis of promoter sequences. Nucleic Acids Res. 2002, 30, 325–327. [Google Scholar] [CrossRef]
  52. Limami, A.M.; Ricoult, C.; Planchet, E.; González, E.M.; Ladrera, R.; Larrainzar, E.; Arrese-Igor, C.; Merchan, F.; Crespi, M.; Frugier, F. Response of Medicago truncatula to abiotic stress. In Medicago Truncatula Handbook; Samuel Roberts Noble Foundation: Ardmore, PA, USA, 2007. [Google Scholar]
  53. Carrere, S.; Verdier, J.; Gamas, P. MtExpress, a comprehensive and curated RNAseq-based gene expression atlas for the model legume Medicago truncatula. Plant Cell Physiol. 2021, 62, 1494–1500. [Google Scholar] [CrossRef]
  54. Benedito, V.A.; Torres-Jerez, I.; Murray, J.D.; Andriankaja, A.; Allen, S.; Kakar, K.; Wandrey, M.; Verdier, J.; Zuber, H.; Ott, T. A gene expression atlas of the model legume Medicago truncatula. Plant J. 2008, 55, 504–513. [Google Scholar] [CrossRef]
  55. Livak, K.J.; Schmittgen, T.D. Analysis of relative gene expression data using real-time quantitative PCR and the 2−ΔΔCT method. Methods 2001, 25, 402–408. [Google Scholar] [CrossRef]
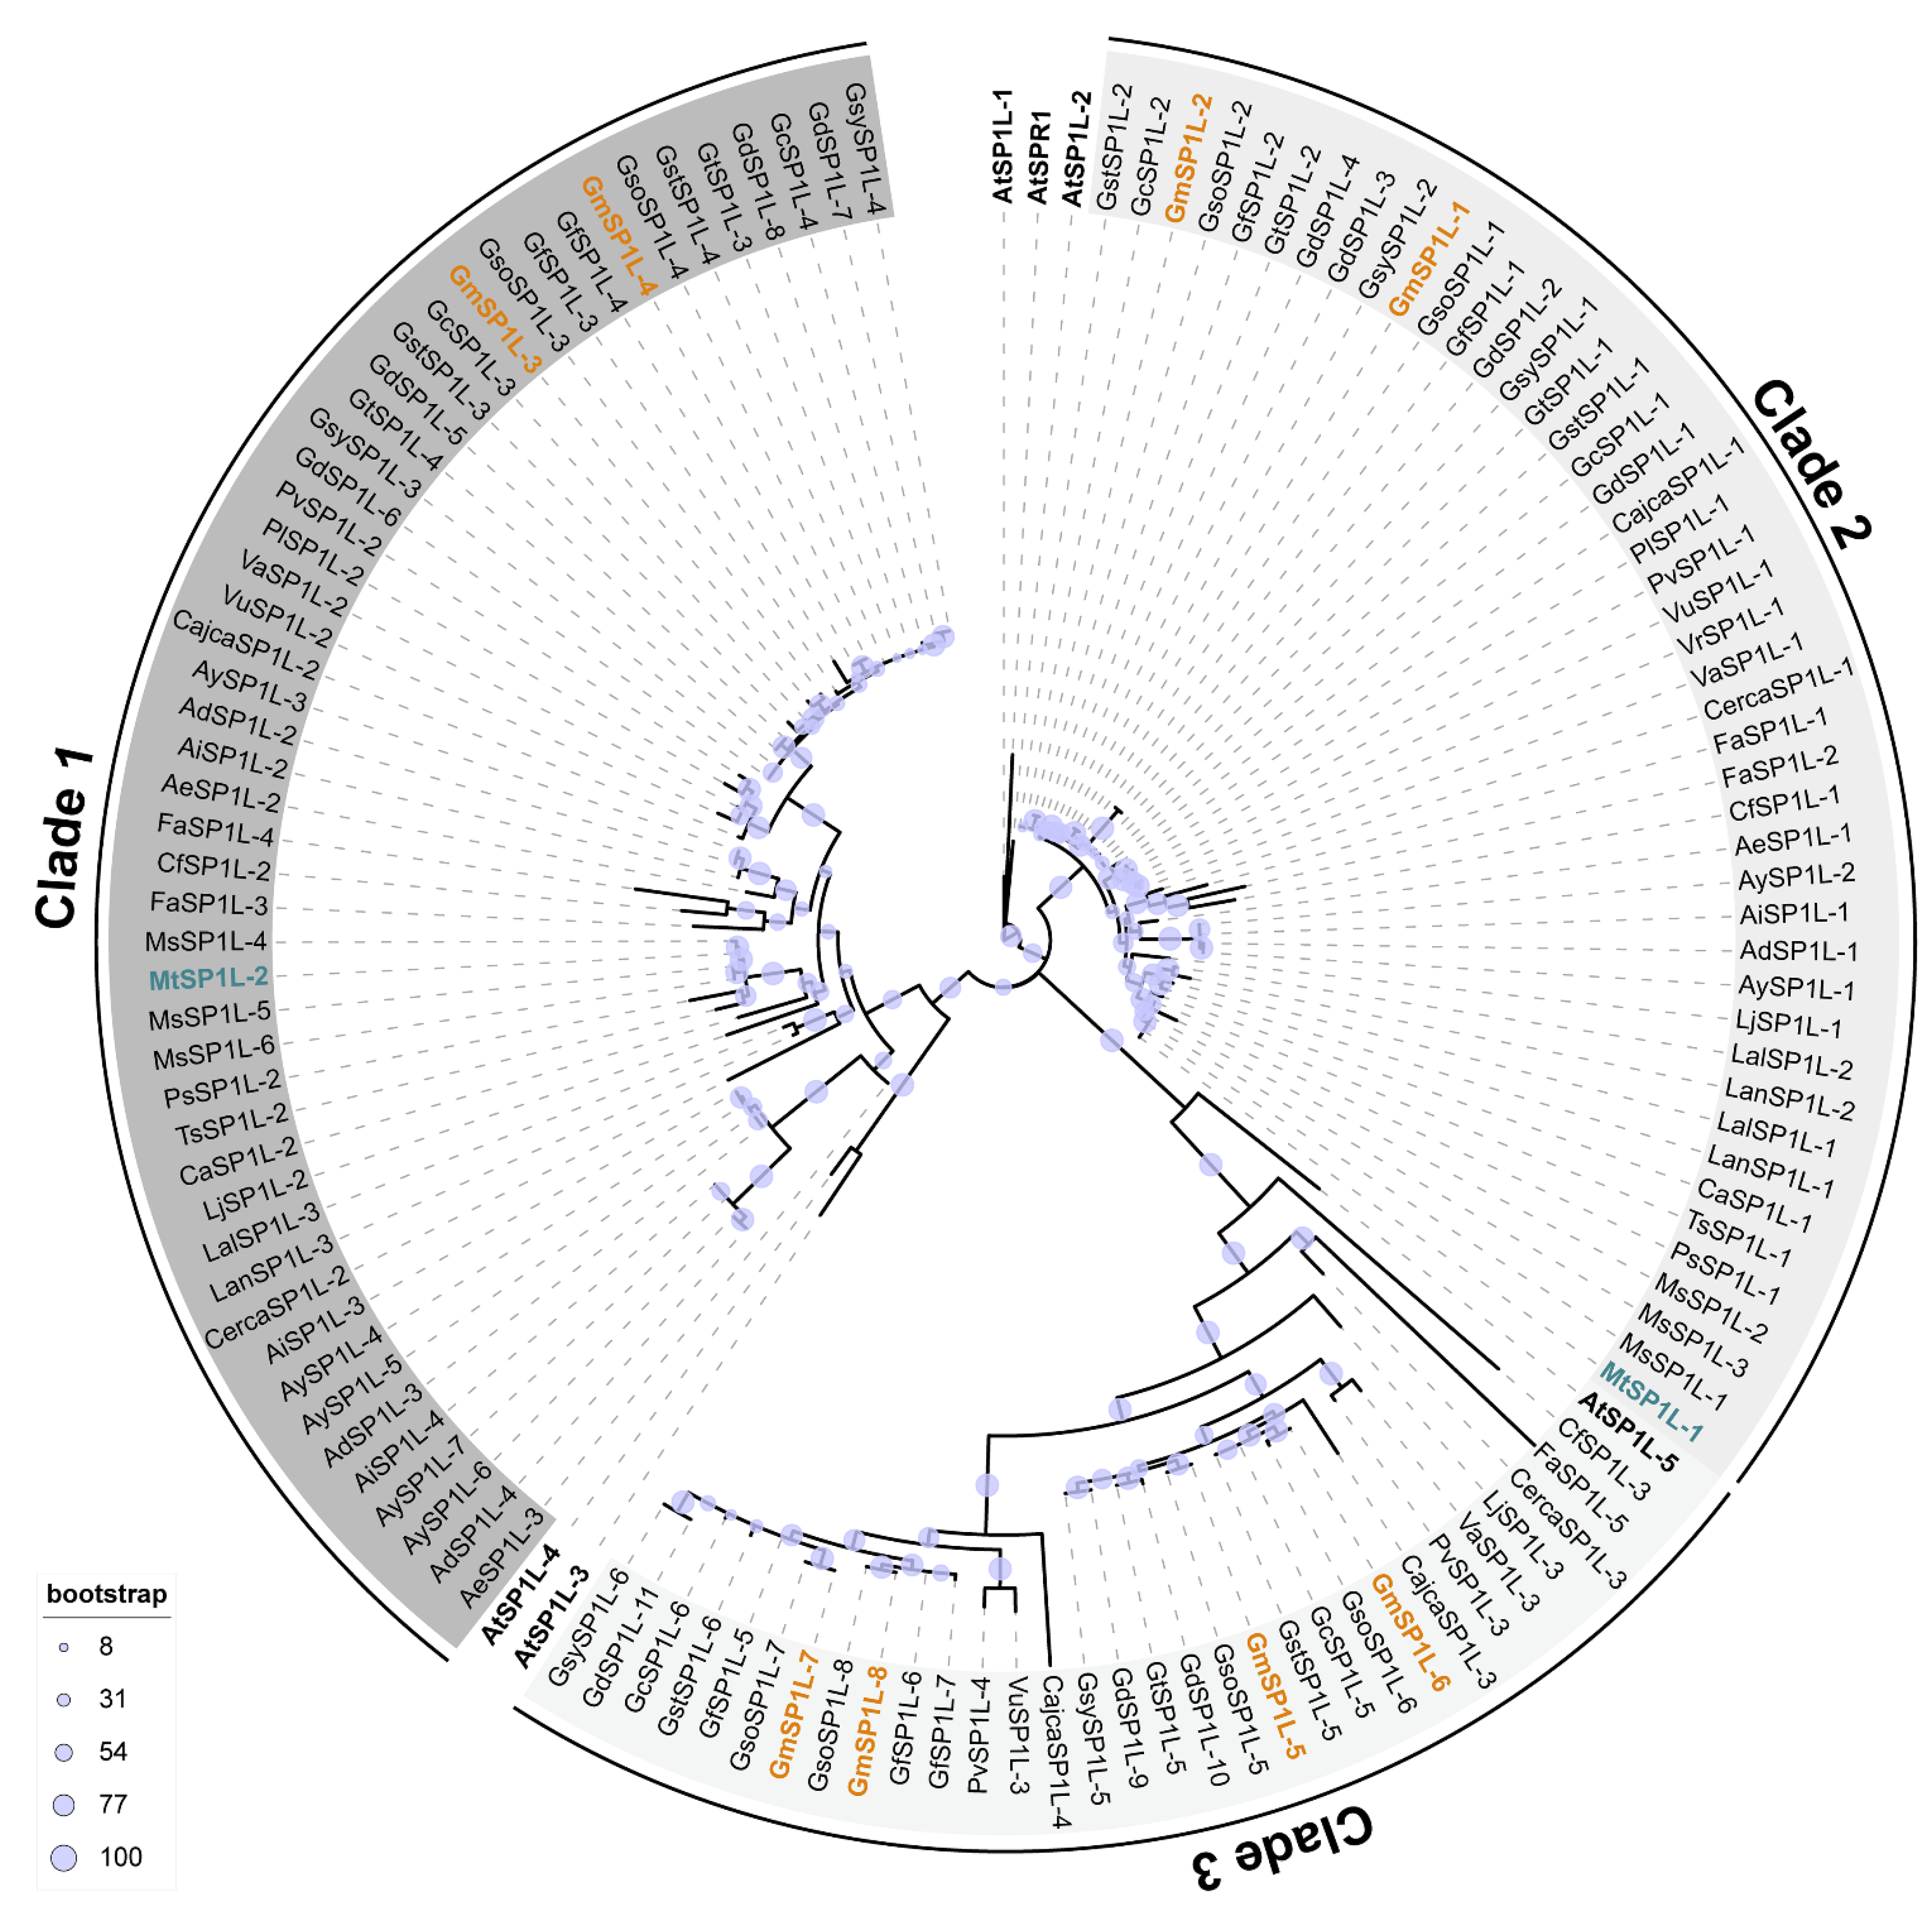
Figure 1. Phylogenetic analysis of the SPIRAL1 (SPR1) families across the Leguminosae species and Arabidopsis thaliana. Clades are shaded with different gradients of grey. The Arabidopsis (At) SPR1 family proteins are bold, and the SPR1-Like (SP1L) proteins from Medicago truncatula (Mt) and Glycine max (Gm) are highlighted with blue and orange, respectively.
Ijms 24 03958 g001
Figure 2. Protein sequences alignment. The identical amino acid residues among all proteins are shown in black boxes, and the conserved residues are shown in gray boxes. The two solid lines under the sequences mark the locations of a direct repeat sequence. The predicted MT binding motifs (GGG and PGGG) are marked with red lines.
Ijms 24 03958 g002
Figure 3. Phylogenetic relationships, gene structures, and motifs of the SP1L genes from A. thaliana, M. truncatula, and G. max (AC). The clades and colors of the phylogenetic tree are the same as in Figure 1. The green boxes in (B) indicate 5′- and 3′- untranslated regions, the yellow boxes indicate exons, and the black lines indicate introns. The motifs are indicated in different colored boxes with different numbers, and the sequence information for each motif is provided in Supplementary Figure S3.
Ijms 24 03958 g003
Figure 4. Chromosome distributions of the SP1Ls in M. truncatula and G. max. (A) The chromosomal location and interchromosomal relationship of the GmSP1Ls in G. max. The segmentally duplicated genes are connected by red lines. Synteny analysis of the SP1L genes between (B) M. truncatula and G. max; (C) M. truncatula and A. thaliana; and (D) G. max and A. thaliana. The gray lines in the background indicate the collinear blocks and the red lines highlight the syntenic SP1L gene pairs.
Ijms 24 03958 g004
Figure 5. Putative cis-elements and transcription factor binding sites in the promoter regions of the SP1L genes from M. truncatula and G. max. (A) The groups and color are as indicated in Figure 1. (B) The color and number of the grid indicate the numbers of different cis-acting elements in these SP1L genes. (C) The colored blocks represent different types of cis-acting elements and their locations in each SP1L gene.
Ijms 24 03958 g005
Figure 6. Tissue expression profiles of the SP1Ls in Medicago and soybean. (A) The expression profiles of two MtSP1L genes in different tissues retrieved from the GeneChip dataset. (B) The expression levels of the MtSP1L genes in various tissues verified by qRT-PCR. (C) The transcriptional levels of eight GmSP1L genes in different tissues of soybean were analyzed using the public data in Phytozome. (D) The expression levels of the GmSP1L genes in various tissues of Williams 82 verified by qRT-PCR. The color scale shows increasing expression levels from blue to red in (A,C). The qRT-PCR results are expressed as the ratio of SP1Ls expression normalized against the expression of the reference genes. All data represent the means ± SDs of three biological replicates. ‘N.A.’ indicates undetectable expression.
Ijms 24 03958 g006
Figure 7. The expression patterns of SP1L genes in response to light stress in M. truncatula (R108) and G. max (Williams 82). The seedlings of (A) M. truncatula and (C) G. max under white-light and dark growth conditions. The qRT-PCR shows the relative expression levels of the SP1L genes in (B) M. truncatula and (D) G. max hypocotyls. The bar in (A,C) equals 1 cm. ‘N.A.’ indicates undetectable expression.
Ijms 24 03958 g007
Figure 8. Effects of salt treatments on the SP1Ls transcript levels in M. truncatula and G. max. The expression levels of the MtSP1Ls (A) and GmSP1Ls (B) genes under sodium chloride treatments. The asterisk indicates significant differences among mean values compared with the control group (Student’s t-test: *** p < 0.001, ** 0.001 < p < 0.01, and * 0.01 < p < 0.1). The results were based on three replicates in three independent experiments.
Ijms 24 03958 g008
Table 1. Properties of the predicted SP1L genes in M. truncatula and G. max.
Gene NameTIGR LocusChrStart SiteEnd SiteStrandCDS (bp)Size (aa)MWs (Da)pI
MtSP1L-1MtrunA17_Chr5g0419471Medtr_chr0519,809,24219,812,567-31510410,102.979.16
MtSP1L-2MtrunA17_Chr6g0454801Medtr_chr065,010,0405,013,939+42013913,634.859.26
GmSP1L-1Glyma.01G060900Glyma_chr018,375,2618,378,172+32710810,681.558.08
GmSP1L-2Glyma.02G119200Glyma_chr0211,459,64811,462,099+32710810,575.389.16
GmSP1L-3Glyma.19G032000Glyma_chr194,032,5544,035,979+39313012,443.56 9.36
GmSP1L-4Glyma.13G055400Glyma_chr1314,317,88714,320,766-36612111,834.82 9.65
GmSP1L-5Glyma.11G021900Glyma_chr111,550,6691,551,650-3009910,278.258.11
GmSP1L-6Glyma.01G221900Glyma_chr0156,191,55256,192,480+2919610,170.117.97
GmSP1L-7Glyma.05G210800Glyma_chr0539,307,01739,308,083+264879177.079.10
GmSP1L-8Glyma.08G017200Glyma_chr081,395,7641,396,925+264879161.936.82
Note: strand, (-) means antisense strand of chromosome; (+) means positive-sense strand of chromosome; pI, isoelectric point; Mw, molecular weight.
Disclaimer/Publisher’s Note: The statements, opinions and data contained in all publications are solely those of the individual author(s) and contributor(s) and not of MDPI and/or the editor(s). MDPI and/or the editor(s) disclaim responsibility for any injury to people or property resulting from any ideas, methods, instructions or products referred to in the content.