
An Experimental Anodized and Low-Pressure Oxygen Plasma-Treated Titanium Dental Implant Surface—Preliminary Report

 ,
,  ,
,  , ,
, ,  ,
,  and
and 
Abstract
:1. Introduction
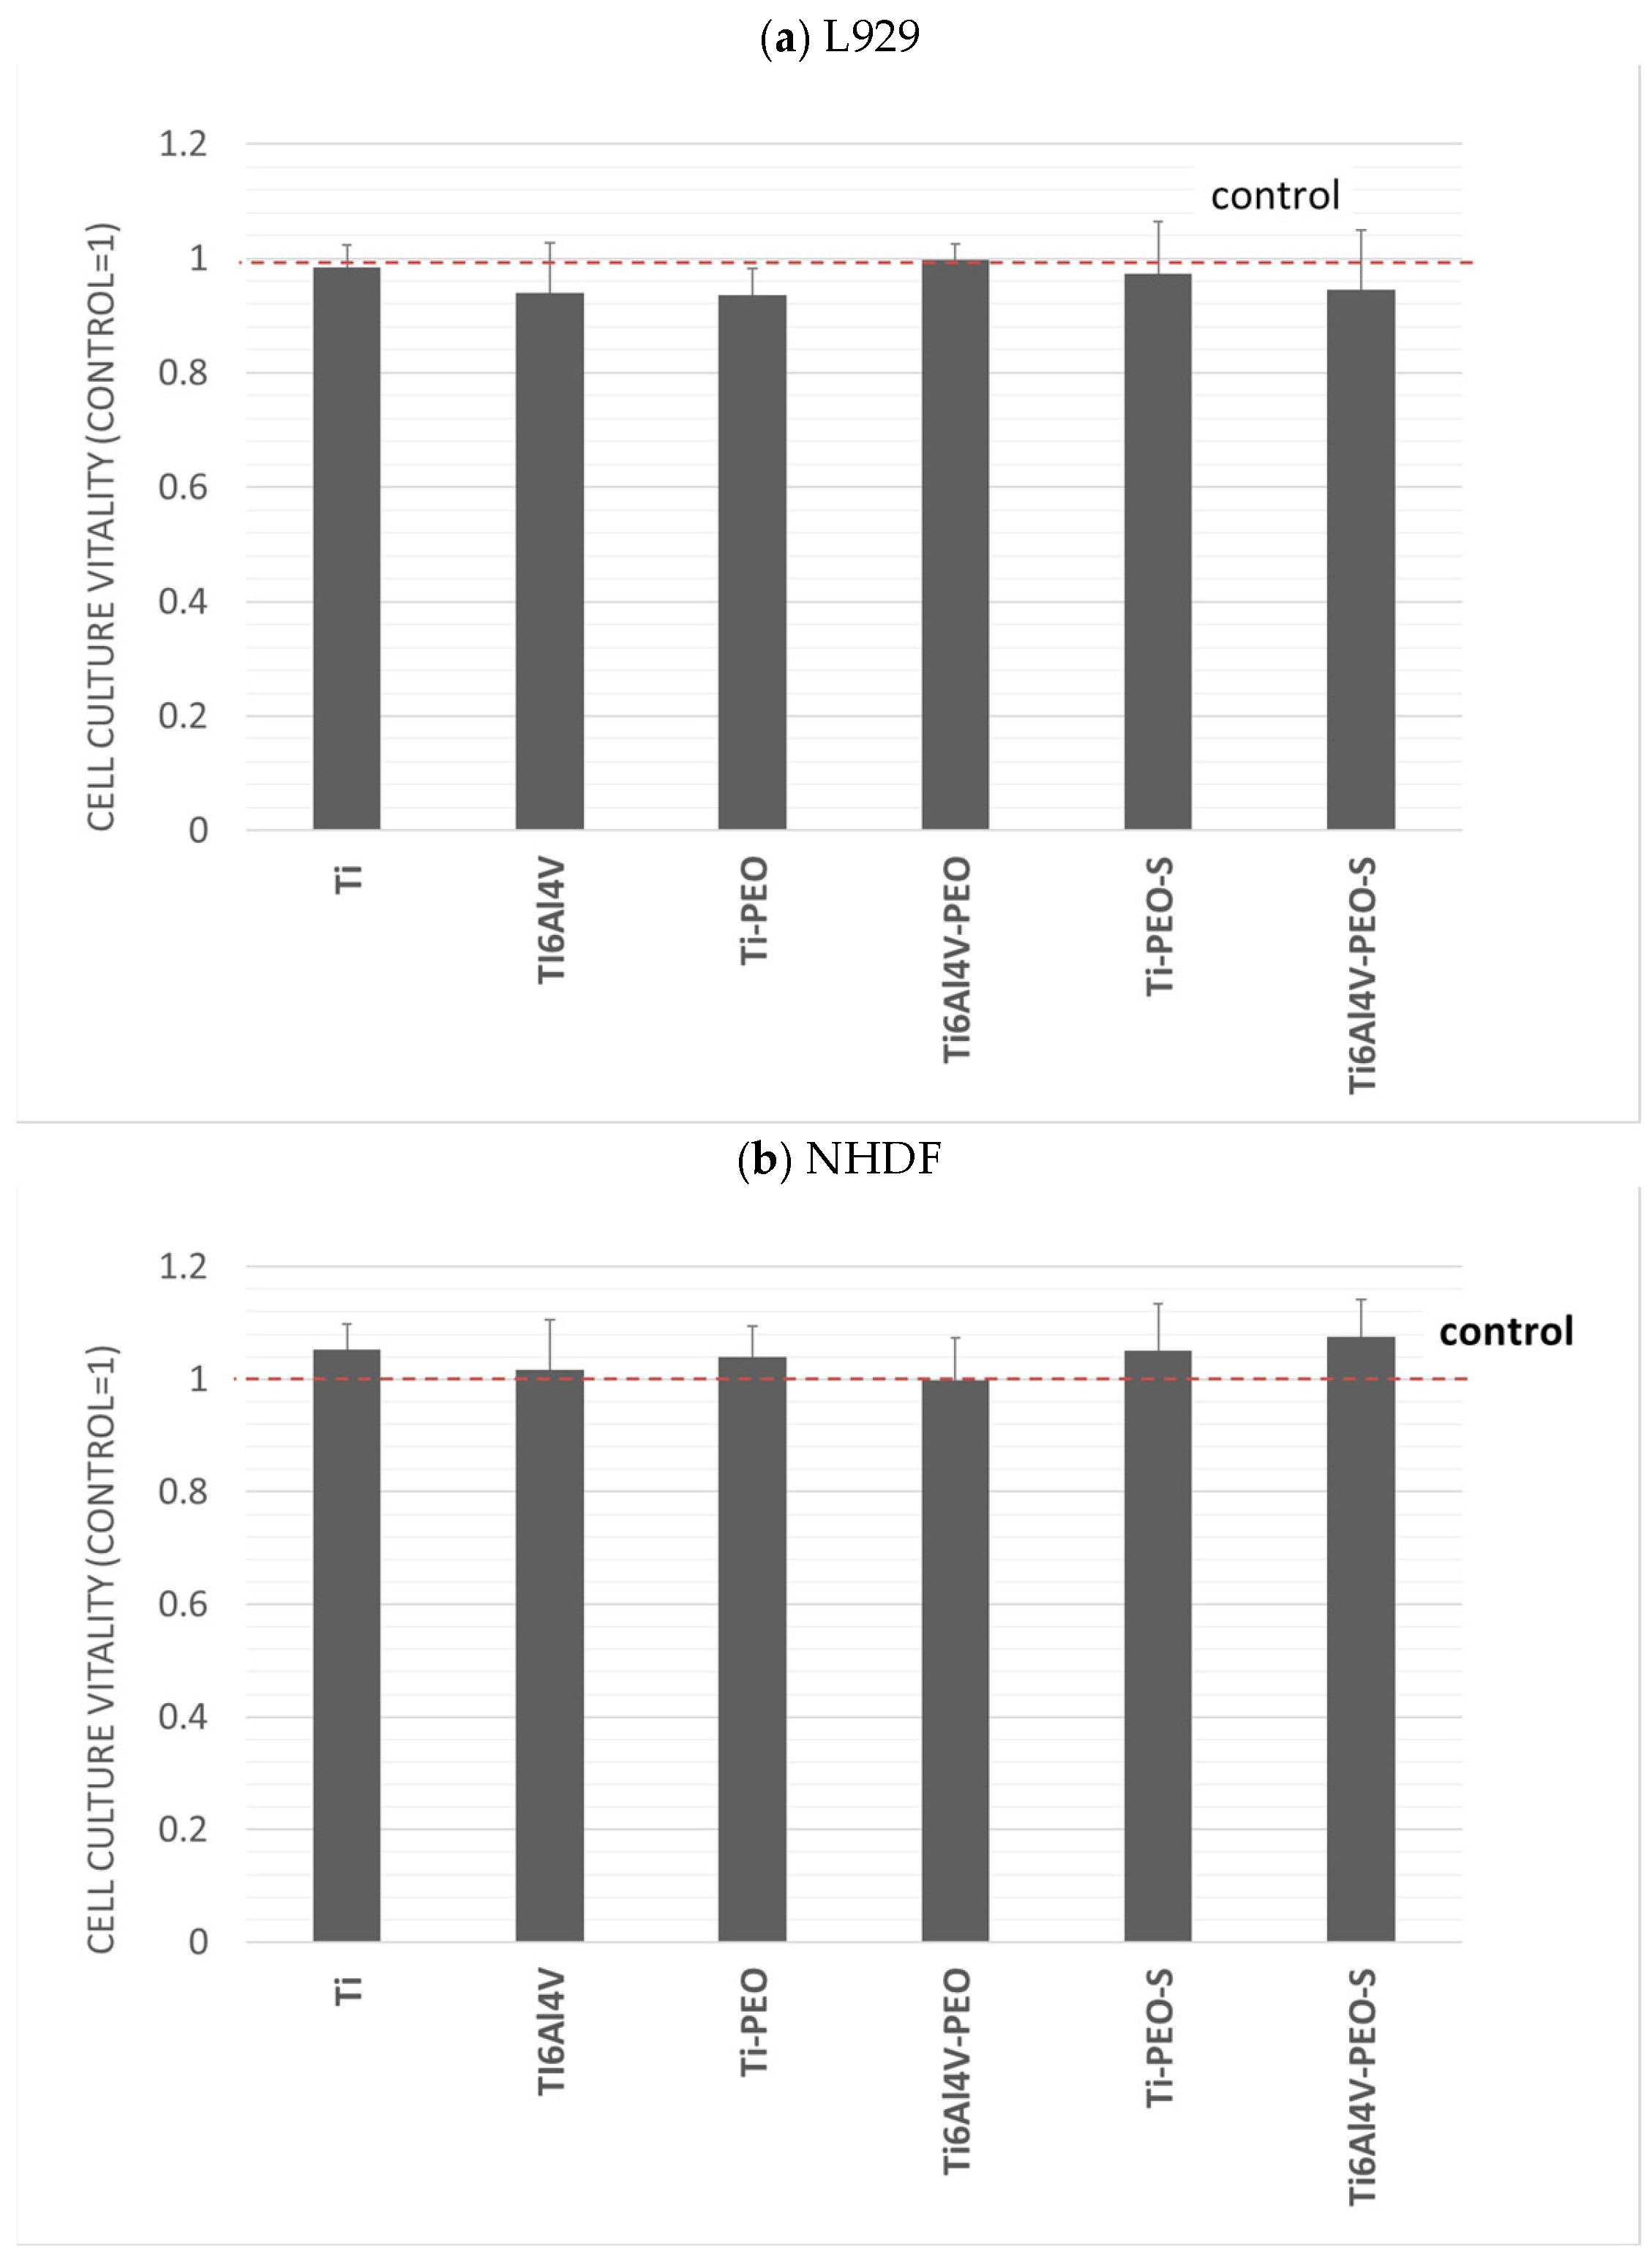
- None of the experimental samples express cytotoxicity.
- There is no difference between the cell growth and cell adherence of the experimental surface modified with plasma electrolytic oxidation (PEO) titanium plates and PEO treated with low-pressure oxygen plasma (PEO-S) compared to standard SLA surface.
- There are no correlations between a fractal dimension (FD) and texture analysis (TA), nor between implant surface roughness, Sa, and cell growth.
- There are no differences between evaluated surfaces in an aspect of FD and TA.
2. Results
2.1. Surface Roughness Outcomes
2.2. Biological Analysis Outcomes
2.2.1. In Vitro Cytotoxicity Assessment
2.2.2. Co-Culture of Cells with Test Materials
2.2.3. Cell Attachment
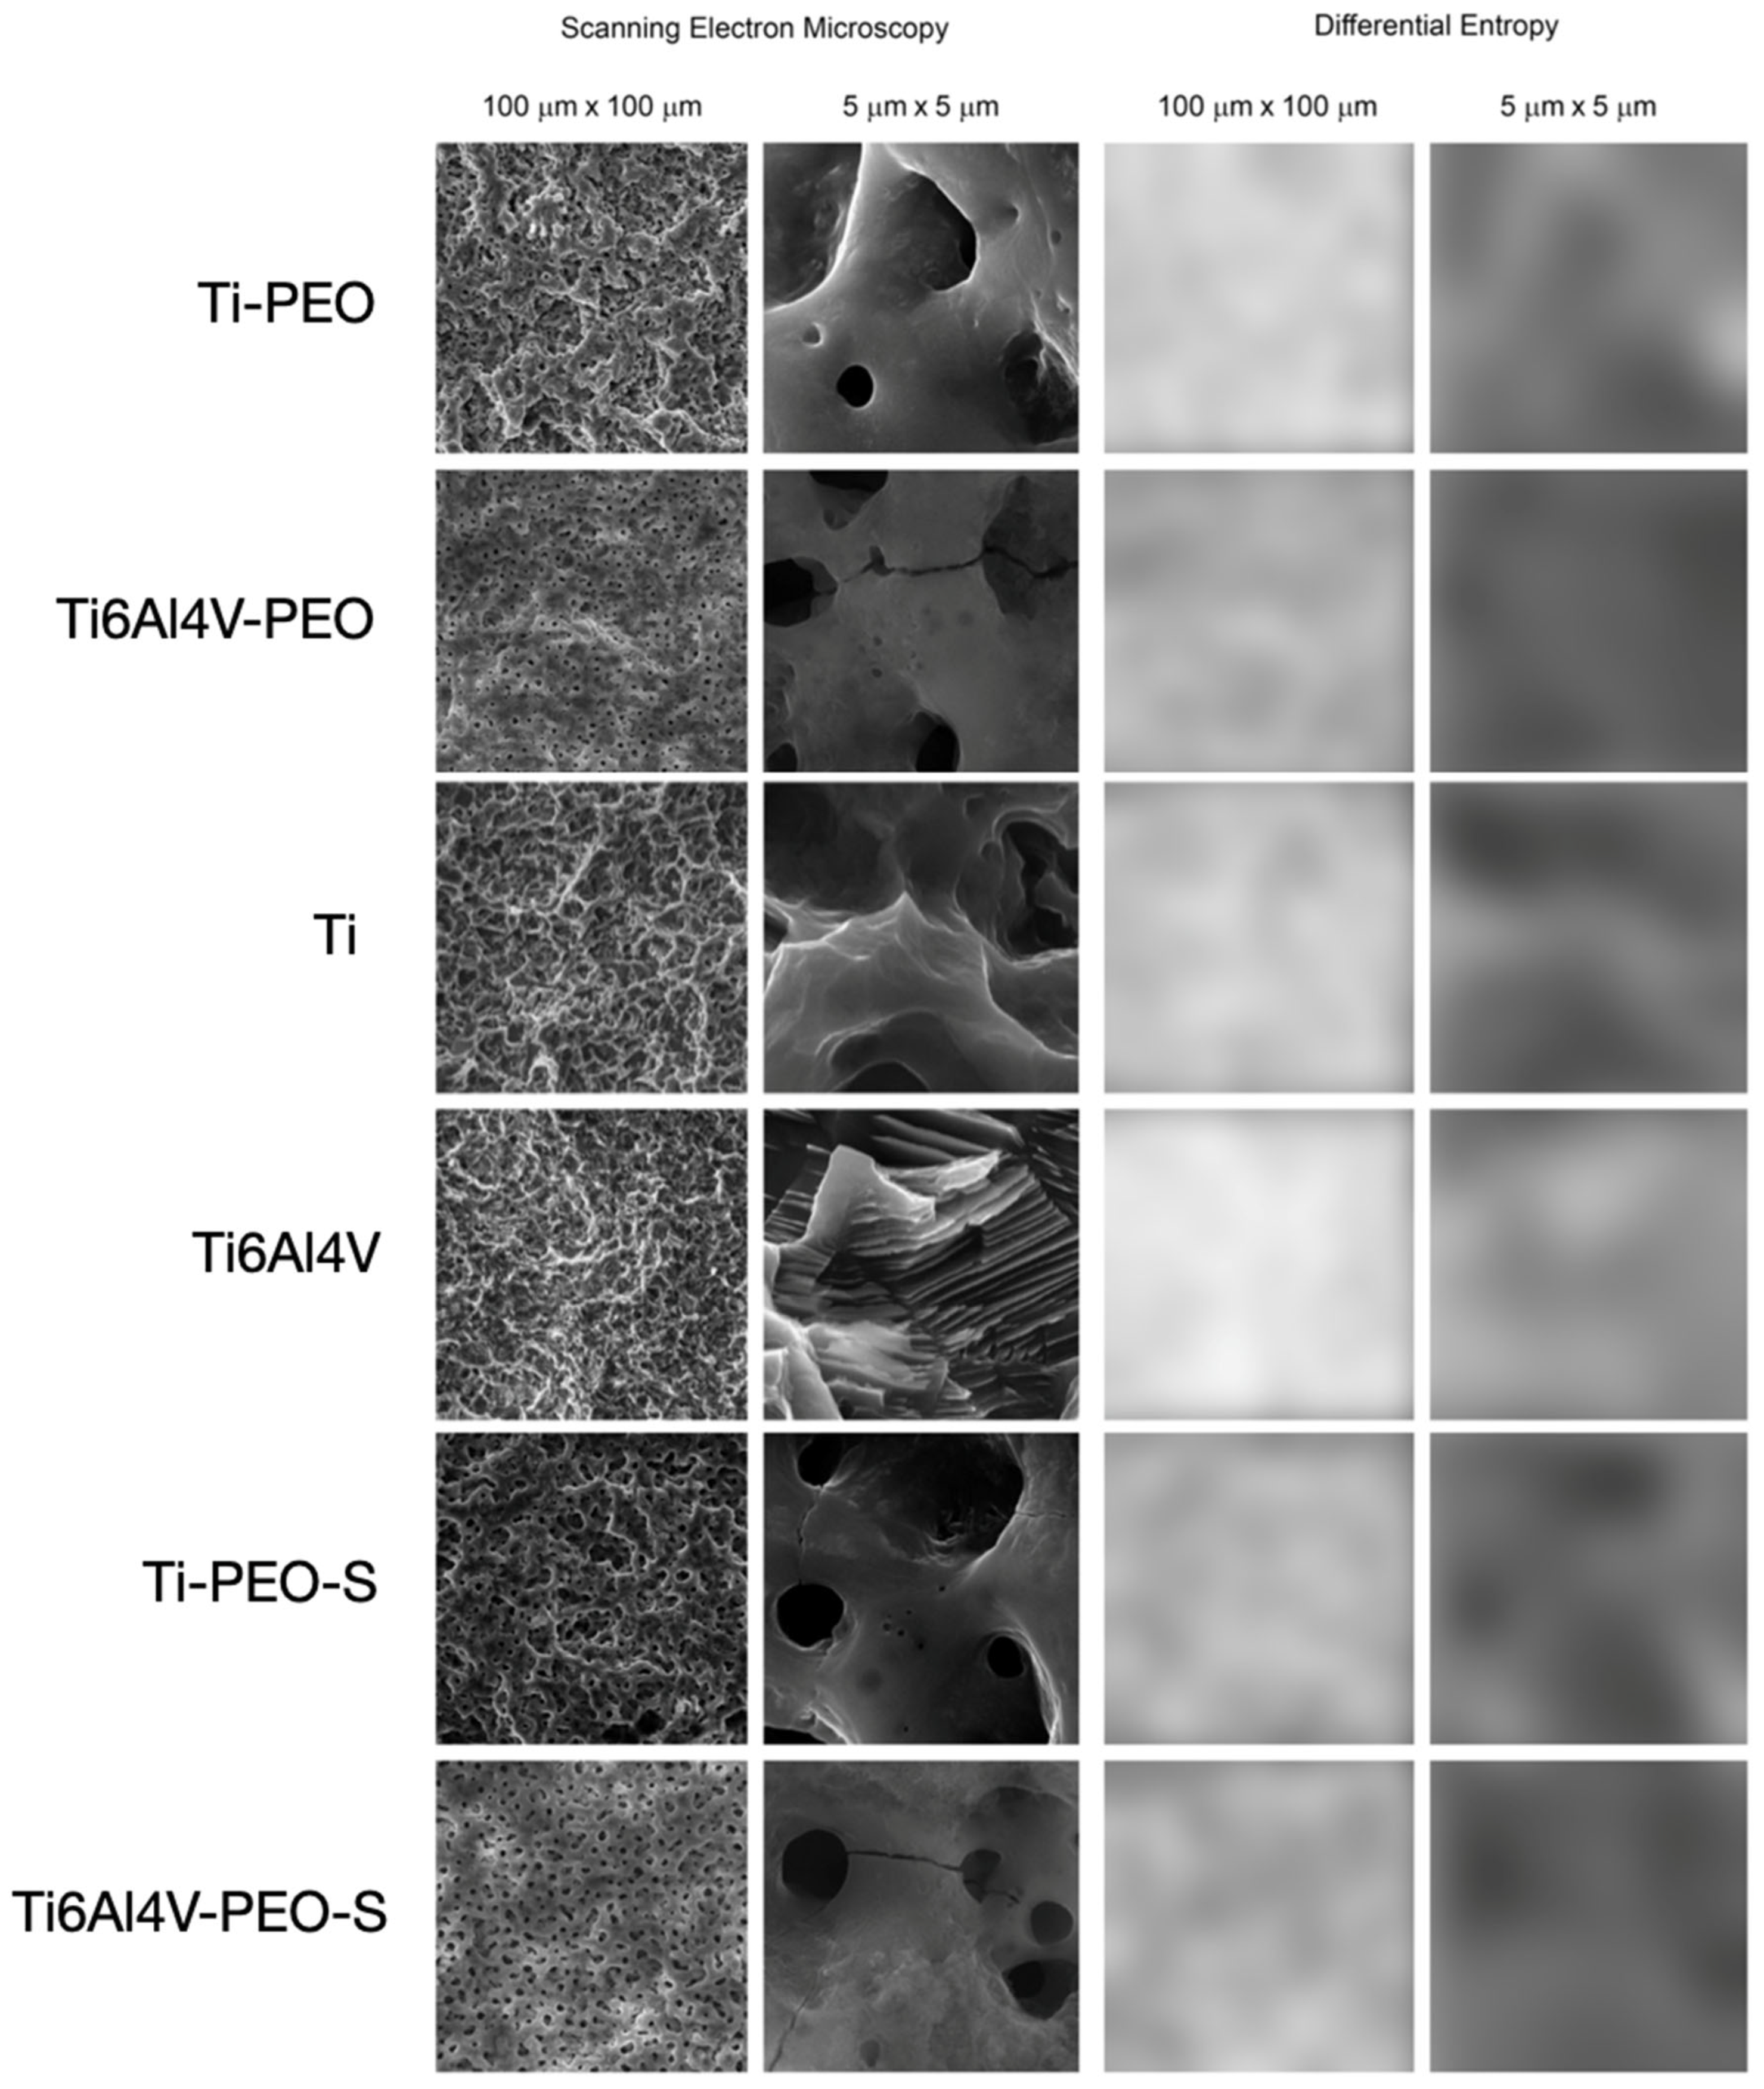
2.3. Fractal Dimension Analysis
2.4. Texture Analysis
- The first null hypothesis was accepted. None of the experimental samples expressed cytotoxicity.
- The second null hypothesis has been rejected. Samples after surface treatment have substantially improved cell growth and cell adherence compared to reference SLA samples.
- The third null hypothesis has been sustained. We did not reveal a correlation between examined features, except a negative correlation between FD, difference entropy (DifEntrp) (in scale 100 μm × 100 μm), and amount of cells, a positive moderate correlation between DifEntrp and number of cells, and a positive strong correlation between the DifEntrp and FD in scale 100 μm × 100 μm.
- The fourth null hypothesis has been rejected. Our study revealed statistically significant differences between examined surfaces in the aspect of fractal dimension and texture analysis.
3. Discussion
4. Materials and Methods
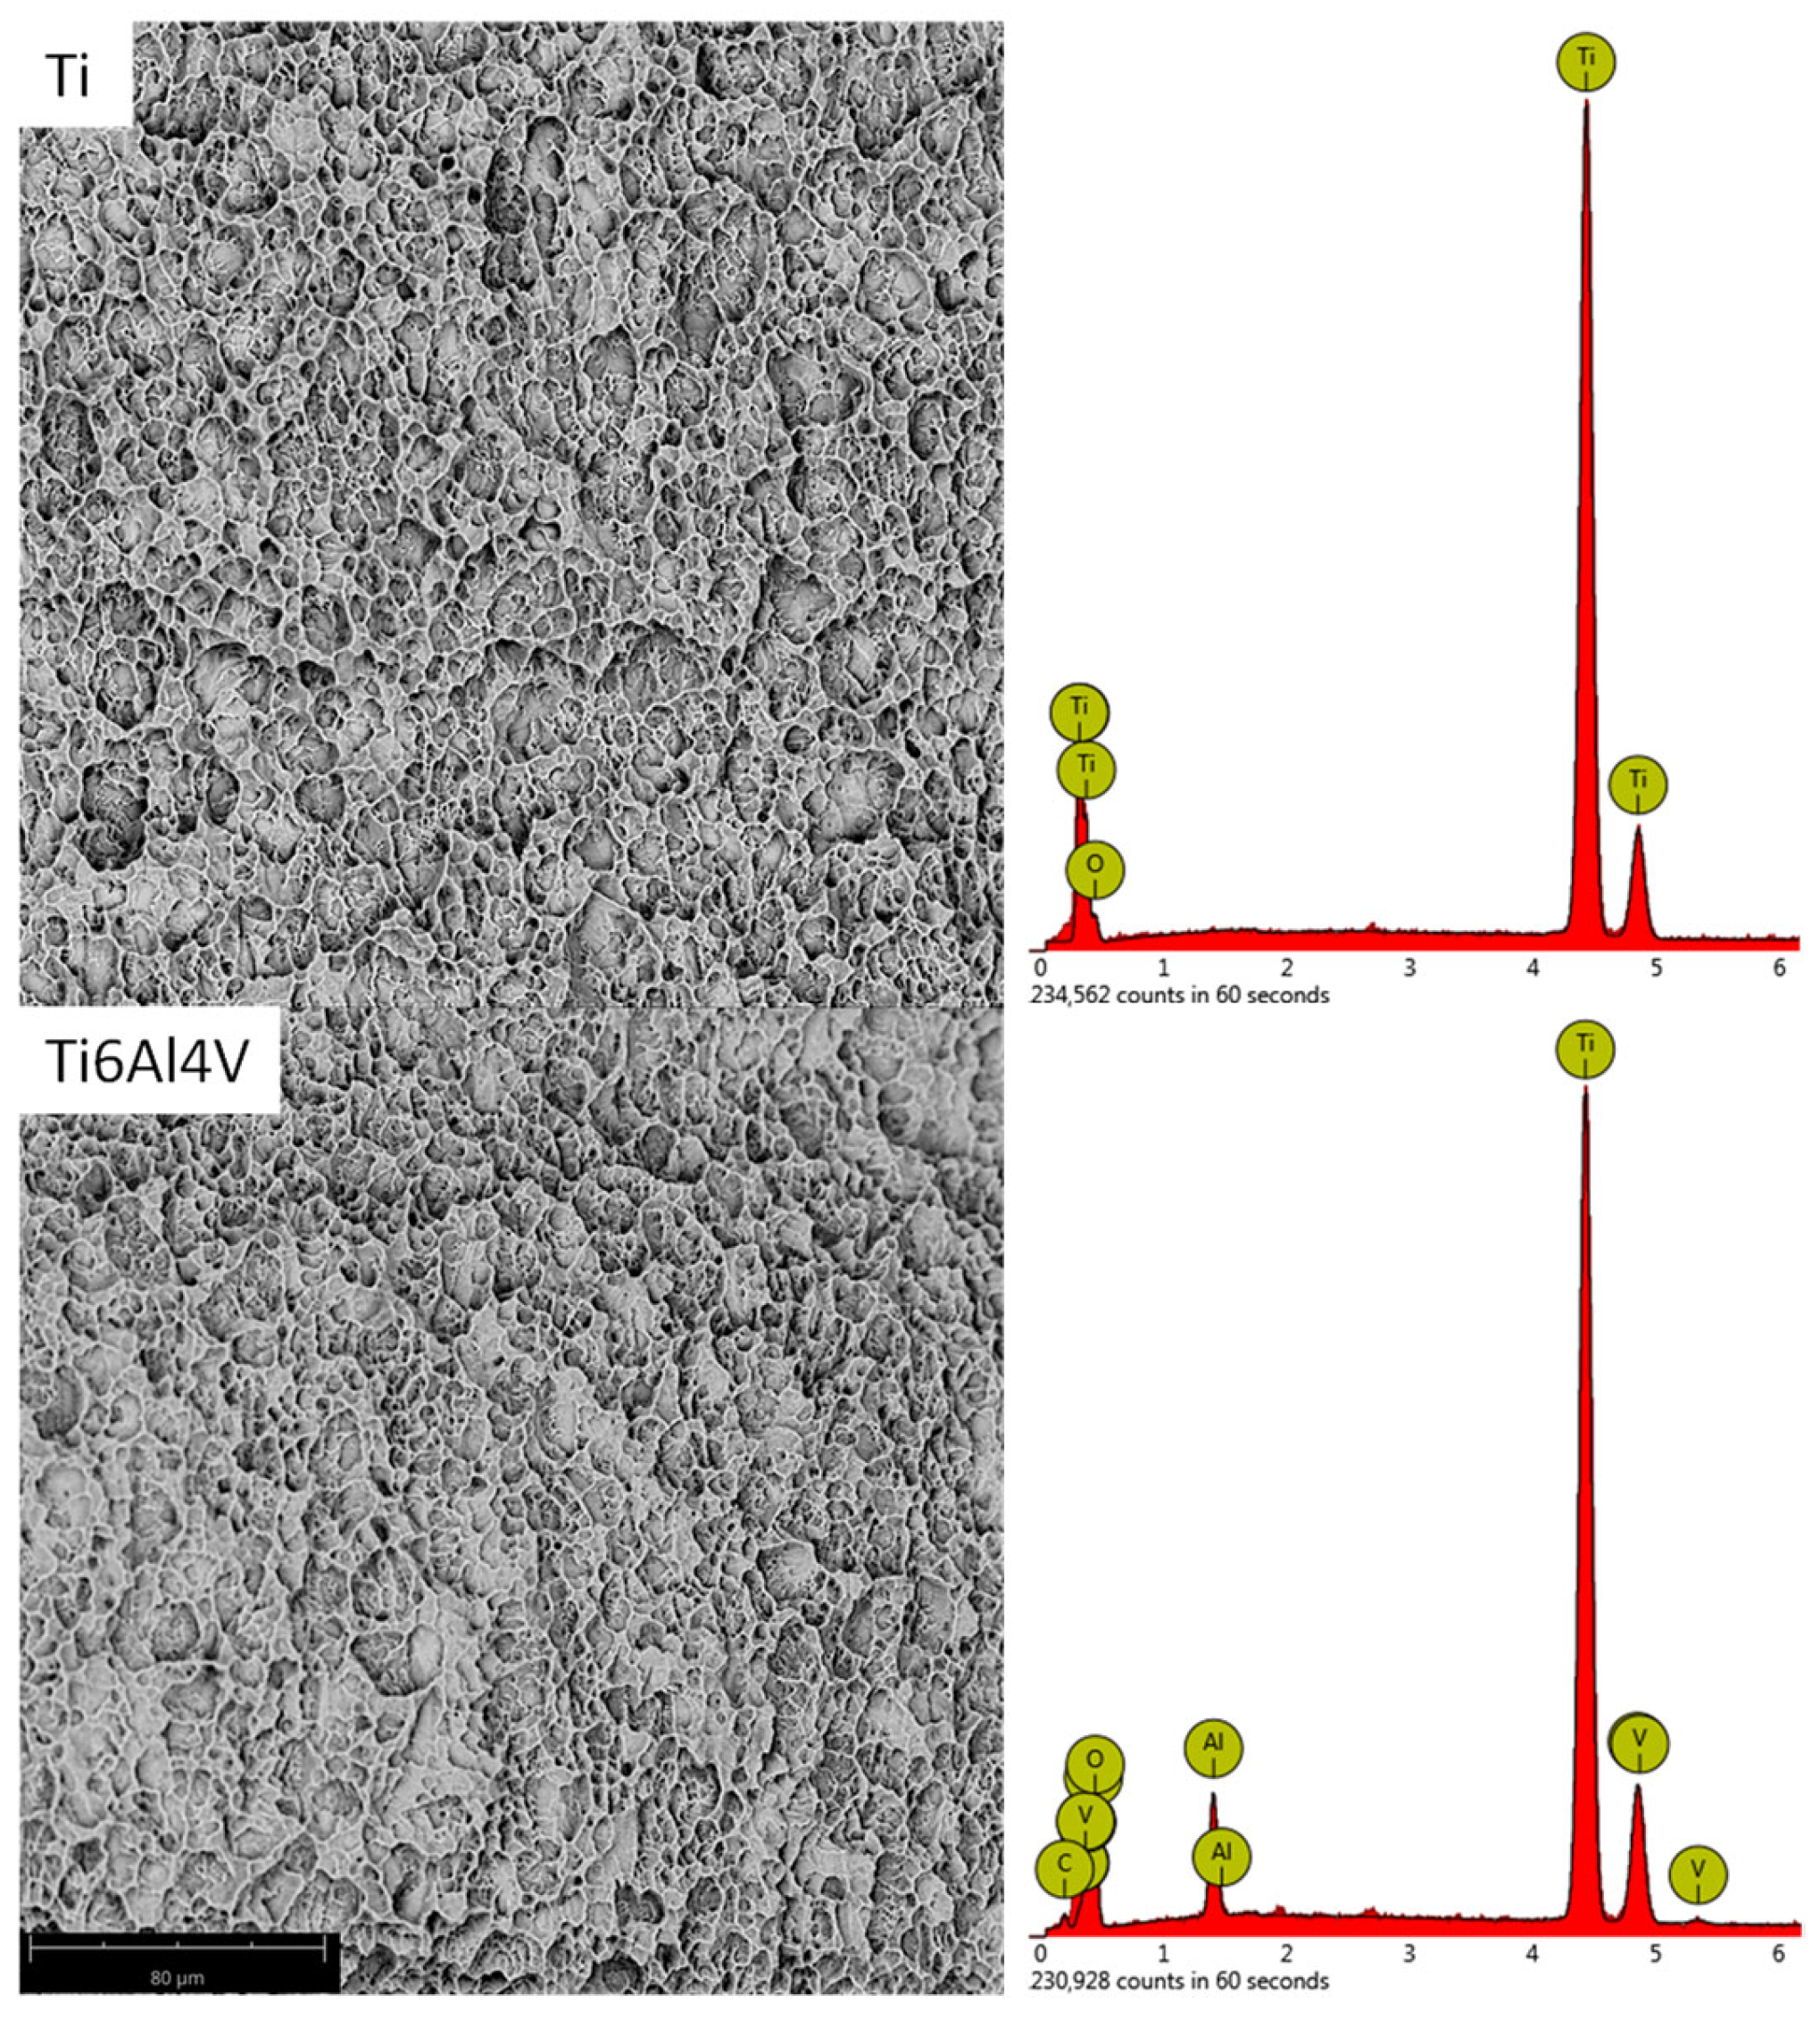
4.1. Titanium Plates Preparation and Surface Modification
4.2. Surface Analysis Surface Topography Ra, Rz, Sa Measurement
4.3. Surface Analysis FDA
4.4. Surface Analysis TA
4.5. Biological Analyses
4.5.1. Cell Culture
4.5.2. Preparation of Samples
4.5.3. Evaluation of the Effects on Growth and Vitality of Cell Cultures
4.5.4. Co-Culture of Cells with Materials
4.5.5. Cell Attachment
4.6. Statistical Analysis
4.7. Study Limitations
5. Conclusions
Author Contributions
Funding
Institutional Review Board Statement
Informed Consent Statement
Data Availability Statement
Acknowledgments
Conflicts of Interest
References
- Hoque, M.E.; Showva, N.N.; Ahmed, M.; Bin Rashid, A.; Sadique, S.E.; El-Bialy, T.; Xu, H. Titanium and titanium alloys in dentistry: Current trends, recent developments, and future prospects. Heliyon 2022, 8, e11300. [Google Scholar] [CrossRef]
- Liu, X.; Chen, S.; Tsoi, J.K.H.; Matinlinna, J.P. Binary titanium alloys as dental implant materials-a review. Regen. Biomater. 2017, 4, 315–323. [Google Scholar] [CrossRef] [PubMed]
- Cruz, M.B.; Silva, N.; Marques, J.F.; Mata, A.; Silva, F.S.; Caramês, J. Biomimetic Implant Surfaces and Their Role in Biological Integration—A Concise Review. Biomimetics 2022, 7, 74. [Google Scholar] [CrossRef] [PubMed]
- Dohan Ehrenfest, D.M.; Coelho, P.G.; Kang, B.S.; Sul, Y.T.; Albrektsson, T. Classification of osseointegrated implant surfaces: Materials, chemistry and topography. Trends Biotechnol. 2010, 28, 198–206. [Google Scholar] [CrossRef]
- Wennerberg, A.; Albrektsson, T. Effects of titanium surface topography on bone integration: A systematic review. Clin. Oral Implants Res. 2009, 20, 172–184. [Google Scholar] [CrossRef]
- Jurczyszyn, K.; Kubasiewicz-Ross, P.; Nawrot-Hadzik, I.; Gedrange, T.; Dominiak, M.; Hadzik, J. Fractal dimension analysis a supplementary mathematical method for bone defect regeneration measurement. Ann. Anat. 2018, 219, 83–88. [Google Scholar] [CrossRef]
- Hadzik, J.; Kubasiewicz-Ross, P.; Simka, W.; Gębarowski, T.; Barg, E.; Cieśla-Niechwiadowicz, A.; Szajna, A.T.; Szajna, E.; Gedrange, T.; Kozakiewicz, M.; et al. Fractal Dimension and Texture Analysis in the Assessment of Experimental Laser-Induced Periodic Surface Structures (LIPSS) Dental Implant Surface-In Vitro Study Preliminary Report. Materials 2022, 15, 2713. [Google Scholar] [CrossRef]
- Grzebieluch, W.; Kowalewski, P.; Grygier, D.; Rutkowska-Gorczyca, M.; Kozakiewicz, M.; Jurczyszyn, K. Printable and machinable dental restorative composites for cad/cam application—Comparison of mechanical properties, fractographic, texture and fractal dimension analysis. Materials 2021, 14, 4919. [Google Scholar] [CrossRef]
- Schestatsky, R.; Zucuni, C.P.; Dapieve, K.S.; Burgo, T.A.L.; Spazzin, A.O.; Bacchi, A.; Valandro, L.F.; Pereira, G.K.R. Microstructure, topography, surface roughness, fractal dimension, internal and marginal adaptation of pressed and milled lithium-disilicate monolithic restorations. J. Prosthodont. Res. 2020, 64, 12–19. [Google Scholar] [CrossRef] [PubMed]
- Costa, A.L.F.; de Souza Carreira, B.; Fardim, K.A.C.; Nussi, A.D.; da Silva Lima, V.C.; Miguel, M.M.V.; Jardini, M.A.N.; Santamaria, M.P.; de Castro Lopes, S.L.P. Texture analysis of cone beam computed tomography images reveals dental implant stability. Int. J. Oral Maxillofac. Surg. 2021, 50, 1609–1616. [Google Scholar] [CrossRef]
- Abdollah, V.; Parent, E.C.; Dolatabadi, S.; Marr, E.; Croutze, R.; Wachowicz, K.; Kawchuk, G. Texture analysis in the classification of T2-weighted magnetic resonance images in persons with and without low back pain. J. Orthop. Res. 2021, 39, 2187–2196. [Google Scholar] [CrossRef]
- Kozakiewicz, M.; Wach, T. Exploring the Importance of Corticalization Occurring in Alveolar Bone Surrounding a Dental Implant. J. Clin. Med. 2022, 11, 7189. [Google Scholar] [CrossRef]
- Kozakiewicz, M. Measures of Corticalization. J. Clin. Med. 2022, 11, 5463. [Google Scholar] [CrossRef]
- Makowiecki, A.; Hadzik, J.; Błaszczyszyn, A.; Gedrange, T.; Dominiak, M. An evaluation of superhydrophilic surfaces of dental implants—A systematic review and meta-analysis. BMC Oral Health 2019, 19, 79. [Google Scholar] [CrossRef]
- Hadzik, J.; Kubasiewicz-Ross, P.; Nawrot-Hadzik, I.; Gedrange, T.; Pitułaj, A.; Dominiak, M. Short (6 mm) and regular dental implants in the posterior maxilla–7-years follow-up study. J. Clin. Med. 2021, 10, 940. [Google Scholar] [CrossRef] [PubMed]
- De Fenzo, A.; Scherillo, F.; Astarita, A.; Testani, C.; Squillace, A.; Bellucci, F. Influence of hot deformation on the electrochemical behavior of natural oxides of hipped Ti6Al4V. Corros. Sci. 2015, 94, 79–87. [Google Scholar] [CrossRef]
- Simka, W.; Pogorielov, M.; Mishchenko, O. Method for Modifying the Surface of Implants Made of Titanium or Titanium. Alloys. Patent PL-240205, 23 June 2019. [Google Scholar]
- Kyrylenko, S.; Oleshko, O.; Warchol, F.; Husak, Y.; Basiaga, M.; Kazek-Kesik, A.; Dercz, G.; Pogorielov, M.; Simka, W. A New Solution for an Electrochemical Modification of Titanium Surface. J. Nano-Electron. Phys. 2020, 12, 06038. [Google Scholar] [CrossRef]
- Fattah-Alhosseini, A.; Molaei, M.; Babaei, K. The effects of nano- and micro-particles on properties of plasma electrolytic oxidation (PEO) coatings applied on titanium substrates: A review. Surf. Interfaces 2020, 21, 100659. [Google Scholar] [CrossRef]
- Jamali, R.; Bordbar-Khiabani, A.; Yarmand, B.; Mozafari, M.; Kolahi, A. Effects of co-incorporated ternary elements on biocorrosion stability, antibacterial efficacy, and cytotoxicity of plasma electrolytic oxidized titanium for implant dentistry. Mater. Chem. Phys. 2022, 276, 125436. [Google Scholar] [CrossRef]
- Francisca, F.G.S.; Vitoriano, J.D.O.; Alves-Junior, C. Controlling plasma electrolytic oxidation of titanium using current pulses compatible with the duration of microdischarges. Results Mater. 2022, 15, 100310. [Google Scholar] [CrossRef]
- Kyrylenko, S.; Warchoł, F.; Oleshko, O.; Husak, Y.; Kazek-Kęsik, A.; Korniienko, V.; Deineka, V.; Sowa, M.; Maciej, A.; Michalska, J.; et al. Effects of the sources of calcium and phosphorus on the structural and functional properties of ceramic coatings on titanium dental implants produced by plasma electrolytic oxidation. Mater. Sci. Eng. C 2021, 119, 111607. [Google Scholar] [CrossRef]
- Michalska, J.; Sowa, M.; Stolarczyk, A.; Warchoł, F.; Nikiforow, K.; Pisarek, M.; Dercz, G.; Pogorielov, M.; Mishchenko, O.; Simka, W. Plasma electrolytic oxidation of Zr-Ti-Nb alloy in phosphate-formate-EDTA electrolyte. Electrochim. Acta 2022, 419, 140375. [Google Scholar] [CrossRef]
- Chou, W.C.; Wang, R.C.C.; Huang, C.L.; Lee, T.M. The effect of plasma treatment on the osseointegration of rough titanium implant: A histo-morphometric study in rabbits. J. Dent. Sci. 2018, 13, 267–273. [Google Scholar] [CrossRef]
- Liu, Y.; Rath, B.; Tingart, M.; Eschweiler, J. Role of implants surface modification in osseointegration: A systematic review. J. Biomed. Mater. Res. Part A 2020, 108, 470–484. [Google Scholar] [CrossRef]
- Wang, L.; Wang, W.; Zhao, H.; Liu, Y.; Liu, J.; Bai, N. Bioactive Effects of Low-Temperature Argon-Oxygen Plasma on a Titanium Implant Surface. ACS Omega 2020, 5, 3996–4003. [Google Scholar] [CrossRef] [PubMed]
- Hadzik, J.; Kubasiewicz-Ross, P.; Gębarowski, T.; Waloszczyk, N.; Maciej, A.; Stolarczyk, A.; Gedrange, T.; Dominiak, M.; Szajna, E.; Simka, W. An Experimental Anodized Titanium Surface for Transgingival Dental Implant Elements—Preliminary Report. J. Funct. Biomater. 2023, 14, 34. [Google Scholar] [CrossRef] [PubMed]
- Chen, C.S.; Chang, J.H.; Srimaneepong, V.; Wen, J.Y.; Tung, O.H.; Yang, C.H.; Lin, H.C.; Lee, T.H.; Han, Y.; Huang, H.H. Improving the in vitro cell differentiation and in vivo osseointegration of titanium dental implant through oxygen plasma immersion ion implantation treatment. Surf. Coat. Technol. 2020, 399, 126125. [Google Scholar] [CrossRef]
- Kubasiewicz-Ross, P.; Fleischer, M.; Pitułaj, A.; Hadzik, J.; Nawrot-Hadzik, I.; Bortkiewicz, O.; Dominiak, M.; Jurczyszyn, K. Evaluation of the three methods of bacterial decontamination on implants with three different surfaces. Adv. Clin. Exp. Med. 2020, 29, 177–182. [Google Scholar] [CrossRef]
- Romandini, M.; Lima, C.; Pedrinaci, I.; Araoz, A.; Soldini, M.C.; Sanz, M. Prevalence and risk/protective indicators of peri-implant diseases: A university-representative cross-sectional study. Clin. Oral Implants Res. 2021, 32, 112–122. [Google Scholar] [CrossRef] [PubMed]
- Hussain, R.A.; Miloro, M.; Cohen, J.B. An Update on the Treatment of Periimplantitis. Dent. Clin. North Am. 2021, 65, 43–56. [Google Scholar] [CrossRef]
- Blinova, M.I.; Yudintzeva, N.M.; Nikolaenko, N.S.; Potokin, I.L.; Raykhtsaum, G.; Pitkin, M.R.; Pinaev, G.P. Cell cultivation on porous titanium implants with various structures. Cell Tissue Biol. 2010, 4, 572–579. [Google Scholar] [CrossRef]
- Whiteside, P.; Matykina, E.; Gough, J.E.; Skeldon, P.; Thompson, G.E. In vitro evaluation of cell proliferation and collagen synthesis on titanium following plasma electrolytic oxidation. J. Biomed. Mater. Res. Part A 2010, 94, 38–46. [Google Scholar] [CrossRef]
- Kato, C.N.A.O.; Barra, S.G.; Tavares, N.P.K.; Amaral, T.M.P.; Brasileiro, C.B.; Mesquita, R.A.; Abreu, L.G. Use of fractal analysis in dental images: A systematic review. Dentomaxillofacial Radiol. 2020, 49, 20180457. [Google Scholar] [CrossRef] [PubMed]
- Skośkiewicz-Malinowska, K.; Mysior, M.; Rusak, A.; Kuropka, P.; Kozakiewicz, M.; Jurczyszyn, K. Application of texture and fractal dimension analysis to evaluate subgingival cement surfaces in terms of biocompatibility. Materials 2021, 14, 5857. [Google Scholar] [CrossRef]
- Haralick, R.M.; Dinstein, I.; Shanmugam, K. Textural Features for Image Classification. IEEE Trans. Syst. Man Cybern. 1973, SMC-3, 610–621. [Google Scholar] [CrossRef]
- Szczypiński, P.M.; Strzelecki, M.; Materka, A.; Klepaczko, A. MaZda-A software package for image texture analysis. Comput. Methods Programs Biomed. 2009, 94, 66–76. [Google Scholar] [CrossRef] [PubMed]
- Trafalski, M.; Kozakiewicz, M.; Jurczyszyn, K. Application of fractal dimension and texture analysis to evaluate the effectiveness of treatment of a venous lake in the oral mucosa using a 980 nm diode laser—A preliminary study. Materials 2021, 14, 4140. [Google Scholar] [CrossRef] [PubMed]
- Kołaciński, M.; Kozakiewicz, M.; Materka, A. Textural entropy as a potential feature for quantitative assessment of jaw bone healing process. Arch. Med. Sci. 2015, 11, 78–84. [Google Scholar] [CrossRef] [PubMed]


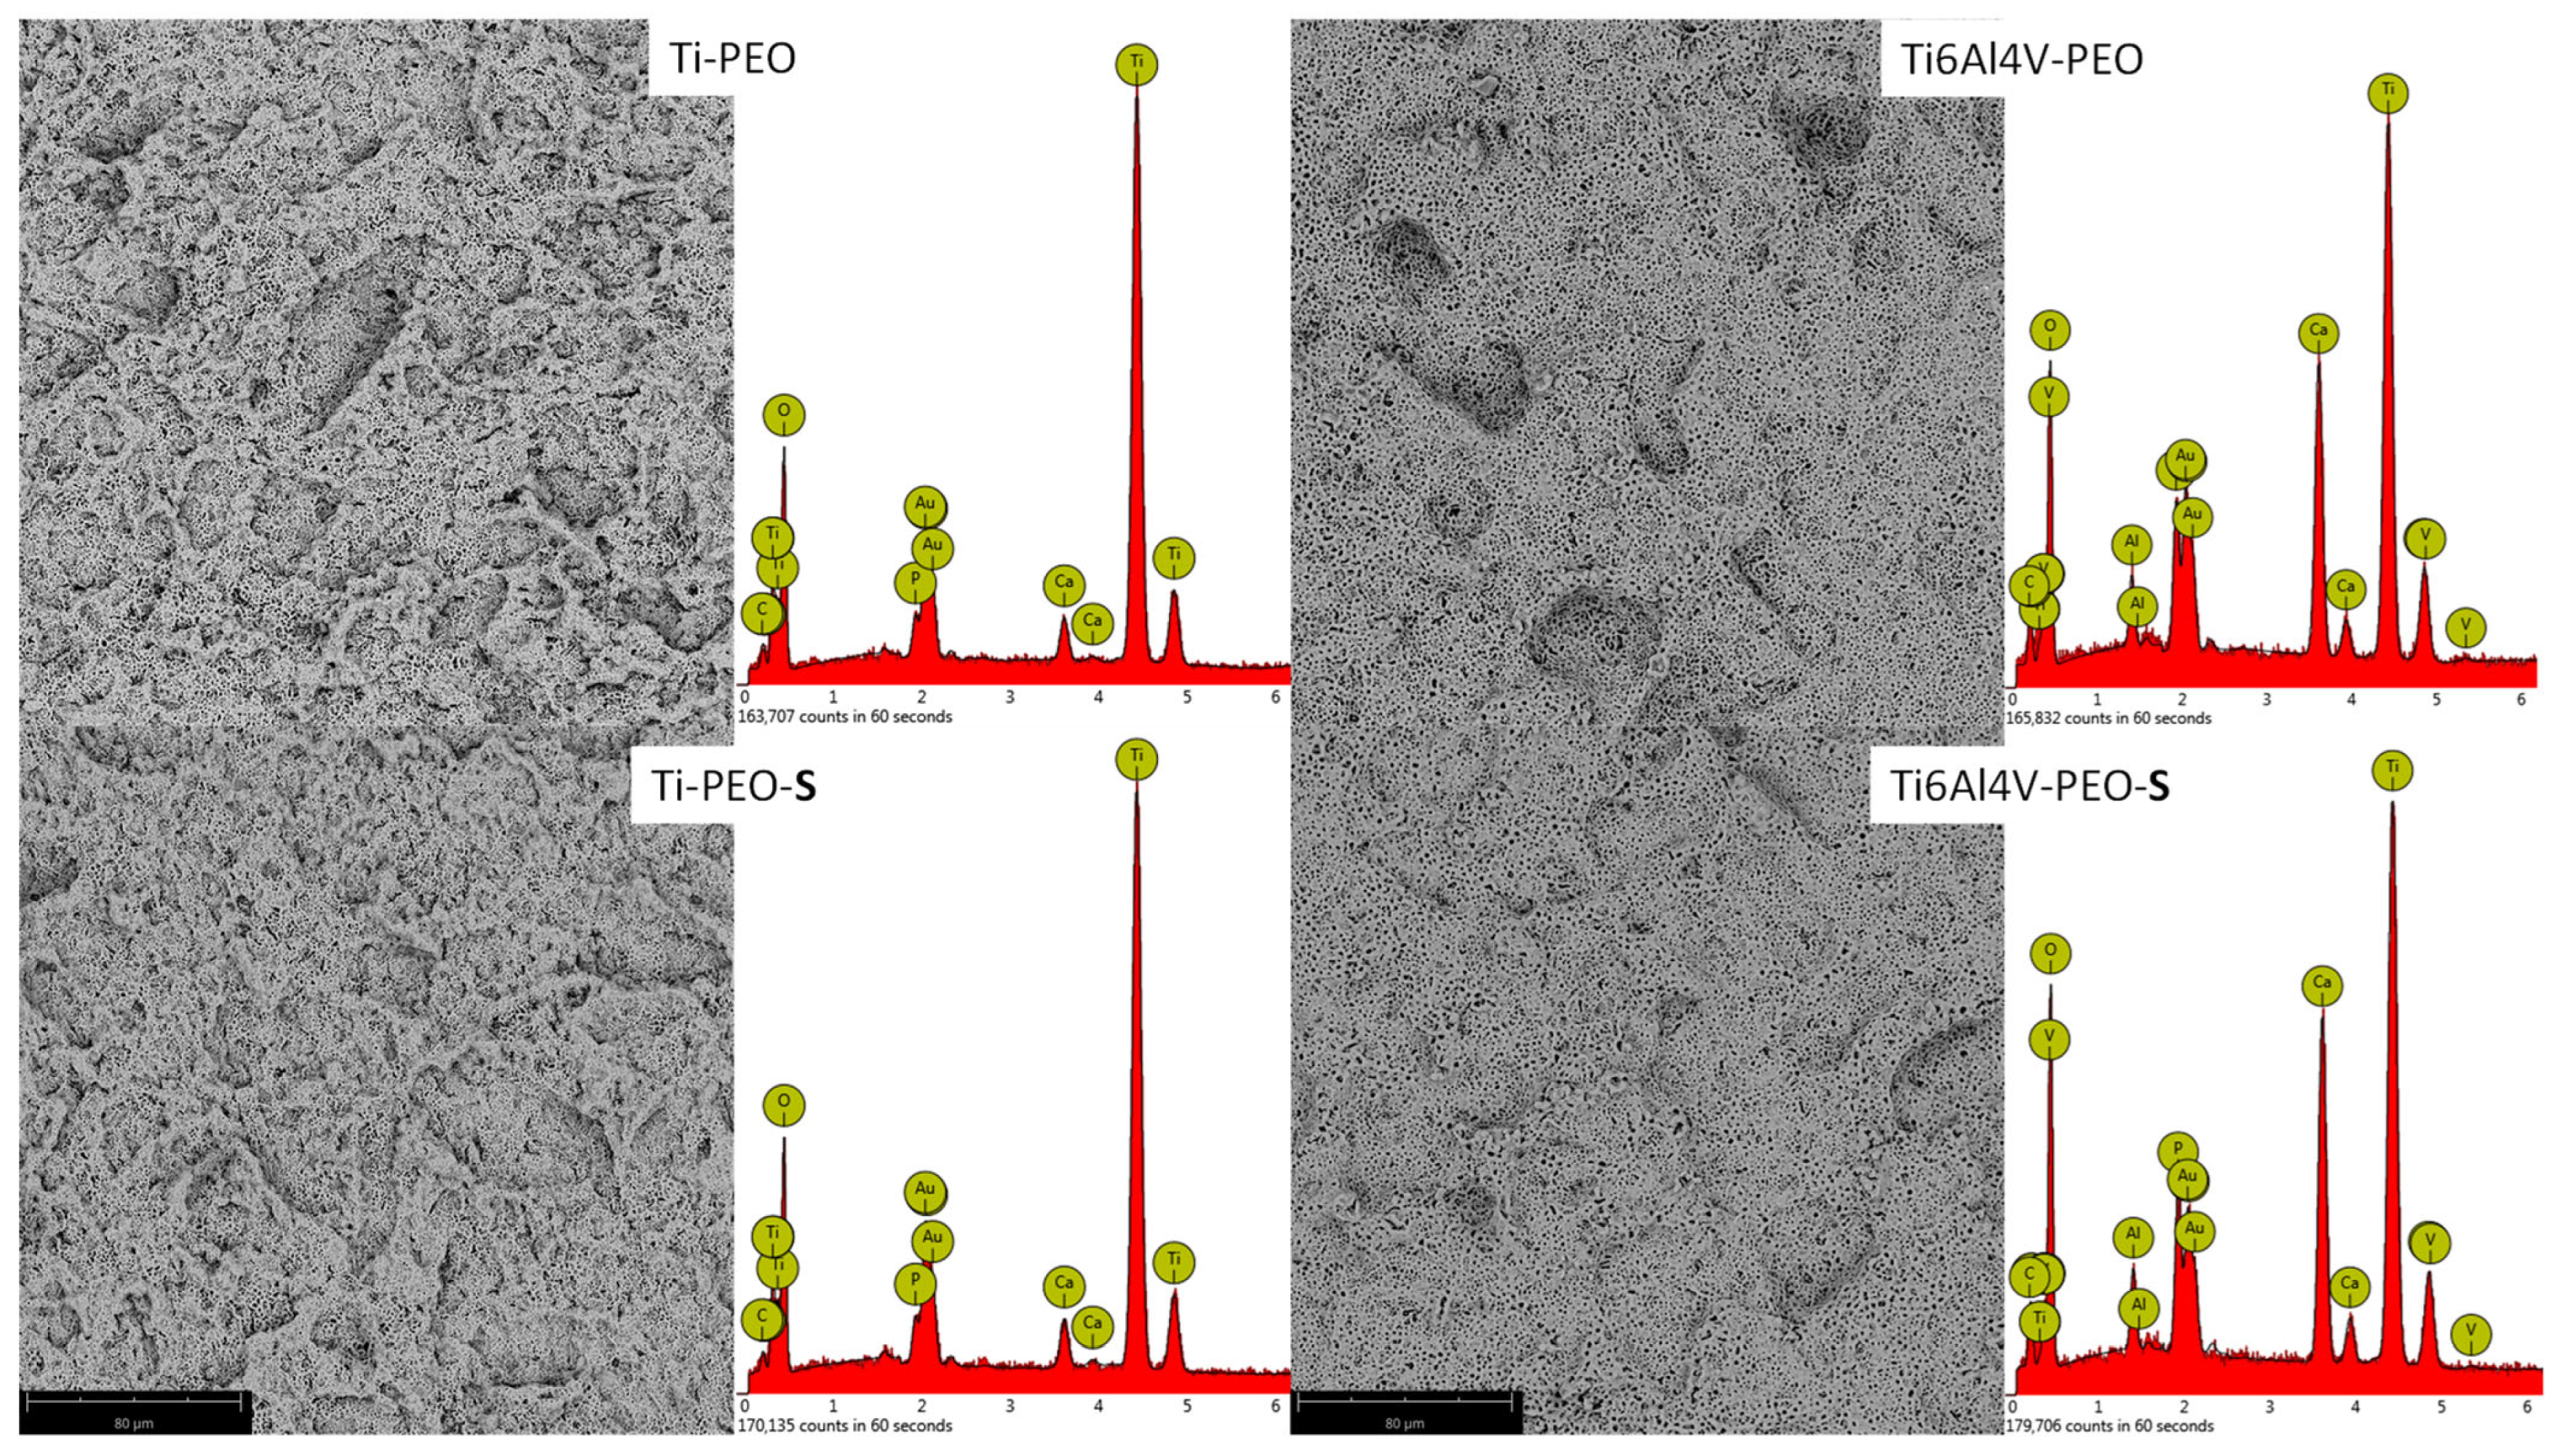
| Ti | Al | V | O * | Ca | P | |
|---|---|---|---|---|---|---|
| Ti-PEO | 35 | - | - | 60 | 3 | 2 |
| Ti6Al4V-PEO | 23 | 2 | 1 | 58 | 12 | 3 |
| Ti-PEO-S | 35 | - | - | 61 | 3 | 1 |
| Ti6Al4V-PEO-S | 21 | 2 | 1 | 61 | 12 | 3 |
| Surface Name | Sa | SD |
|---|---|---|
| Ti-PEO | 2.38 | 0.14 |
| Ti6Al4V-PEO | 1.74 | 0.21 |
| Ti-PEO-S | 0.86 | 0.02 |
| Ti6Al4V-PEO-S | 0.59 | 0.02 |
| TI6Al4V | 0.72 | 0.01 |
| Ti | 1.42 | 0.01 |
| Surface Name | FD (ROI = 100 μm × 100 μm) | p < 0.05 | ||
|---|---|---|---|---|
| Mean | SD | |||
| 1 | Ti-PEO | 1.854240 | 0.004839 | 2,3,4,5,6 |
| 2 | Ti6Al4V-PEO | 1.782000 | 0.007372 | 1,3,5,6 |
| 3 | Ti-PEO-S | 1.816000 | 0.014739 | 1,2,3,5 |
| 4 | Ti6Al4V-PEO-S | 1.782740 | 0.011618 | 1,3,5,6 |
| 5 | Ti | 1.804660 | 0.007630 | 1,2,4,6 |
| 6 | Ti6Al4V | 1.888920 | 0.008397 | 1,2,3,4,5 |
| Surface | FD (ROI = 5 μm × 5 μm) | p < 0.05 | ||
|---|---|---|---|---|
| Mean | SD | |||
| 1 | Ti-PEO | 1.775360 | 0.012263 | 2,3,4,5 |
| 2 | Ti6Al4V-PEO | 1.746280 | 0.019934 | 1,3,5,6 |
| 3 | Ti-PEO-S | 1.728280 | 0.010314 | 1,2,4,5,6 |
| 4 | Ti6Al4V-PEO-S | 1.751200 | 0.009727 | 1,3,5,6 |
| 5 | Ti | 1.693080 | 0.006080 | 1,2,3,4,6 |
| 6 | Ti6Al4V | 1.773160 | 0.016584 | 2,3,4,5 |
| Feature | Versus (vs.) | Feature | r |
|---|---|---|---|
| FD (100 μm × 100 μm) | vs. | Sa | 0.045 |
| FD (5 μm × 5 μm) | vs. | Sa | 0.126 |
| FD (100 μm ×100 μm) | vs. | cells [mm2] | −0.561 |
| FD (5 μm × 5 μm) | vs. | cells [mm2] | 0.194 |
| FD (100 μm ×100 μm) | vs. | medium Au | −0.523 |
| FD (5 μm × 5 μm) | vs. | medium Au | 0.239 |
| Sa | vs. | cells [mm2] | −0.028 |
| Sa | vs. | medium Au | 0.084 |
| Surface | DifEntrp | p < 0.05 | ||
|---|---|---|---|---|
| Mean | SD | |||
| 1 | Ti-PEO | 1.2948 | 0.0070 | 3,4,5,6 |
| 2 | Ti6Al4V-PEO | 1.2807 | 0.0134 | 4,5,6 |
| 3 | Ti-PEO-S | 1.2577 | 0.0144 | 1,4,6 |
| 4 | Ti6Al4V-PEO-S | 1.2208 | 0.0183 | 1,2,3,5,6 |
| 5 | Ti | 1.2504 | 0.0062 | 1,2,4,6 |
| 6 | Ti6Al4V | 1.3252 | 0.0055 | 1,2,3,4,5 |
| Surface | DifEntrp | p < 0.05 | ||
|---|---|---|---|---|
| Mean | SD | |||
| 1 | Ti-PEO | 1.1799 | 0.0521 | 5,6 |
| 2 | Ti6Al4V-PEO | 1.2329 | 0.2890 | 3,5,6 |
| 3 | Ti-PEO-S | 1.1340 | 0.0275 | 2 |
| 4 | Ti6Al4V-PEO-S | 1.1779 | 0.0326 | 6 |
| 5 | Ti | 1.1180 | 0.0738 | 1,2 |
| 6 | Ti6Al4V | 1.0897 | 0.0286 | 1,2,4 |
| Feature | vs. | Feature | r |
|---|---|---|---|
| DifEntrp (100 µm × 100 µm) | vs. | Sa | 0.2904 |
| DifEntrp (5 µm × 5 µm) | vs. | Sa | 0.4173 |
| DifEntrp (100 µm × 100 µm) | vs. | FD | 0.7667 |
| DifEntrp (5 µm × 5 µm) | vs. | FD | 0.0606 |
| DifEntrp (100 µm × 100 µm) | vs. | cells [mm2] | −0.5145 |
| DifEntrp (5 µm × 5 µm) | vs. | cells [mm2] | 0.6813 |
| DifEntrp (100 µm × 100 µm) | vs. | medium Au | −0.4656 |
| DifEntrp (5 µm × 5 µm) | vs. | medium Au | 0.7201 |
| Name | Titanium Grade | Method of Preparation |
|---|---|---|
| Ti | Grade 4 | Sandblasted and acid-etched (SLA) Titanium Dental Implant—Al2O3 sandblasting process with a fraction of 30–100 µm. Purified samples were subjected to the etching process (conditions: oxalic acid 100 g L−1, time: 60 min, temperature: boiling). Samples were washed in an ultrasonic cleaner (DEMI water, time: 10 min). |
| Ti6Al4V | Grade 23 | |
| Ti-PEO | Grade 4 | SLA surfaces were anodized in a PEO (plasma electrolytic oxidation) regime. Treatment details were presented in previous studies by Simka et al. [17,18]. An electrolyte was composed of Ca and P compounds. Titanium surfaces were oxidized via the PEO process with a high voltage DC power supply, Kikusui PWR400H, (Kikusui Electronics Corporation, Kanagawa, Japan) at 300 V for 5 min. The PEO treatment was realized via DC galvanostatic anodization (anodic current density = 100 mA cm−2) up to limiting voltage. After the process voltage reached the limiting voltage (300 V), the treatment was conducted under a potentiostatic regime. Samples were washed in an ultrasonic cleaner (DEMI water, time: 10 min). |
| Ti6Al4V-PEO | Grade 23 | |
| Ti-PEO-S | Grade 4 | After PEO, samples were treated with low-pressure RF OP and placed in a vacuum chamber for 5 min. Frequency: 40 Mhz, power: 500 Watt. During this time, oxygen was pumped into the chamber (1 L/min). |
| Ti6Al4V-PEO-S | Grade 23 |
Disclaimer/Publisher’s Note: The statements, opinions and data contained in all publications are solely those of the individual author(s) and contributor(s) and not of MDPI and/or the editor(s). MDPI and/or the editor(s) disclaim responsibility for any injury to people or property resulting from any ideas, methods, instructions or products referred to in the content. |
© 2023 by the authors. Licensee MDPI, Basel, Switzerland. This article is an open access article distributed under the terms and conditions of the Creative Commons Attribution (CC BY) license (https://creativecommons.org/licenses/by/4.0/).
Share and Cite
Hadzik, J.; Jurczyszyn, K.; Gębarowski, T.; Trytek, A.; Gedrange, T.; Kozakiewicz, M.; Dominiak, M.; Kubasiewicz-Ross, P.; Trzcionka-Szajna, A.; Szajna, E.; et al. An Experimental Anodized and Low-Pressure Oxygen Plasma-Treated Titanium Dental Implant Surface—Preliminary Report. Int. J. Mol. Sci. 2023, 24, 3603. https://doi.org/10.3390/ijms24043603
Hadzik J, Jurczyszyn K, Gębarowski T, Trytek A, Gedrange T, Kozakiewicz M, Dominiak M, Kubasiewicz-Ross P, Trzcionka-Szajna A, Szajna E, et al. An Experimental Anodized and Low-Pressure Oxygen Plasma-Treated Titanium Dental Implant Surface—Preliminary Report. International Journal of Molecular Sciences. 2023; 24(4):3603. https://doi.org/10.3390/ijms24043603
Chicago/Turabian StyleHadzik, Jakub, Kamil Jurczyszyn, Tomasz Gębarowski, Andrzej Trytek, Tomasz Gedrange, Marcin Kozakiewicz, Marzena Dominiak, Paweł Kubasiewicz-Ross, Anna Trzcionka-Szajna, Ernest Szajna, and et al. 2023. "An Experimental Anodized and Low-Pressure Oxygen Plasma-Treated Titanium Dental Implant Surface—Preliminary Report" International Journal of Molecular Sciences 24, no. 4: 3603. https://doi.org/10.3390/ijms24043603
APA StyleHadzik, J., Jurczyszyn, K., Gębarowski, T., Trytek, A., Gedrange, T., Kozakiewicz, M., Dominiak, M., Kubasiewicz-Ross, P., Trzcionka-Szajna, A., Szajna, E., & Simka, W. (2023). An Experimental Anodized and Low-Pressure Oxygen Plasma-Treated Titanium Dental Implant Surface—Preliminary Report. International Journal of Molecular Sciences, 24(4), 3603. https://doi.org/10.3390/ijms24043603