

Emerging Effects of Resveratrol Derivatives in Cells Involved in Oral Wound Healing: A Preliminary Study
 ,
,  ,
,  ,
,  ,
,  ,
,  ,
,  ,
,  , , ,
, , , 

Abstract
1. Introduction
2. Results
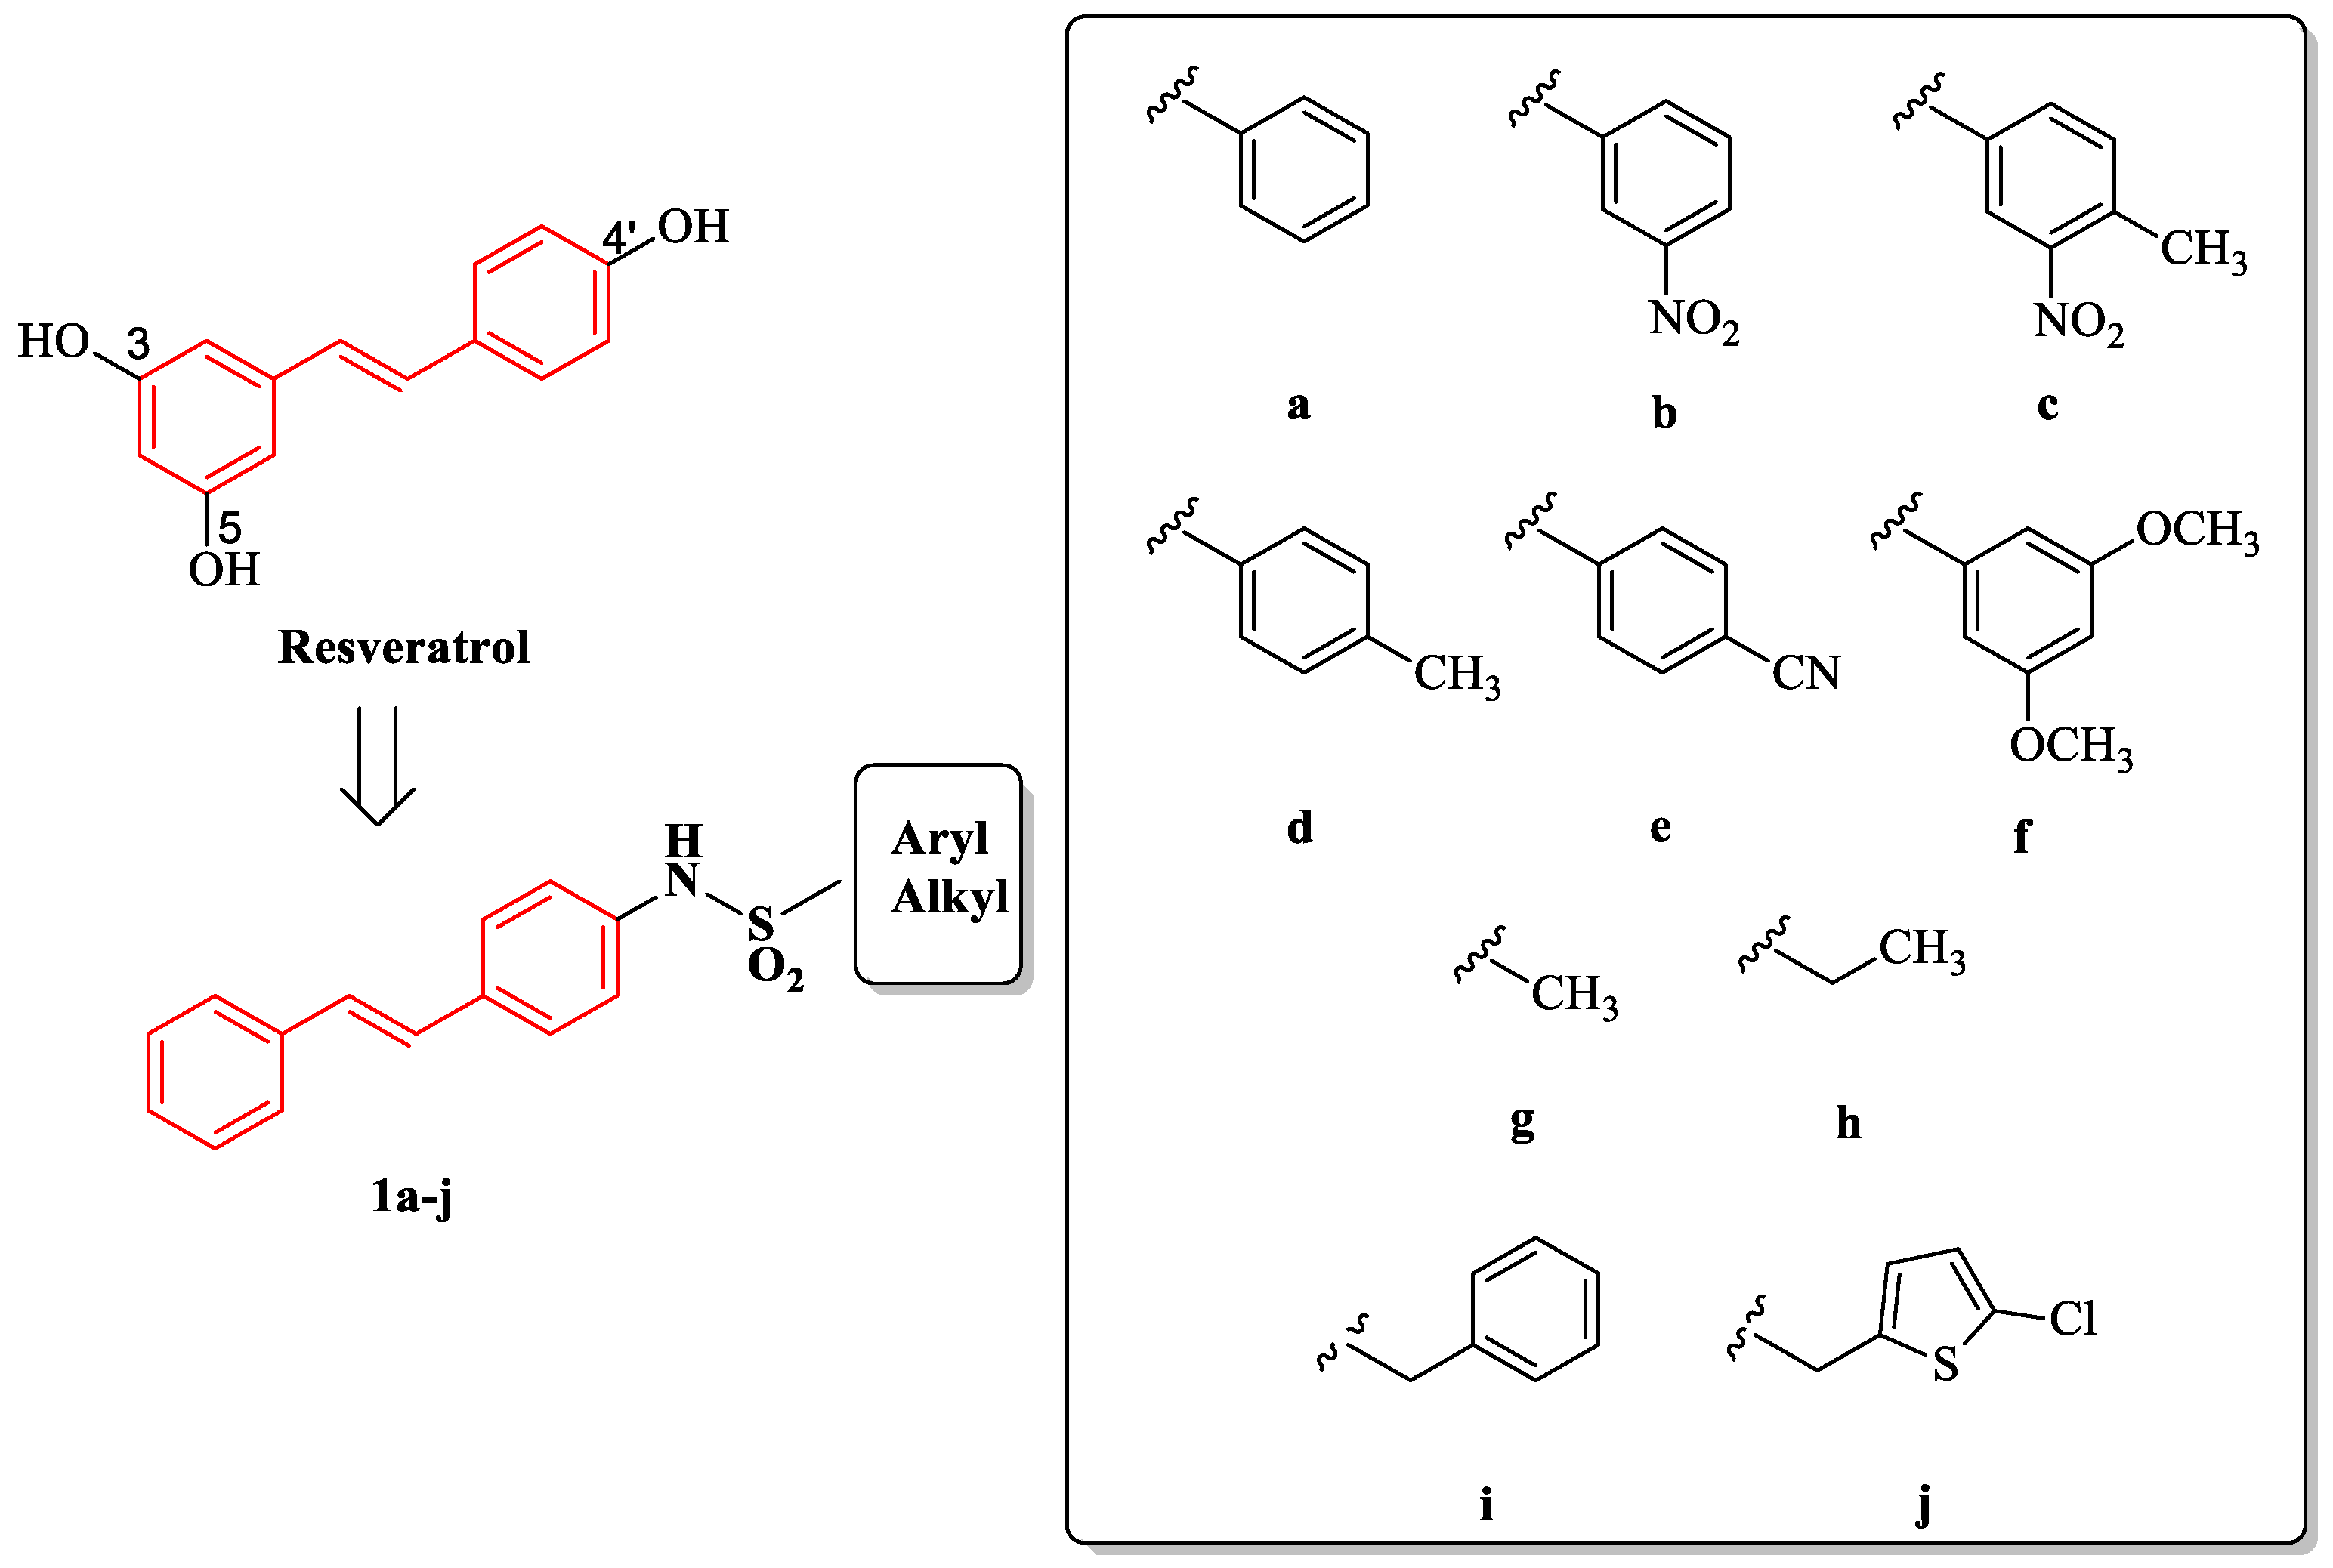
2.1. Chemistry
2.2. Biology
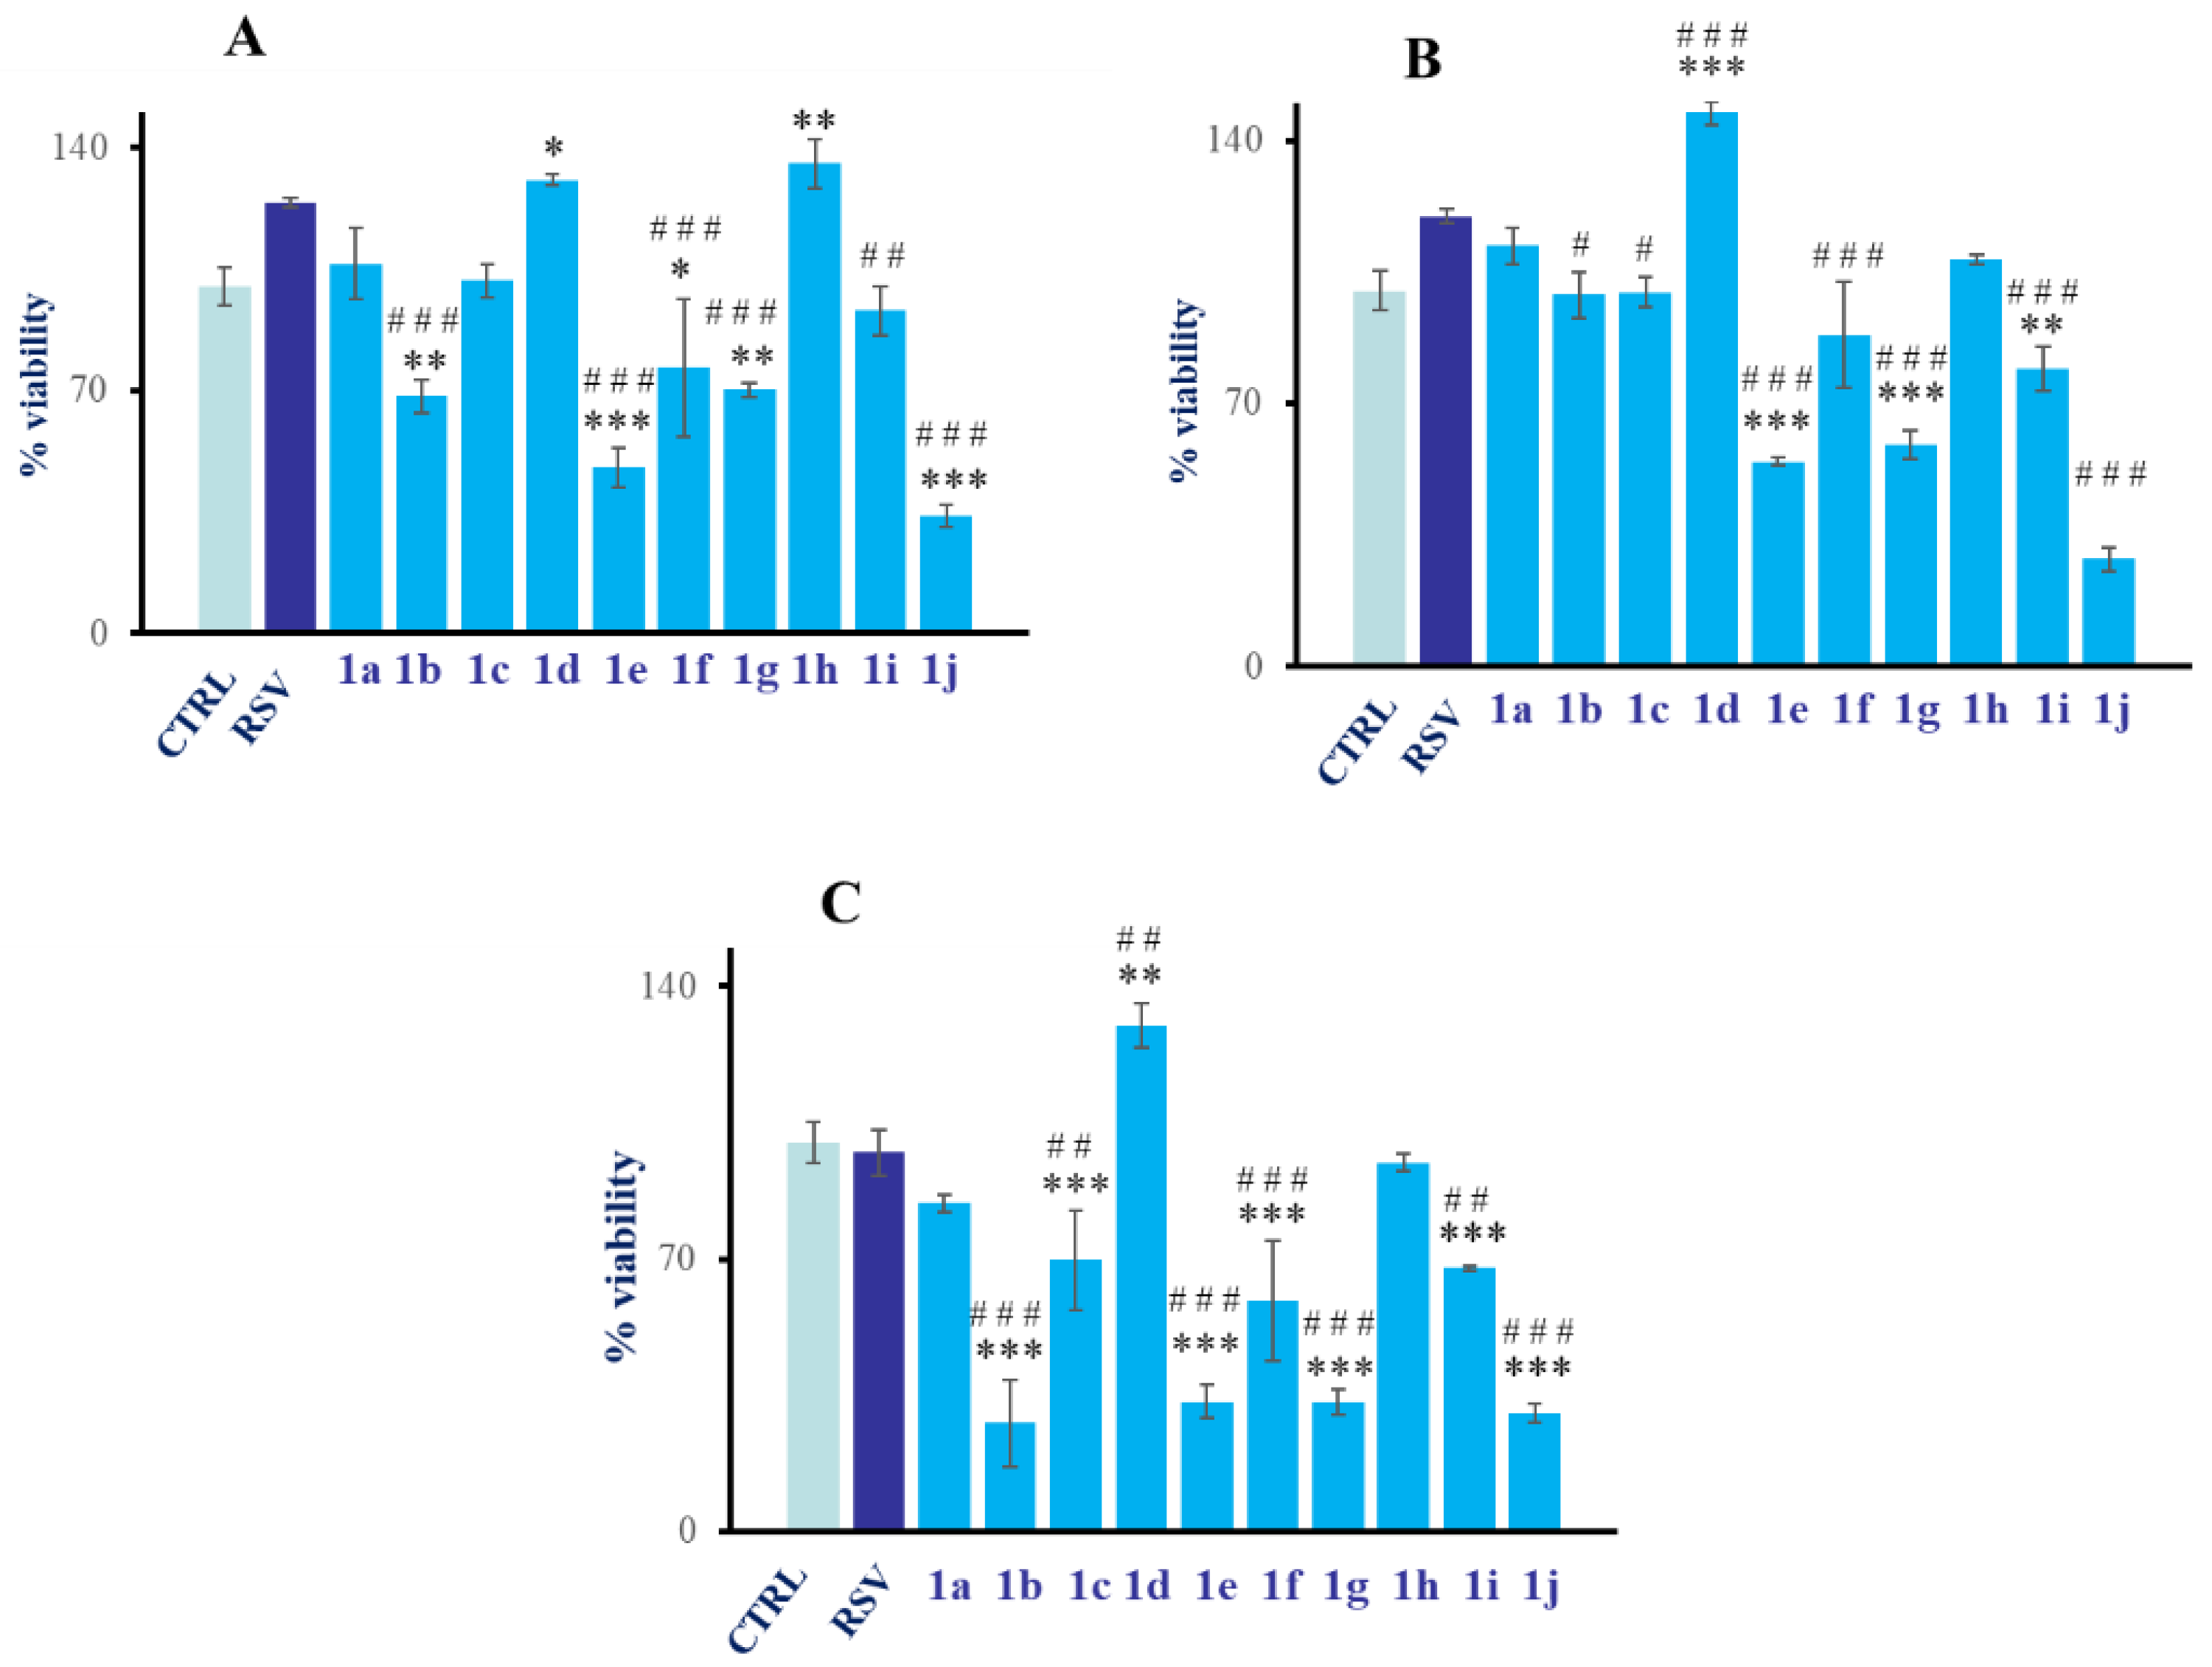
2.2.1. Analysis of Cytocompatibility of RSV Derivatives 1a–j
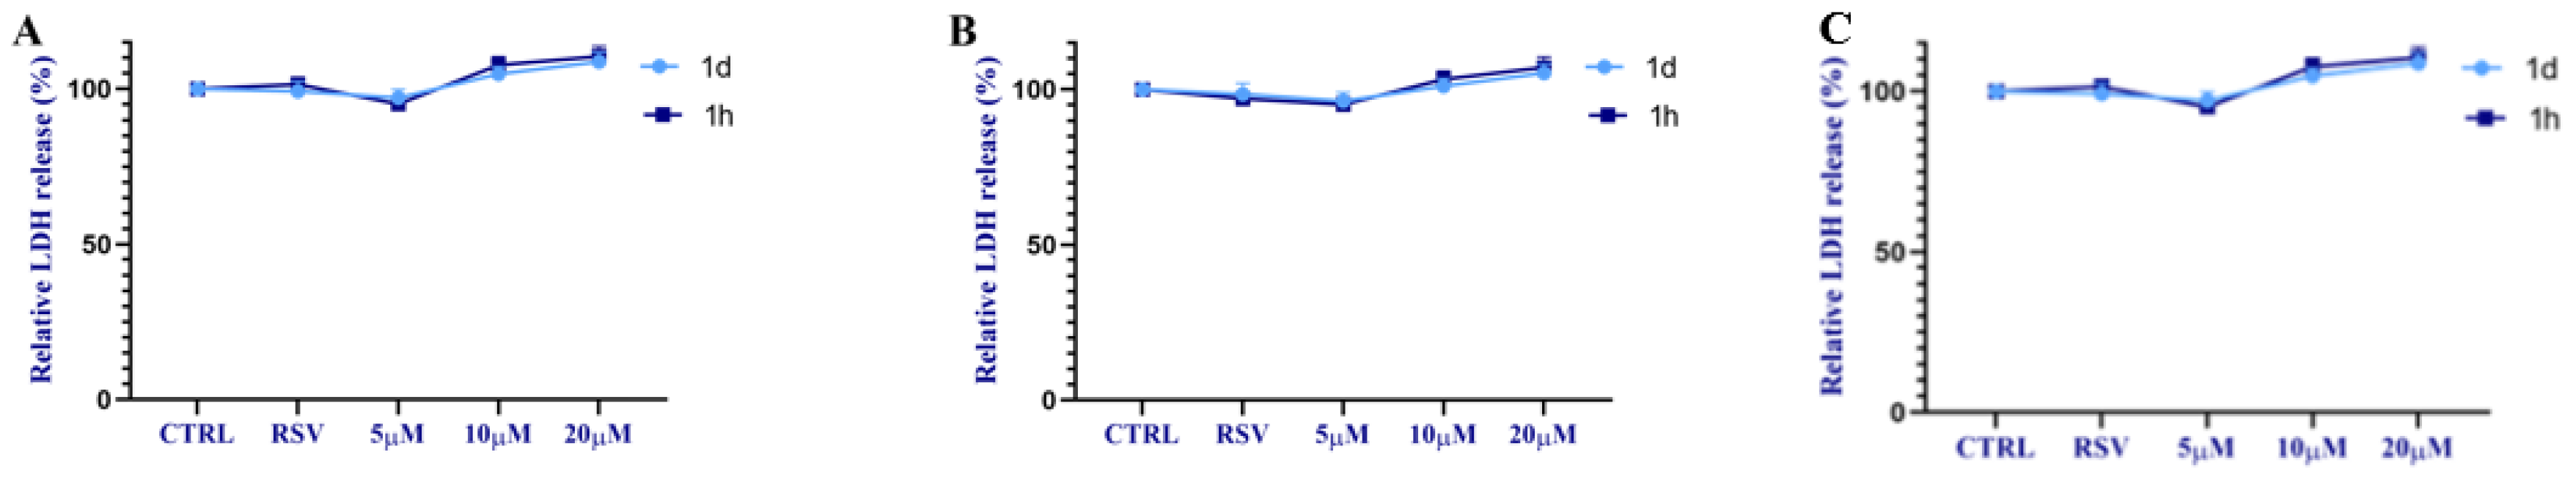
2.2.2. Evaluation of Cytotoxicity of 1d and 1h
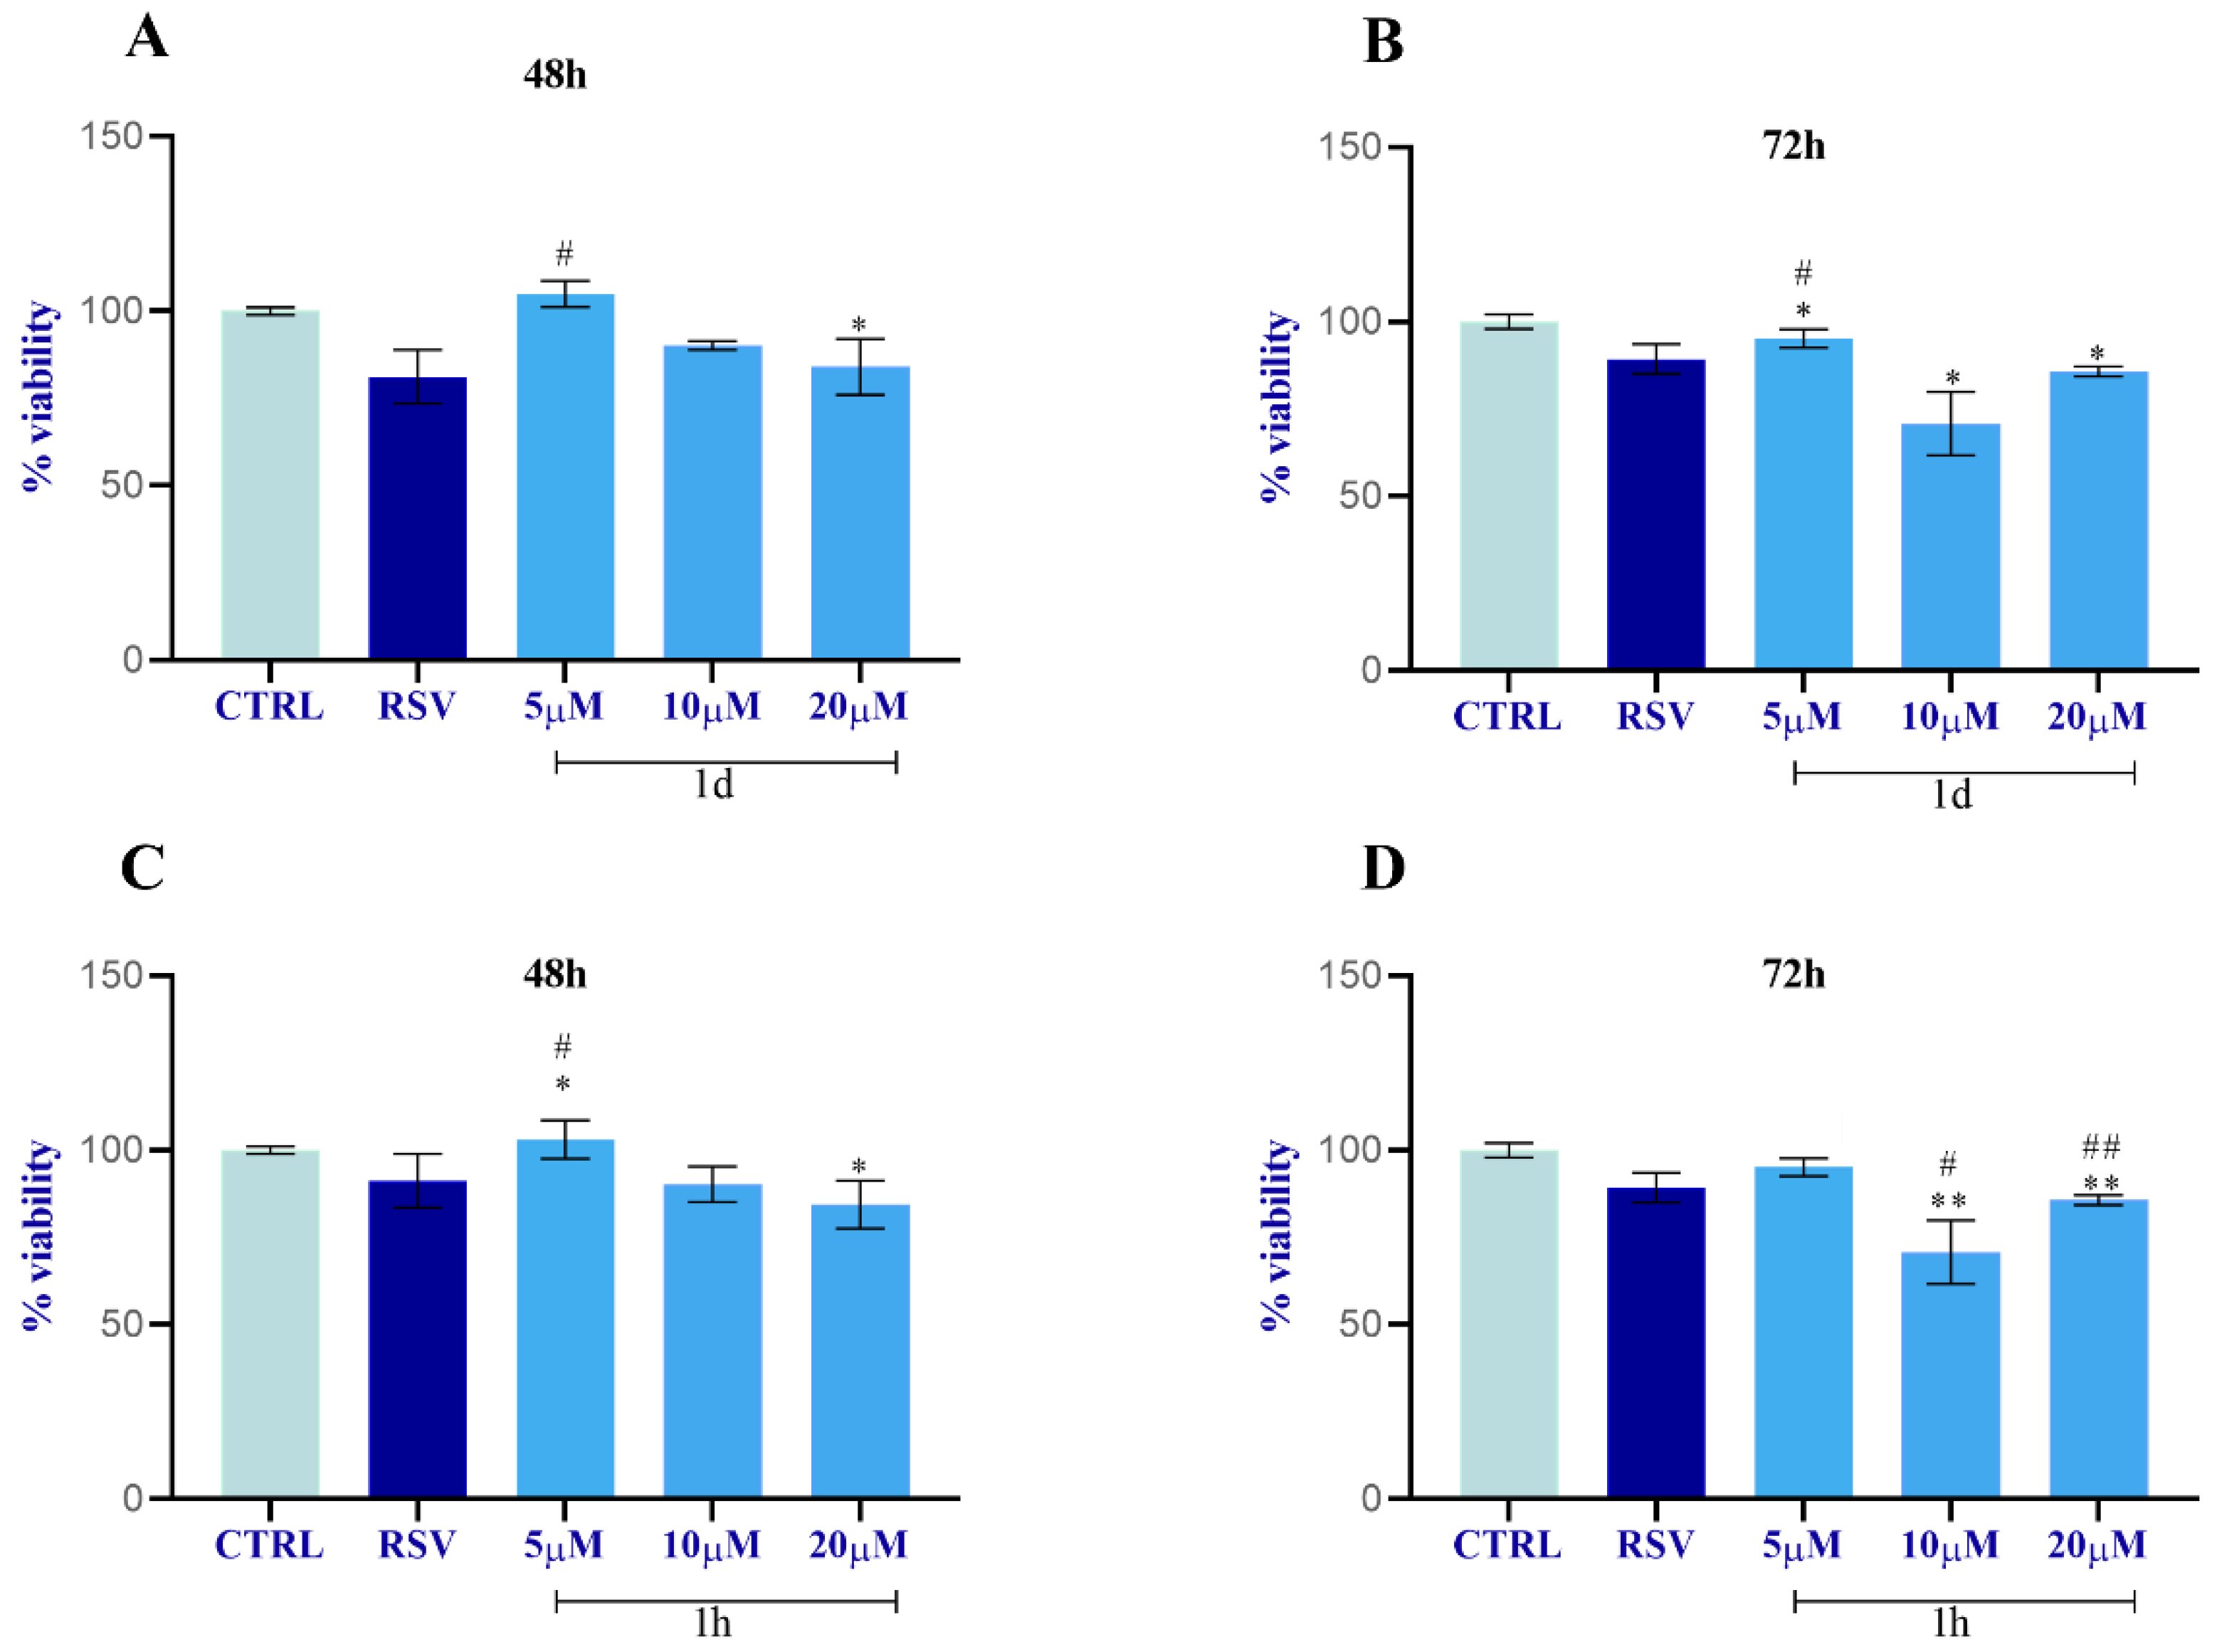
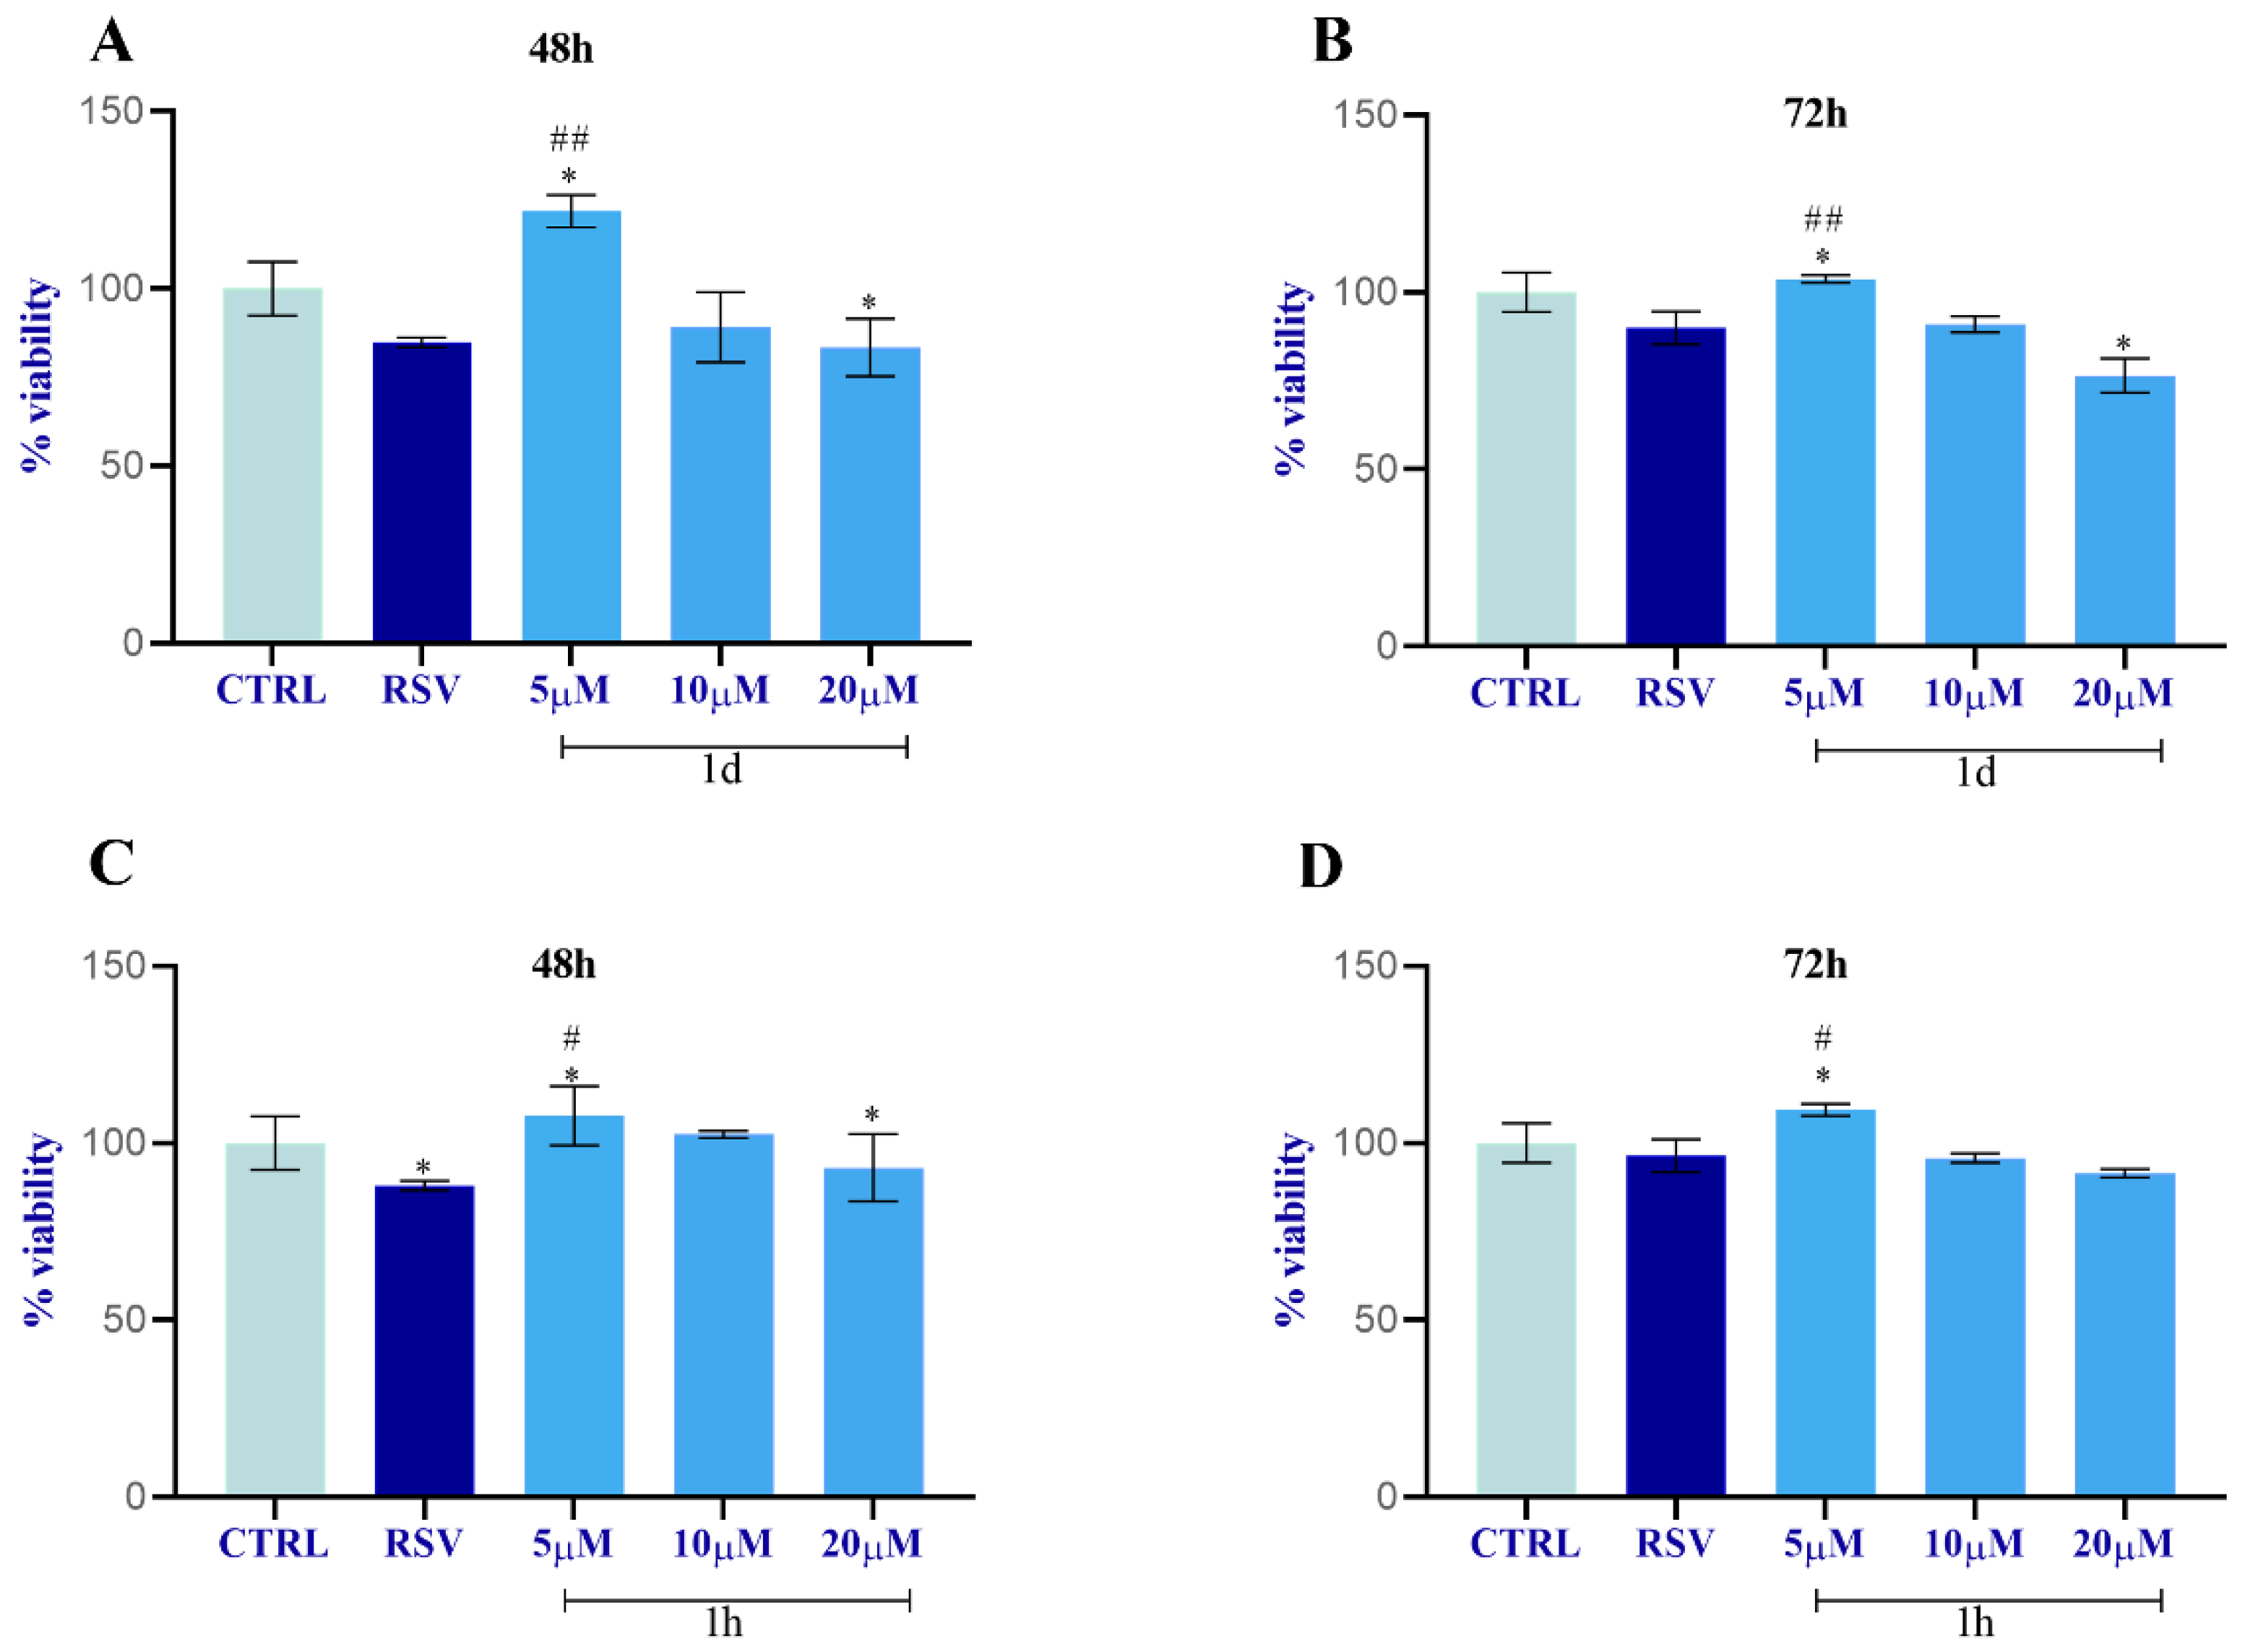
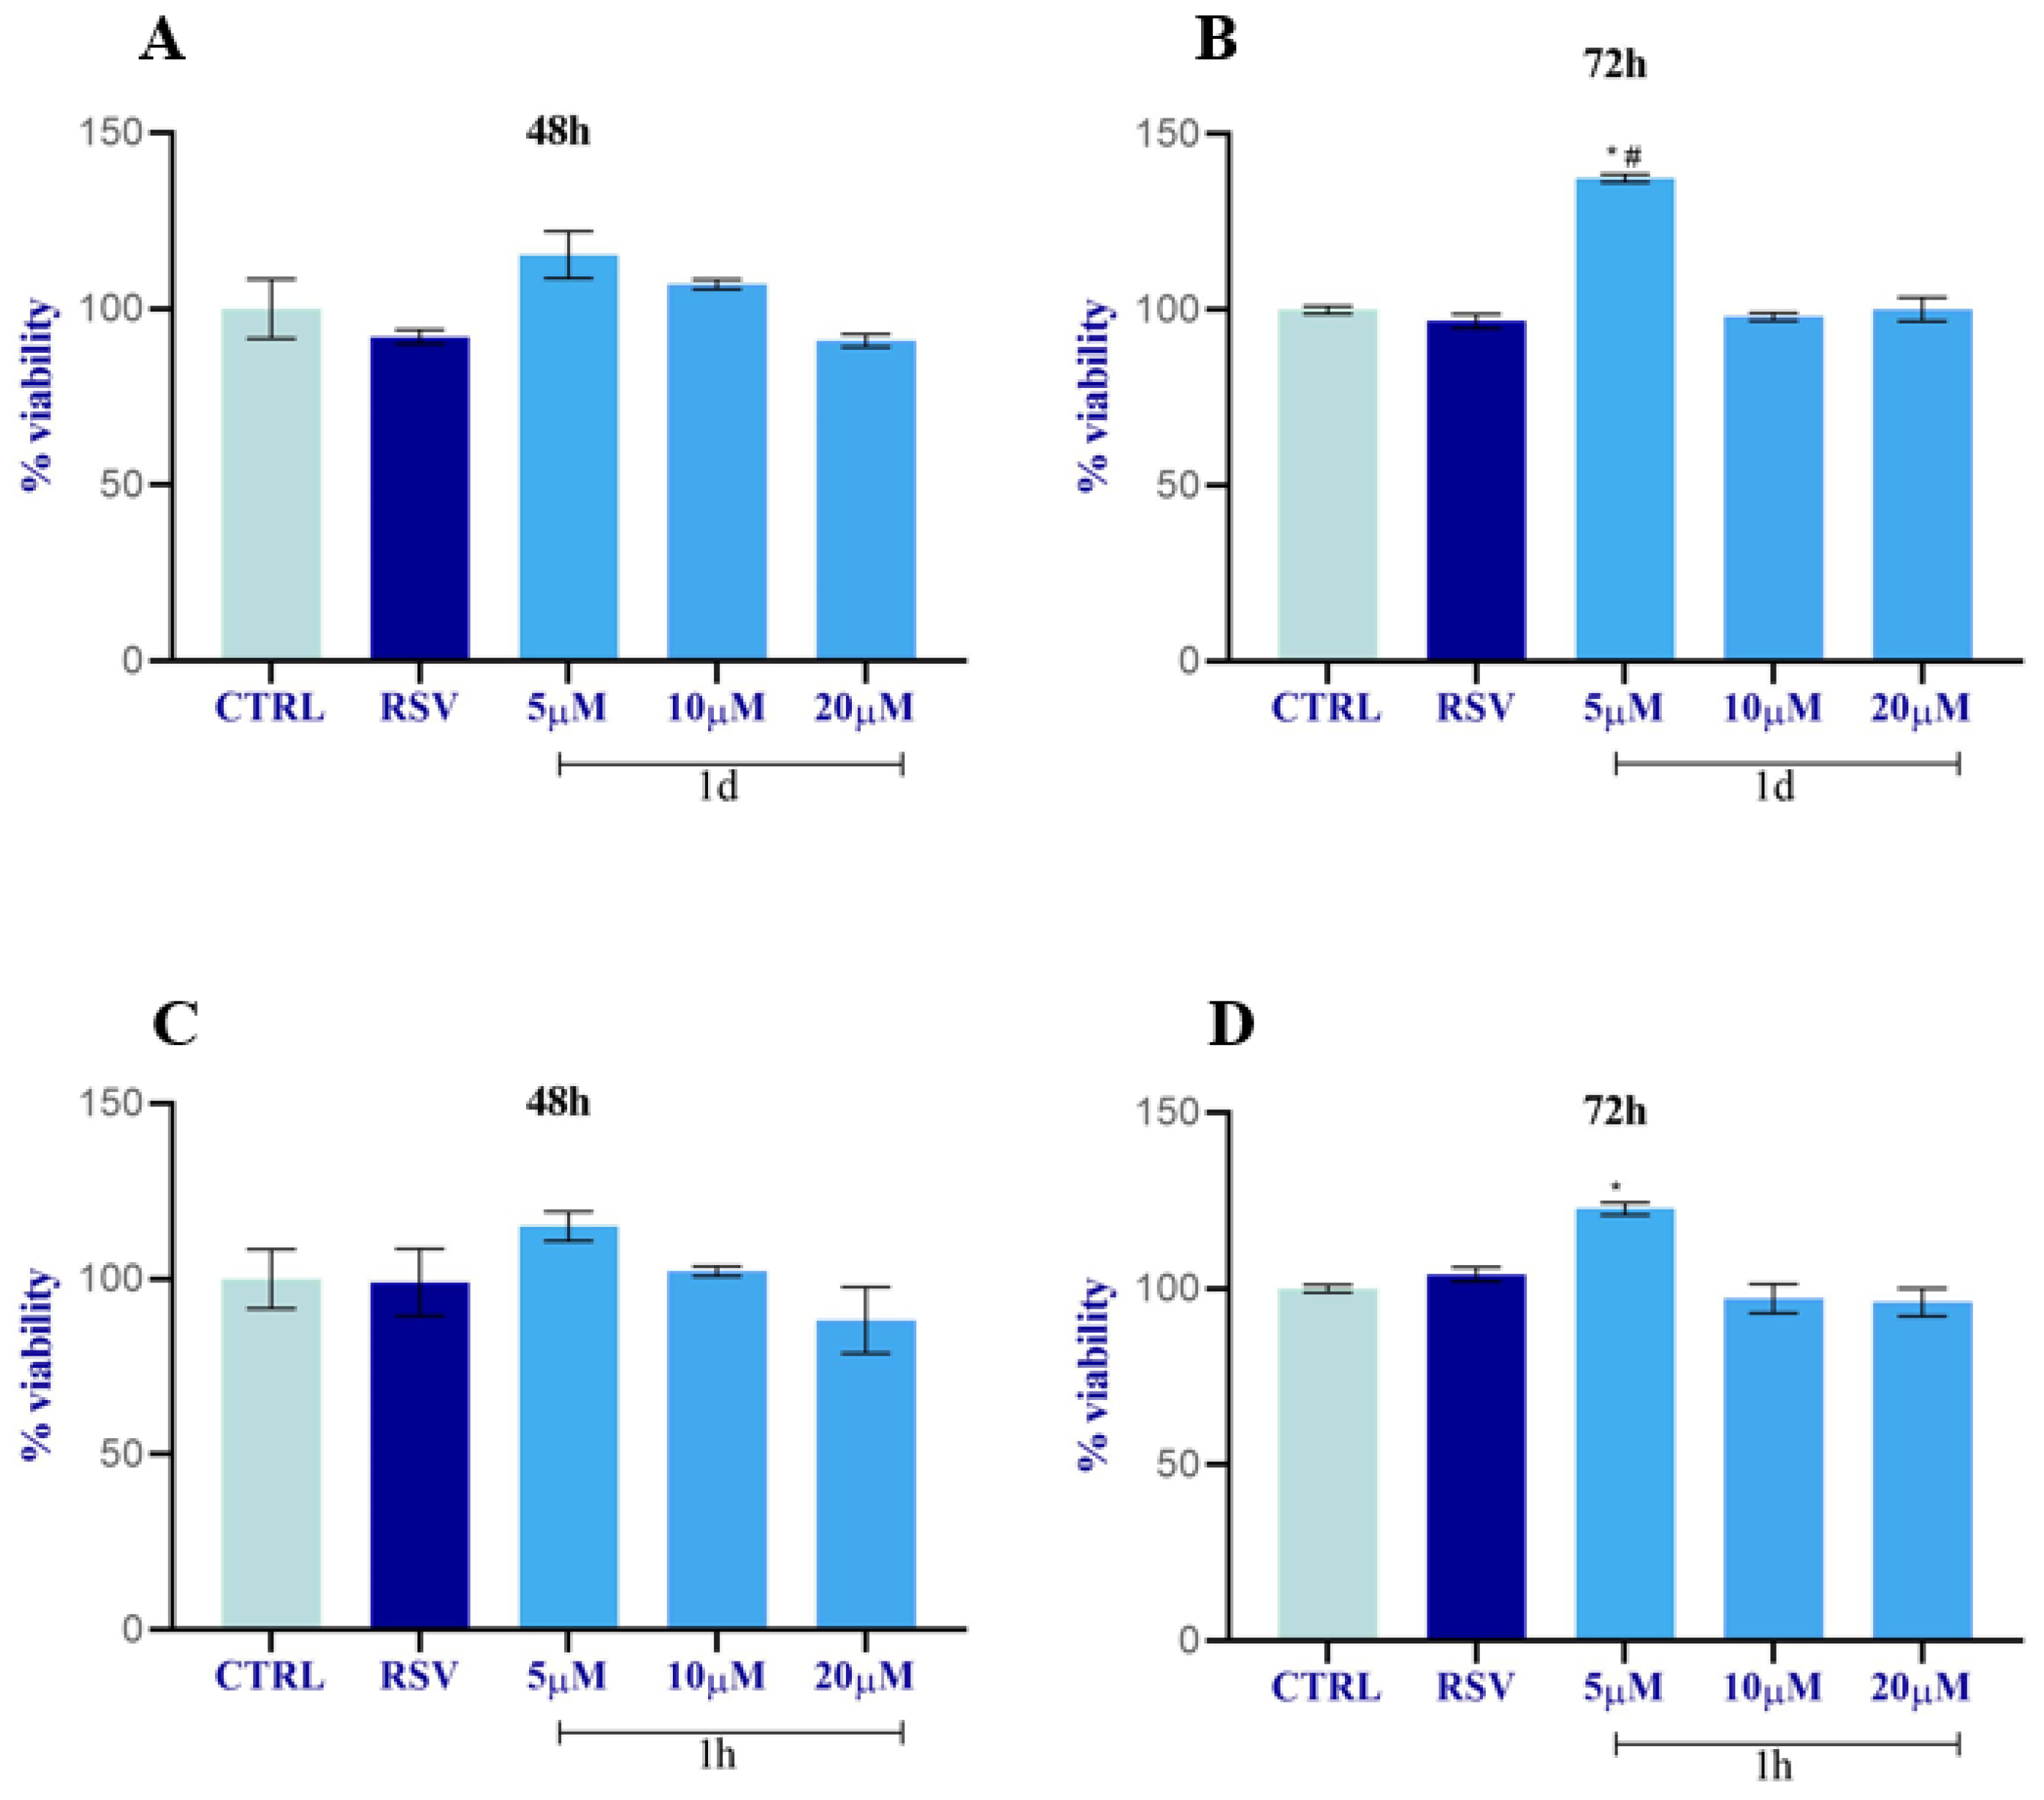
2.2.3. Analysis of HUVECs, HGFs, and HOBs Proliferation
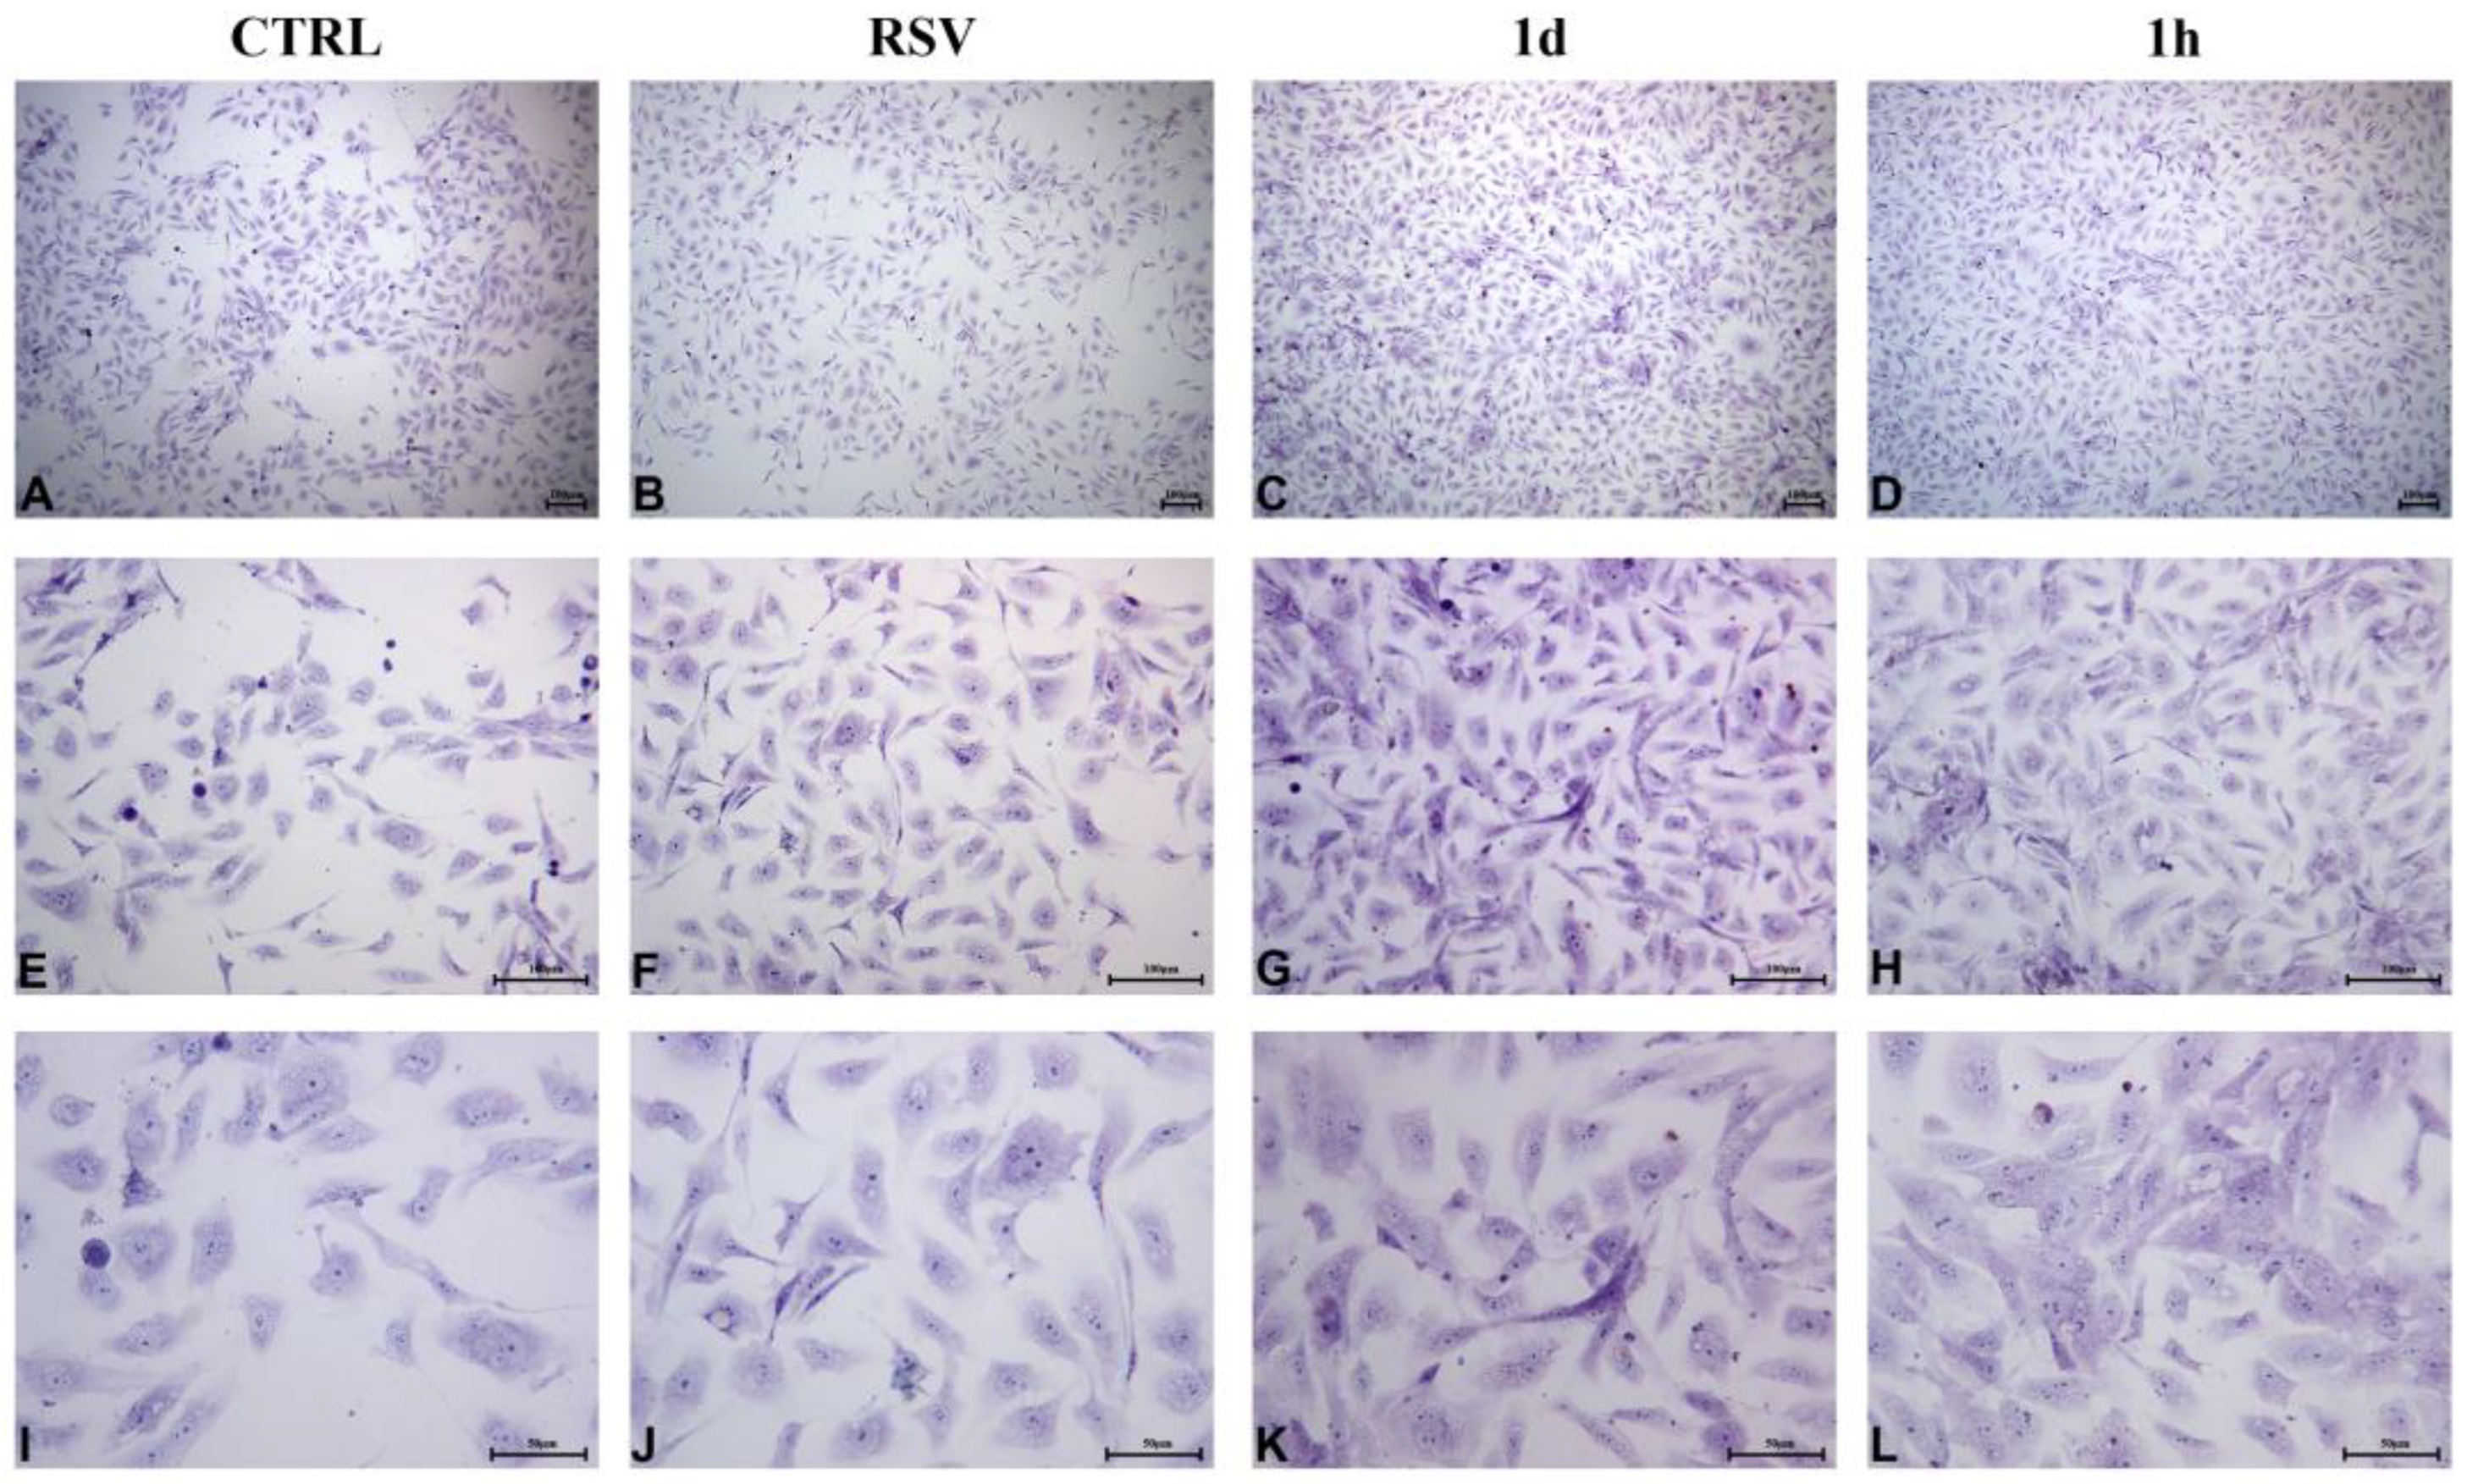
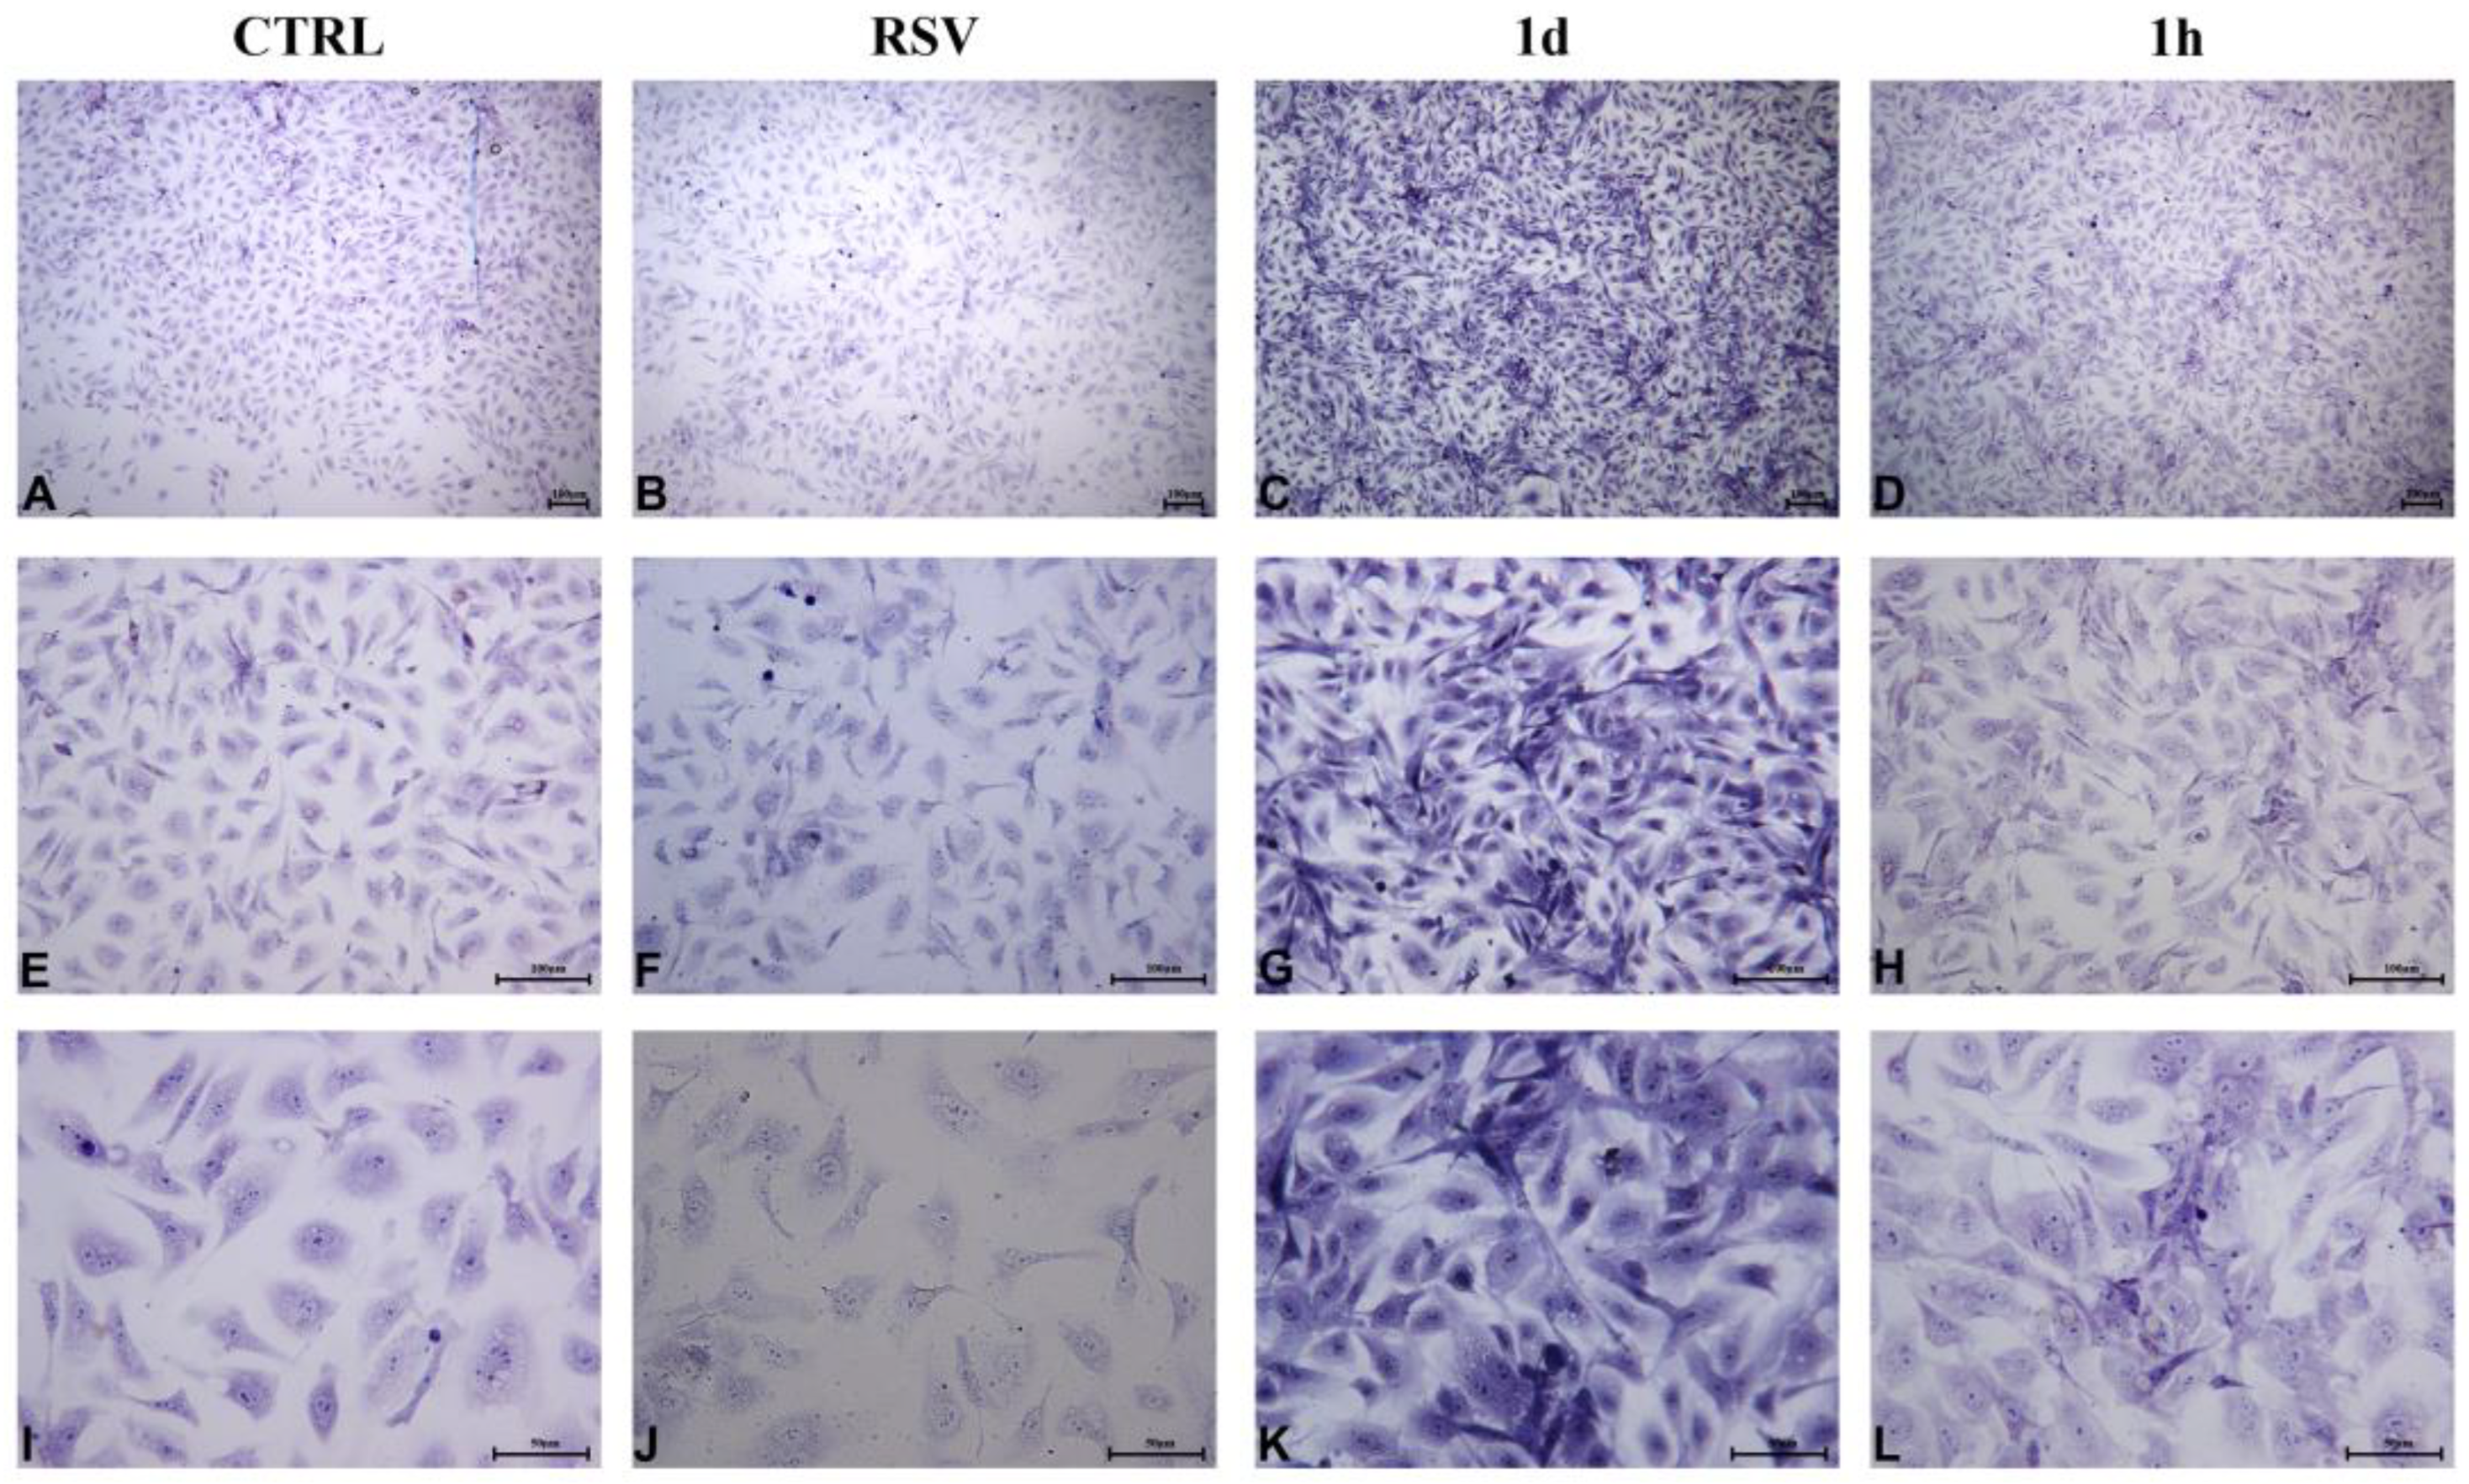
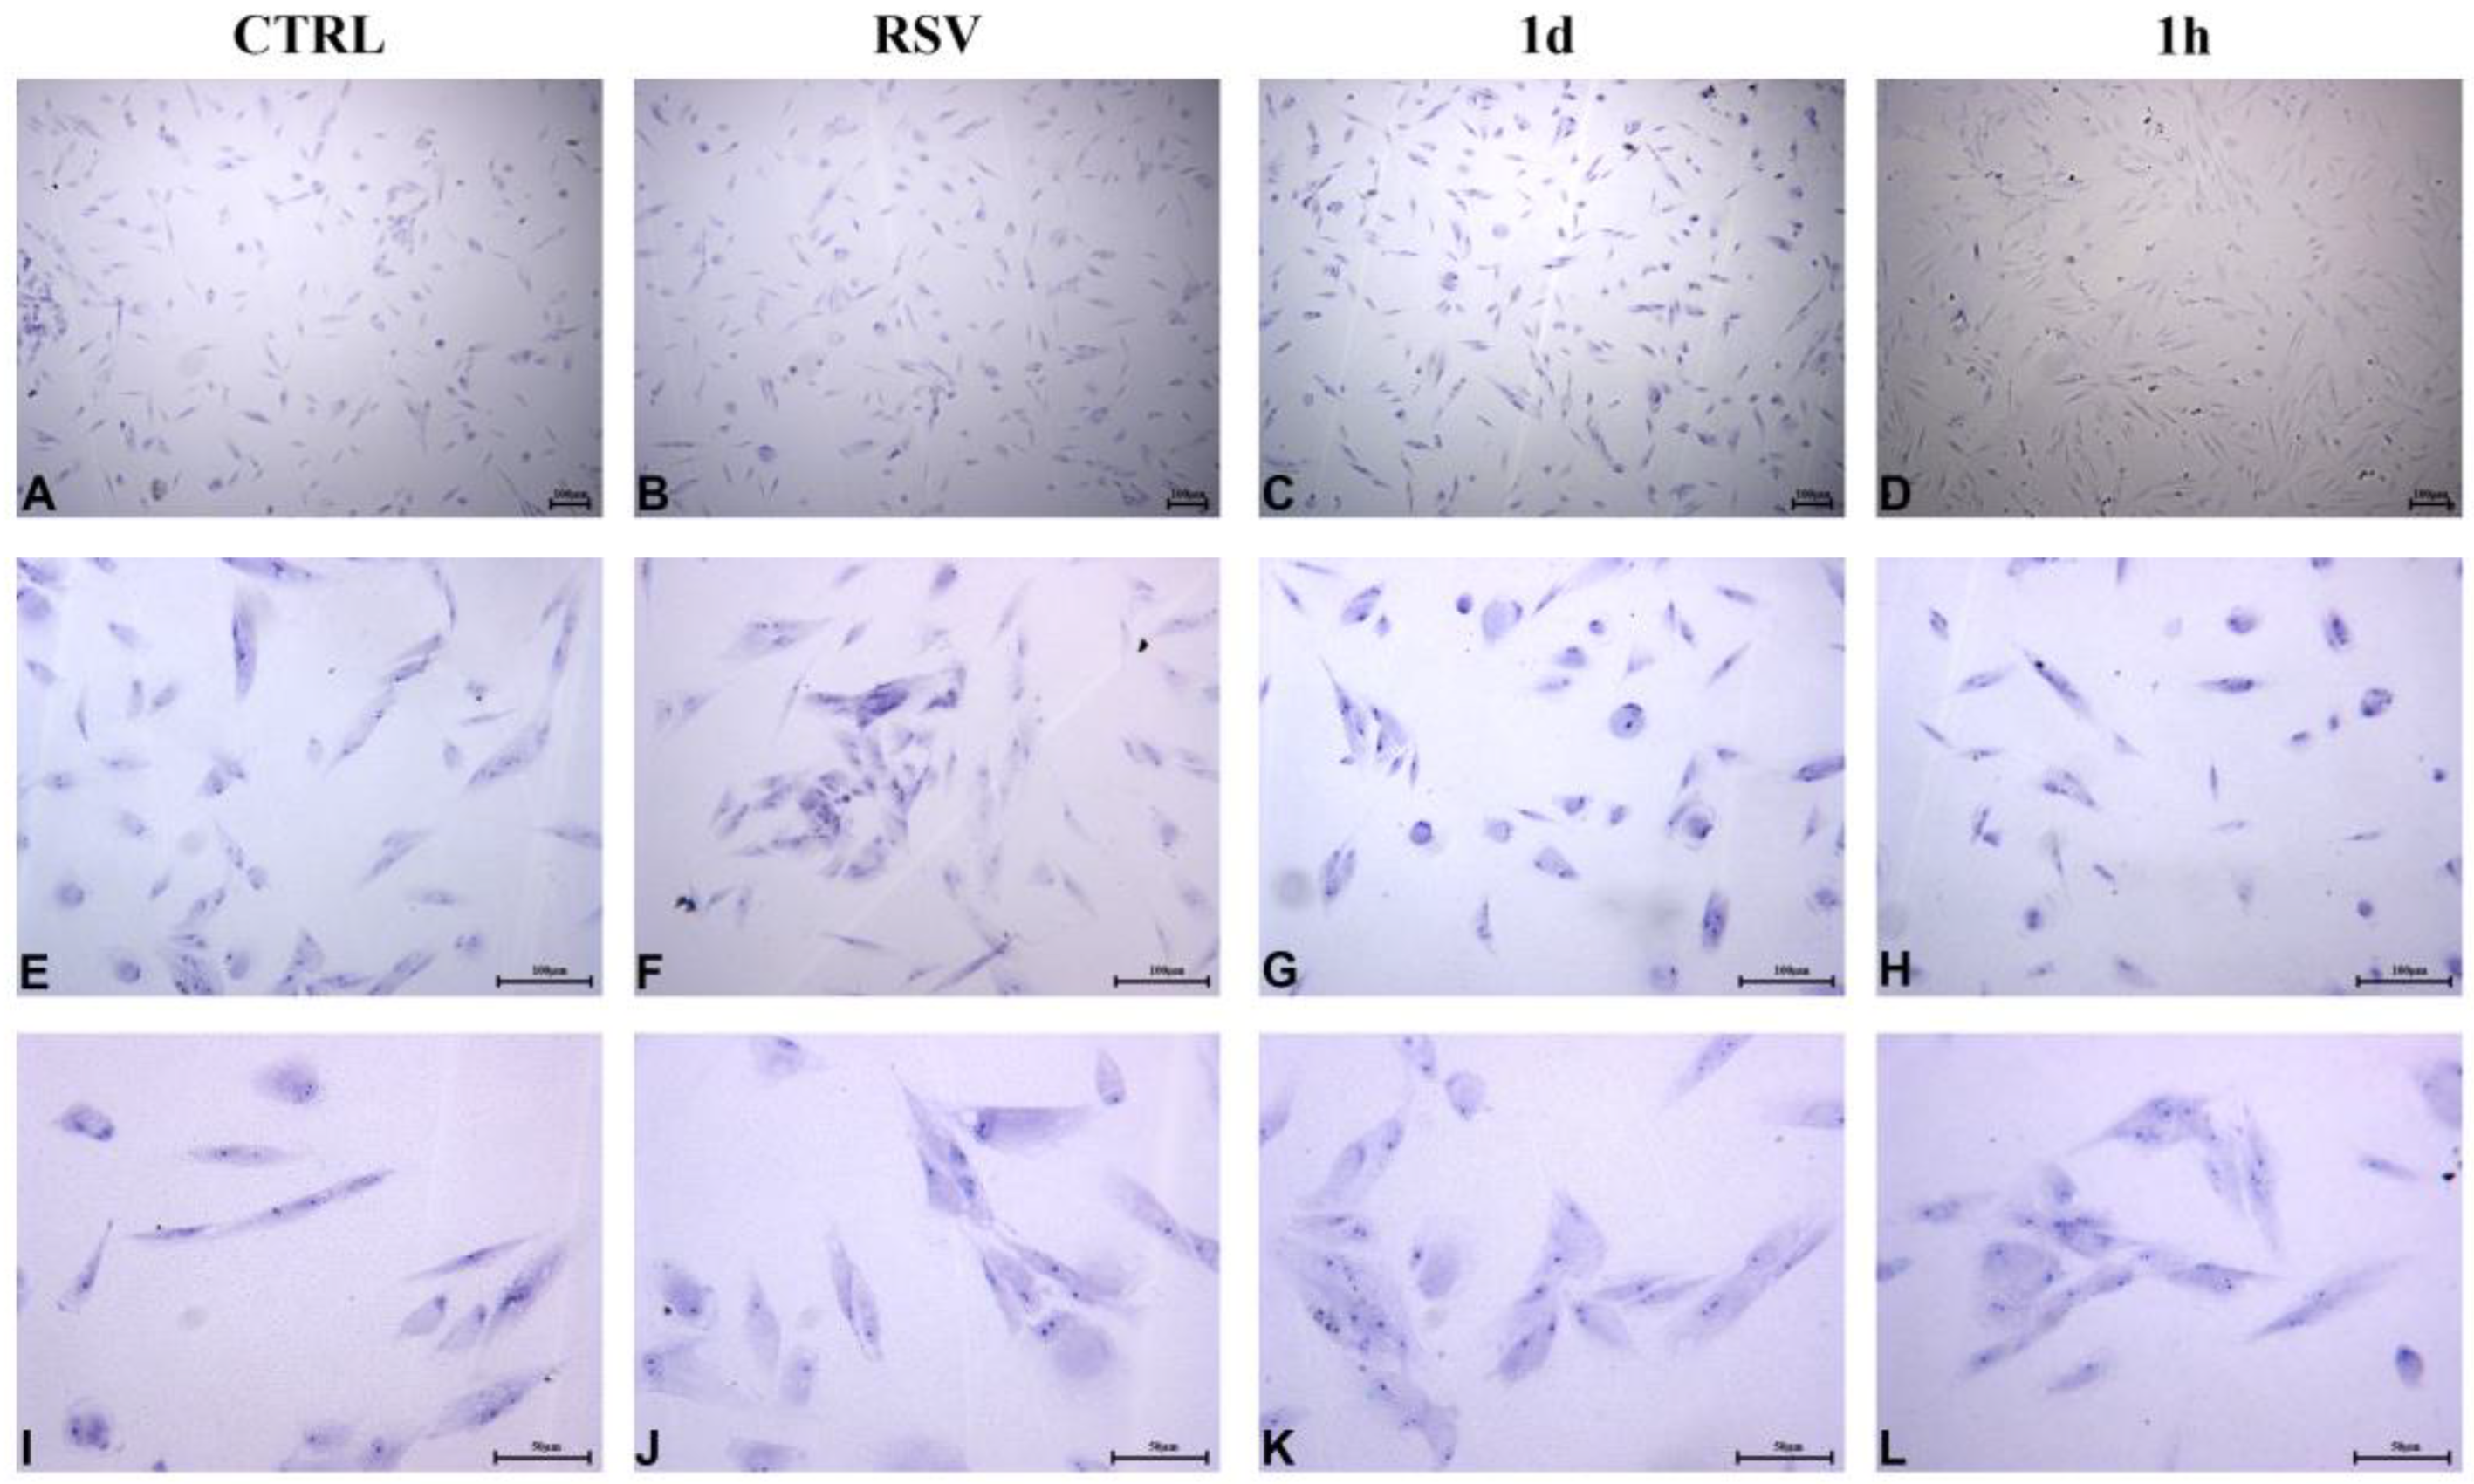
2.2.4. HUVECs Morphology and Confluence
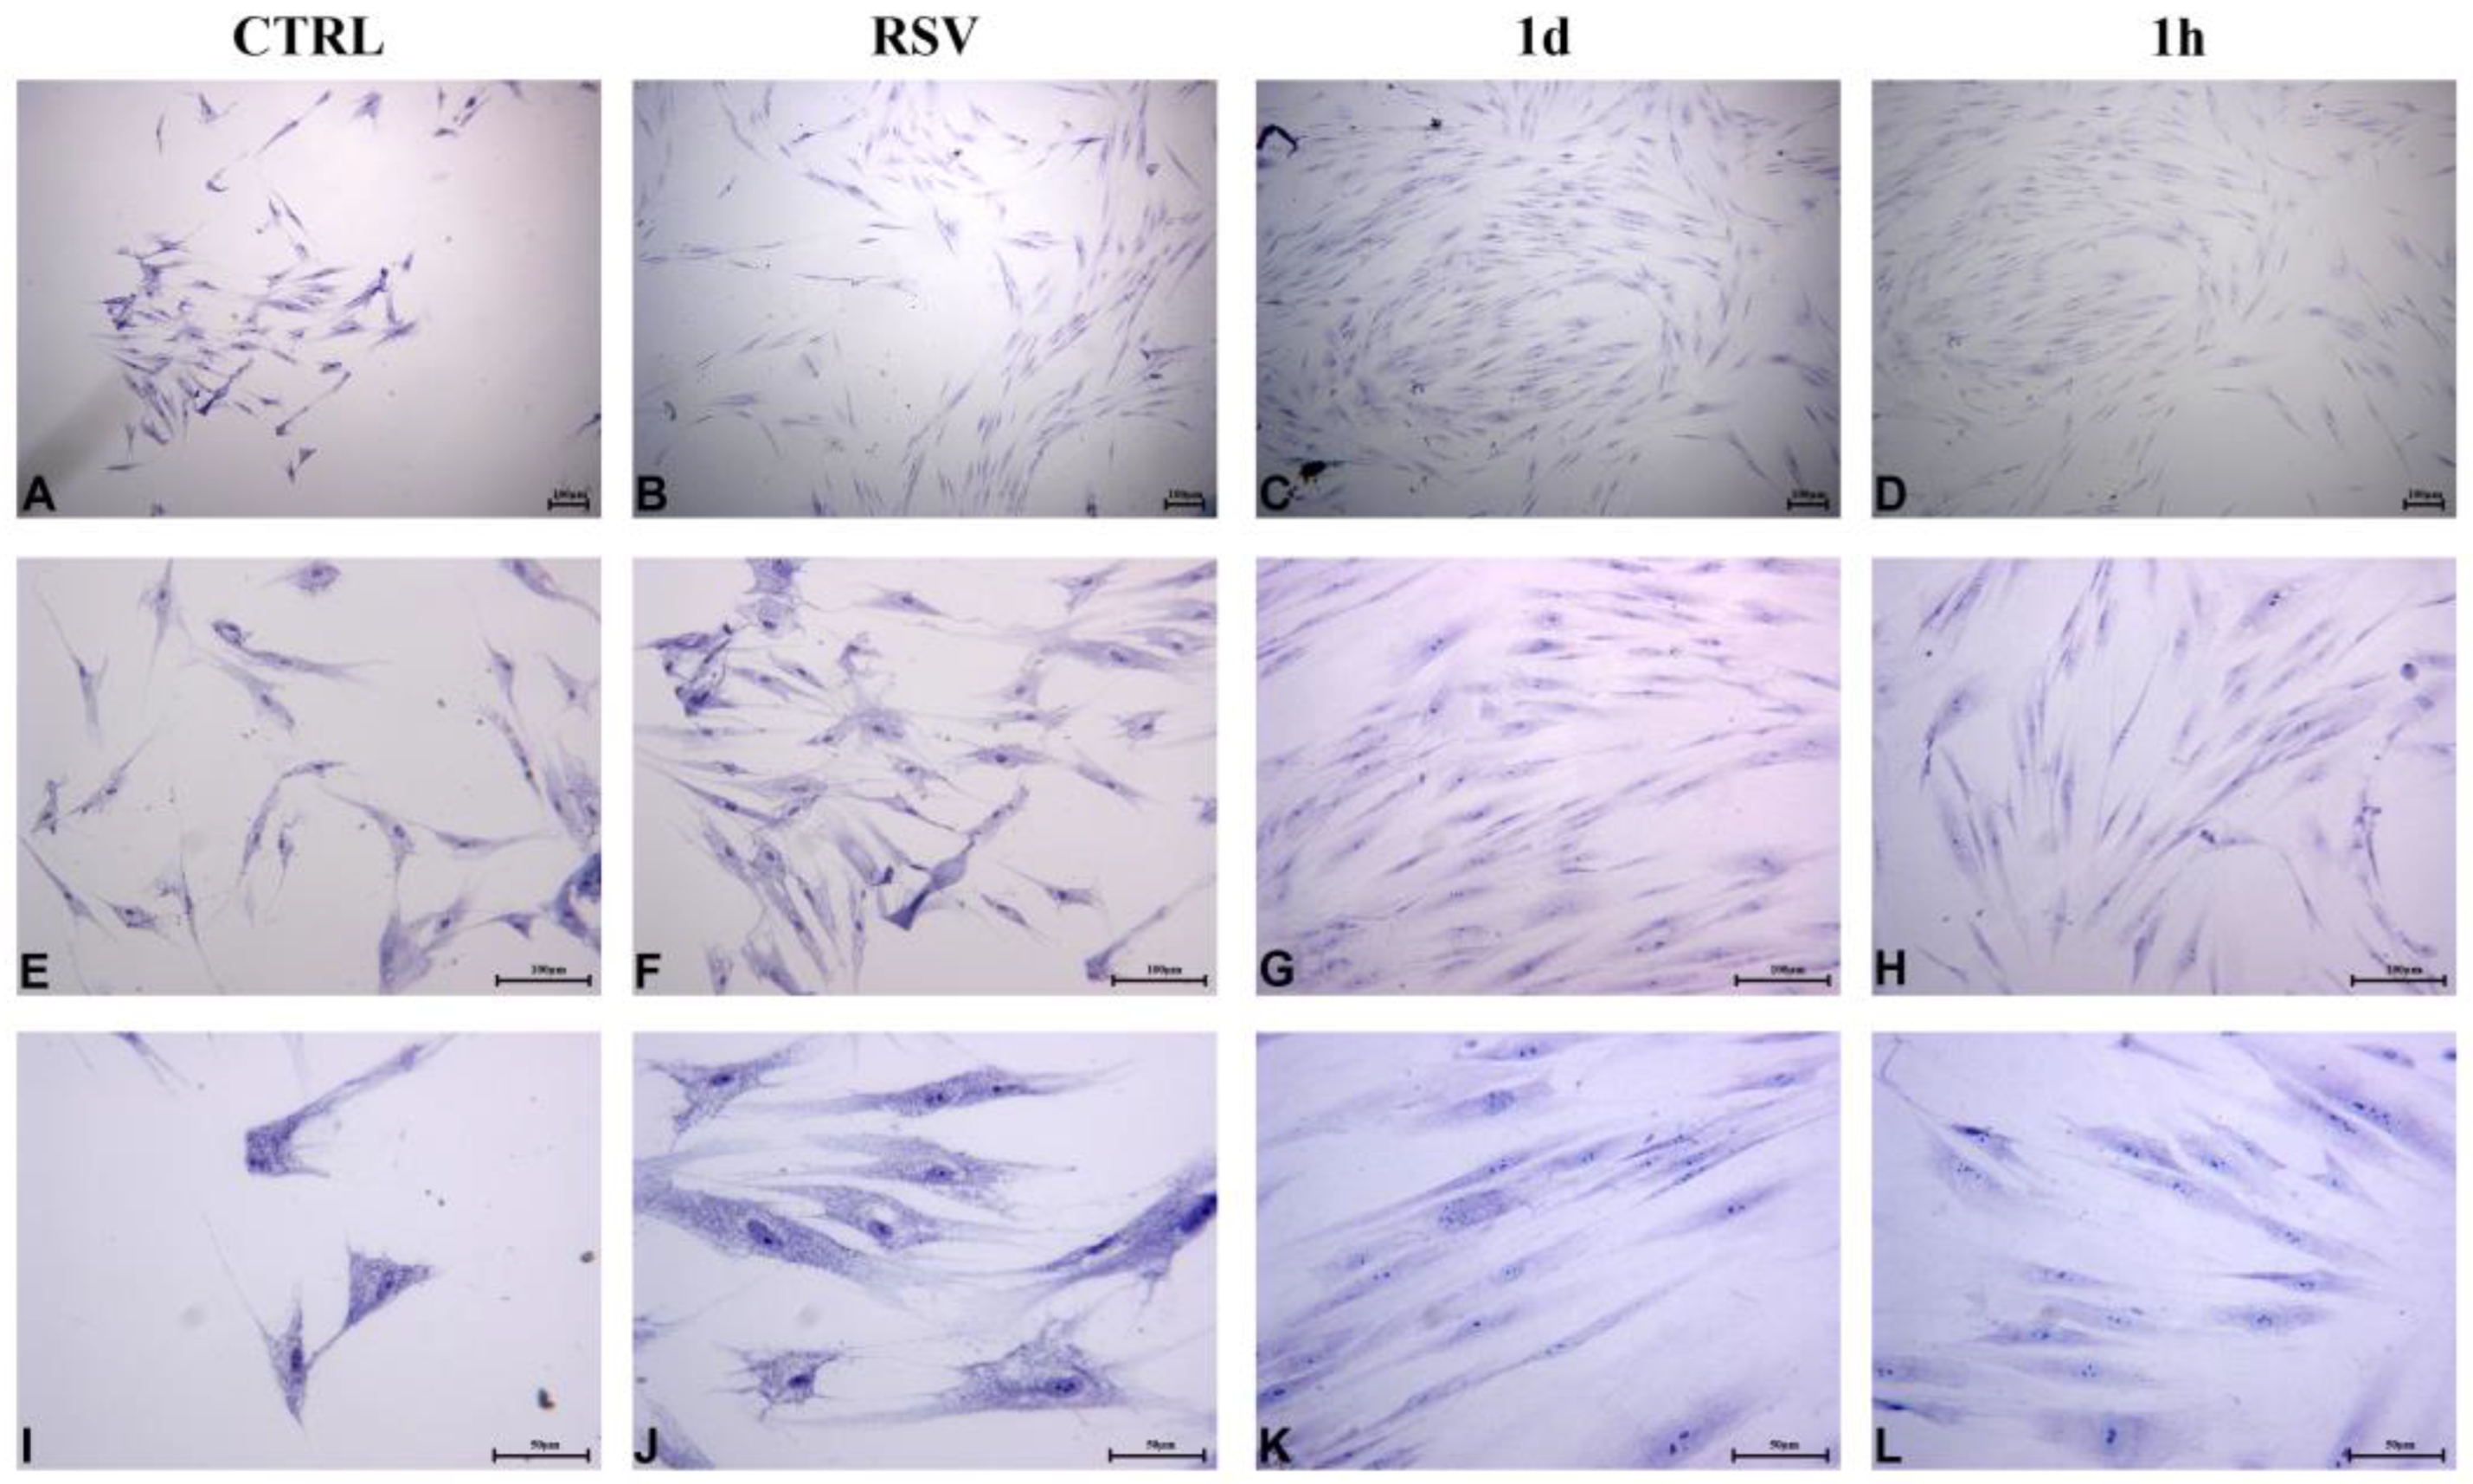
2.2.5. HGFs Morphology and Confluence
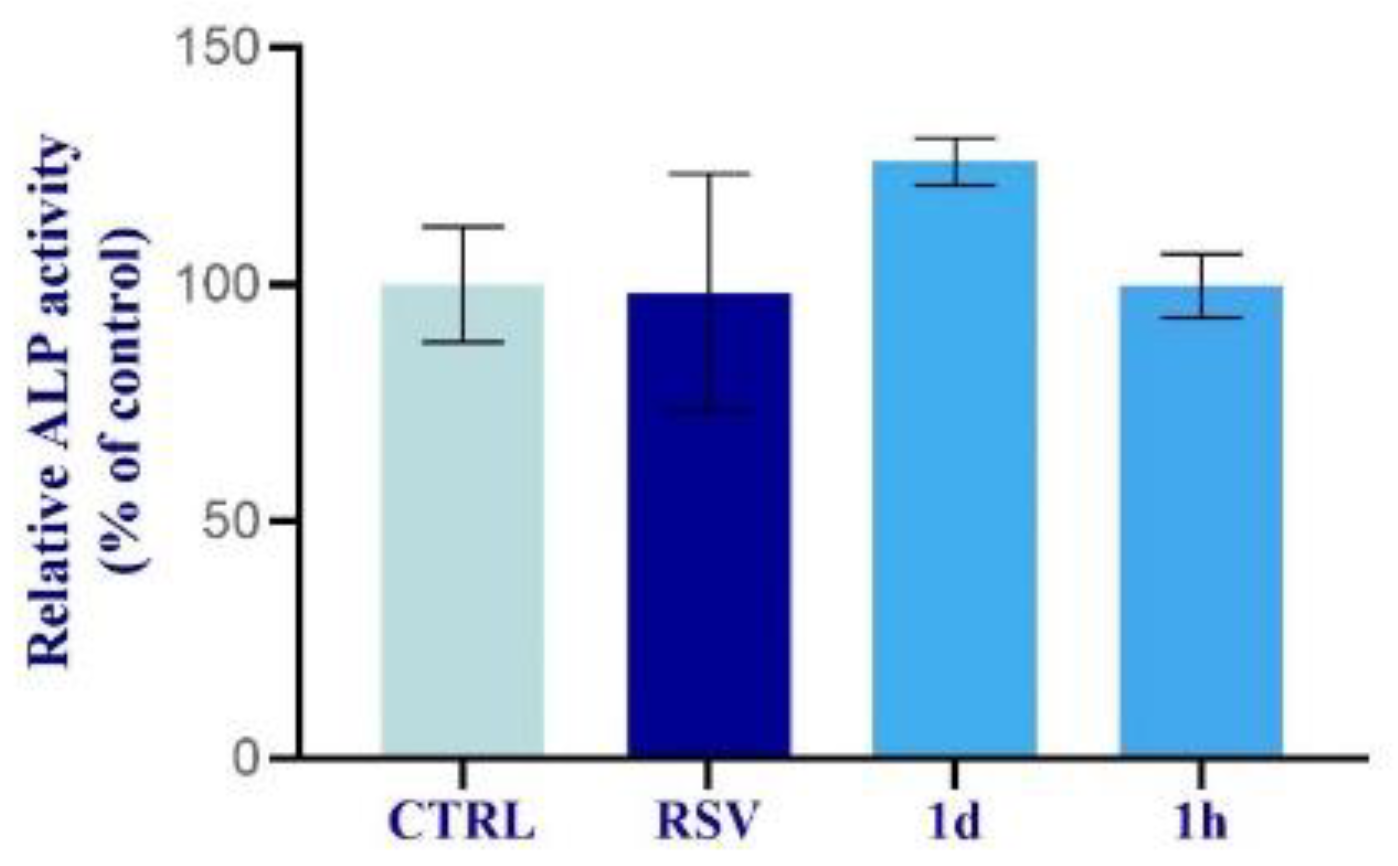
2.2.6. Alkaline Phosphatase Activity in HOBs
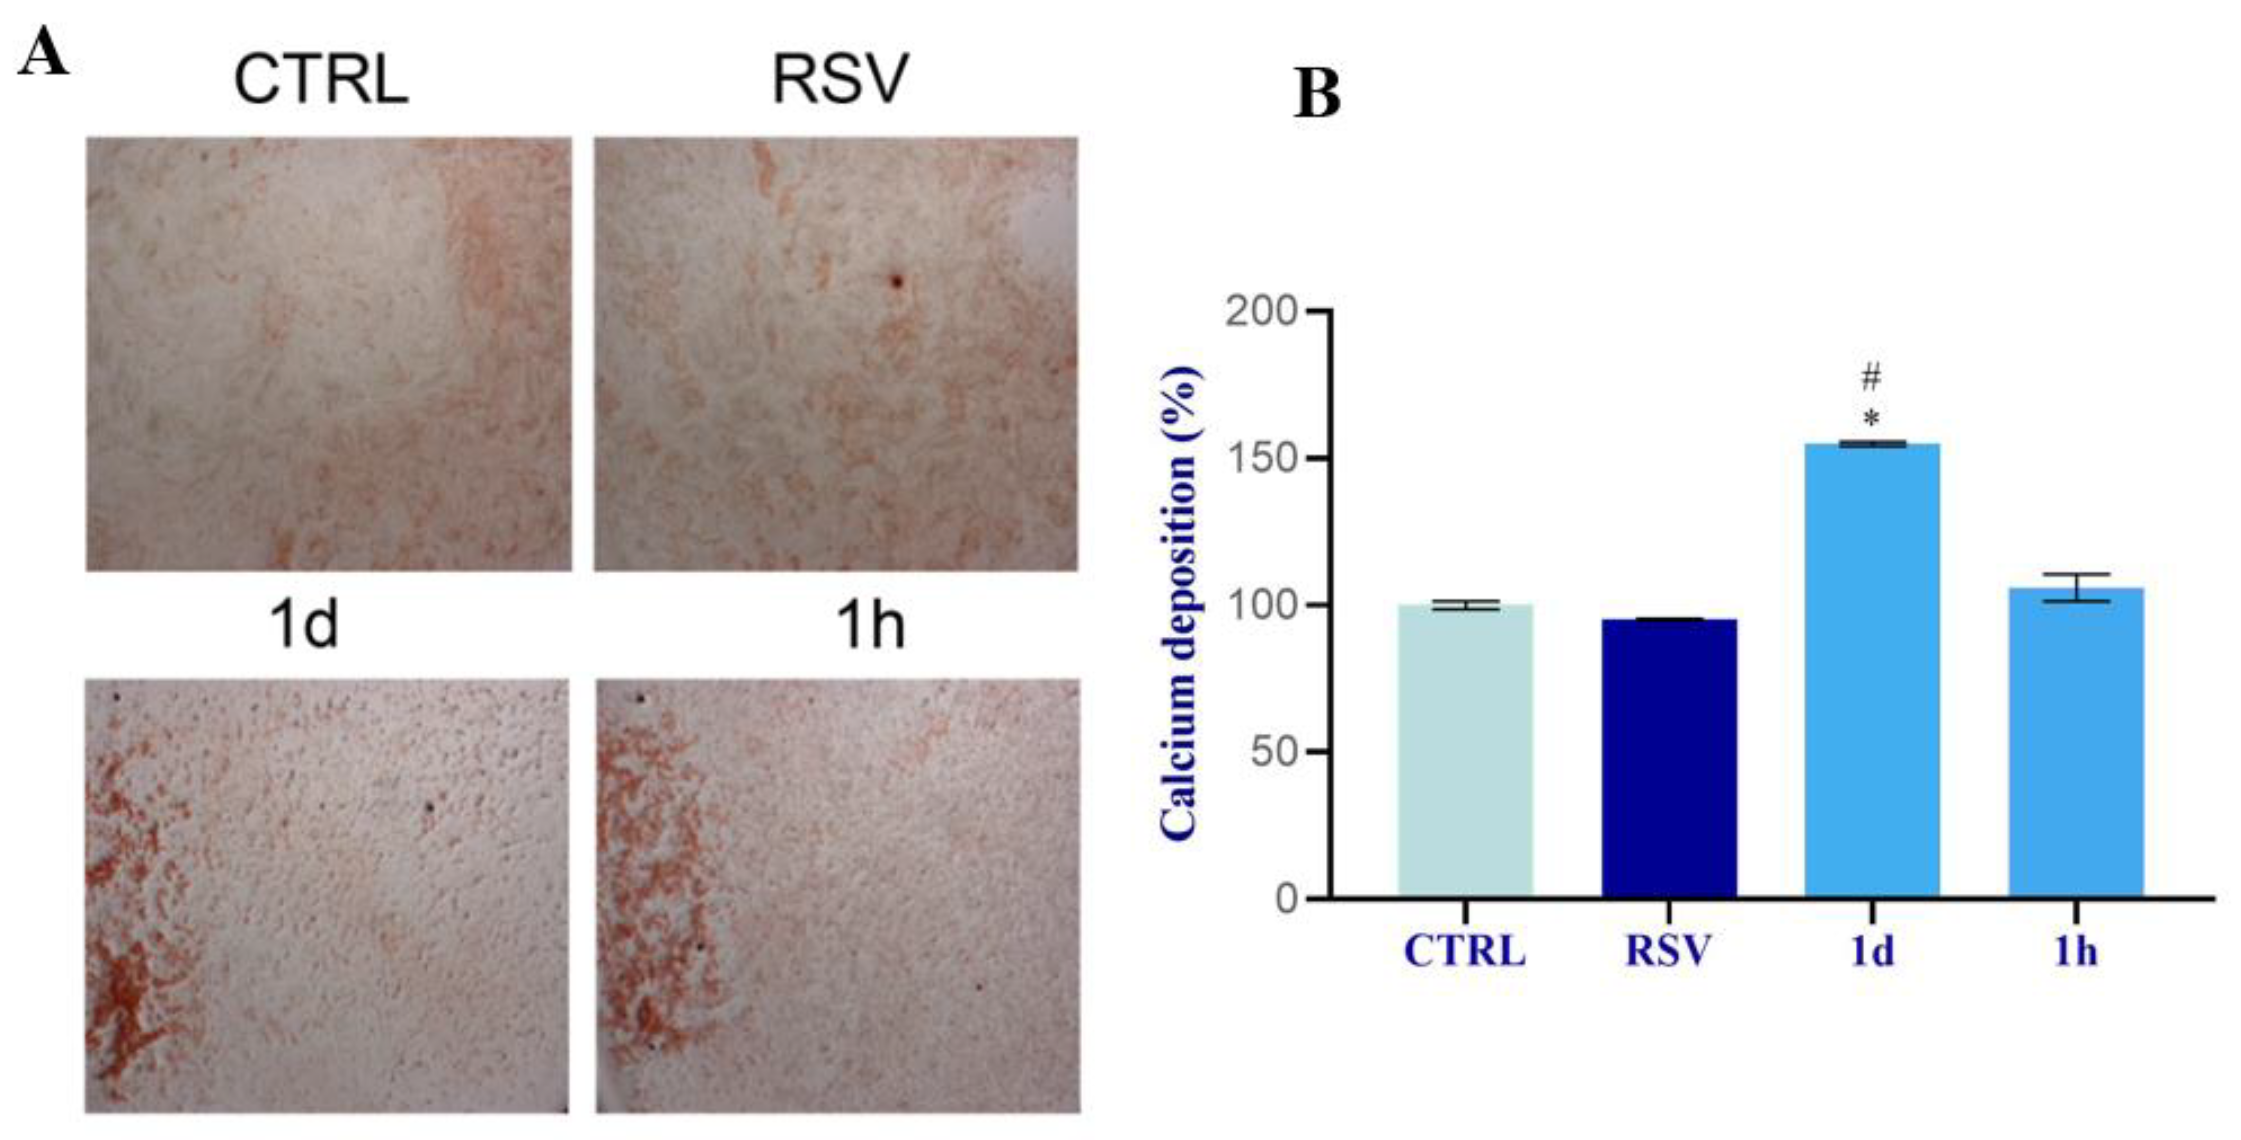
2.2.7. Mineralization in HOBs
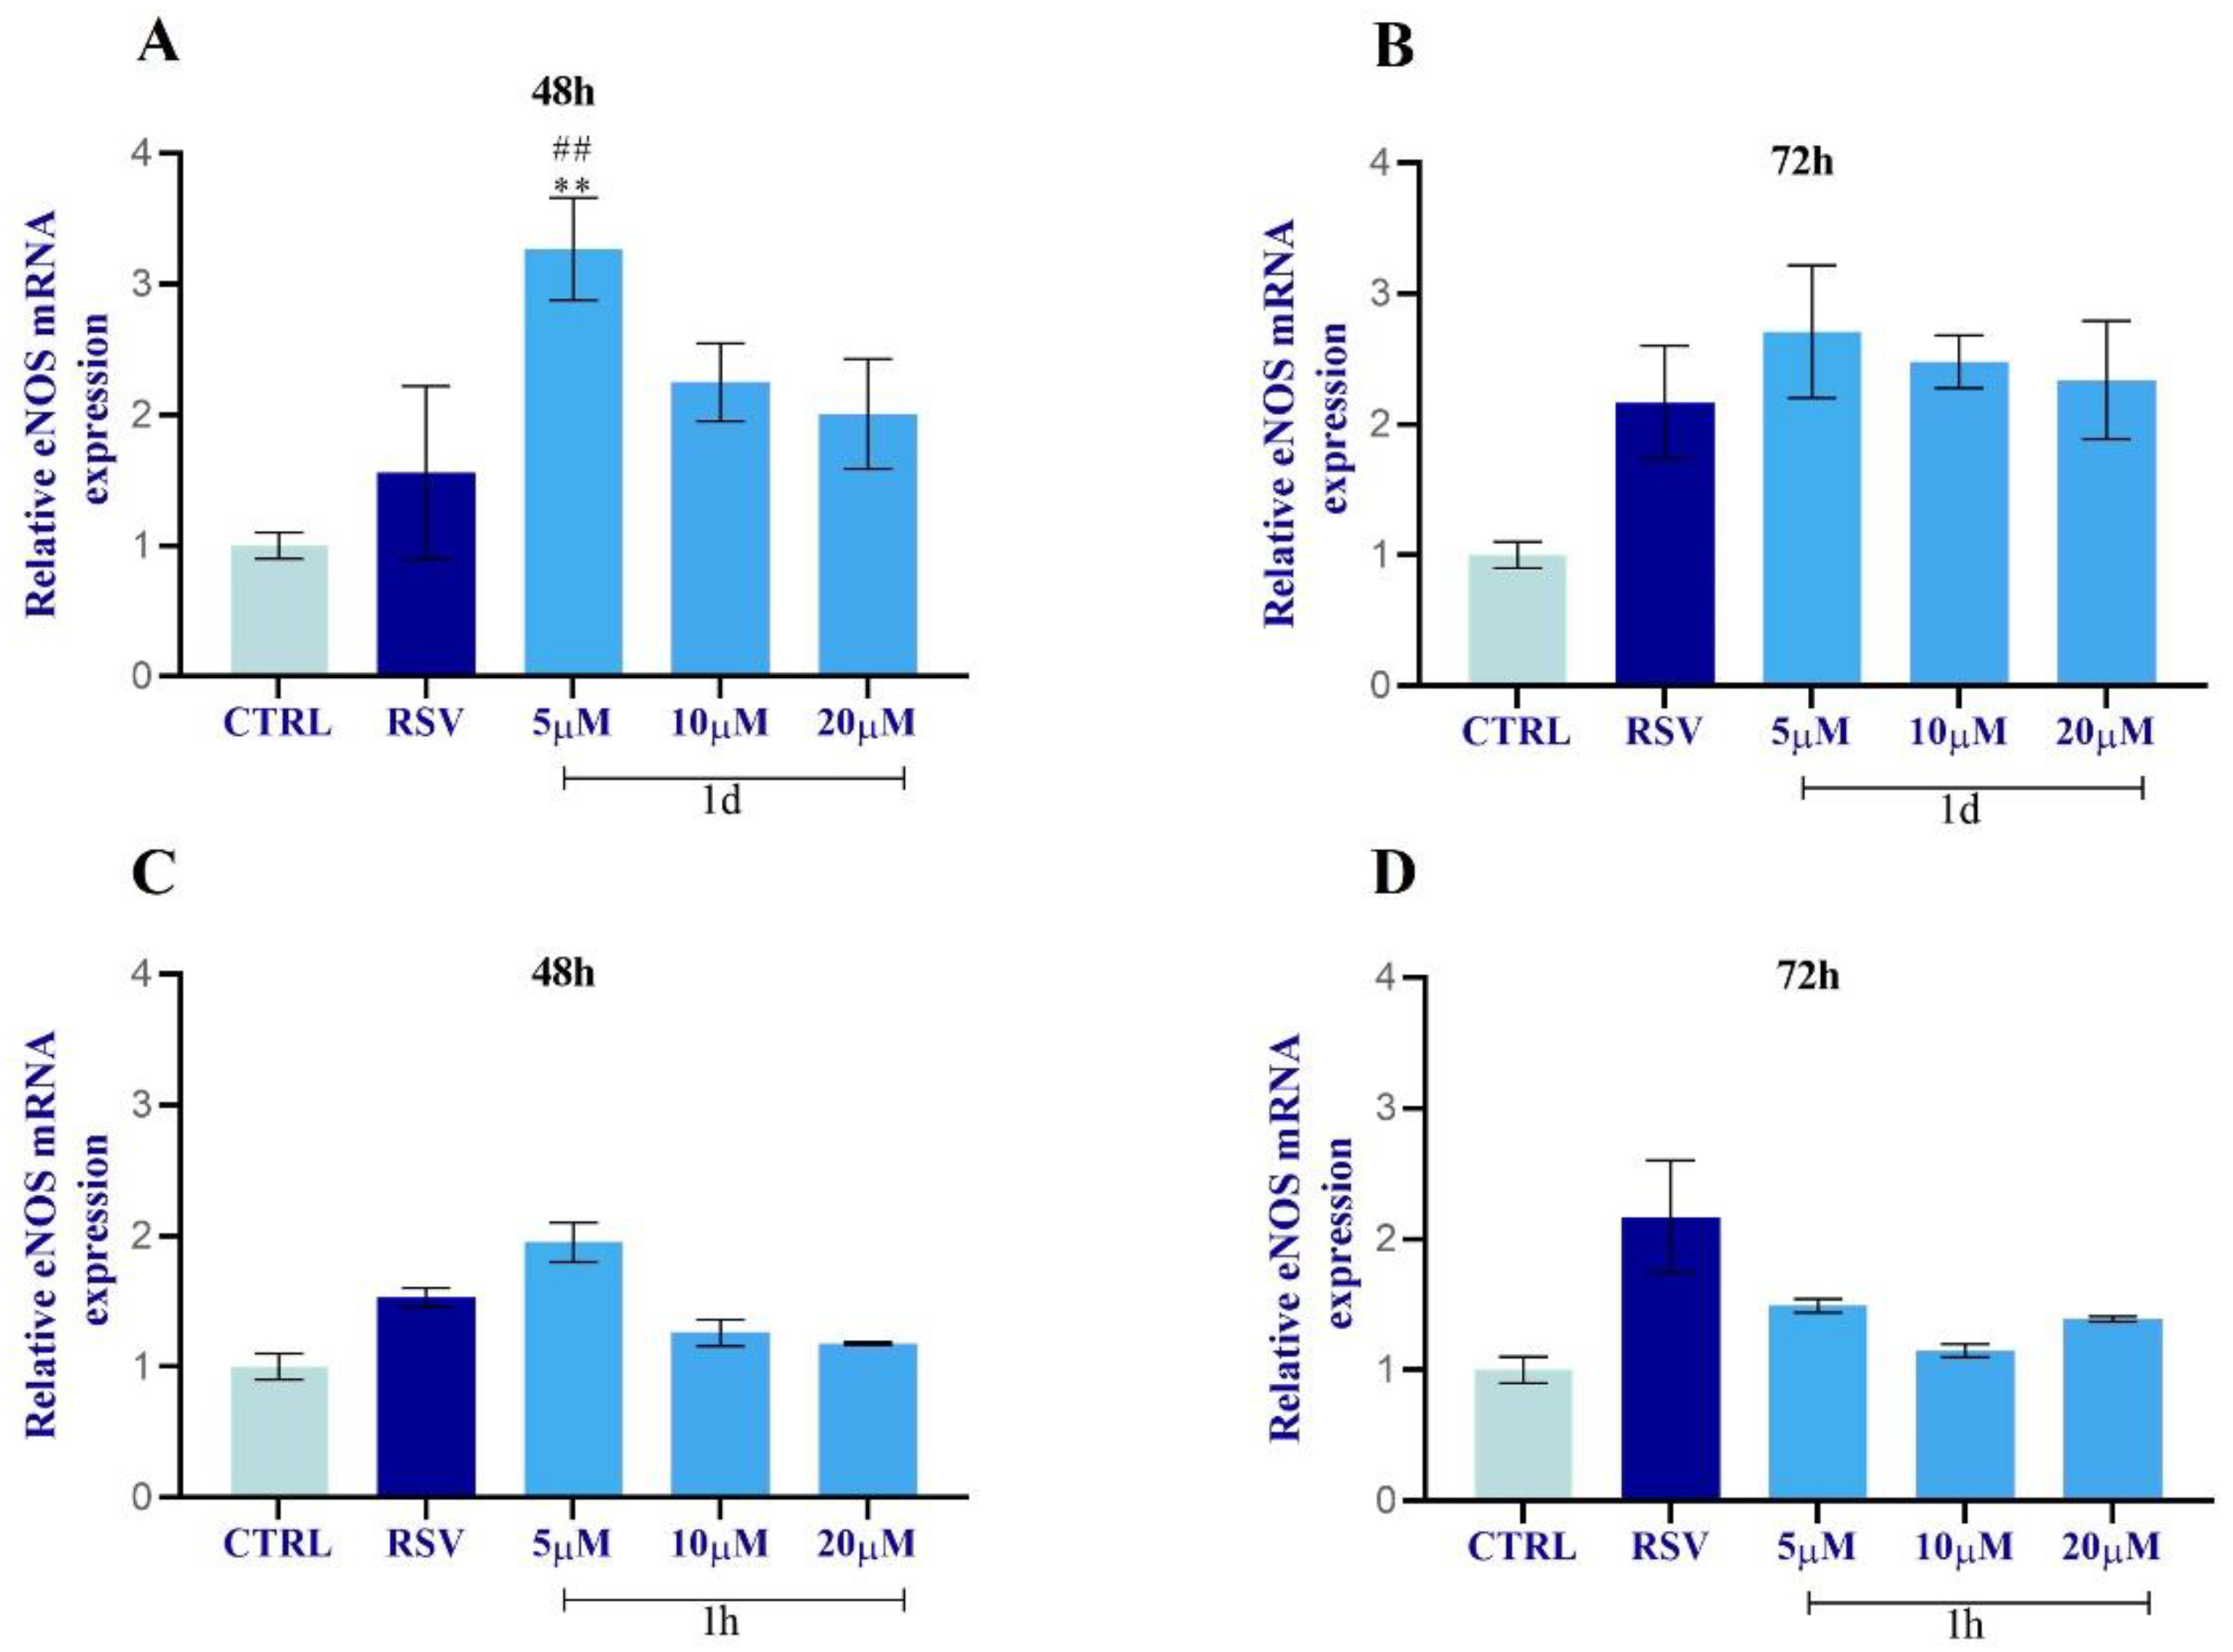
2.2.8. Upregulation of eNOS in HUVECs
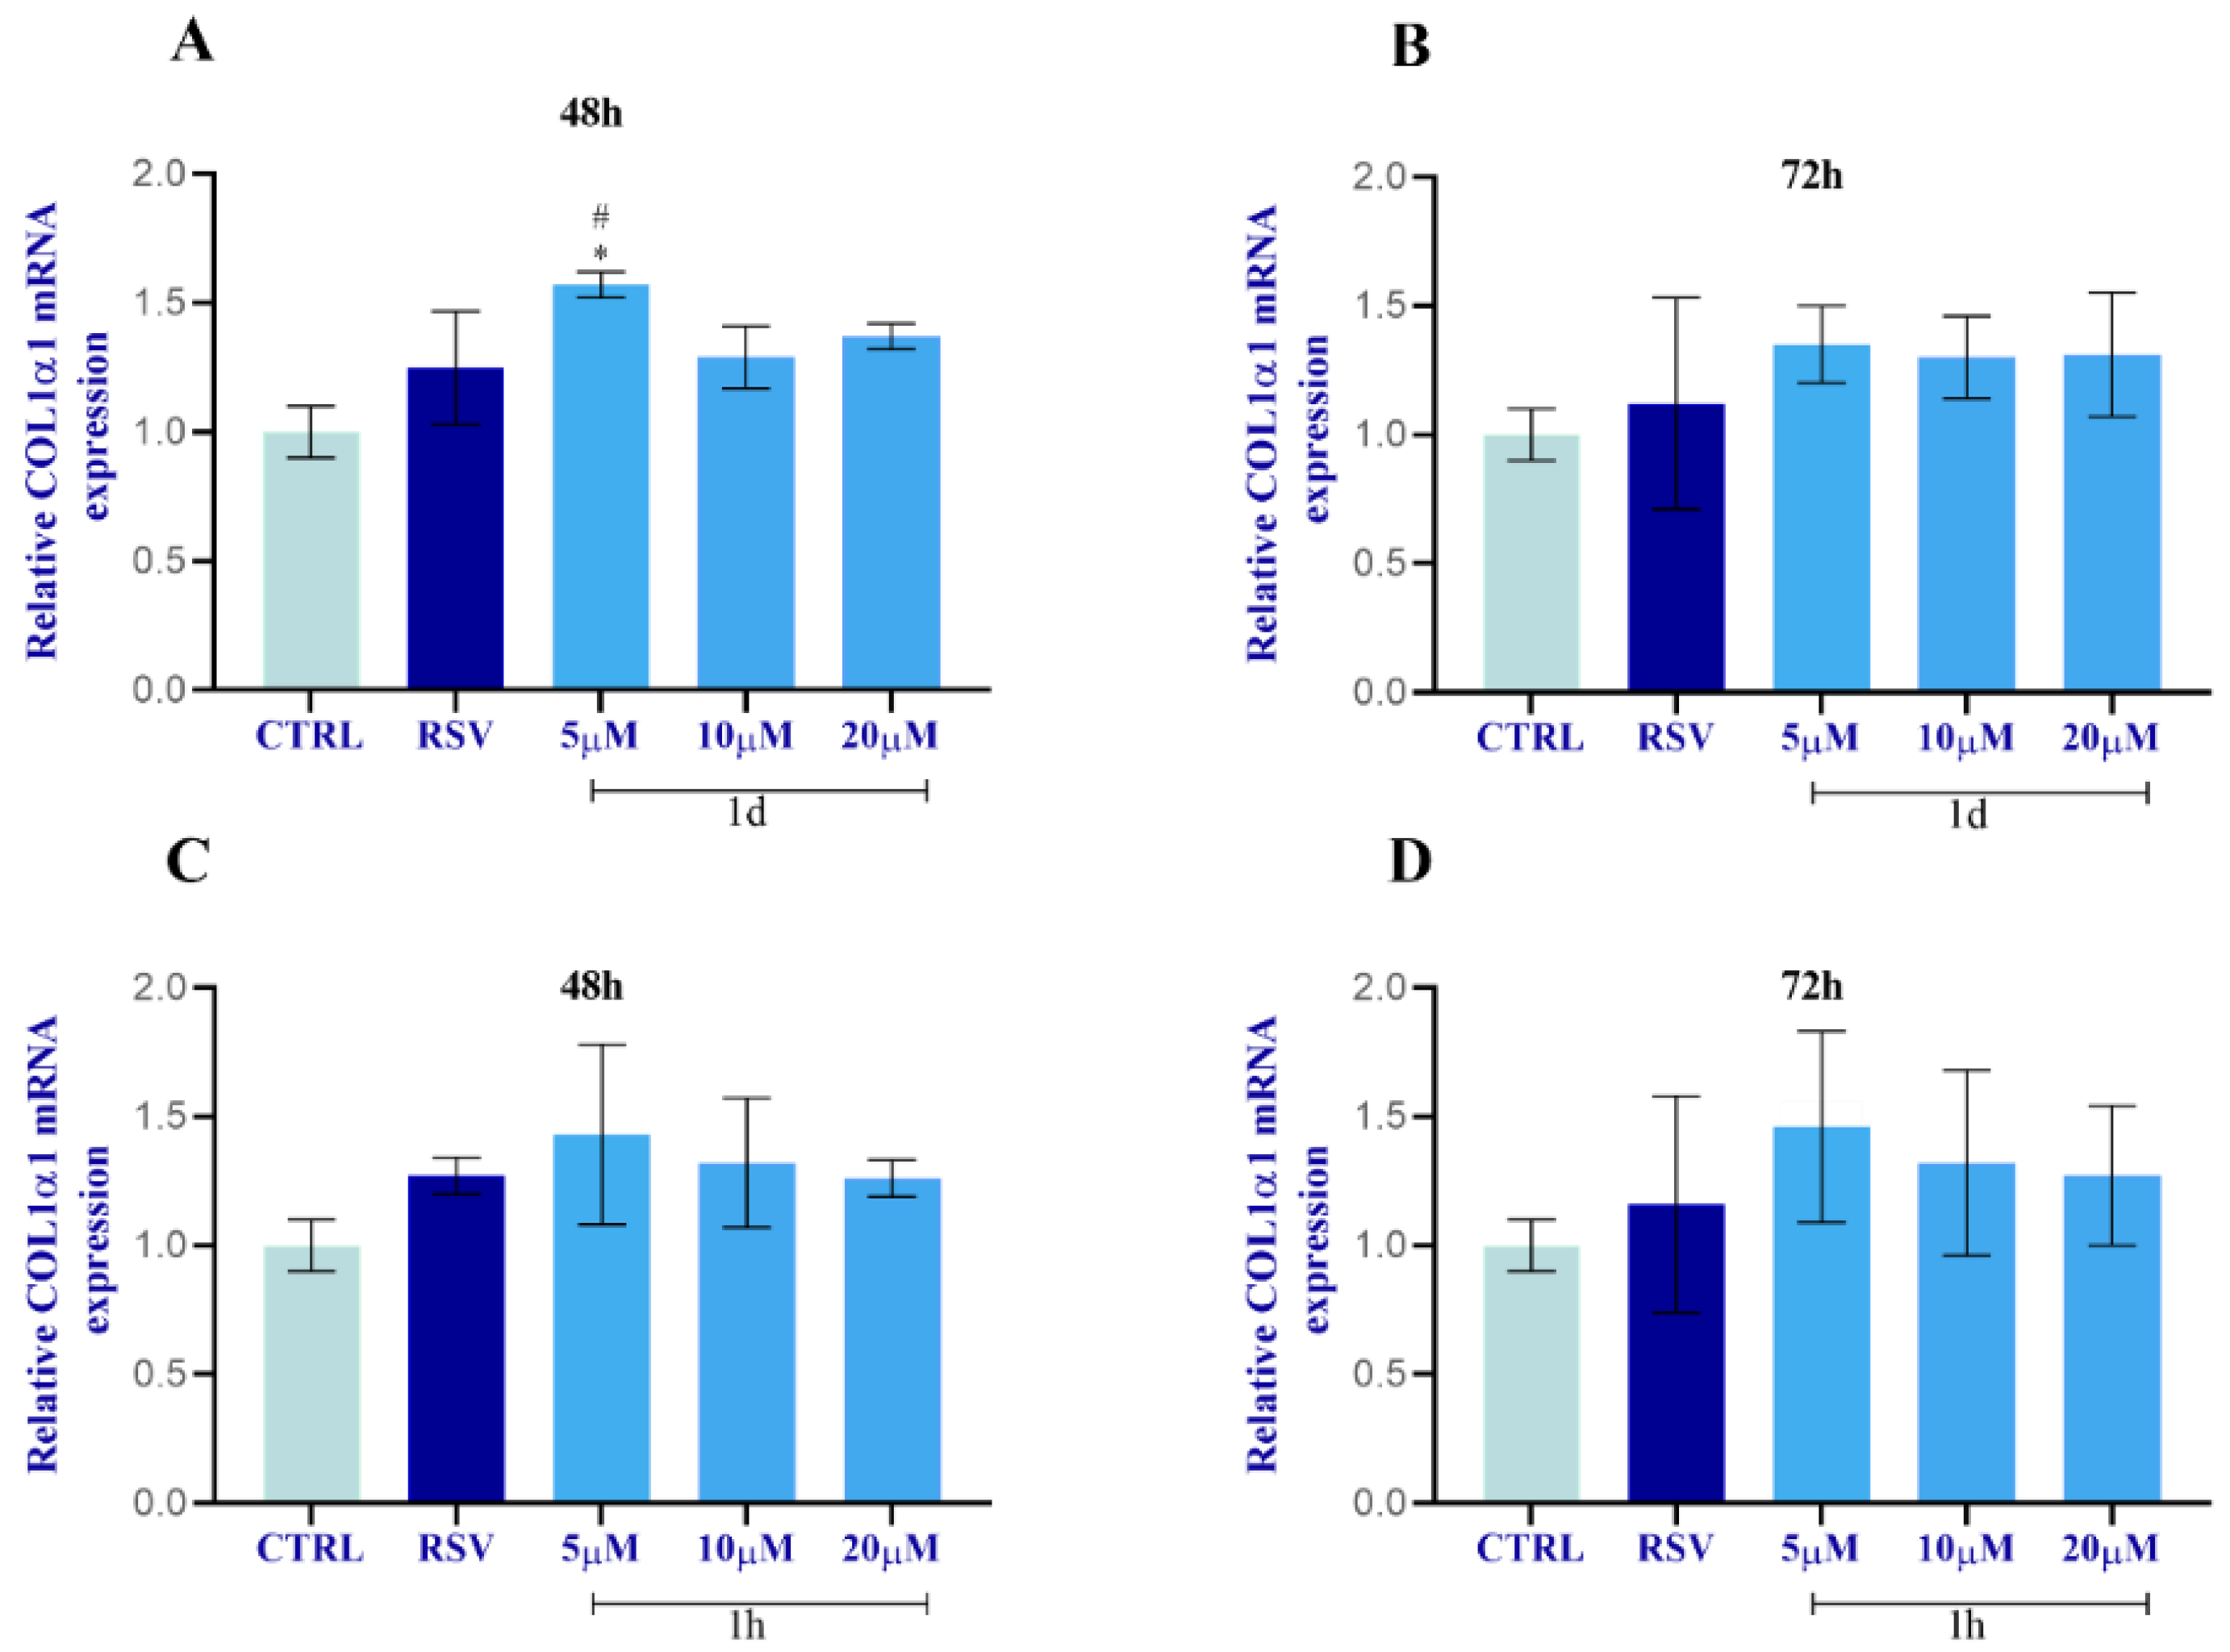
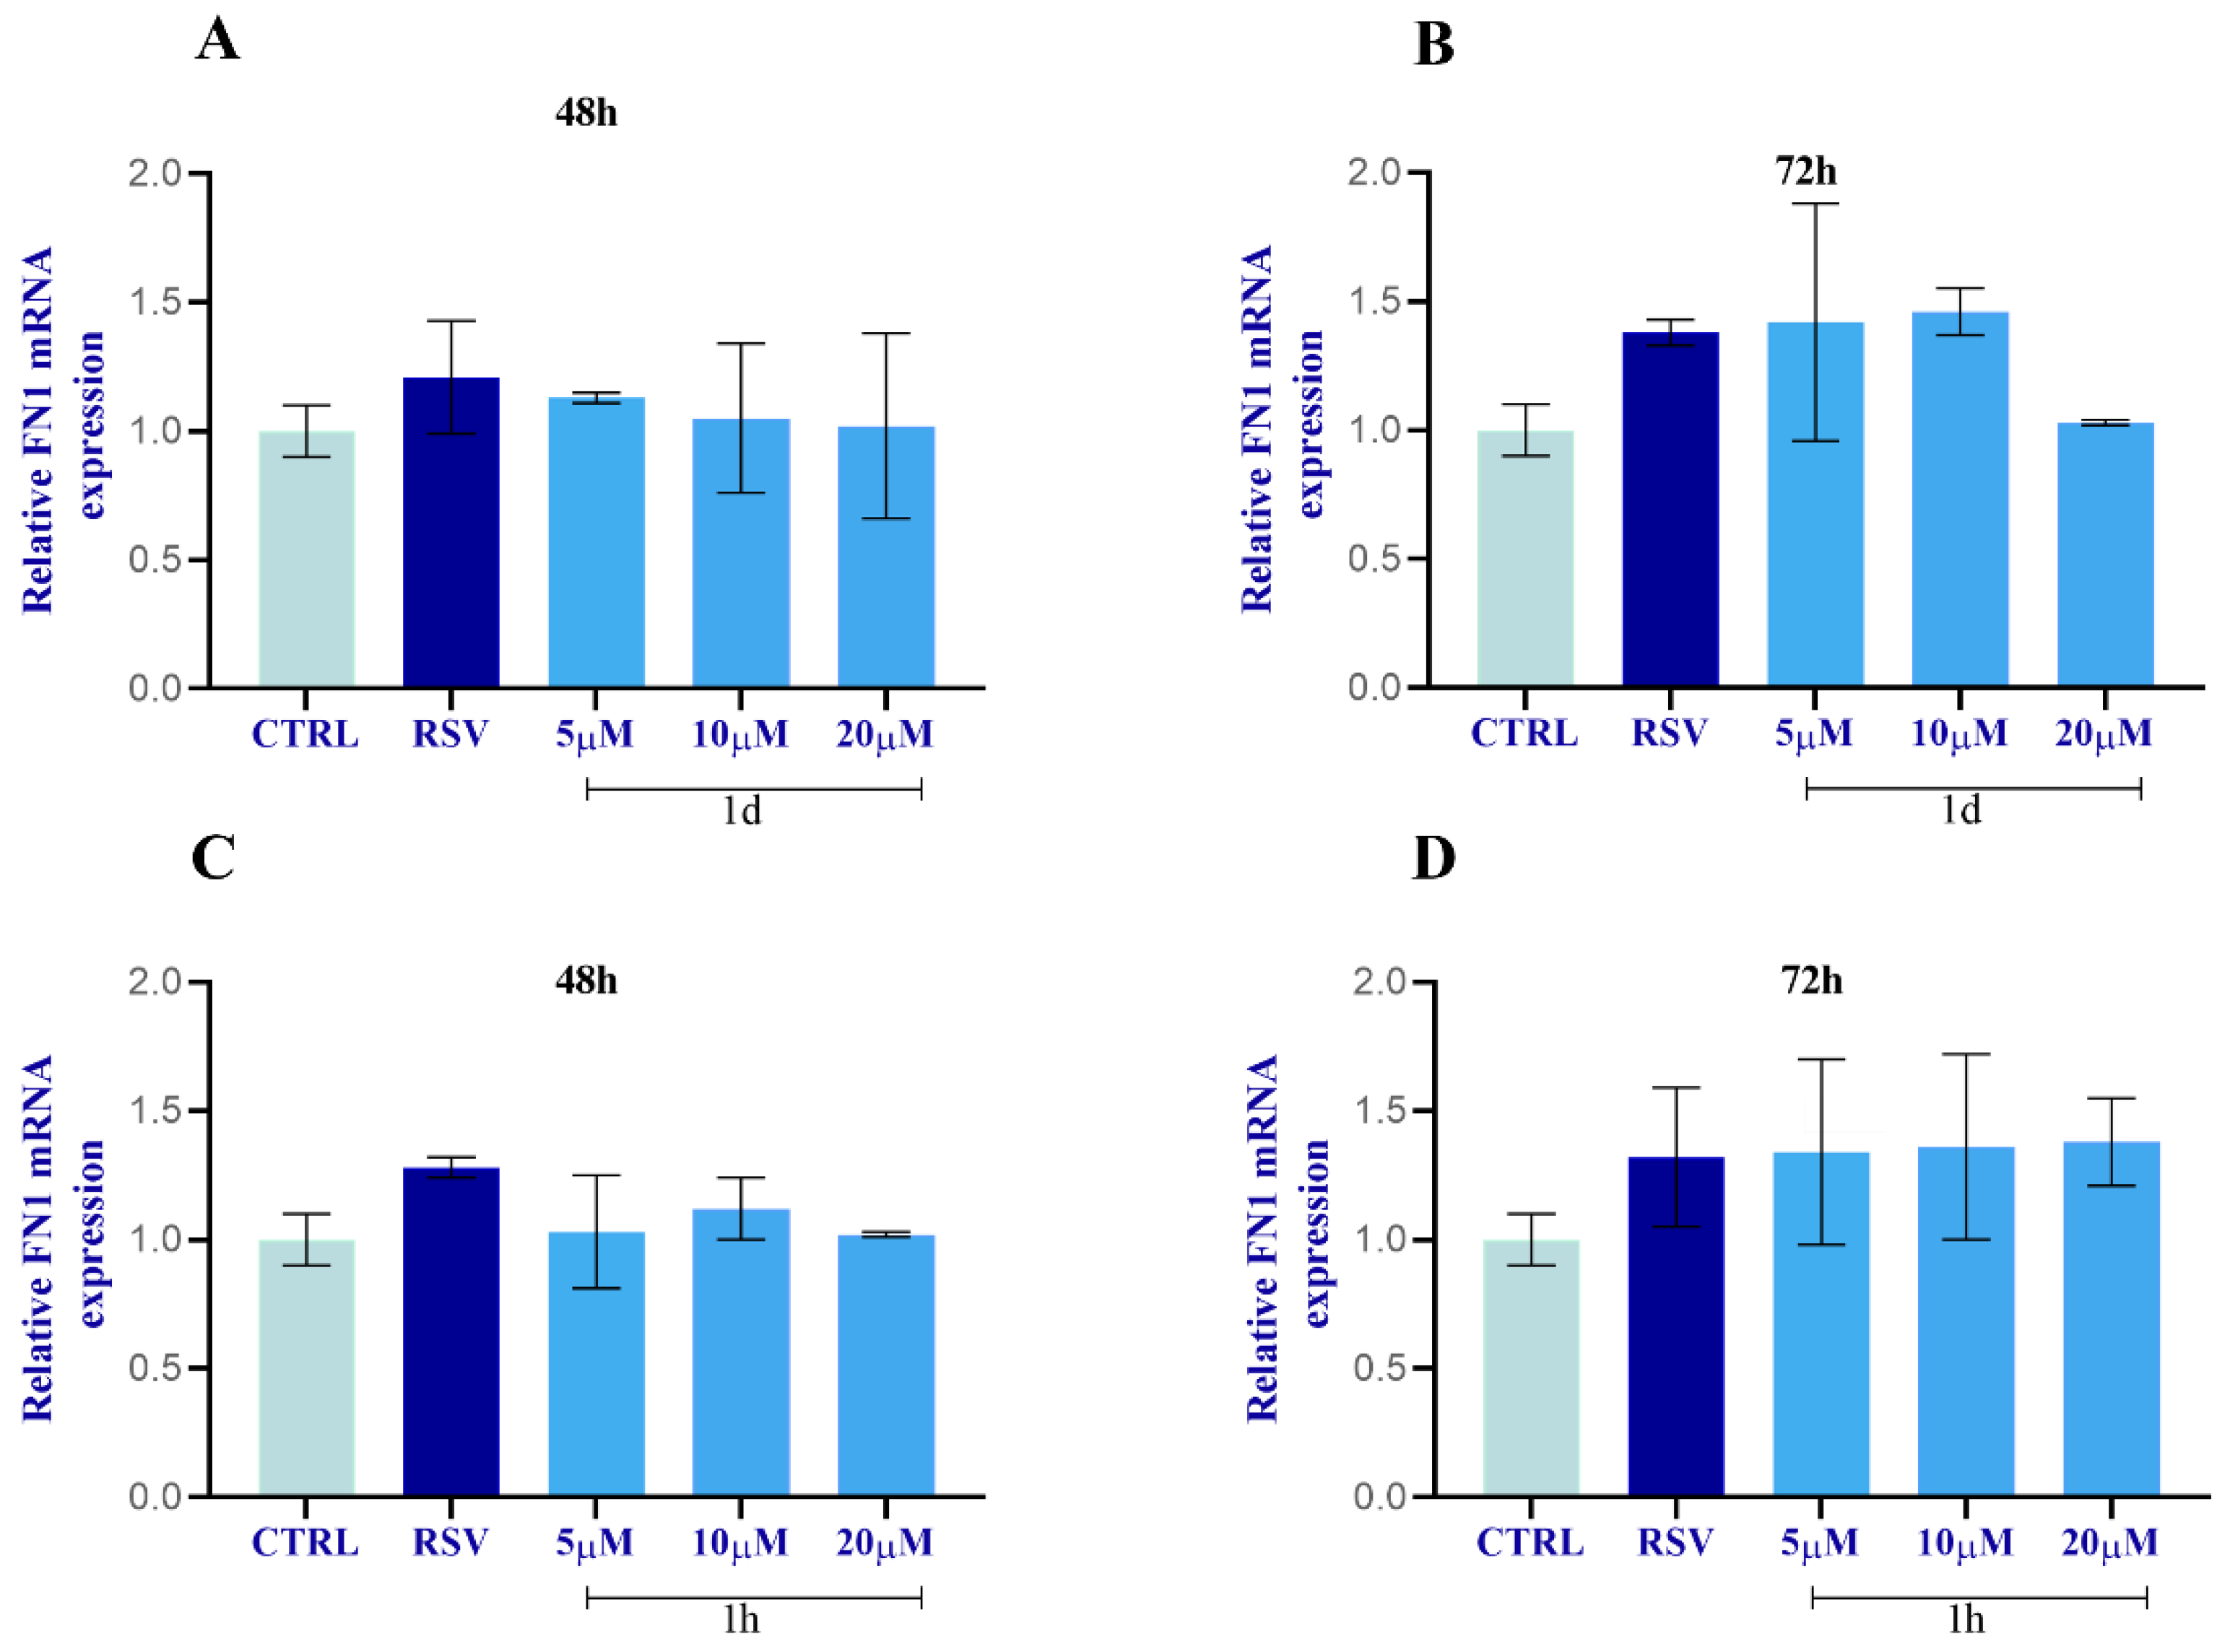
2.2.9. Regulation of FN1 and COL1α1 in HGFs
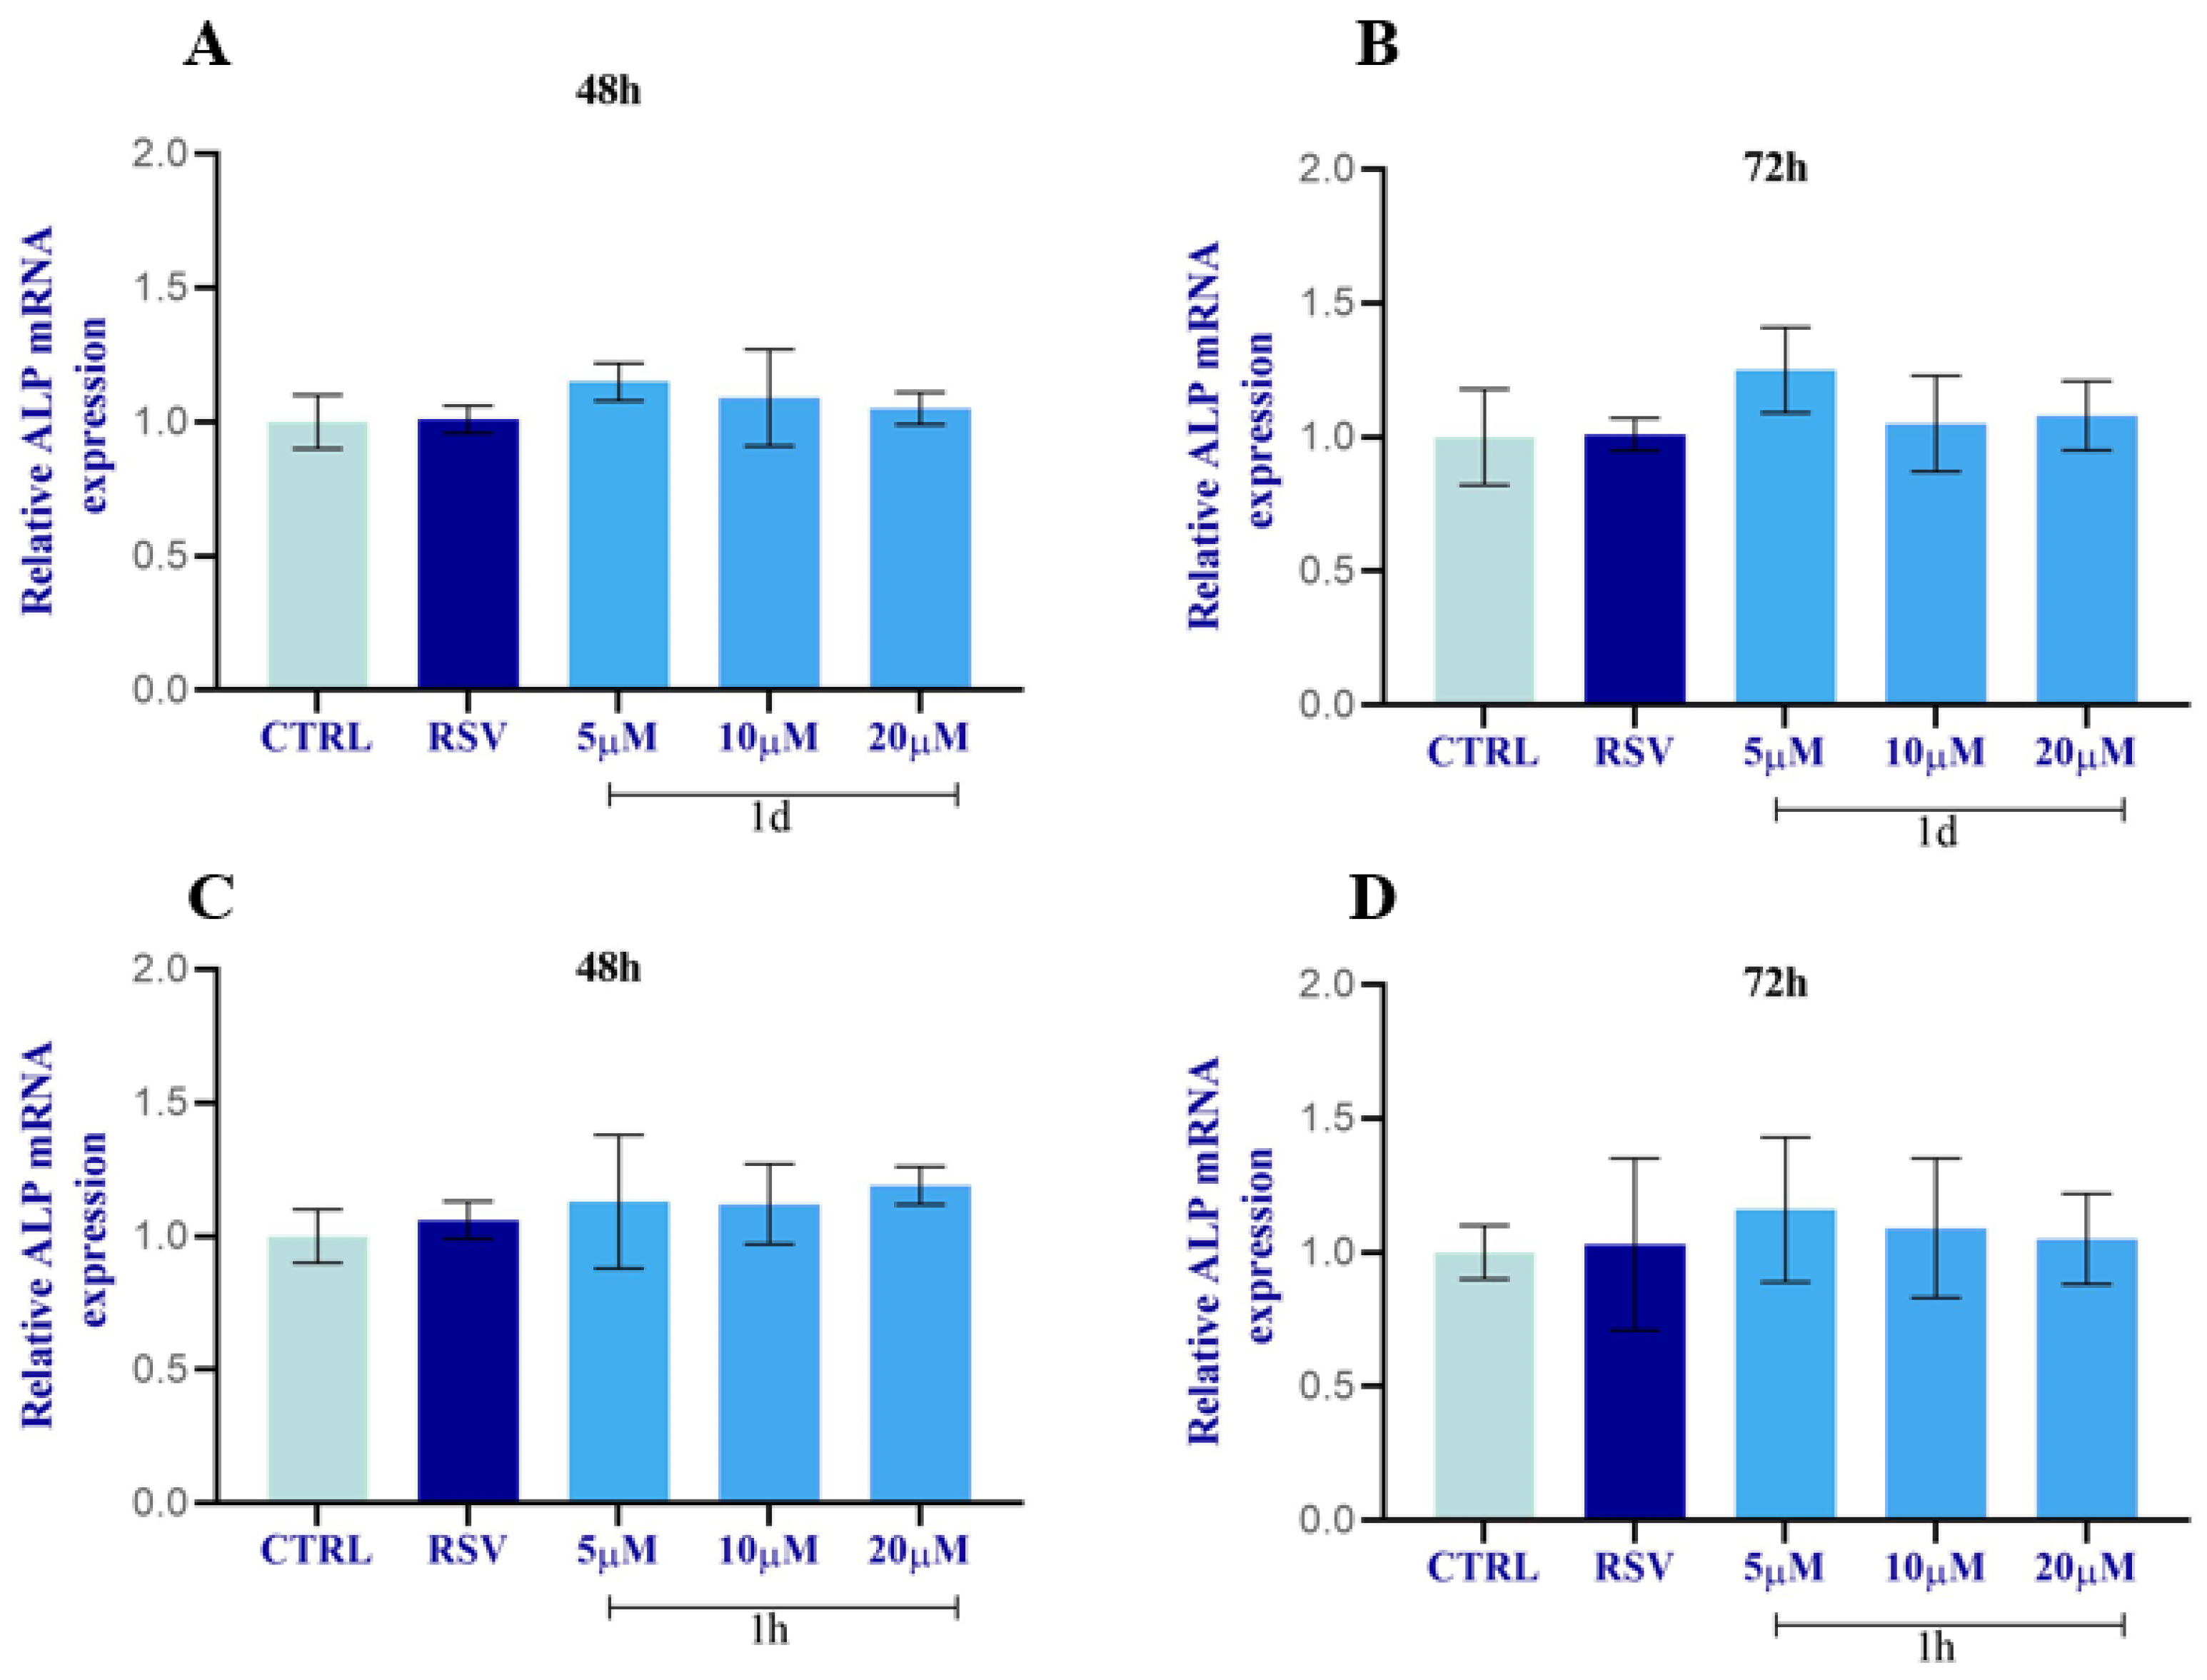
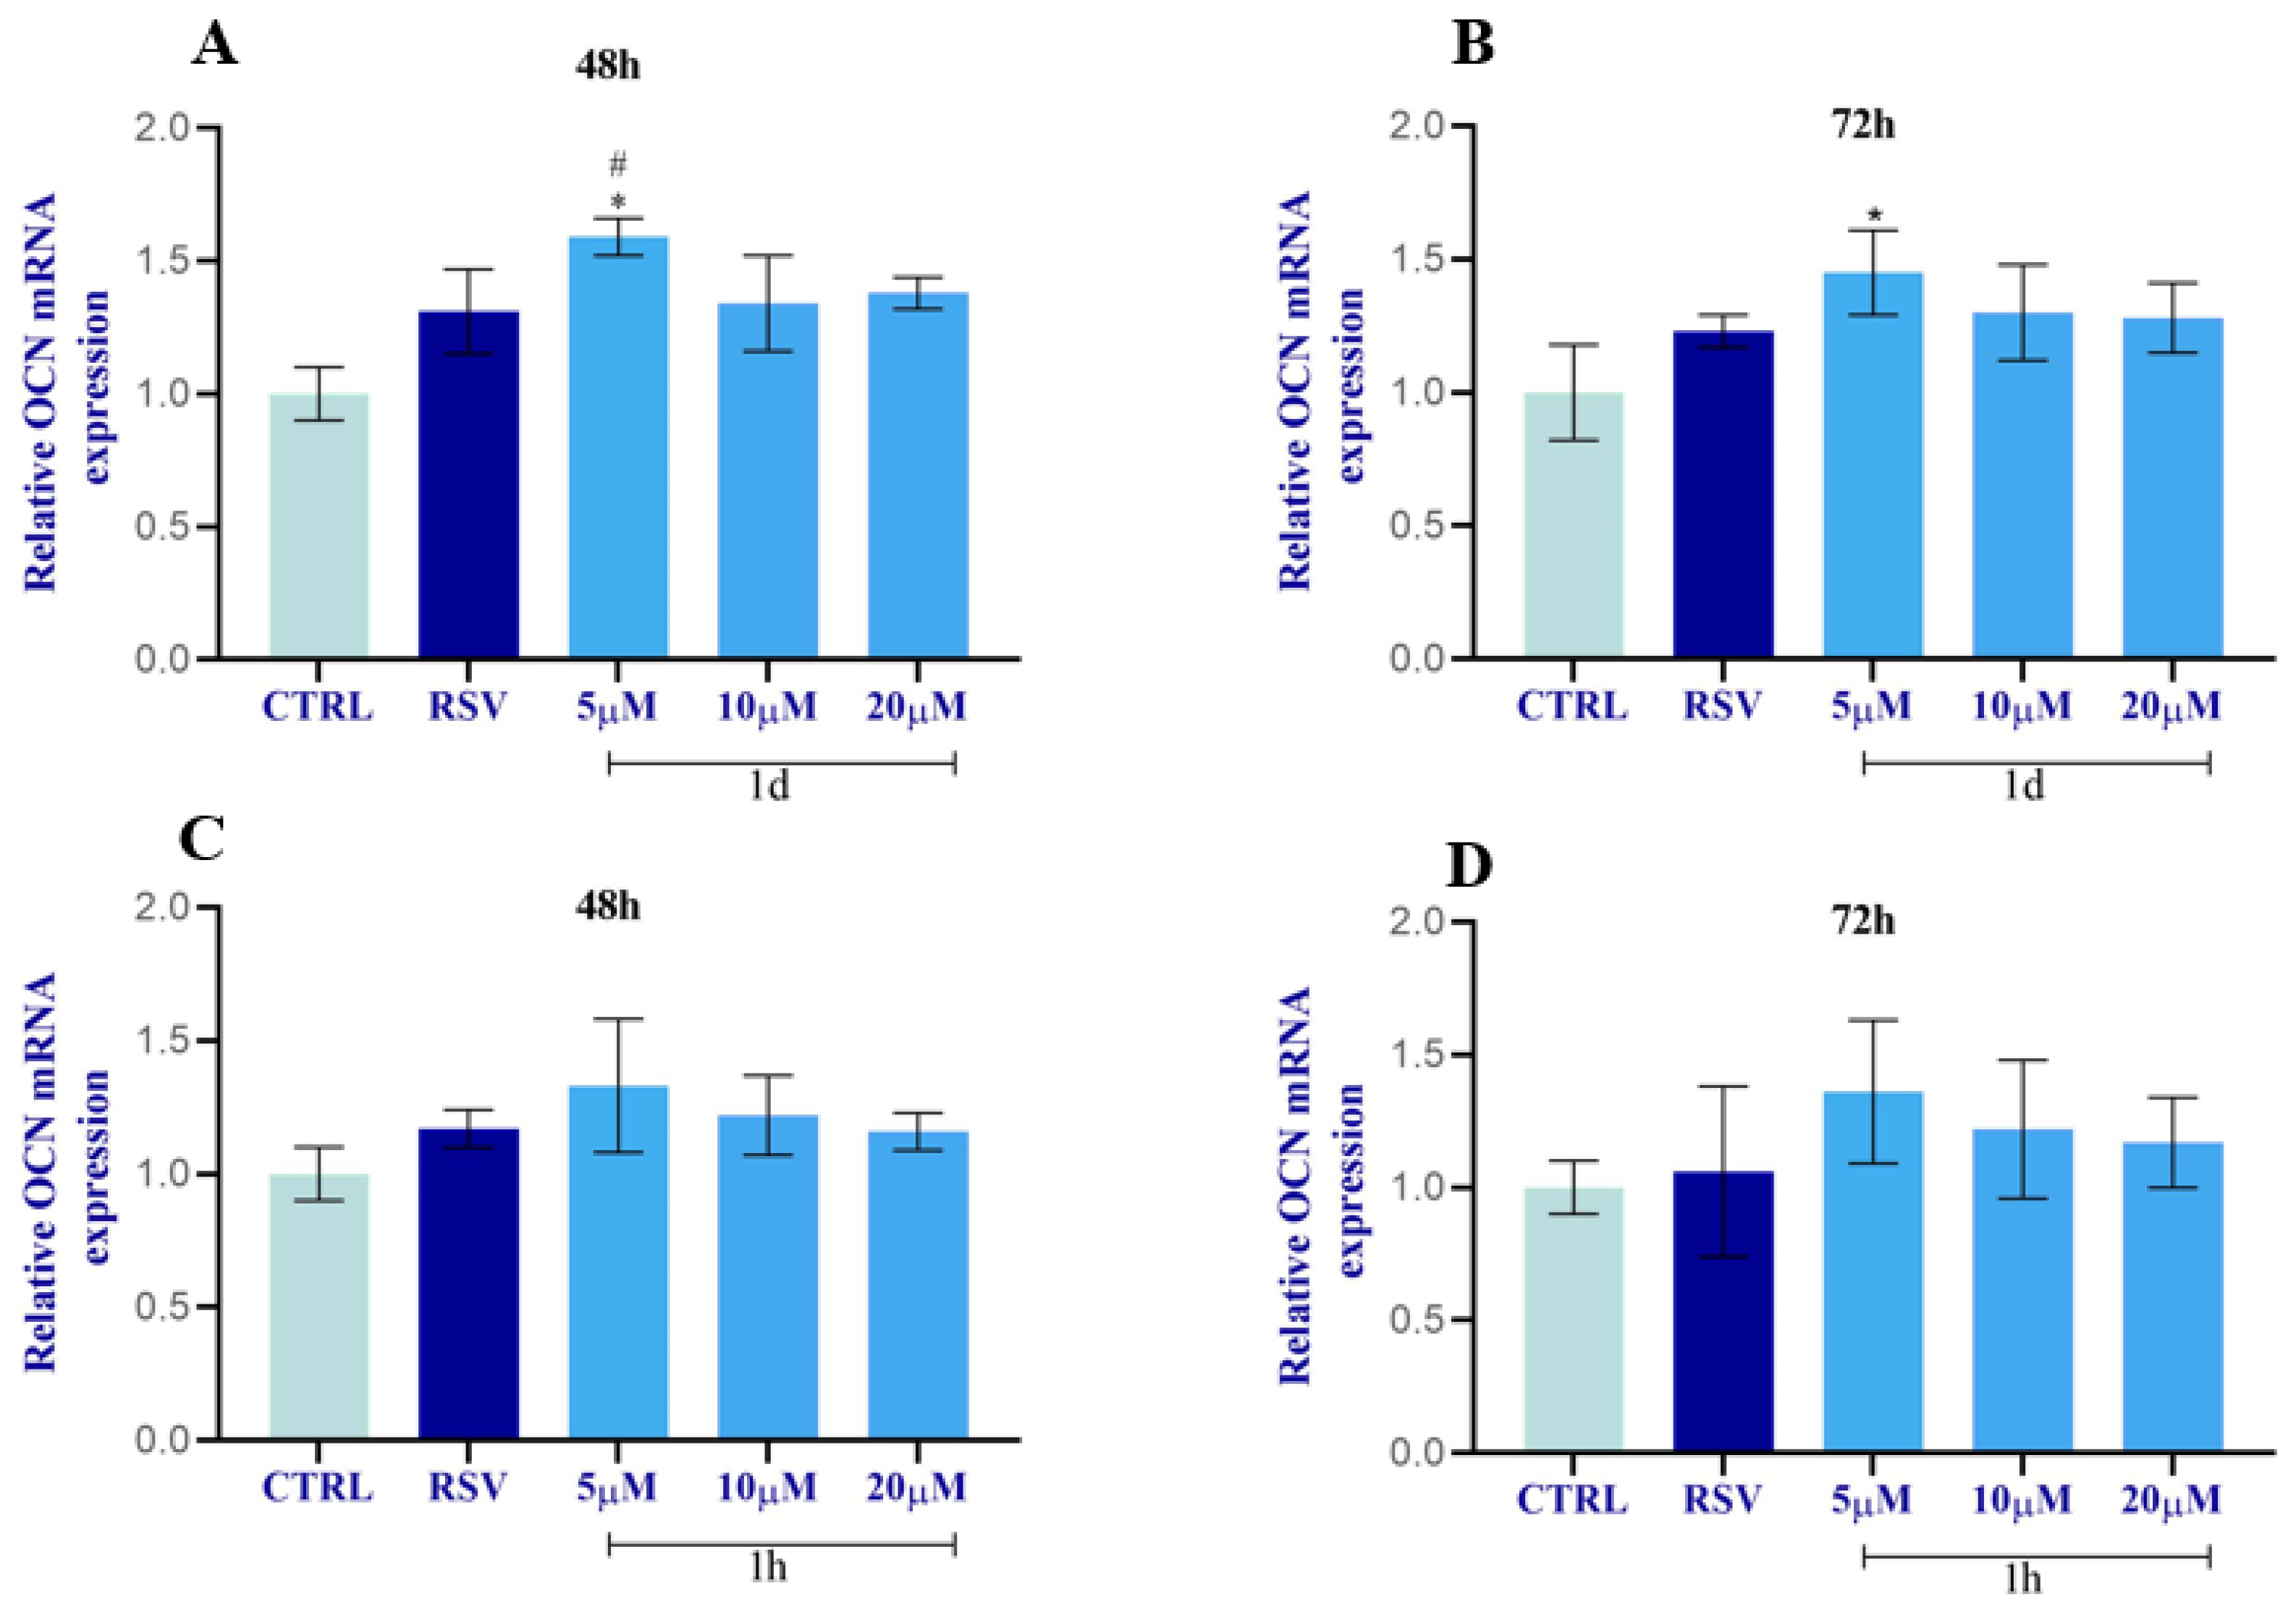
2.2.10. Regulation of ALP and OCN in HOBs
2.3. Physicochemical Characterization and Stability Studies of 1d and 1h
3. Discussion
4. Materials and Methods
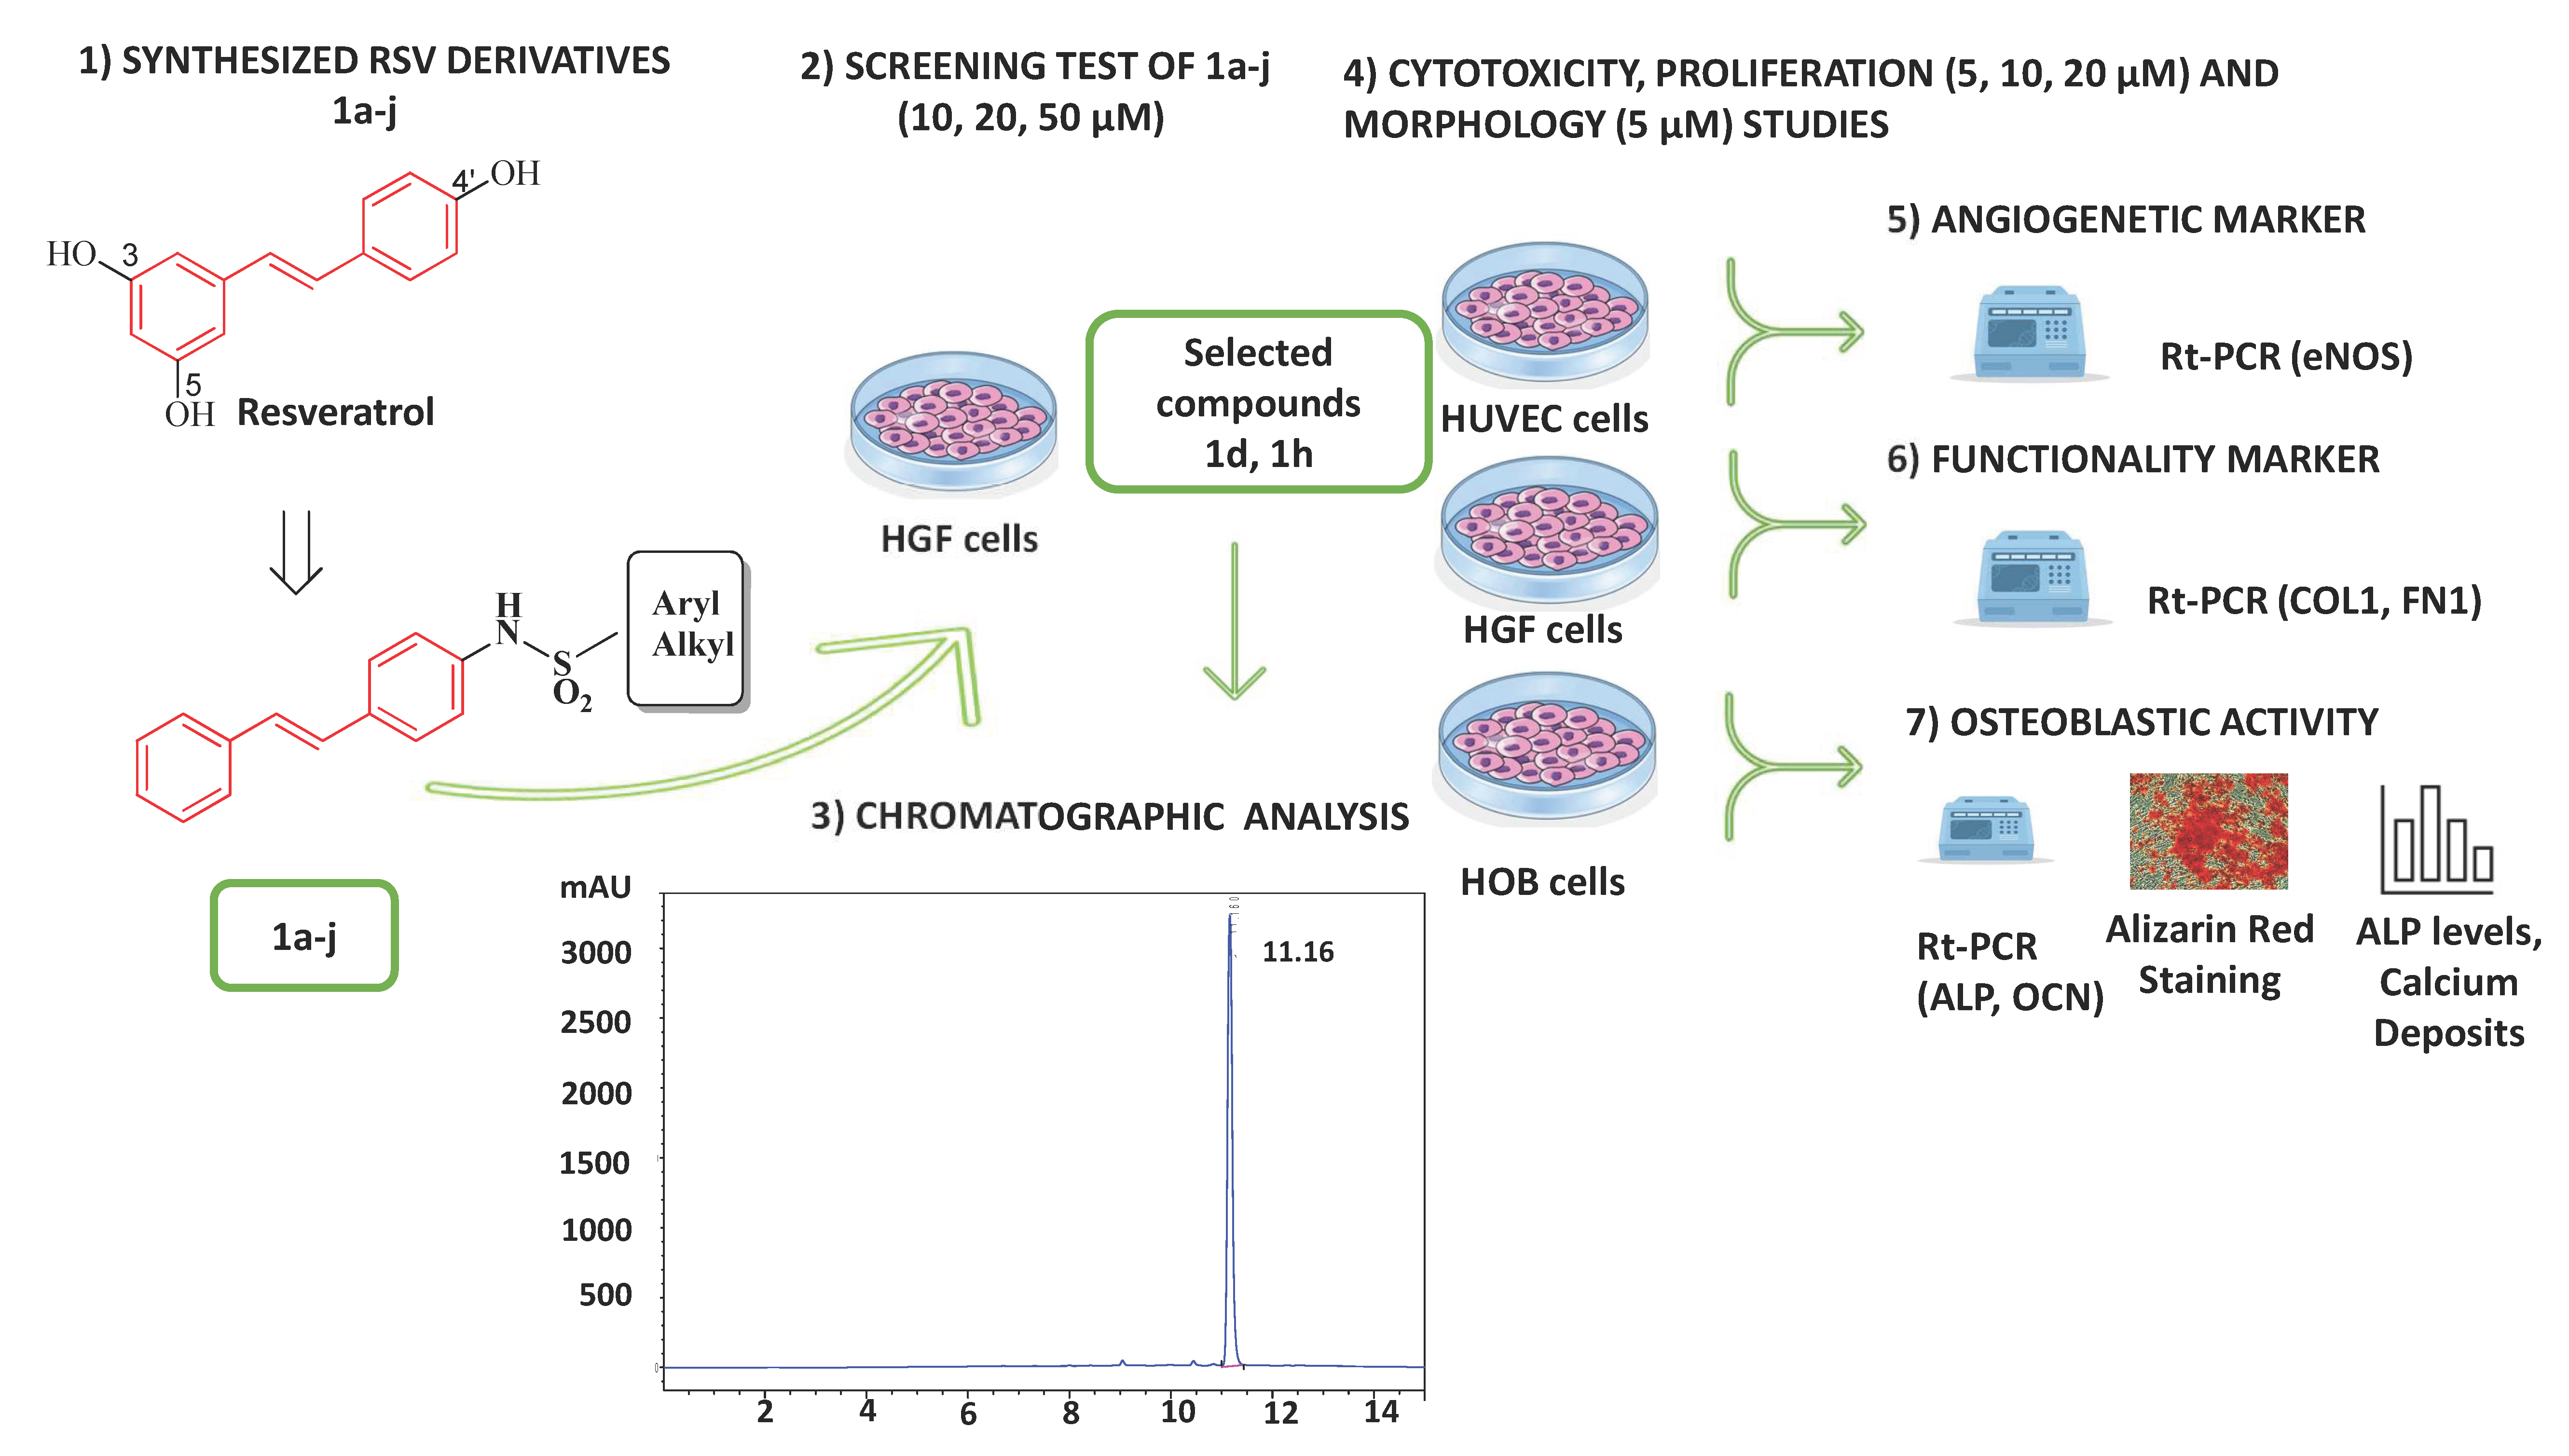
4.1. Experimental Design
- (1)
- A first screening to assess the cytocompatibility of RSV derivatives 1a–j (10, 20, and 50 µM) on HGFs, by MTT assay at 24 h.
- (2)
- The selected compounds 1d and 1h, which did not show cytotoxicity for HGF viability, were then tested on HUVECs, HGFs, and HOBs for the following assays at the concentrations of 5, 10, and 20 µM to measure the following:
- Cytotoxicity by LDH assay at 24 h;
- Cell viability by MTT assay at 48 and 72 h;
- Morphology of HUVECs and HGFs by toluidine-blue staining at 48 and 72 h;
- ALP levels in HOBs, by ALP assay, at 7 days;
- Mineralization in HOBs, by Alizarin Red staining and calcium deposition, at 14 days;
- Gene expression by RT-qPCR of eNOS for HUVECs; COL1 and FN1 for HGFs; and ALP and OCN for HOBs, at 48 and 72 h.
- (3)
- The physicochemical characterization together with the stability studies of 1d and 1h were investigated by HPLC analysis.
4.2. Chemistry
4.2.1. General Procedures for the Synthesis of 1a–j
4.2.2. 4-Methyl-N-{4-[(E)-2-phenylvinyl]phenyl}benzenesulfonamide (1d)
4.2.3. N-{4-[(E)-2-Phenylvinyl]phenyl}ethanesulfonamide (1h)
4.3. Biological Procedures
4.3.1. Cell Culture
4.3.2. Cell Treatments
4.3.3. MTT Assay
4.3.4. LDH Assay
4.3.5. Toluidine Blue Staining
4.3.6. Gene Expression
4.3.7. ALP Assay
4.3.8. Alizarin Red Staining and Calcium Deposition
4.4. Physicochemical Properties and Stability Studies of 1d and 1h
4.4.1. Chromatographic Conditions
4.4.2. Water Solubility
4.4.3. LogP Determination
4.4.4. Kinetic of Chemical Hydrolysis
4.4.5. Kinetics in Plasma
4.5. Statistical Analysis
5. Conclusions
Supplementary Materials
Author Contributions
Funding
Institutional Review Board Statement
Informed Consent Statement
Data Availability Statement
Acknowledgments
Conflicts of Interest
References
- Griffith, A.; Mateen, A.; Markowitz, K.; Singer, S.R.; Cugini, C.; Shimizu, E.; Wiedman, G.R.; Kumar, V. Alternative Antibiotics in Dentistry: Antimicrobial Peptides. Pharmaceutics 2022, 14, 1679. [Google Scholar] [CrossRef] [PubMed]
- Sculean, A.; Gruber, R.; Bosshardt, D.D. Soft Tissue Wound Healing around Teeth and Dental Implants. J. Clin. Periodontol. 2014, 41 (Suppl. 15), S6–S22. [Google Scholar] [CrossRef] [PubMed]
- Rossiter, S.E.; Fletcher, M.H.; Wuest, W.M. Natural Products as Platforms To Overcome Antibiotic Resistance. Chem. Rev. 2017, 117, 12415–12474. [Google Scholar] [CrossRef]
- Martelli, G.; Giacomini, D. Antibacterial and Antioxidant Activities for Natural and Synthetic Dual-Active Compounds. Eur. J. Med. Chem. 2018, 158, 91–105. [Google Scholar] [CrossRef] [PubMed]
- Torre, E. Molecular Signaling Mechanisms behind Polyphenol-Induced Bone Anabolism. Phytochem. Rev. 2017, 16, 1183–1226. [Google Scholar] [CrossRef] [PubMed]
- Jayaprakash, J.S.; Gowda, D.v.; Kulkarni, P.K. Therapeutic Application of Resveratrol in Human Diseases. Int. J. Res. Pharm. Sci. 2020, 11, 1447–1456. [Google Scholar] [CrossRef]
- Murgia, D.; Mauceri, R.; Campisi, G.; de Caro, V. Advance on Resveratrol Application in Bone Regeneration: Progress and Perspectives for Use in Oral and Maxillofacial Surgery. Biomolecules 2019, 9, 94. [Google Scholar] [CrossRef]
- Wang, L.; Li, Q.; Yan, H.; Jiao, G.; Wang, H.; Chi, H.; Zhou, H.; Chen, L.; Shan, Y.; Chen, Y. Resveratrol Protects Osteoblasts Against Dexamethasone-Induced Cytotoxicity Through Activation of AMP-Activated Protein Kinase. Drug Des. Dev. Ther. 2020, 14, 4451–4463. [Google Scholar] [CrossRef]
- Neves, A.R.; Lucio, M.; Lima, J.L.C.; Reis, S. Resveratrol in Medicinal Chemistry: A Critical Review of Its Pharmacokinetics, Drug-Delivery, and Membrane Interactions. Curr. Med. Chem. 2012, 19, 1663–1681. [Google Scholar] [CrossRef]
- Yang, T.; Wang, L.; Zhu, M.; Zhang, L.; Yan, L. Properties and Molecular Mechanisms of Resveratrol: A Review. Pharmazie 2015, 70, 501–506. [Google Scholar] [CrossRef]
- Koh, Y.C.; Ho, C.T.; Pan, M.H. Recent Advances in Health Benefits of Stilbenoids. J. Agric. Food Chem. 2021, 69, 10036–10057. [Google Scholar] [CrossRef] [PubMed]
- Fantacuzzi, M.; Amoroso, R.; Carradori, S.; De Filippis, B. Resveratrol-Based Compounds and Neurodegeneration: Recent Insight in Multitarget Therapy. Eur. J. Med. Chem. 2022, 233, 114242. [Google Scholar] [CrossRef] [PubMed]
- Ávila-Salas, F.; Marican, A.; Pinochet, S.; Carreño, G.; Valdés, O.; Venegas, B.; Donoso, W.; Cabrera-Barjas, G.; Vijayakumar, S.; Durán-Lara, E.F. Film Dressings Based on Hydrogels: Simultaneous and Sustained-Release of Bioactive Compounds with Wound Healing Properties. Pharmaceutics 2019, 11, 447. [Google Scholar] [CrossRef]
- De Angelis, M.; De Filippis, B.; Balaha, M.; Giampietro, L.; Miteva, M.T.; de Chiara, G.; Palamara, A.T.; Nencioni, L.; Mollica, A. Nitrostilbenes: Synthesis and Biological Evaluation as Potential Anti-Influenza Virus Agents. Pharmaceuticals 2022, 15, 1061. [Google Scholar] [CrossRef]
- Carradori, S.; Fantacuzzi, M.; Ammazzalorso, A.; Angeli, A.; De Filippis, B.; Galati, S.; Petzer, A.; Petzer, J.P.; Poli, G.; Tuccinardi, T.; et al. Resveratrol Analogues as Dual Inhibitors of Monoamine Oxidase B and Carbonic Anhydrase VII: A New Multi-Target Combination for Neurodegenerative Diseases? Molecules 2022, 27, 7816. [Google Scholar] [CrossRef] [PubMed]
- Riccitiello, F.; de Luise, A.; Conte, R.; D’Aniello, S.; Vittoria, V.; di Salle, A.; Calarco, A.; Peluso, G. Effect of Resveratrol Release Kinetic from Electrospun Nanofibers on Osteoblast and Osteoclast Differentiation. Eur. Polym. J. 2018, 99, 289–297. [Google Scholar] [CrossRef]
- Neves, A.R.; Martins, S.; Segundo, M.A.; Reis, S. Nanoscale Delivery of Resveratrol towards Enhancement of Supplements and Nutraceuticals. Nutrients 2016, 8, 131. [Google Scholar] [CrossRef] [PubMed]
- De Filippis, B.; Ammazzalorso, A.; Amoroso, R.; Giampietro, L. Stilbene Derivatives as New Perspective in Antifungal Medicinal Chemistry. Drug Dev. Res. 2019, 80, 285–293. [Google Scholar] [CrossRef]
- di Filippo, E.S.; Giampietro, L.; De Filippis, B.; Balaha, M.; Ferrone, V.; Locatelli, M.; Pietrangelo, T.; Tartaglia, A.; Amoroso, R.; Fulle, S. Synthesis and Biological Evaluation of Halogenated E-Stilbenols as Promising Antiaging Agents. Molecules 2020, 25, 5770. [Google Scholar] [CrossRef]
- De Filippis, B.; De Lellis, L.; Florio, R.; Ammazzalorso, A.; Amoia, P.; Fantacuzzi, M.; Giampietro, L.; Maccallini, C.; Amoroso, R.; Veschi, S.; et al. Synthesis and Cytotoxic Effects on Pancreatic Cancer Cells of Resveratrol Analogs. Med. Chem. Res. 2019, 28, 984–991. [Google Scholar] [CrossRef]
- Di Fermo, P.; Di Lodovico, S.; Amoroso, R.; De Filippis, B.; D’ercole, S.; Di Campli, E.; Cellini, L.; Di Giulio, M. Searching for New Tools to Counteract the Helicobacter Pylori Resistance: The Positive Action of Resveratrol Derivatives. Antibiotics 2020, 9, 891. [Google Scholar] [CrossRef]
- Fantacuzzi, M.; Gallorini, M.; Gambacorta, N.; Ammazzalorso, A.; Aturki, Z.; Balaha, M.; Carradori, S.; Giampietro, L.; Maccallini, C.; Cataldi, A.; et al. Design, Synthesis and Biological Evaluation of Aromatase Inhibitors Based on Sulfonates and Sulfonamides of Resveratrol. Pharmaceuticals 2021, 14, 984. [Google Scholar] [CrossRef]
- Apaydın, S.; Török, M. Sulfonamide Derivatives as Multi-Target Agents for Complex Diseases. Bioorg. Med. Chem. Lett. 2019, 29, 2042–2050. [Google Scholar] [CrossRef]
- Wjpps|ABSTRACT. Available online: https://www.wjpps.com/Wjpps_controller/abstract_id/8719 (accessed on 14 June 2022).
- Kaur, L.; Arora, V.; Arora, P.; Singh, P. A Review: Biological Significance of Sulfonamides. World J. Pharm. Pharm. Sci. 2018, 7, 413–422. [Google Scholar] [CrossRef]
- Zou, M.L.; Teng, Y.Y.; Wu, J.J.; Liu, S.Y.; Tang, X.Y.; Jia, Y.; Chen, Z.H.; Zhang, K.W.; Sun, Z.L.; Li, X.; et al. Fibroblasts: Heterogeneous Cells With Potential in Regenerative Therapy for Scarless Wound Healing. Front. Cell Dev. Biol. 2021, 9, 713605. [Google Scholar] [CrossRef] [PubMed]
- Walle, T. Bioavailability of Resveratrol. Ann. N. Y. Acad. Sci. 2011, 1215, 9–15. [Google Scholar] [CrossRef] [PubMed]
- Robinson, K.; Mock, C.; Liang, D. Pre-Formulation Studies of Resveratrol. Drug Dev. Ind. Pharm. 2015, 41, 1464–1469. [Google Scholar] [CrossRef] [PubMed]
- Franciosoa, A.; Mastromarino, P.; Masci, A.; d’Erme, M.; Mosca, L. Chemistry, Stability and Bioavailability of Resveratrol. Med. Chem. 2014, 10, 237–245. [Google Scholar] [CrossRef]
- Li, L.; Li, J.; Wang, Y.; Liu, X.; Li, S.; Wu, Y.; Tang, W.; Qiu, Y. Resveratrol Prevents Inflammation and Oxidative Stress Response in LPS-Induced Human Gingival Fibroblasts by Targeting the PI3K/AKT and Wnt/β-Catenin Signaling Pathways. Genet. Mol. Biol. 2021, 44, e20200349. [Google Scholar] [CrossRef]
- Galiniak, S.; Aebisher, D.; Bartusik-Aebisher, D. Health Benefits of Resveratrol Administration. Acta Biochim. Pol. 2019, 66, 13–21. [Google Scholar] [CrossRef]
- Politis, C.; Schoenaers, J.; Jacobs, R.; Agbaje, J.O. Wound Healing Problems in the Mouth. Front. Physiol. 2016, 7, 507. [Google Scholar] [CrossRef] [PubMed]
- Ahangar, P.; Mills, S.J.; Smith, L.E.; Gronthos, S.; Cowin, A.J. Human Gingival Fibroblast Secretome Accelerates Wound Healing through Anti-Inflammatory and pro-Angiogenic Mechanisms. NPJ Regen. Med. 2020, 5, 24. [Google Scholar] [CrossRef]
- Yang, S.; Lyu, X.; Zhang, J.; Shui, Y.; Yang, R.; Xu, X. The Application of Small Molecules to the Control of Typical Species Associated With Oral Infectious Diseases. Front. Cell. Infect. Microbiol. 2022, 12, 135. [Google Scholar] [CrossRef] [PubMed]
- Birkett, D.J. Pharmacokinetics Made Easy 10 Pharmacodynamics—The Concentration-Effect Relationship. Aust. Prescr. 1995, 18, 102–104. [Google Scholar] [CrossRef]
- Birar, V.C.; Sheerin, A.N.; Ostler, E.L.; Faragher, R.G.A. Novel Resveratrol Derivatives Have Diverse Effects on the Survival, Proliferation and Senescence of Primary Human Fibroblasts. Biogerontology 2020, 21, 817–826. [Google Scholar] [CrossRef]
- Schmidt, M.; Gutknecht, D.; Simon, J.C.; Schulz, J.N.; Eckes, B.; Anderegg, U.; Saalbach, A. Controlling the Balance of Fibroblast Proliferation and Differentiation: Impact of Thy-1. J. Investig. Dermatol. 2015, 135, 1893–1902. [Google Scholar] [CrossRef]
- Kaleci, B.; Koyuturk, M. Efficacy of Resveratrol in the Wound Healing Process by Reducing Oxidative Stress and Promoting Fibroblast Cell Proliferation and Migration. Dermatol. Ther. 2020, 33, e14357. [Google Scholar] [CrossRef]
- Borsani, E.; Bonazza, V.; Buffoli, B.; Nocini, P.F.; Albanese, M.; Zotti, F.; Inchingolo, F.; Rezzani, R.; Rodella, L.F. Beneficial Effects of Concentrated Growth Factors and Resveratrol on Human Osteoblasts In Vitro Treated with Bisphosphonates. Biomed Res. Int. 2018, 2018, 4597321. [Google Scholar] [CrossRef]
- Moon, D.K.; Kim, B.G.; Lee, A.R.; In Choe, Y.; Khan, I.; Moon, K.M.; Jeon, R.H.; Byun, J.H.; Hwang, S.C.; Woo, D.K. Resveratrol Can Enhance Osteogenic Differentiation and Mitochondrial Biogenesis from Human Periosteum-Derived Mesenchymal Stem Cells. J. Orthop. Surg. Res. 2020, 15, 203. [Google Scholar] [CrossRef] [PubMed]
- Gordish, K.L.; Beierwaltes, W.H. Resveratrol Induces Acute Endothelium-Dependent Renal Vasodilation Mediated through Nitric Oxide and Reactive Oxygen Species Scavenging. Am. J. Physiol. Renal. Physiol. 2014, 306, F542–F550. [Google Scholar] [CrossRef]
- Wallerath, T.; Deckert, G.; Ternes, T.; Anderson, H.; Li, H.; Witte, K.; Förstermann, U. Resveratrol, a Polyphenolic Phytoalexin Present in Red Wine, Enhances Expression and Activity of Endothelial Nitric Oxide Synthase. Circulation 2002, 106, 1652–1658. [Google Scholar] [CrossRef]
- Connor, N.S.; Aubin, J.E.; Sodek, J. Independent Expression of Type I Collagen and Fibronectin by Normal Fibroblast-like Cells. J. Cell Sci. 1983, 63, 233–244. [Google Scholar] [CrossRef]
- Sheu, S.J.; Wu, T.T. Resveratrol Protects against Ultraviolet A-Mediated Inhibition of the Phagocytic Function of Human Retinal Pigment Epithelial Cells via Large-Conductance Calcium-Activated Potassium Channels. Kaohsiung J. Med. Sci. 2009, 25, 381–388. [Google Scholar] [CrossRef] [PubMed]
- Petrini, M.; Pierfelice, T.V.; D’Amico, E.; Di Pietro, N.; Pandolfi, A.; D’arcangelo, C.; De Angelis, F.; Mandatori, D.; Schiavone, V.; Piattelli, A.; et al. Influence of Nano, Micro, and Macro Topography of Dental Implant Surfaces on Human Gingival Fibroblasts. Int. J. Mol. Sci. 2021, 22, 9871. [Google Scholar] [CrossRef] [PubMed]
- De Angelis, F.; Mandatori, D.; Schiavone, V.; Melito, F.P.; Valentinuzzi, S.; Vadini, M.; di Tomo, P.; Vanini, L.; Pelusi, L.; Pipino, C.; et al. Cytotoxic and Genotoxic Effects of Composite Resins on Cultured Human Gingival Fibroblasts. Materials 2021, 14, 5225. [Google Scholar] [CrossRef] [PubMed]
- Di Tomo, P.; Alessio, N.; Falone, S.; Pietrangelo, L.; Lanuti, P.; Cordone, V.; Santini, S.J.; Di Pietrantonio, N.; Marchisio, M.; Protasi, F.; et al. Endothelial Cells from Umbilical Cord of Women Affected by Gestational Diabetes: A Suitable in Vitro Model to Study Mechanisms of Early Vascular Senescence in Diabetes. FASEB J. 2021, 35, e21662. [Google Scholar] [CrossRef]
- Pierfelice, T.V.; D’Amico, E.; Iezzi, G.; Piattelli, A.; Di Pietro, N.; D’arcangelo, C.; Comuzzi, L.; Petrini, M. Nanoporous Titanium Enriched with Calcium and Phosphorus Promotes Human Oral Osteoblast Bioactivity. Int. J. Environ. Res. Public Health 2022, 19, 6212. [Google Scholar] [CrossRef]
- Sozio, P.; Marinelli, L.; Cacciatore, I.; Fontana, A.; Türkez, H.; Giorgioni, G.; Ambrosini, D.; Barbato, F.; Grumetto, L.; Pacella, S.; et al. New Flurbiprofen Derivatives: Synthesis, Membrane Affinity and Evaluation of in Vitro Effect on β-Amyloid Levels. Molecules 2013, 18, 10747–10767. [Google Scholar] [CrossRef]
- Sozio, P.; Fiorito, J.; Di Giacomo, V.; Di Stefano, A.; Marinelli, L.; Cacciatore, I.; Cataldi, A.; Pacella, S.; Turkez, H.; Parenti, C.; et al. Haloperidol Metabolite II Prodrug: Asymmetric Synthesis and Biological Evaluation on Rat C6 Glioma Cells. Eur. J. Med. Chem. 2015, 90, 1–9. [Google Scholar] [CrossRef]
- Cacciatore, I.; Fornasari, E.; Di Stefano, A.; Marinelli, L.; Cerasa, L.S.; Turkez, H.; Aydin, E.; Moretto, A.; Ferrone, A.; Pesce, M.; et al. Development of Glycine-α-Methyl-Proline-Containing Tripeptides with Neuroprotective Properties. Eur. J. Med. Chem. 2016, 108, 553–563. [Google Scholar] [CrossRef]


| (A) | |||||
| 1d | 1h | ||||
| Water solubility a | - | - | |||
| LogP a | 2.91 (±0.22) | 2.35 (±0.31) | |||
| (B) | |||||
| 1d | 1h | ||||
| t ½ (h) | Kobs (h−1) | t ½ (h) | Kobs (h−1) | ||
| Chemical hydrolysis b | pH 7.0 | 13.9 | 0.050 (±0.004) | 23.4 | 0.030 (±0.001) |
| Enzymatic hydrolysis b | Human plasma | 49.5 | 0.014 (±0.005) | 51.7 | 0.013 (±0.003) |
| Gene | Forward Primer (5′-3′) | Reverse Primer (5′-3′) |
|---|---|---|
| eNOS | CACATGTTTGTCTGCGG | GAGGGGCCTTCCAGATTAAG |
| FN1 | AATGTTGGTGAATCGCAGGT | GGAAAGTGTCCCTATCTCTG |
| COL1α1 | AGTCAGAGTGAGGACAGTGAATTG | CACATCACACCAGGAAGTGC |
| OCN | TCAGCCAACTCGTCACAGTC | GGCGCTACCTGTATCAATGG |
| ALP | AATGAGTGAGTGACCATCCTGG | GCACCCCAAGACCTGCTTTAT |
| GAPDH | GGAGGGATCTCGCATTTCTT | ACGGGAAGCTTGTCATCAAT |
| βACT | CCAGAGGCGTACAGGGATAG | GAGAAGATGACCCAGGACTCTC |
Disclaimer/Publisher’s Note: The statements, opinions and data contained in all publications are solely those of the individual author(s) and contributor(s) and not of MDPI and/or the editor(s). MDPI and/or the editor(s) disclaim responsibility for any injury to people or property resulting from any ideas, methods, instructions or products referred to in the content. |
© 2023 by the authors. Licensee MDPI, Basel, Switzerland. This article is an open access article distributed under the terms and conditions of the Creative Commons Attribution (CC BY) license (https://creativecommons.org/licenses/by/4.0/).
Share and Cite
D’Amico, E.; Pierfelice, T.V.; Amoroso, R.; Cacciatore, I.; D’Arcangelo, C.; Lepore, S.; D’Ercole, S.; Di Pietro, N.; Di Rienzo, A.; Petrini, M.; et al. Emerging Effects of Resveratrol Derivatives in Cells Involved in Oral Wound Healing: A Preliminary Study. Int. J. Mol. Sci. 2023, 24, 3276. https://doi.org/10.3390/ijms24043276
D’Amico E, Pierfelice TV, Amoroso R, Cacciatore I, D’Arcangelo C, Lepore S, D’Ercole S, Di Pietro N, Di Rienzo A, Petrini M, et al. Emerging Effects of Resveratrol Derivatives in Cells Involved in Oral Wound Healing: A Preliminary Study. International Journal of Molecular Sciences. 2023; 24(4):3276. https://doi.org/10.3390/ijms24043276
Chicago/Turabian StyleD’Amico, Emira, Tania Vanessa Pierfelice, Rosa Amoroso, Ivana Cacciatore, Camillo D’Arcangelo, Stefania Lepore, Simonetta D’Ercole, Natalia Di Pietro, Annalisa Di Rienzo, Morena Petrini, and et al. 2023. "Emerging Effects of Resveratrol Derivatives in Cells Involved in Oral Wound Healing: A Preliminary Study" International Journal of Molecular Sciences 24, no. 4: 3276. https://doi.org/10.3390/ijms24043276
APA StyleD’Amico, E., Pierfelice, T. V., Amoroso, R., Cacciatore, I., D’Arcangelo, C., Lepore, S., D’Ercole, S., Di Pietro, N., Di Rienzo, A., Petrini, M., Piattelli, A., Ricci, A., Zara, S., Di Stefano, A., Iezzi, G., & De Filippis, B. (2023). Emerging Effects of Resveratrol Derivatives in Cells Involved in Oral Wound Healing: A Preliminary Study. International Journal of Molecular Sciences, 24(4), 3276. https://doi.org/10.3390/ijms24043276