Article

Syndecan-4 Mediates the Cellular Entry of Adeno-Associated Virus 9

1
Pharmacoidea Ltd., H-6726 Szeged, Hungary
2
Department of Neuroscience, Sheffield Institute for Translational Neuroscience (SITraN), University of Sheffield, Sheffield S10 2HQ, UK
3
Biological Research Centre, Institute of Plant Biology, H-6726 Szeged, Hungary
4
Albert Szent-Györgyi Clinical Center, Department of Medicine, Faculty of Medicine, University of Szeged, H-6726 Szeged, Hungary
5
Szilák Laboratories Ltd., H-6725 Szeged, Hungary
*
Author to whom correspondence should be addressed.
These authors contributed equally to this work.
Int. J. Mol. Sci. 2023, 24(4), 3141; https://doi.org/10.3390/ijms24043141
Submission received: 7 January 2023 / Revised: 1 February 2023 / Accepted: 3 February 2023 / Published: 5 February 2023
(This article belongs to the Special Issue Development of AAV-Based Gene Therapies: Unmet Needs and Solutions)

Abstract

:
Due to their low pathogenicity, immunogenicity, and long-term gene expression, adeno-associated virus (AAV) vectors emerged as safe and efficient gene delivery tools, over-coming setbacks experienced with other viral gene delivery systems in early gene therapy trials. Among AAVs, AAV9 can translocate through the blood-brain barrier (BBB), making it a promising gene delivery tool for transducing the central nervous system (CNS) via systemic administration. Recent reports on the shortcomings of AAV9-mediated gene delivery into the CNS require reviewing the molecular base of AAV9 cellular biology. A more detailed understanding of AAV9’s cellular entry would eradicate current hurdles and enable more efficient AAV9-based gene therapy approaches. Syndecans, the transmembrane family of heparan-sulfate proteoglycans, facilitate the cellular uptake of various viruses and drug delivery systems. Utilizing human cell lines and syndecan-specific cellular assays, we assessed the involvement of syndecans in AAV9’s cellular entry. The ubiquitously expressed isoform, syndecan-4 proved its superiority in facilitating AAV9 internalization among syndecans. Introducing syndecan-4 into poorly transducible cell lines enabled robust AAV9-dependent gene transduction, while its knockdown reduced AAV9’s cellular entry. Attachment of AAV9 to syndecan-4 is mediated not just by the polyanionic heparan-sulfate chains but also by the cell-binding domain of the extracellular syndecan-4 core protein. Co-immunoprecipitation assays and affinity proteomics also confirmed the role of syndecan-4 in the cellular entry of AAV9. Overall, our findings highlight the universally expressed syndecan-4 as a significant contributor to the cellular internalization of AAV9 and provide a molecular-based, rational explanation for the low gene delivery potential of AAV9 into the CNS.

1. Introduction

The advancement of gene therapy is revolutionizing medicine [1,2,3,4,5]. The efficacy of gene therapy approaches relies on the targeted and efficient delivery of functional genes into cells with flawed endogenous genes [6]. Due to their low pathogenicity, immunogenicity and long-term gene expression, adeno-associated virus (AAV) vectors emerged as a safe and efficient tool for gene delivery, hence overcoming safety concerns and setbacks experienced with other viral gene delivery systems in the early gene therapy trials [7,8,9]. Exploring key aspects of AAV biology, including genome configuration and composition, DNA replication and transcription, infectious latency and virion assembly, enabled the efficient cloning and genetic manipulation of the AAV genome, thus making recombinant AAVs (rAAVs) the leading gene delivery platform for clinical gene therapies [10,11,12,13,14,15,16,17,18,19,20,21,22,23,24,25,26,27]. Although rAAV-based gene therapy products have already been approved in the EU and the US, several challenges still exist [10,28,29,30,31].
AAV is a non-pathogenic parvovirus discovered initially as a cell culture contaminant, just like its most frequently utilized serotype, AAV2 [10,32]. The non-enveloped AAV capsid directly mediates many critical host-vector interactions [33]. Until now, more than 100 human and nonhuman primate AAVs have been identified, but only a few, especially those isolated from natural sources, have been applied for human gene transfer [10,33,34]. AAV9, isolated from human liver tissue, can translocate through the blood-brain barrier (BBB), making it a promising gene delivery tool for transducing the central nervous system (CNS) via systemic administration [10,35]. Considering that CNS entry of AAV9 requires a high vector dose, along with the inability of AAV9 to reach all regions of the CNS, there is plenty of room for improving rAAV-based CNS gene delivery [36]. Understanding the molecular mechanism driving AAV9’s CNS entry would enable the development of novel gene delivery systems with enhanced CNS targeting. So far, most identified AAV receptors are glycans [37]. From heparan-sulfate proteoglycans (HSPGs) through sialic acids to terminal galactose moieties, the different AAV serotypes exhibit different carbohydrate specificity [38]. It has been reported that AAV9 binds glycans with terminal galactoses [39,40]. A more recent paper showed that diabetic retinopathy-related retinal changes might improve the transduction efficiency of AAV2 and AAV9 [41]. Enhanced transduction of AAV2 and 9 in diabetic retinopathy is attributed to several overexpressed receptors, such as syndecan-4 (SDC4), glypican-1, and perlecan for AAV2 and 37- and 67-kDa laminin for AAV9. However, the shallow CNS expression of the 37- and 67-kDa laminin receptor contradicts the well-documented preference of AAV9 for adult astrocytes in the CNS [36,42,43,44]. On the other hand, SDC4, the transmembrane proteoglycan overexpressed in diabetic retinopathy, exhibits astrocyte-specific expression in the brain and limited expression in neurons [44,45,46].
Syndecans (SDCs) are a family of evolutionally conserved transmembrane HSPGs sharing a similar structure: a highly conserved, single-pass transmembrane domain and a relatively short cytoplasmic domain [47,48,49,50,51,52]. The more diverse extracellular domain (ectodomain) of SDCs contains glycosaminoglycan (GAG) side chains. SDCs have three GAG attachment sites for HS near the N terminus and may bear chondroitin sulfate (CS) at the juxtamembrane region [49,50,51,52,53]. SDC4 also possesses a cell-binding domain (CBD) mediating cell-to-cell attachment [49,50,51,52]. The versatile GAG chains endow SDCs to interact with many extracellular ligands, including viruses and bacteria [49,50,51,52,54,55,56,57,58]. Besides acting as receptors transmitting extracellular signals into the cell interior, SDCs also facilitate the internalization of their ligands [49,50,51,52,59,60]. SDC isoforms show distinct temporal and spatial expression patterns, thus, are likely to function specifically in vivo [52]. SDC1 is expressed by epithelial and plasma cells, SDC2 by cells of mesenchymal origins (endothelial cells and fibroblasts), SDC3 is enriched in neurons, and SDC4 is more ubiquitous [49,50,51,57,58].
Our research group has been characterizing the involvement of SDCs, a conserved family of transmembrane HSPGs, in gene and protein delivery [49,50,51,52,61]. Throughout the years, we have been establishing several SDC-specific assays and SDC structural mutants to analyze the interaction of SDCs with potential ligands [49,50,51,52,57,58,61]. After discovering the involvement of SDC4 in AAV9 cellular entry in human BBB endothelial cells, we applied our previously established and well-characterized SDC assays to understand the contribution of SDCs to AAV9-mediated gene transduction. Utilizing stable transfectants of the various SDC isoforms enabled us to assess the contribution of SDCs’ to AAV9-mediated gene transfer, while studies with structural mutants exposed the involvement of the SDC ectodomain in the interactions with AAV9. Applying quantitative and qualitative cellular assays to explore SDCs’ influence on AAV9-mediated gene delivery helped us to depict a molecularly well-defined mechanism of AAV9 internalization. Our findings thus provide a rational explanation for the low gene delivery potential of AAV9 into neurons in the CNS.

2. Results

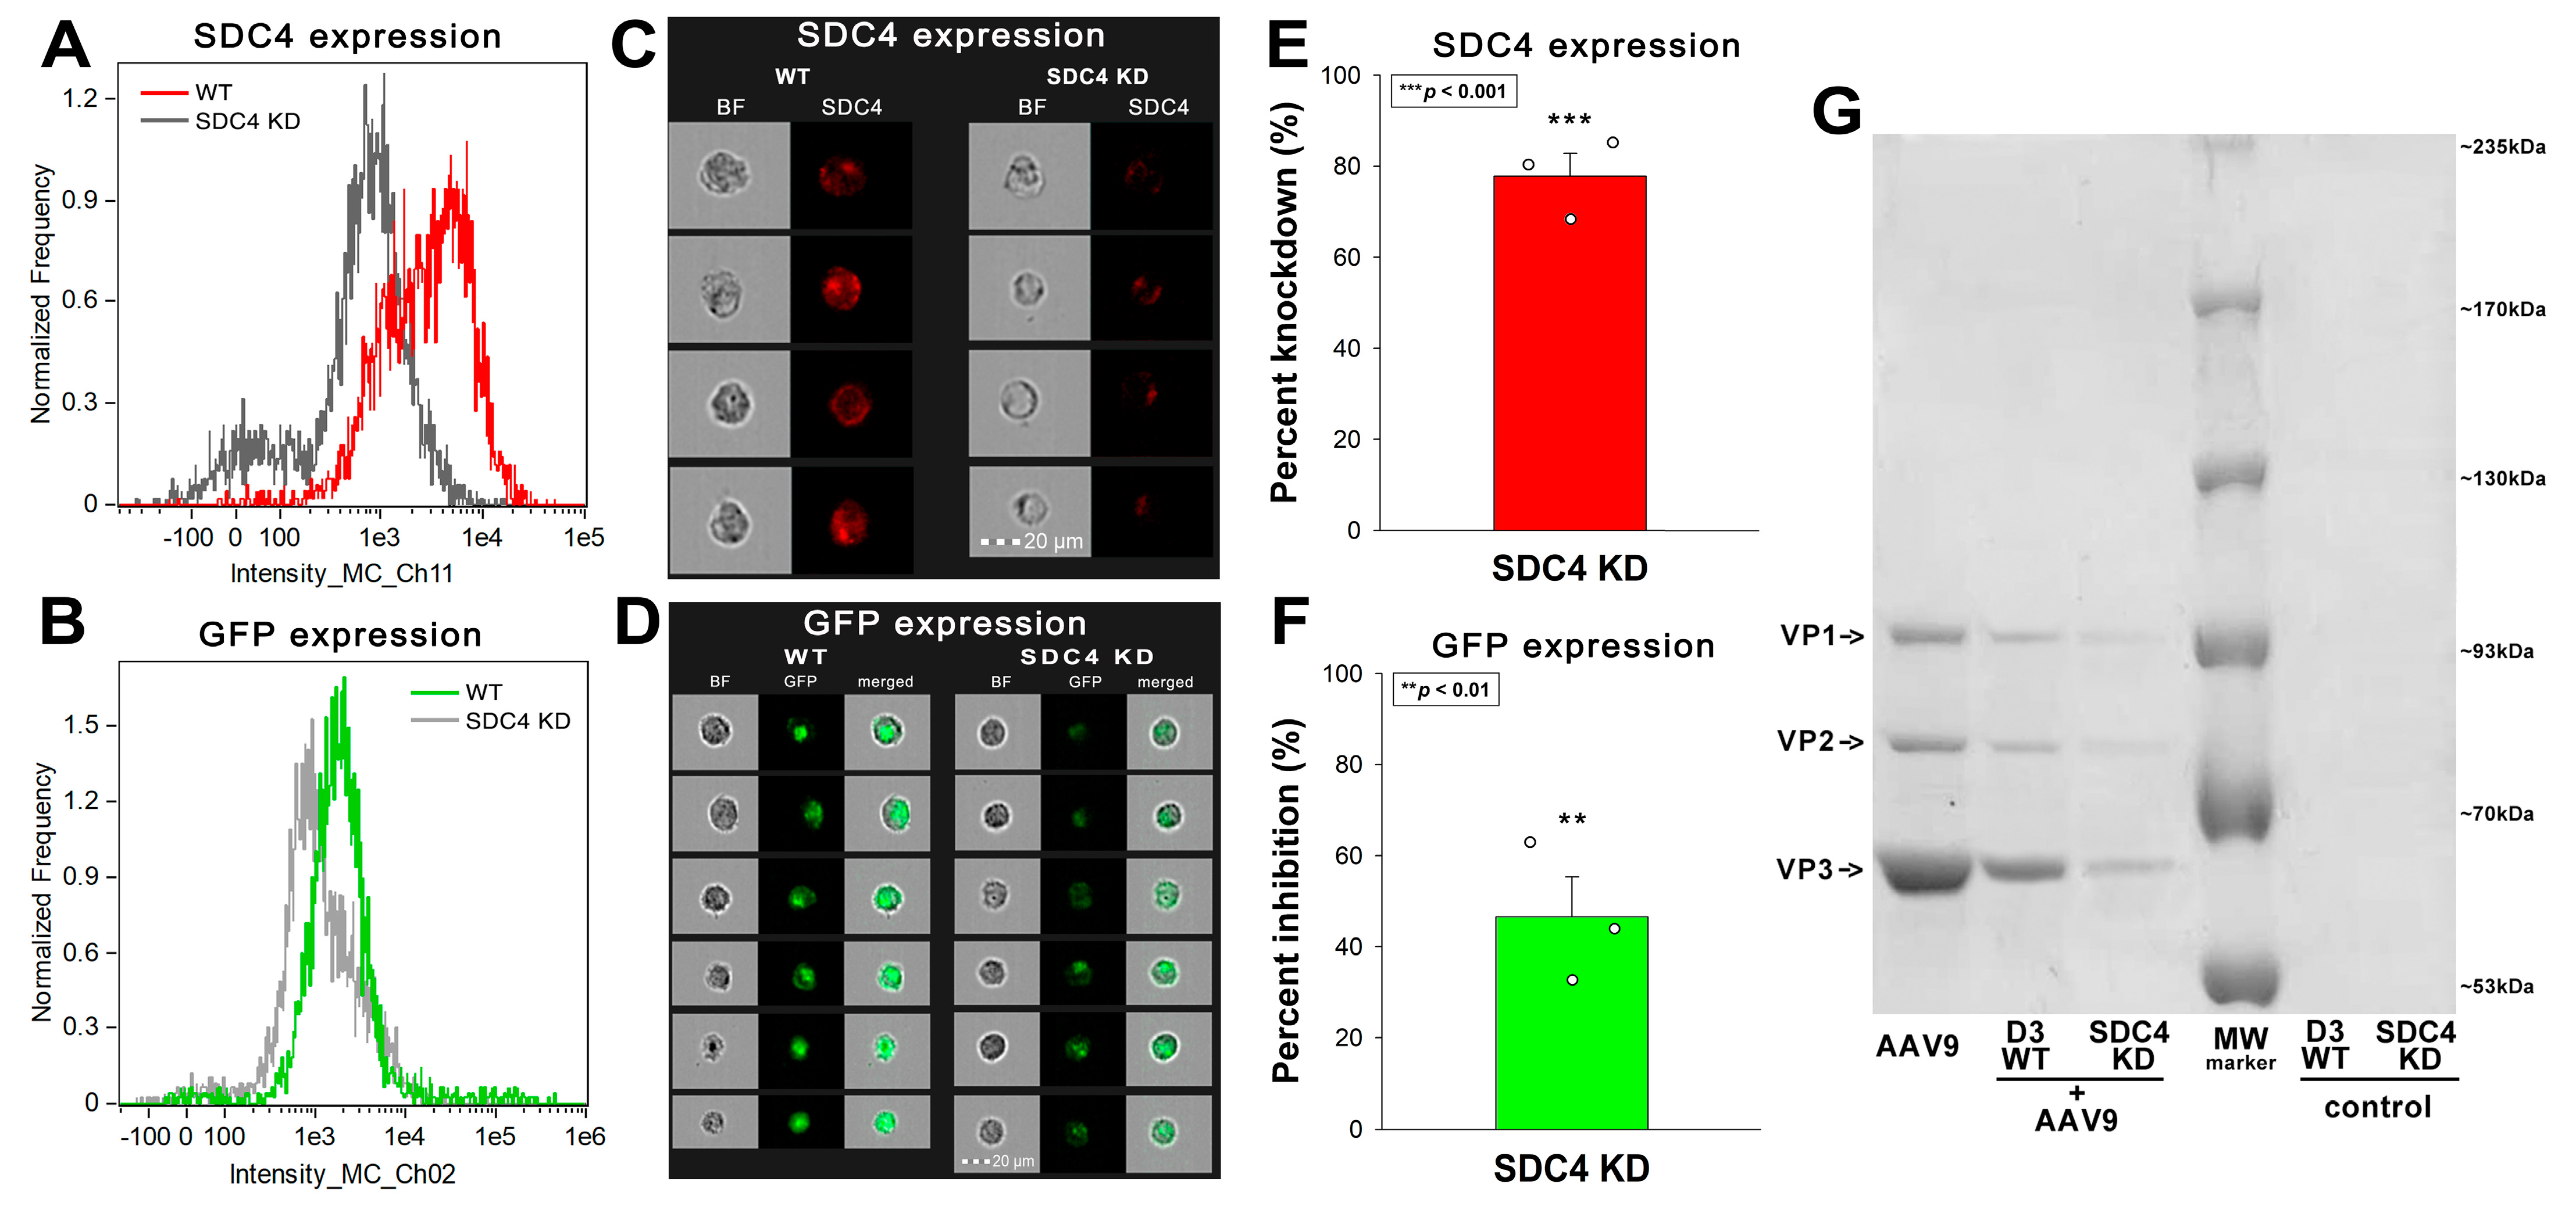
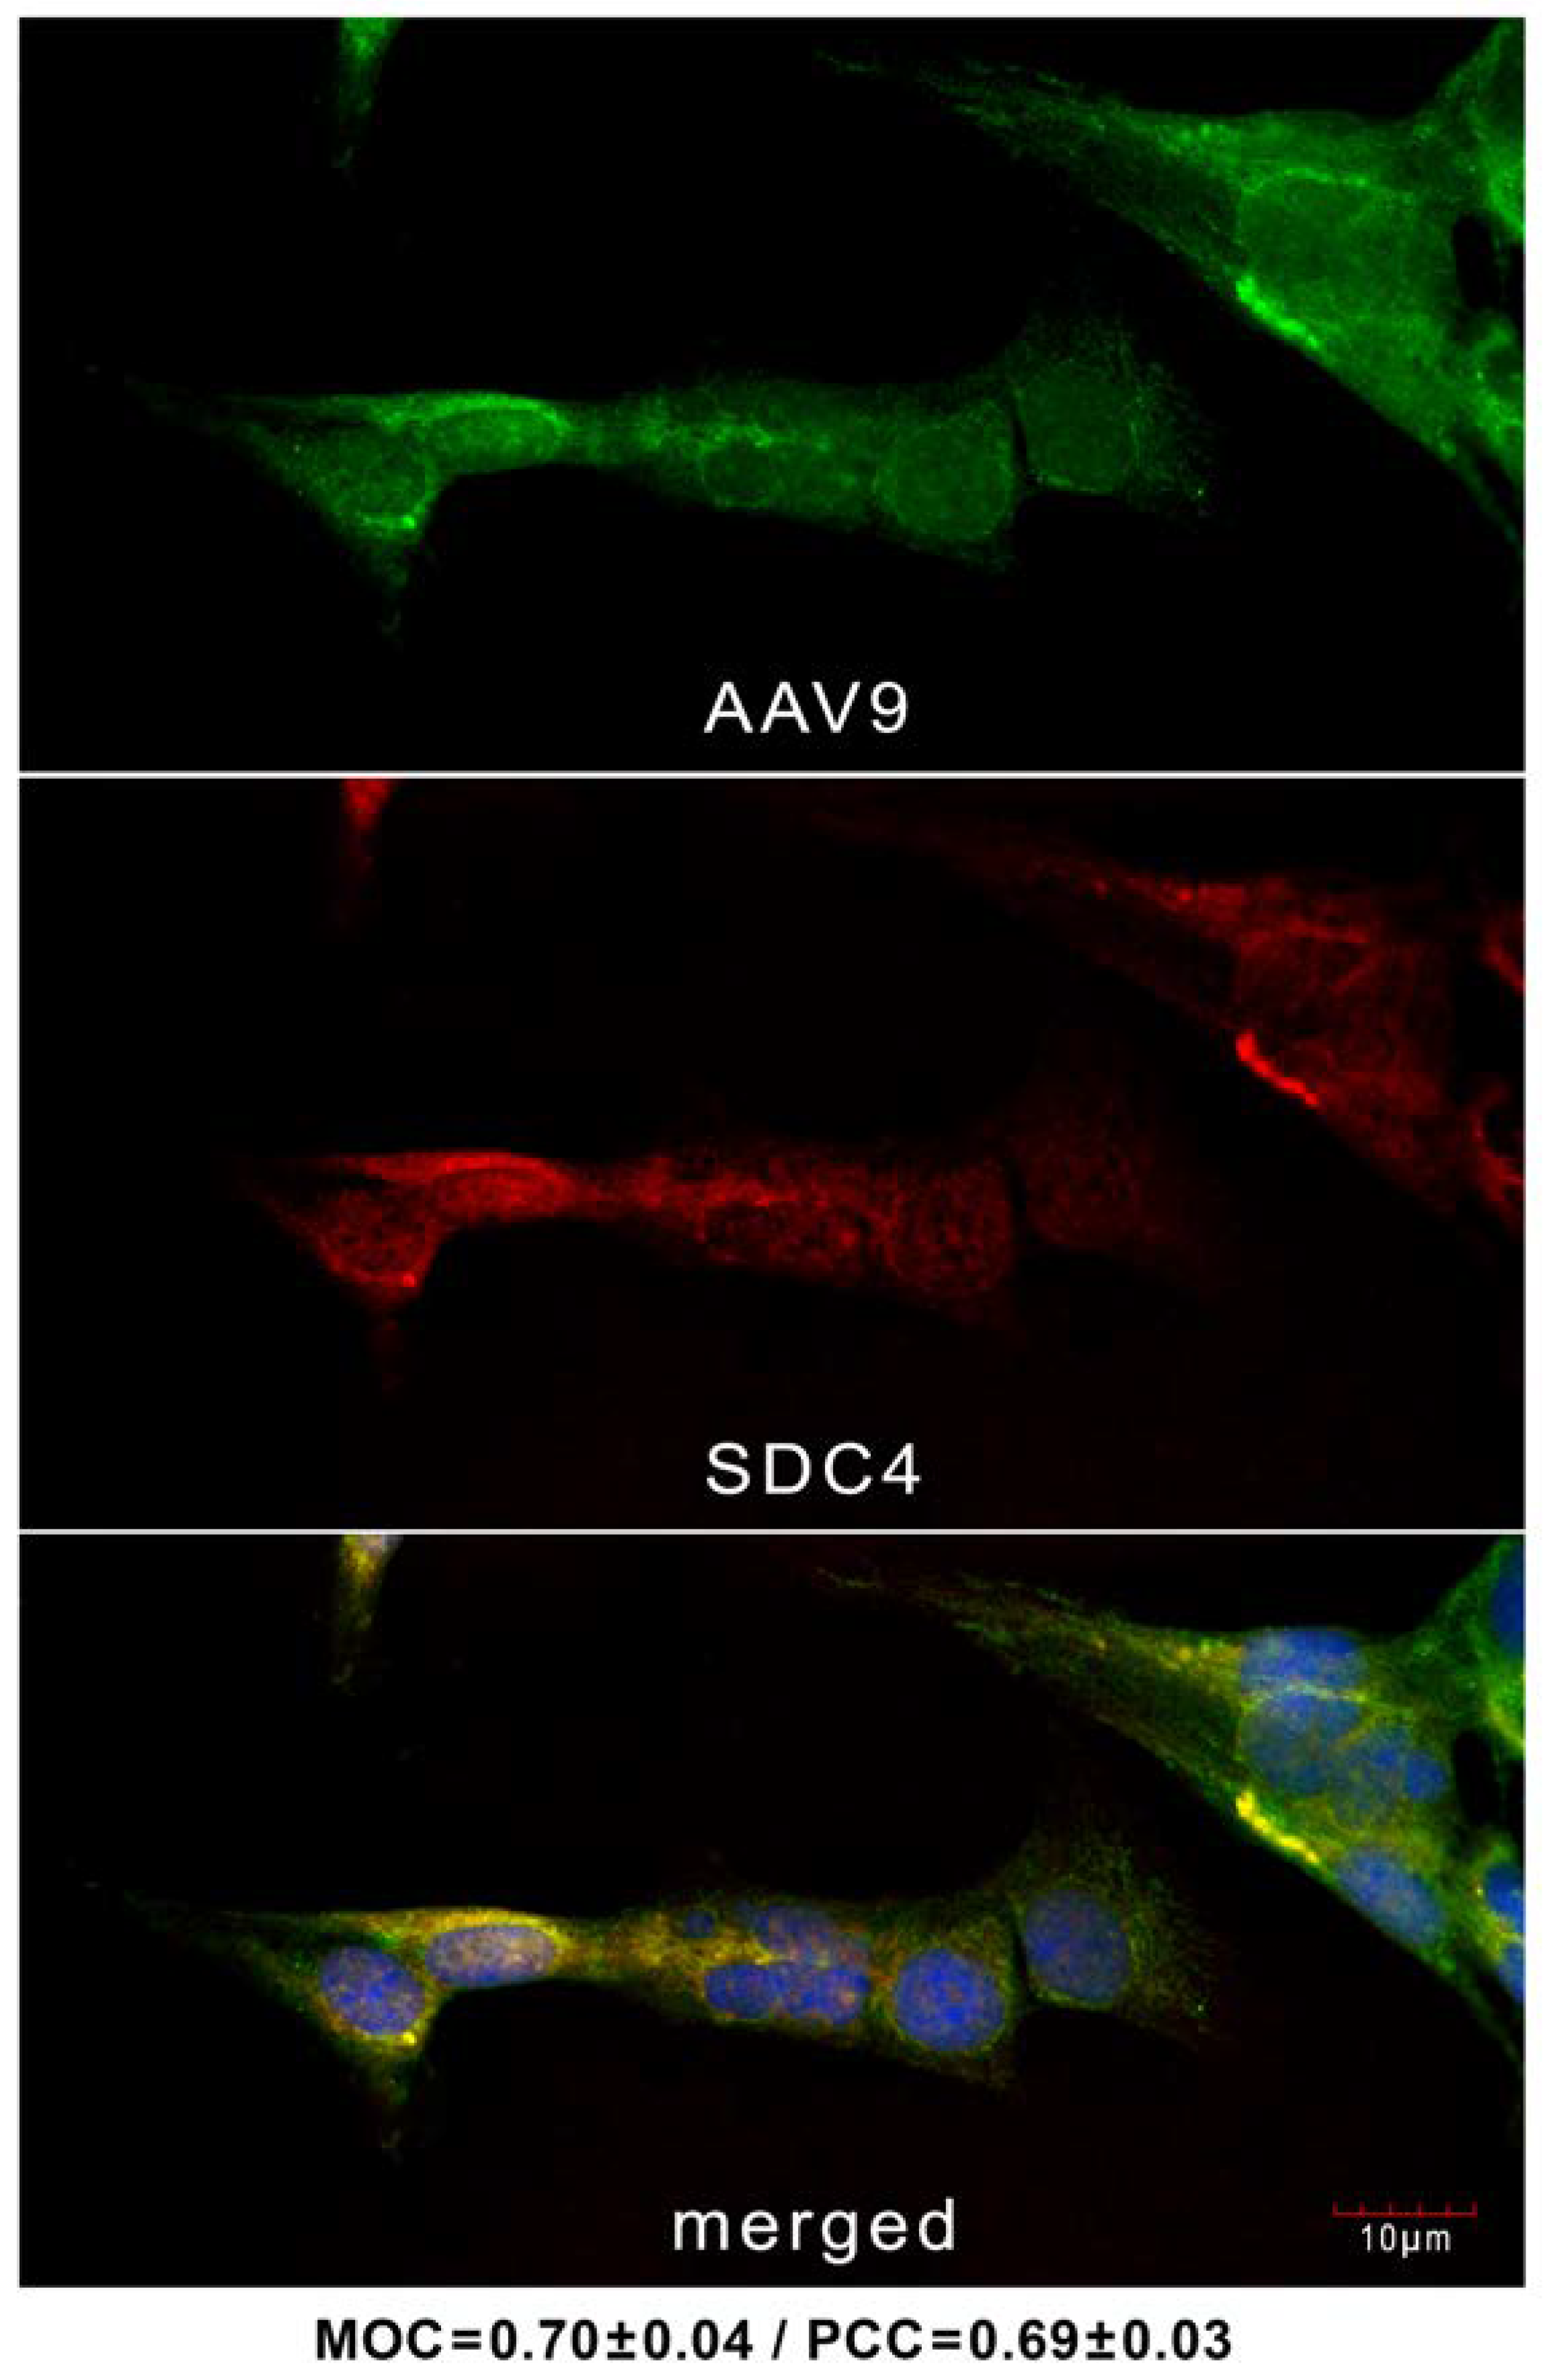
2.1. AAV9 Enters Human BBB Endothelial Cells Attached to SDC4

AAV9 is a frequently utilized tool to transduce genes into the CNS. However, the therapeutic application of AAV9 and the development of novel, CNS-specific AAV serotypes are hindered by the limited knowledge of AAV9 receptors, especially those on the BBB. To explore the potential AAV9 receptors on the BBB, we examined AAV9’s entry into hCMEC/D3 cells, a human BBB model cell line with moderate SDC4 expression [62,63]. Efficient SDC4 knockdown significantly reduced AAV9-mediated gene delivery in AAV9-treated (4 × 10⁴ vg/cell at 37 °C for 72 h) hCMEC/D3 cells. Namely, a ~80% reduction in SDC4 expression resulted in a ~50% decrease in AAV9-mediated GFP transduction (Figure 1A–G and Supplementary Figures S1 and S2). The AAV9 capsid proteins (i.e., VP1-3) could be immunoprecipitated with SDC4 from extracts of hCMEC/D3 cells treated with AAV9 (Figure 1G).
Confocal microscopic studies on hCMEC/D3 cells treated with AAV9 for 6 h revealed the overlap of AAV9 and SDC4 in AAV9-treated hCMEC/D3 cells, as shown by the high values of the Mander’s overlap and Pearson correlation coefficients (MOC and PCC, respectively) in Figure 2, suggesting that AAV9 enters the cells via an SDC4-mediated pathway. Incubating the cells with the AF 488-labeled secondary antibodies resulted in very low green fluorescence, showing that no unspecific binding influenced the colocalization analyses (Supplementary Figure S3).

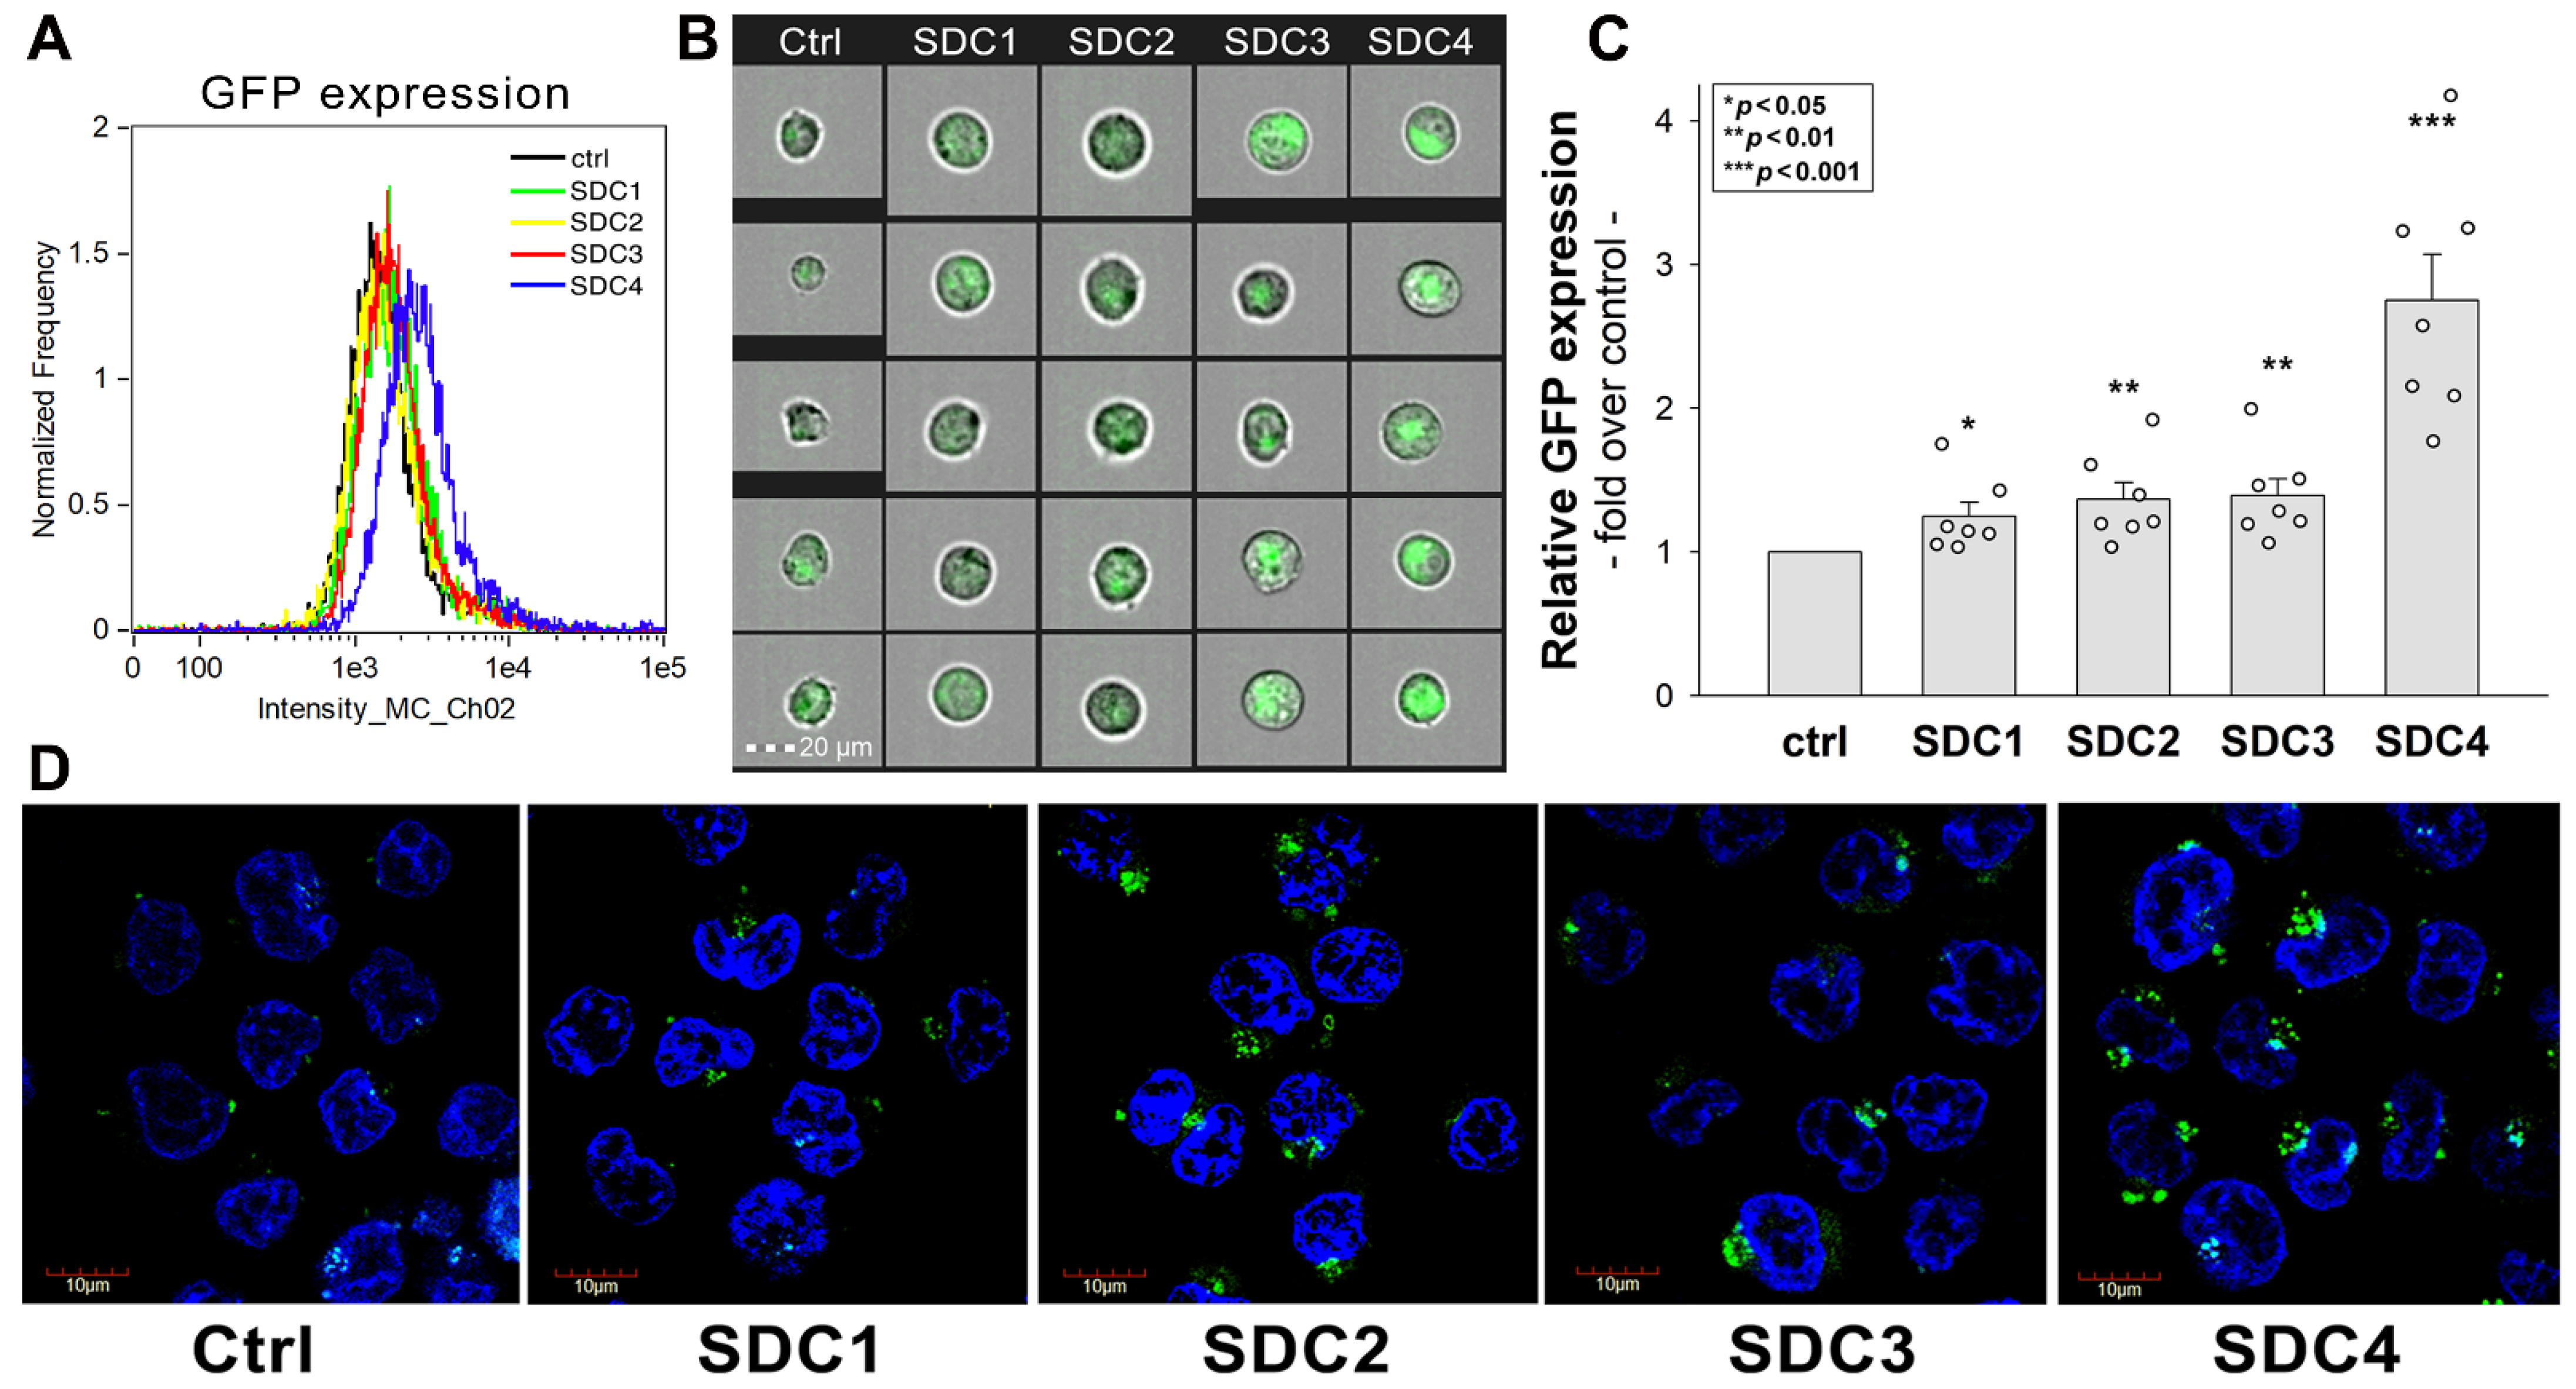
2.2. Contribution of SDCs to AAV9 Transduction

A survey of ex vivo/in vitro transduction efficiency of mammalian cell lines with AAV1-9 showed that none of the AAV serotypes efficiently transduce the human myelogenous leukemia cell line K562 [64]. It is well established that K562 cells lack HSPGs except for minor endogenous betaglycan [65,66]. Due to their very low AAV transducibility and reportedly minimal amount of HSPG expression, K562 cells offer an ideal model to study the effect of SDCs on AAV9-mediated gene delivery [49,50,57,58]. Thus, K562 cells were utilized to create stable SDC transfectants that were standardized according to their HS expression (Supplementary Figure S4) [49,50]. SDC transfectants with a similar level of HS expression were selected and, along with WT K562 cells, transfected with recombinant AAV9 expressing GFP (AAV9-GFP). After 72 h of incubation with AAV9-GFP, GFP expression was examined with imaging flow cytometry and confocal microscopy (Figure 3A–D). Compared to WT K562 cells, overexpression of SDCs resulted in significantly increased AAV9-mediated GFP transduction, as revealed by the significantly higher GFP expression of SDC transfectants (Figure 3A–D). Although SDC1-3 increased AAV9-mediated gene delivery only slightly, the effect of SDC4 overexpression was more profound, increasing AAV9-mediated gene transduction almost threefold (Figure 3A–D). (Here, we have to refer to our previous studies showing that SDC overexpression does not increase the cellular uptake of transferrin, the marker of clathrin-mediated endocytosis [49,50]. These previous studies suggest that SDCs drive an endocytic uptake independent of classical endocytic routes). Co-immunoprecipitation also confirmed that SDCs, especially SDC4, bind AAV9, showing a higher affinity of AAV9 towards SDC4 (Supplementary Figure S6).

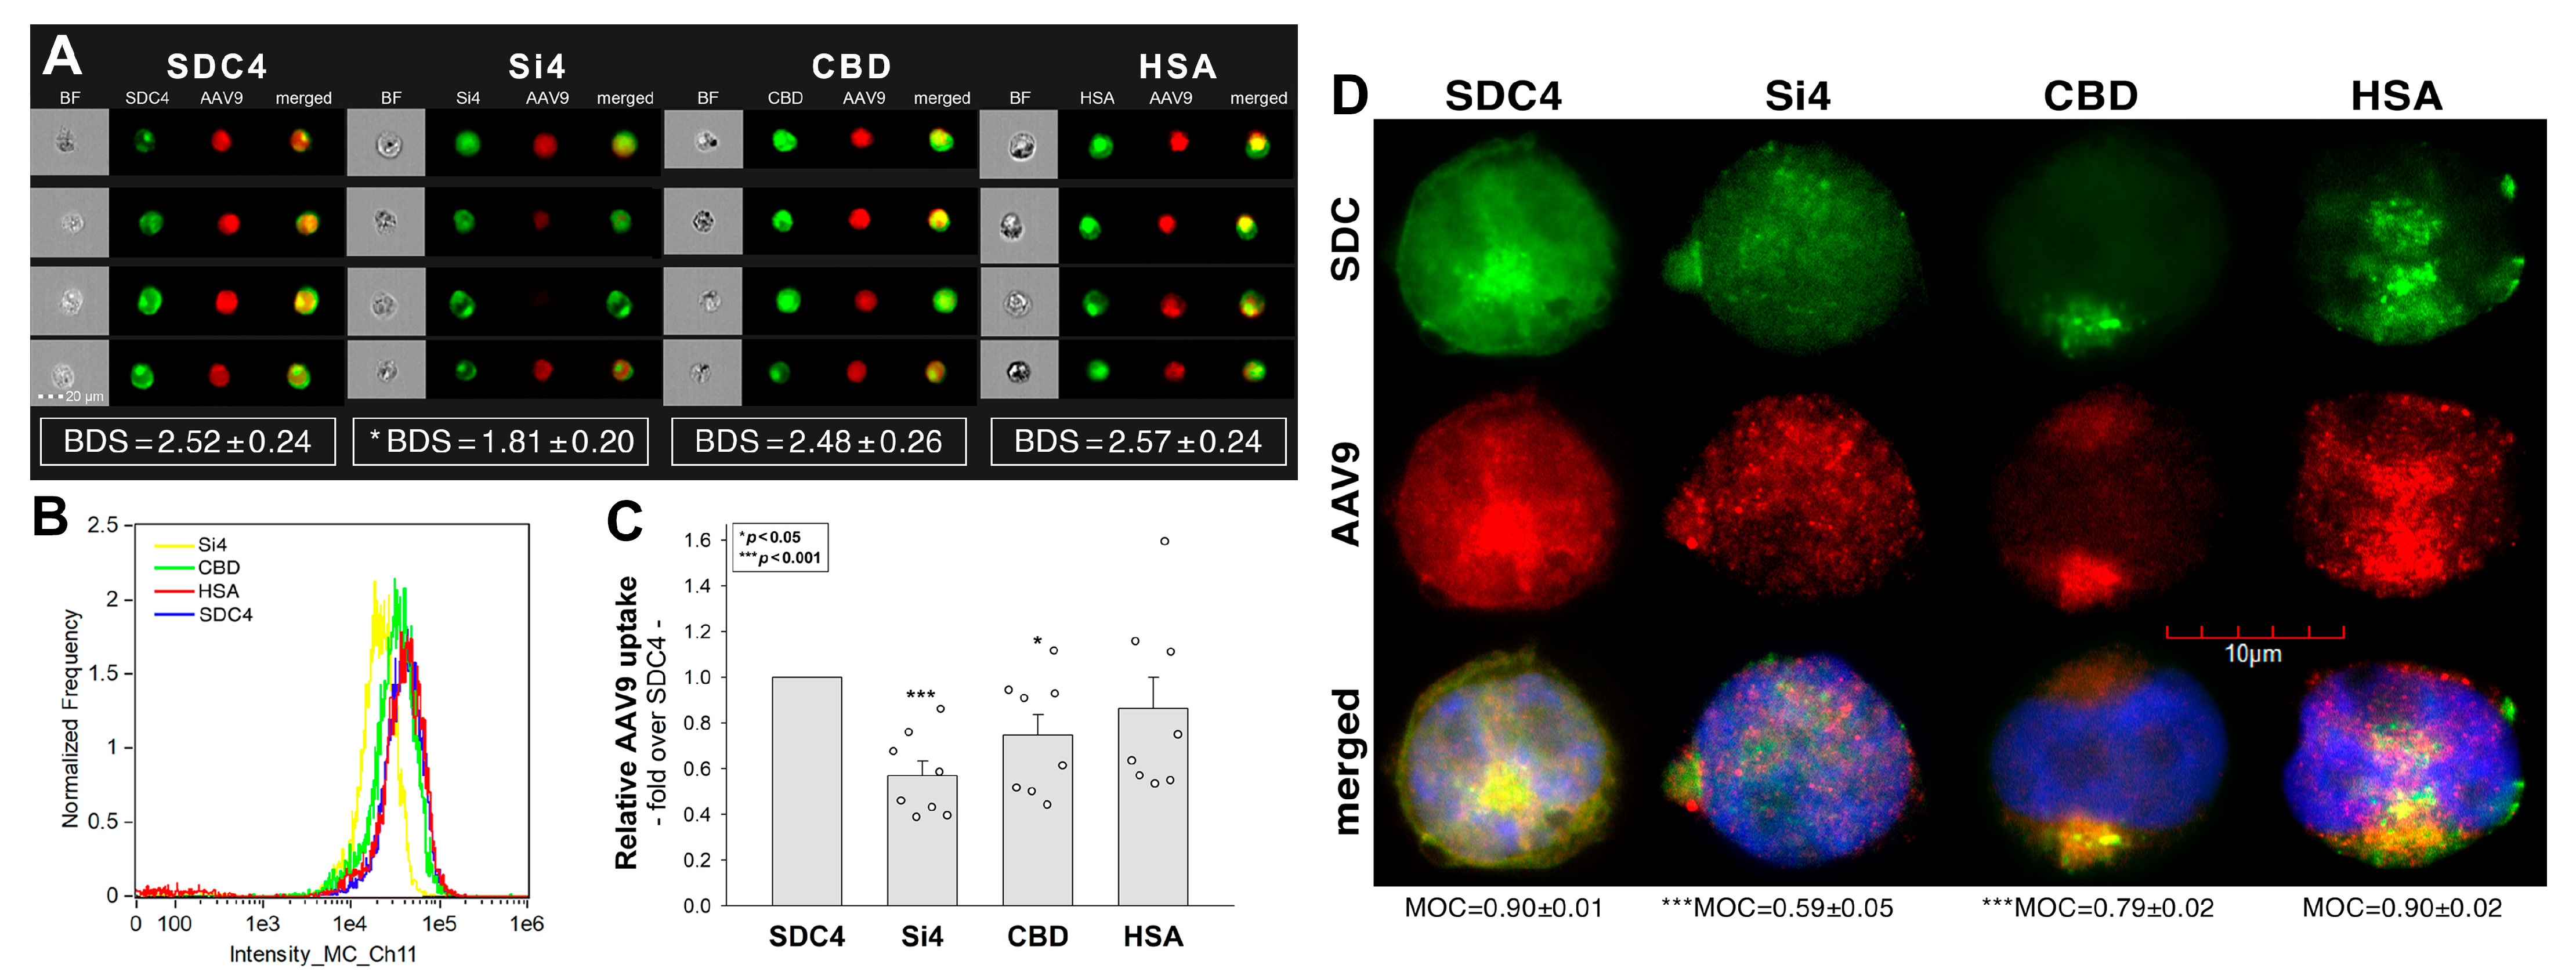
2.3. Contribution of the SDC4 Ectodomain to AAV9 Uptake

Next, we examined the influence of the SDC4 extracellular domain on the interactions with AAV9 by generating various SDC4 deletion mutants (Figure 4A). Si4 is an SDC4 deletion mutant with a truncated ectodomain made of only the signal sequence (Si). The CBD mutant’s extracellular domain is compromised of the signal sequence and the cell-binding domain (CBD) yet lacks the HS attachment site (HSA) and the HS chains (Supplementary Figure S7) [49,50,51,52]. HSA mutants, on the other hand, have an ectodomain made of the HSA and the HS chains but not the CBD [49,50,51,52]. These SDC4 mutants and WT SDC4 were tagged with GFP and expressed in K562 cells (Figure 4A). Clones with an equal extent of SDC expression were then selected with flow cytometry and treated with AAV9. After 90 min of incubation, the AAV9-treated cells were fixed and treated with AAV9-specific and AF 633-labeled secondary antibodies. Cellular fluorescence was then assessed with imaging flow cytometry and confocal microscopy. Based on the detected red (i.e., AF 633) fluorescence intensities, WT SDC4 transfectants internalized AAV9 the most (Figure 4B–D). Deleting both the CBD and the HS chains (i.e., the HSA) exerted a marked reduction in AAV9 uptake as shown by the markedly low fluorescence intensities detected on the Si4 mutants (Figure 4A–D). On the other hand, HS deletion resulted in a much lighter, yet significant, decrease in AAV9 uptake, as demonstrated by the CBD mutants. HSA mutants with an ectodomain made of the HSA and HS chains exhibited an AAV9 uptake efficacy similar to that of SDC4. Colocalization studies also showed a high degree of colocalization between SDC4 and AAV9, as reflected by the high values of bright detail similarity (BDS) and MOC (Figure 4A,D) [67,68]. Deleting both the HSA and the CBD resulted in significantly decreased colocalization. At the same time, deleting either of the CBD or HSA still resulted in high colocalization values (Figure 4A,D), suggesting that both the HS chains and the CBD have essential roles in attaching AAV9. Thus, the CBD can compensate for the loss of HS chains and vice versa.

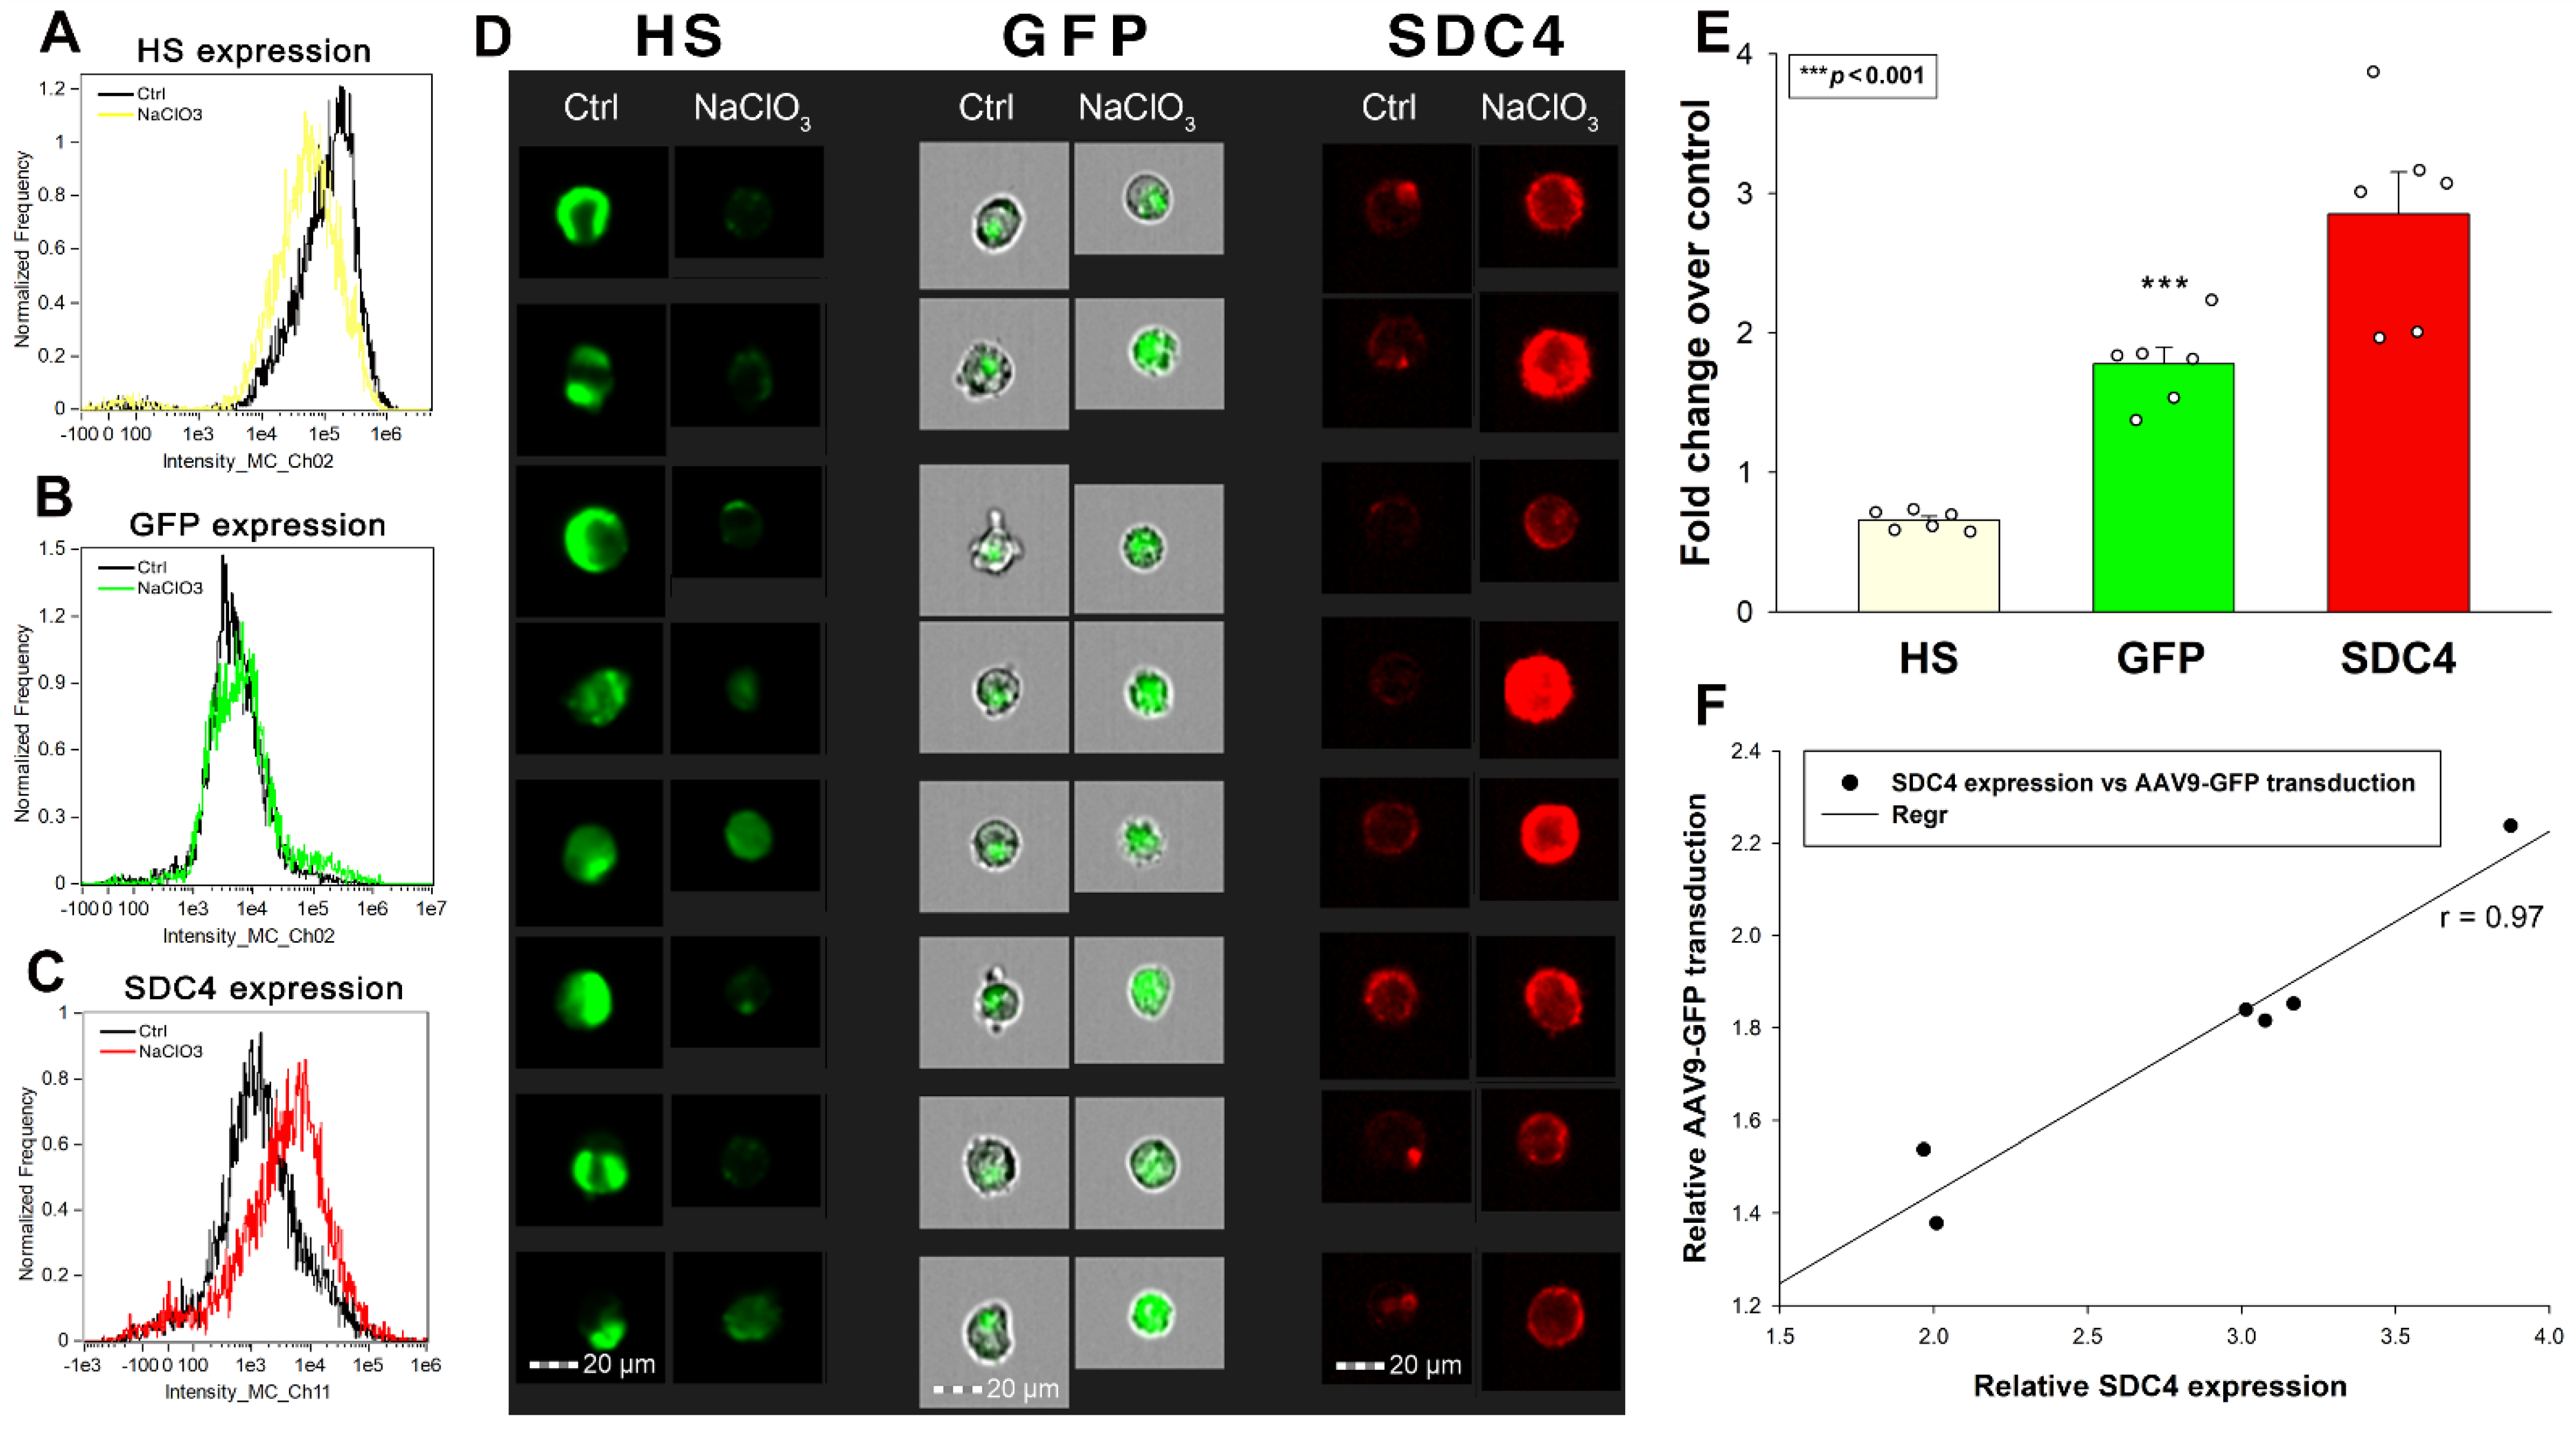
2.4. Effect of Undersulfation on AAV9-Mediated Gene Transduction

The multiple biological activities of HSPGs largely depend on the interactions of their HS chains with various ligands [69]. To further investigate the contribution of SDCs’ HS chains to the interactions with AAV9, we induced undersulfation of SDC4 transfectants with sodium chlorate (NaClO3), an inhibitor of proteoglycan sulfation, and measured its effect on AAV9-mediated gene transduction [70]. Initial studies delivered surprising results: although NaClO3 reduced HS expression, AAV9-mediated GFP expression increased (Figure 5A,B,D,E). Investigating these contradictory results, we found that SDC4 expression also increased (almost tripled) after 48 h of NaClO3 treatment (Figure 5C–E). Thus, SDC4 transfectants compensate for the loss of HS by increasing SDC4 expression. Although the increased SDC4 expression is associated with reduced HS content, AAV9-mediated gene delivery increases due to the high binding of AAV9 to the SDC4 core protein. Thus, SDC4 correlates with AAV9-mediated gene delivery, regardless of the HS content of SDC4 (Figure 5F). Undersulfation with NaClO3, therefore, confirmed previous studies with SDC4 mutants, namely that the SDC4 core protein, including the CBD mediating cell to cell attachment, also takes part in attaching AAV9.

2.5. Affinity Proteomics Exploration of AAV9 Interactome

After demonstrating SDC4’s correlation with AAV9-mediated gene transduction, we examined the AAV9 interactome in SDC4 transfectants created in K562 cells (Table 1). The affinity-based pull-down experiments unraveled a viral entry route that can be characterized by proteins involved in the SDC4 endocytic pathway, including Rab7 (P51149) small GTPase, VAMP8 (Q9BV40), and perilipin-3 (O60664). The virus RNA synthesis is most probably increased by CDC11 (P21127) and CDC12 (J3QSD7) phosphorylating the CTD of RNA Pol. II. The mRNAs, which code the virus proteins, are transported via the TREX-THOC complex (THO-1 (Q96FV9), -2 (Q8NI27), -4 (Q86V81)) from the nucleus. The virus particle secreted by sec23A (Q15436) is a part of COPII complex, perilipin-3 (O60664), Rab1b (Q9H0U4), and Rab11 (P62491) pathway. Rab1b was also reported in the secretion of HCV [71]. AAV9 can also bind to the desmosomes, as desmoplakin (P15924) and desmoglein (Q02413) were pulled down along with the cytokeratins Keratin type I (Q7Z3Y8) and II (F8VV57).

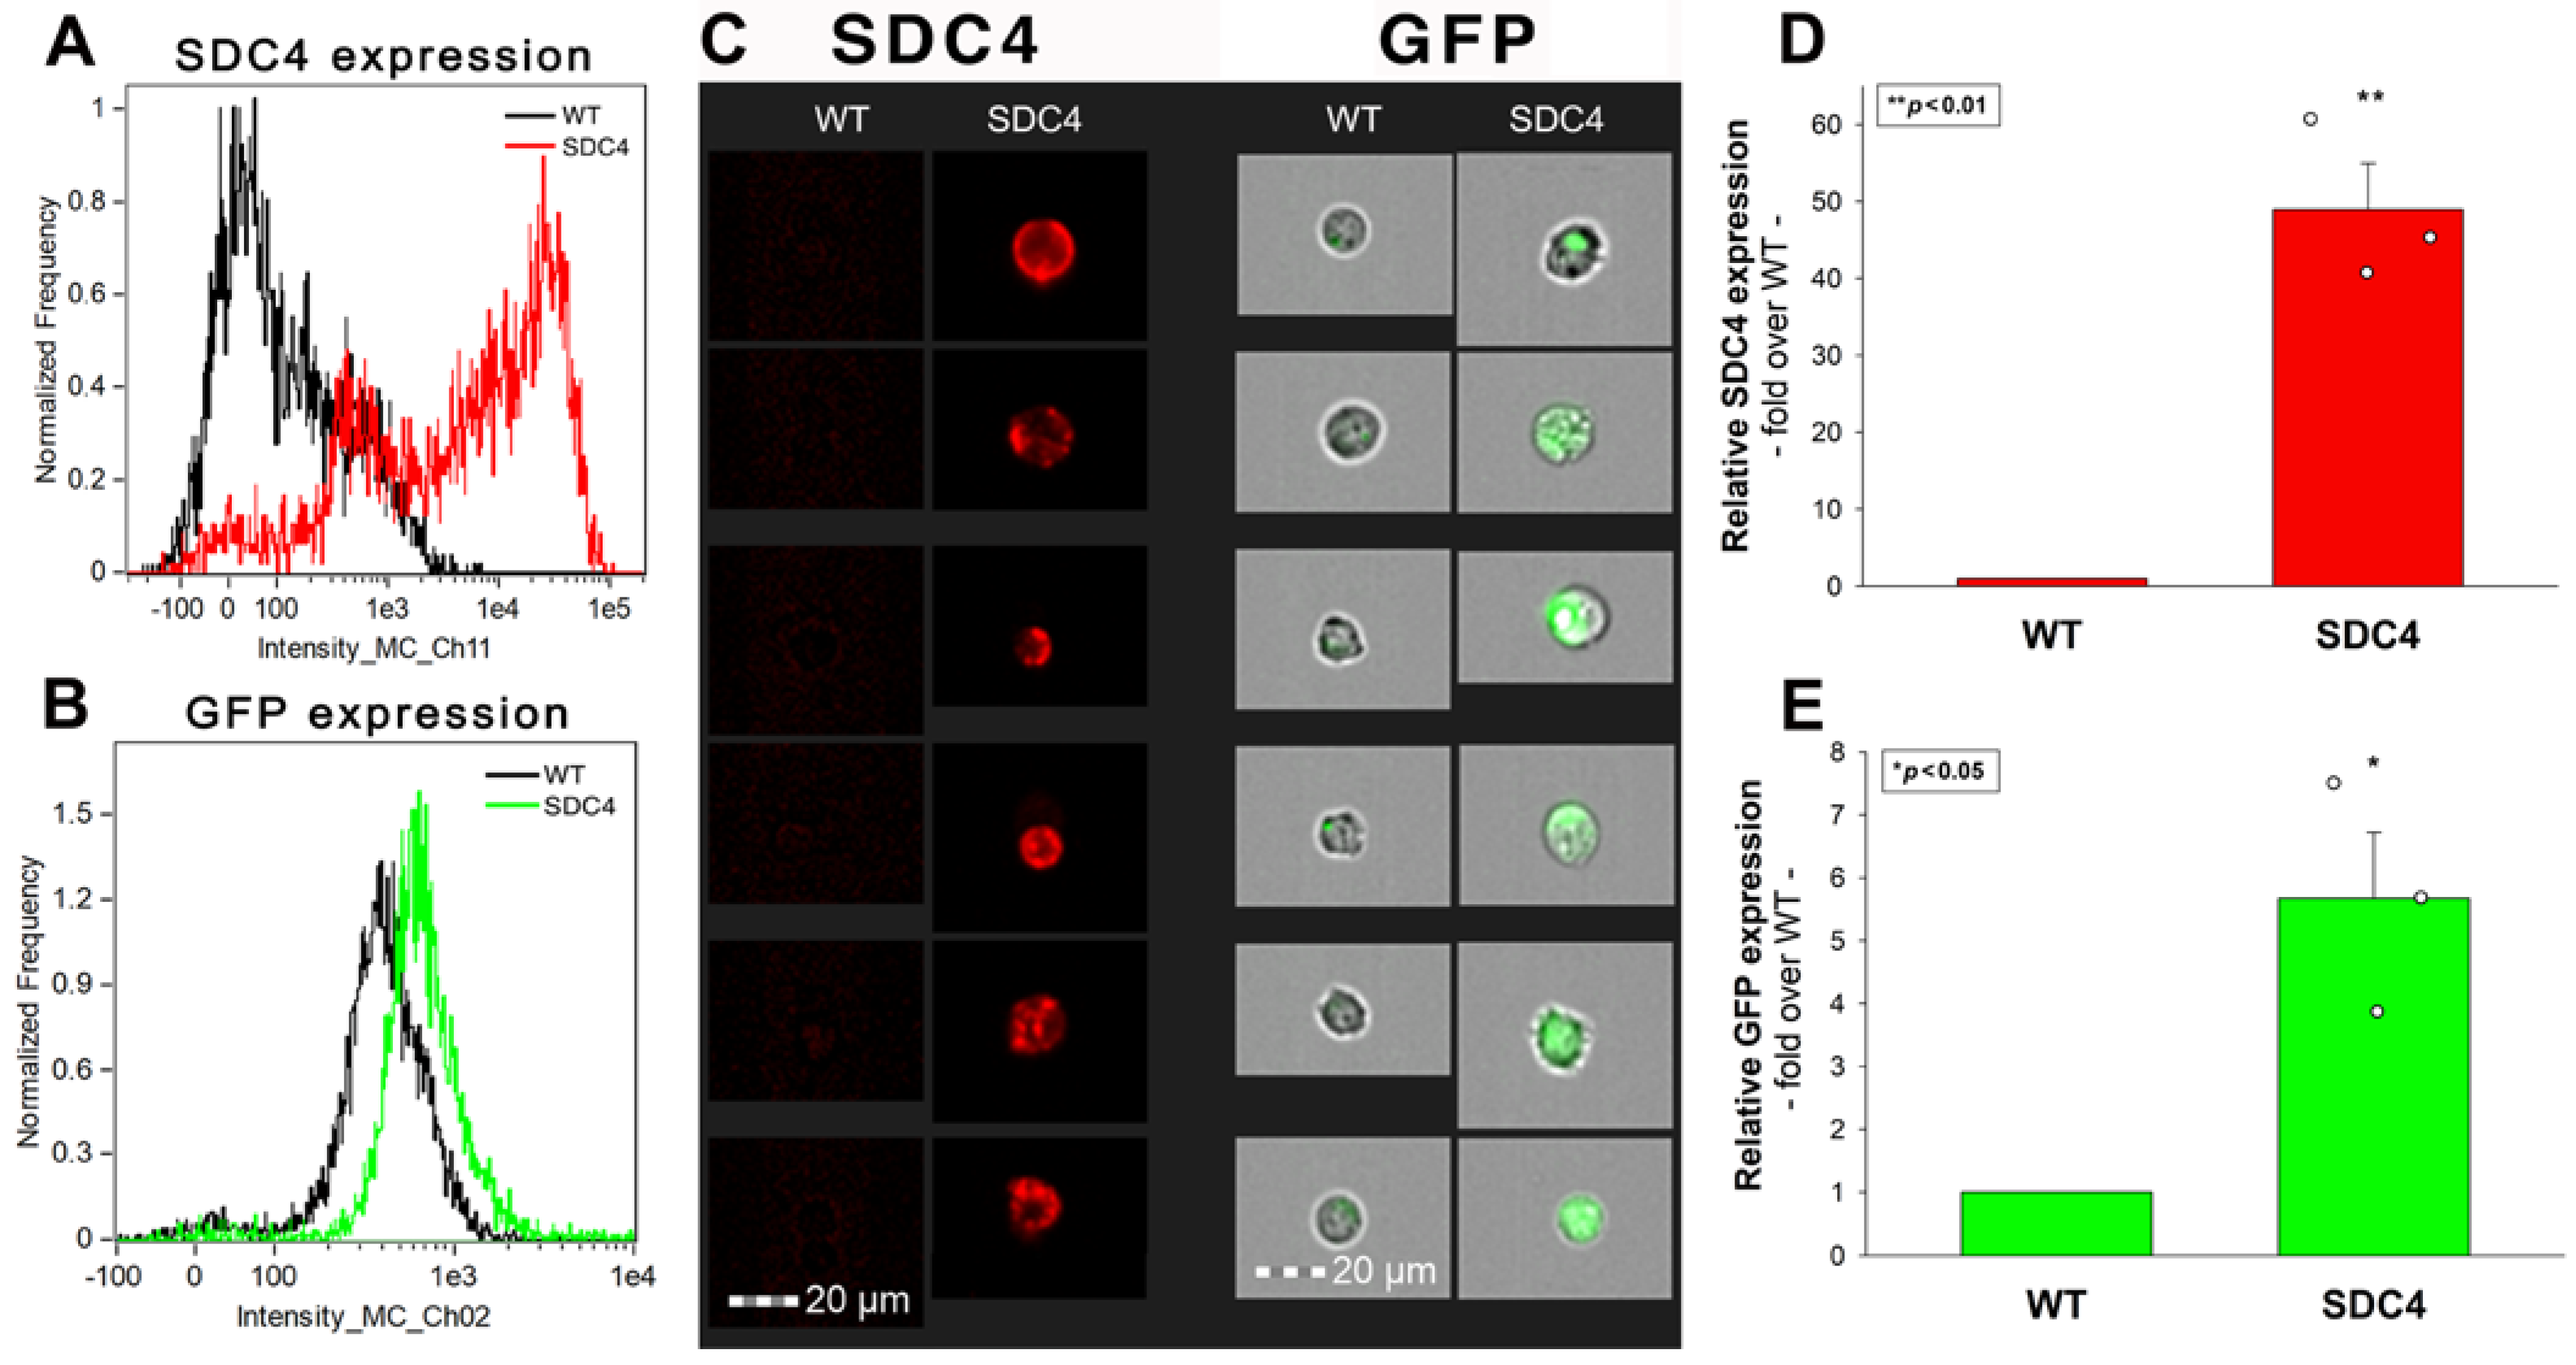
2.6. Effect of SDC4 Knock-In in Neuronal Cells

In the CNS, the AAV9 has an affinity towards astrocytes while exhibiting limited neuronal transduction [36,42,43]. SH-SY5Y cells, a frequently utilized neuroblastoma cell line, show shallow levels of SDC4 expression (Figure 6A,C). Overexpression of SDC4 in SH-SY5Y transfection induced a marked increase in AAV9-mediated GFP transduction, as detected with imaging flow cytometry (Figure 6A–E).

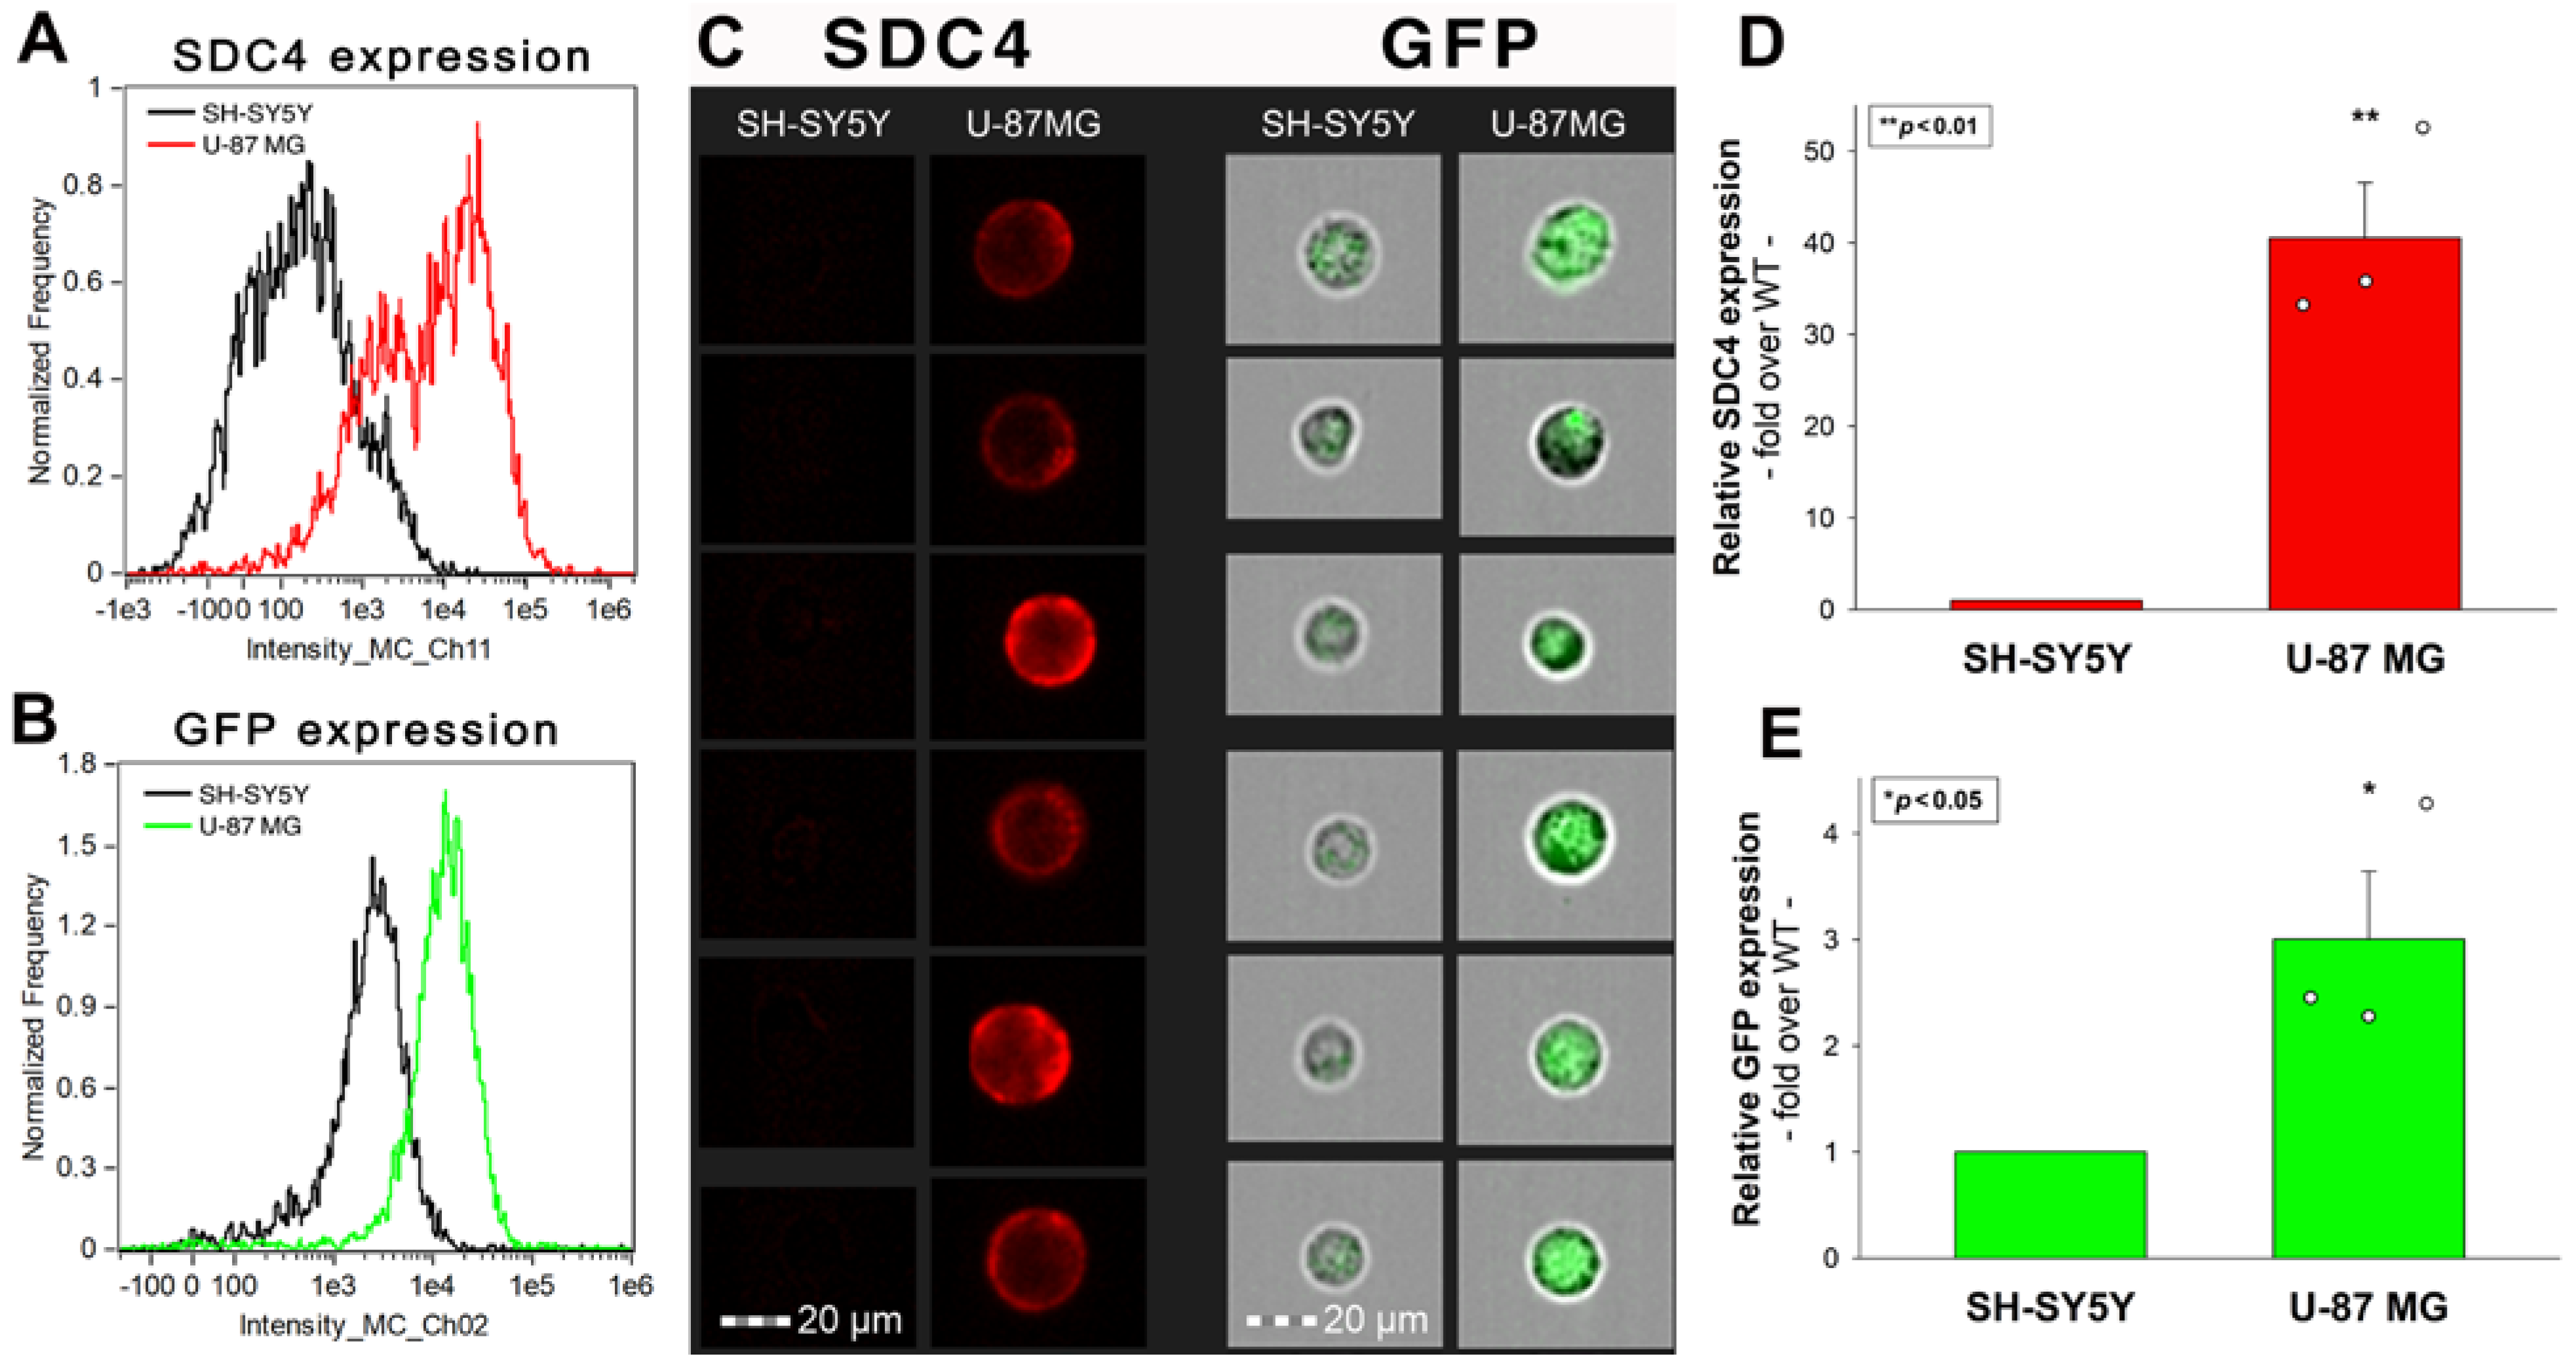
2.7. Glial Cells Could Be Transduced More Efficiently with AAV9 than Neuron-like Cells

U-87 MG is a glial (i.e., glioblastoma) cell line exhibiting significantly (~40×) higher SDC4 expression than the neuronal-like (i.e., neuroblastoma) SH-SY5Y cells with shallow SDC4 expression (Figure 7A,C,D). Treatment with recombinant AAV9-GFP vectors resulted in markedly (~3×) increased GFP expression in SDC4-enriched U-87 MG cells than in SH-SY5Y cells with minimal SDC4 expression, providing further evidence of the involvement of SDC4 in mediating AAV9 cellular entry (Figure 7B,C,E).

3. Discussion

AAV9 is a promising viral vector to deliver genes into the CNS. Given the genetic backgrounds of several CNS disorders, targeted manipulation of CNS gene expression offers new therapeutic opportunities for CNS diseases with unmet medical needs. Breakthrough therapeutic innovations for CNS disorders are still waiting to be achieved. The still unknown details of AAV9 cellular biology detain the successful therapeutic implementation of AAV9-based CNS therapies.
After peripheral (i.e., intravenous) administration, AAV9 induces robust gene expression throughout the mice CNS [44]. The pattern of gene delivery differs with age: neonatal subjects exhibit greater neuronal transduction than adults, which predominantly show astroglial versus neuronal transduction [36]. The different membrane expression profiles of astroglia and neurons must account for AAV9’s more efficient astroglial transducibility. However, the molecular mechanisms accounting for AAV9’s astroglial preference are still not fully understood. Thus, the incomplete understanding of AAV9 cellular receptors greatly hampers the targeted application of AAV9-based CNS gene therapies.
To find answers to the unknown details of AAV9-mediated gene delivery, we decided to explore the potential BBB receptors of AAV9. Studies on AAV9-treated human BBB endothelial cells showed that knockdown of SDC4, the universally expressed member of the SDC family of transmembrane HSPGs, decreased AAV9-mediated GFP transduction. SDC-specific cellular models created in poorly transducible K562 cells showed that among SDCs, SDC4 is the major facilitator of AAV9’s cell entry. Overexpression of all SDC isoforms, including the epithelial SDC1, the endothelial SDC2, and the neuronal SDC3, increased AAV9-mediated gene delivery. However, the most significant increase in AAV-mediated GFP transduction was due to SDC4 overexpression. AAV9’s interaction with SDC4 involved the HS chains and the CBD domain of the SDC4 ectodomain, highlighting also the importance of GAG-independent constituents of the SDC4 core protein in attaching AAV9. The reduction in the cellular entry of AAV9 after the removal of SDC4’s HS chains was reasonably low, while overexpressing SDC4 with reduced HS chains still increased AAV9-mediated gene delivery. These results showed that CBD of SDC4 also binds AAV9. Affinity proteomics on SDC4 transfectants revealed that AAV9 interacts with SDC4’s intracellular partners. Overexpression of SDC4 into the poorly transducible neuroblastoma SH-SY5Y cell line increased AAV9-mediated gene delivery. The U-87 MG glial cell line with high SDC4 expression could also be transduced more efficiently than SH-SY5Y cells, serving evidence on the more efficient transducibility of SDC4-enriched glial cells than neurons with modest SDC4 expression.
In summary, our data provides detailed cellular evidence of SDC4’s involvement in the cellular internalization of AAV9. The establishment of SDC4 as a significant mediator of AAV9 entry also provides a molecularly valid explanation of AAV9’s astrocyte preference in adult mice brains. It is worth noting that in rodents, SDC4 expression is typical of astroglia, the main cellular targets of AAV9 in the CNS of adult mice [36,44,45,72]. Exploiting the described data could thus provide more rational strategies for developing targeted AAV9-based gene therapies.

4. Materials and Methods

4.1. Recombinant AAV9 Vectors

The N-terminally AAV9 expressing green fluorescent protein (GFP) under the control of the chicken-β-actin hybrid promoter was produced as described previously [73].

4.2. Establishment of SDC4 KD Cell Lines

SDC4 knockdown in hCMEC/D3 was performed using a SDC4 shRNA plasmid (cat. no. sc-36588-SH), using shRNA plasmid transfection reagent (cat. no. sc-108061) according to the manufacturer’s protocol (Santa Cruz Biotechnology, Inc., Dallas, TX, USA). Control hCMEC/D3 cells used in the study were indeed treated with control for shRNA plasmids, scrambled shRNA sequences that did not lead to the specific degradation of SDC4 or any known cellular mRNAs (cat. no. sc-108060, Santa Cruz Biotechnology, Inc., Dallas, TX, USA). Stable KD cells were selected in 2 mg G418 and sorted using imaging flow cytometry (Amnis® FlowSight®, Luminex Corporation, Austin, TX, USA) with APC-conjugated anti-SDC4 antibody (RnD Systems, Minneapolis, MN, USA, cat. no. FAB29181A, 5:100 dilution) and respective isotype control (rat IgG2A APC isotype control, RnD Systems, cat. no. IC006A, 5:100). The cellular expression of SDC4 following knockdown was also determined with Western blotting as described previously [74]. A chemiluminescence detection reagent (Luminata Crescendo Western Blotting HRP Reagents) was used for protein visualization, and the signal was detected with UVITEC Alliance Q9 Advanced imager (Uvitec Ltd., Cambridge, UK). β-Tubulin (mouse monoclonal, Santa Cruz Biotechnology Inc., Dallas, TX, USA, cat. no. sc-5274) was used as a loading control (in 1:100 dilution).

4.3. SDC Constructs, Cell Culture and Transfection

Full-length SDC1-4 and SDC4 deletion mutants and transfectants, established in K562 (ATCC®®® CCL-243™) and SH-SY5Y cells (ATCC®®® CRL-2266™), were created as described previously [49,50,51]. Stable SDC transfectants were selected by measuring SDC expression with flow cytometry using APC-labeled SDC antibodies specific for the respective SDC isoform (all RnD Systems, Minneapolis, MN, USA; SDC1: monoclonal rat IgG1 Clone #359103, cat. no. FAB2780A; SDC2: monoclonal rat IgG2B Clone #305515, cat. no. FAB2965A [74,75,76]; SDC3: polyclonal goat IgG, cat. no. FAB3539A [74,77]; SDC4: monoclonal rat IgG2a clone #336304, cat. no. FAB29181A [49,50]), along with respective isotype controls (all RnD Systems; rat IgG1 APC-conjugated isotype control, cat. no. IC005A; rat IgG2B APC-conjugated isotype control, cat. no. IC013A; goat IgG APC-conjugated antibody, cat. no. IC108A; rat IgG2A APC isotype control, cat. no. IC006A).

4.4. Flow Cytometry Analysis of HS and SDC Expression

HS and SDC expression of the applied cell lines (hCMEC/D3, K562, and SDC transfectants, U87 MG and SH-SY5Y cell) were measured with flow cytometry by using anti-human HS antibody (10E4 epitope; Amsbio, Abingdon, UK; with Alexa Fluor [AF] 647-labeled secondary anti-mouse IgM and respective isotype control: Thermo Fisher Scientific, Waltham, MA, USA, cat. no. 02-6800) and APC-labeled SDC antibodies as described previously [49,50]. SDC transfectants with almost equal amounts of HS expression were selected for further uptake studies [49,50].

4.5. Flow Cytometry Analysis of AAV9-Mediated GFP Transduction and AAV9 Uptake

WT K562, SH-SY5Y, U-87 MG, WT and SDC4 KD hCMEC/D3 cells, SDC transfectants and SDC4 mutants were utilized to quantify AAV9-mediated GFP transduction. Briefly, 6 × 10⁵ cells/mL in DMEM/F12 medium were incubated with AAV9-GFP vectors at 4 × 10⁴ vg/cell. GFP expression was analyzed 72 h later with imaging flow cytometry (Amnis® FlowSight®, Luminex Corporation, Austin, TX, USA). In the case of SDC4 mutants, after 6 h of incubation with AAV9, the cells were trypsinized (with the method described by Nakase et al. [78]) to remove the extracellularly attached virus particles. The cells were then treated with mouse monoclonal (ADK9) to AAV9 (1:100 dilution, Progen, Wayne, PA, USA, cat.no: 690162), followed by treatment with AF 633-labeled goat anti-mouse IgG (1:100 dilution, Invitrogen A-21052, Waltham, MA, USA). The samples were then rinsed three times with PBS containing 1% BSA and 0.1% Triton X-100 and progressed toward flow cytometry. Cellular uptake was then measured with flow cytometry using an AMNIS® FlowSight imaging flow cytometer (AMNIS Corporation, Seattle, WA, USA). A minimum of 5000 events per sample was analyzed. Laser power was identical within each experiment. Appropriate gating in a forward-scatter-against-side-scatter plot was utilized to exclude cellular debris and aggregates. Fluorescence analysis was conducted with the IDEAS™ analysis software. To examine the influence of the fluorescently labeled secondary IgGs, some cells were also treated with secondary antibodies without AAV9 treatment or preincubation with primary anti-AAV9 antibodies.

4.6. Microscopic Visualization of Uptake

AAV9’s cellular entry and AAV9-mediated GFP transduction were visualized with confocal microscopy. hCMEC/D3 cells, SDC transfectants, and SDC4 mutants (established in WT K562 cells) were grown on poly-D-lysine-coated glass-bottom 35-mm culture dishes (MatTek Corp., Ashland, MA, USA). The cells were preincubated in DMEM/F12 medium at 37 °C for 24 h before incubation with the AAV9-GFP at a concentration of 4 × 10⁴ vg/cell for 72 h at 37 °C. For colocalization studies, hCMEC/D3 cells and SDC4 mutants were incubated with AAV9-GFP for 6 h at 37 °C. Then cells were rinsed two times with ice-cold PBS and fixed in 4% paraformaldehyde (Sigma, St. Louis, MO, USA); the cell membranes were permeabilized (0.1% Triton X-100), and the cells were blocked with the appropriate serum for 1h at room temperature, followed by the specific antibody treatments as described for the flow cytometry analyses. The samples were then rinsed three times with PBS containing 0.1% Triton X-100, then stained with DAPI (1:5000) for 5 min, washed three times with PBS, and embedded in Fluoromount G (SouthernBiotech, Birmingham, AL, USA) [49,50]. The fluorescence distribution was then analyzed on a Leica DMi8 microscope equipped with Aurox Clarity Laser Free Confocal Unit. Sections presented were taken approximately at the mid-height level of the cells. Photomultiplier gain and illumination power were identical within each experiment. Aurox Visionary software was used for image acquisition by confocal microscopy. For colocalization analyses, the images were analyzed with ImageJ’s (NIH, Bethesda, MD, USA) JACoP plugin [79]. AAV9-mediated GFP transduction into WT K562 cells and SDC transfectants was then visualized with an Olympus FV1000 confocal laser scanning microscope equipped with three lasers. A laser diode (excitation, 405 nm) and a band-pass filter (420–480 nm) were used to capture the signal recorded as blue; an argon laser (excitation, 488 nm) and a band-pass filter (505–530 nm) were used to capture the signal recorded as green; and, finally, a helium/neon laser (excitation, 543 nm) and a band-pass filter (550–625 nm) were used to capture the signal recorded as red. Sections presented were taken approximately at the mid-height level of the cells. Photomultiplier gain and laser power were identical within each experiment. The Olympus Fluoview software (version 4.2b) was used for image acquisition and analysis.

4.7. Undersulfation Studies

Stable SDC4 transfectants (created in K562 cells) were preincubated with or without 60 mM sodium chlorate (NaClO3; Sigma, St. Louis, MO, USA) for 48 h. The effect of NaClO3 preincubation on HS and SDC4 expression was measured with imaging flow cytometry by incubating the cells with HS- and SDC4-specific antibodies. SDC4 transfectants preincubated with or without NaClO3 were then treated with AAV9-GFP vectors at 4 × 10⁴ vg/cell. After 72 h of incubation with AAV9-GFP, GFP expression was measured with imaging flow cytometric analyses described above.

4.8. Co-Immunoprecipitation Experiments

WT and SDC4 KD hCMEC/D3 cells, WT K562, and SDC transfectants incubated with or without AAV9 were processed for co-immunoprecipitation experiments as described previously [49,50]. Briefly, after incubation, the cells were washed twice with ice-cold PBS and treated with a cold Pierce IP lysis buffer. The cells were then scraped off to clean Eppendorf tubes, put on a low-speed rotating shaker for 15 min, and centrifuged at 14,000× g for 15 min at 4 °C. The supernatant was then transferred to new tubes and combined with 5 µg human SDC4 antibody (RnD System, Abingdon, UK; cat. no. AF2918). The antigen sample/SDC antibody mixture was then incubated overnight at 4 °C with mixing. The antigen sample/antibody mixture was then added to a 1.5 mL microcentrifuge tube containing pre-washed Pierce Protein A/G Magnetic Beads (Thermo Fisher Scientific, Waltham, MA, USA). After incubation at room temperature for 1 h with mixing, the beads were then collected with a MagJET Separation Rack magnetic stand (Thermo Fisher Scientific, Waltham, MA, USA), and supernatants were discarded. To elute the antigen, 100 µL of SDS-PAGE reducing sample buffer was added to the tubes. The samples were heated at 96 °C for 10 min in 1% SDS and transferred to SDS-PAGE [49,50]. The samples were then immunoblotted onto PVDF membranes, and the proteins were detected with specific antibodies, as described above. Image acquisition was conducted with UVITEC Alliance Q9 Advanced imaging platform.

4.9. Affinity-Based Proteomics of SDC4 Interactions in SDC4 Transfectants

To reveal the AAV9 interactome, whole cell extracts were prepared from a stable SDC4 transfectant. Then an AAV9 co-immunoprecipitation (AAV9 co-IP) assay (using mouse monoclonal antibody (ADK9) to AAV9 (1:100 dilution, Progen, Wayne, PA, USA, cat.no: 690162)) and subsequent LC-MS/MS analysis using a nanoflow RP-HPLC online coupled to a linear ion trap-Orbitrap (Orbitrap-Elite, Thermo Fisher Scientific, Dreieich, Germany) mass spectrometer was performed as described previously [50]. Raw data were converted into peak lists using Proteome Discoverer (v 1.4, Thermo Fisher Scientific, Waltham, MA, USA). First, we searched against the Swissprot and Uniprot databases, considering the sequence of SDC4. Search parameters and acceptance criteria were set as previously published. Close homologs were only reported if at least three unique peptides matched the protein. Spectral counting was used to estimate the relative abundance of individual proteins in the samples: peptide counts of the individual proteins were normalized to the total number of peptide identifications in each sample [80]. Proteins (i) with reproducible detection (|log2fold-change| < 0.67 between biological replicates), (ii) with at least two identified peptides, (iii) with at least 5% coverage, and (iv) with a median-normalized protein binding affinity score above a previously defined cut-off value were considered as proteins that specifically associate with the AAV9 capsid [81].

4.10. Statistical Analysis

Results are expressed as means + standard error of the mean (SEM). Differences between experimental groups were evaluated by using one-way analysis of variance (ANOVA). Values of p < 0.05 were accepted as significant [49,50]. During imaging flow cytometry, the bright detail similarity (BDS) feature of the Amnis® IDEAS software was used to measure colocalization between two signals [67]. A BDS score of 2 or greater represents a high degree of overlap.

Supplementary Materials

The following supporting information can be downloaded at: https://www.mdpi.com/article/10.3390/ijms24043141/s1.

Author Contributions

Conceptualization, T.L., A.H., M.R., L.S. and M.A.; methodology, A.H., M.R., D.P., A.P.-S., A.L., L.S. and T.L.; validation, A.H., M.R., A.L. and T.L.; formal analysis, A.H., M.R., A.L. and T.L.; investigation, A.H., M.R., D.P., A.P.-S. and T.L.; resources, M.A. and T.L.; data curation, A.H. and T.L.; writing—original draft preparation, A.H., M.R. and T.L.; writing—review and editing, A.H., A.L., M.A. and T.L.; visualization, T.L. and A.H.; supervision, M.A. and T.L.; project administration, A.H., T.L., M.R., D.P. and A.H.; funding acquisition, M.A. and T.L. All authors have read and agreed to the published version of the manuscript.

Funding

A.H., M.R., D.P., M.A. and T.L. received funding from the Innovative Medicines Initiative 2 Joint Undertaking, under grant agreements No. 807015 and No. 945473. This Joint Undertaking receives support from the European Union’s Horizon 2020 research and innovation program and EFPIA. A.H., D.P. and T.L. also received funding from the European Union’s Horizon 2020 Research and Innovation Program under Future and Emerging Technologies grant agreement No. 863214. A.H., D.P., L.S. and T.L. were also supported by the grants 2017-2.3.6-TÉT-CN-2018-00023 and 2020-1.1.6-JÖVŐ-2021-00012 of the National Research, Development and Innovation Office, Hungary. A.H., D.P., A.L., A.P.-S. and T.L. were supported by the grants 2020-1.1.6-JÖVŐ-2021-00012 and 2020-1.1.2-PIACI-KFI-2021-00233 of the National Research, Development and Innovation Office, Hungary.

Institutional Review Board Statement

Not applicable.

Informed Consent Statement

Not applicable.

Data Availability Statement

Data are contained within the article or Supplementary Materials.

Conflicts of Interest

The authors declare no conflict of interest.

References

  1. Butterfield, J.S.S.; Hege, K.M.; Herzog, R.W.; Kaczmarek, R. A Molecular Revolution in the Treatment of Hemophilia. Mol. Ther. J. Am. Soc. Gene Ther. 2019, 28, 997–1015. [Google Scholar] [CrossRef] [PubMed]
  2. Benveniste, O. Gene therapy, an ongoing revolution. Blood 2012, 119, 2973–2974. [Google Scholar] [CrossRef] [PubMed]
  3. Jiang, D.J.; Xu, C.L.; Tsang, S.H. Revolution in Gene Medicine Therapy and Genome Surgery. Genes 2018, 9, 575. [Google Scholar] [CrossRef]
  4. Misra, S. Human gene therapy: A brief overview of the genetic revolution. J. Assoc. Physicians India 2013, 61, 127–133. [Google Scholar]
  5. Gruntman, A.M.; Flotte, T.R. The rapidly evolving state of gene therapy. FASEB J. Off. Publ. Fed. Am. Soc. Exp. Biol. 2018, 32, 1733–1740. [Google Scholar] [CrossRef] [PubMed]
  6. Pillay, S.; Carette, J.E. Host determinants of adeno-associated viral vector entry. Curr. Opin. Virol. 2017, 24, 124–131. [Google Scholar] [CrossRef] [PubMed]
  7. Muzyczka, N.; Warrington, K.H., Jr. Custom adeno-associated virus capsids: The next generation of recombinant vectors with novel tropism. Hum. Gene Ther. 2005, 16, 408–416. [Google Scholar] [CrossRef]
  8. Rodrigues, G.A.; Shalaev, E.; Karami, T.K.; Cunningham, J.; Slater, N.K.H.; Rivers, H.M. Pharmaceutical Development of AAV-Based Gene Therapy Products for the Eye. Pharm. Res. 2018, 36, 29. [Google Scholar] [CrossRef]
  9. Naso, M.F.; Tomkowicz, B.; Perry, W.L., 3rd; Strohl, W.R. Adeno-Associated Virus (AAV) as a Vector for Gene Therapy. BioDrugs 2017, 31, 317–334. [Google Scholar] [CrossRef]
  10. Wang, D.; Tai, P.W.L.; Gao, G. Adeno-associated virus vector as a platform for gene therapy delivery. Nat. Rev. Drug Discov. 2019, 18, 358–378. [Google Scholar] [CrossRef] [PubMed]
  11. Crawford, L.V.; Follett, E.A.; Burdon, M.G.; McGeoch, D.J. The DNA of a minute virus of mice. J. Gen. Virol. 1969, 4, 37–46. [Google Scholar] [CrossRef] [PubMed]
  12. Carter, B.J.; Khoury, G.; Denhardt, D.T. Physical map and strand polarity of specific fragments of adenovirus-associated virus DNA produced by endonuclease R-EcoRI. J. Virol. 1975, 16, 559–568. [Google Scholar] [CrossRef] [PubMed]
  13. Rose, J.A.; Berns, K.I.; Hoggan, M.D.; Koczot, F.J. Evidence for a single-stranded adenovirus-associated virus genome: Formation of a DNA density hybrid on release of viral DNA. Proc. Natl. Acad. Sci. USA 1969, 64, 863–869. [Google Scholar] [CrossRef] [PubMed]
  14. Lusby, E.; Fife, K.H.; Berns, K.I. Nucleotide sequence of the inverted terminal repetition in adeno-associated virus DNA. J. Virol. 1980, 34, 402–409. [Google Scholar] [CrossRef] [PubMed]
  15. Carter, B.J.; Khoury, G.; Rose, J.A. Adenovirus-associated virus multiplication. IX. Extent of transcription of the viral genome in vivo. J. Virol. 1972, 10, 1118–1125. [Google Scholar] [CrossRef]
  16. Hauswirth, W.W.; Berns, K.I. Origin and termination of adeno-associated virus DNA replication. Virology 1977, 78, 488–499. [Google Scholar] [CrossRef]
  17. Marcus, C.J.; Laughlin, C.A.; Carter, B.J. Adeno-associated virus RNA transcription in vivo. Eur. J. Biochem. 1981, 121, 147–154. [Google Scholar] [CrossRef]
  18. Berns, K.I.; Pinkerton, T.C.; Thomas, G.F.; Hoggan, M.D. Detection of adeno-associated virus (AAV)-specific nucleotide sequences in DNA isolated from latently infected Detroit 6 cells. Virology 1975, 68, 556–560. [Google Scholar] [CrossRef]
  19. Cheung, A.K.; Hoggan, M.D.; Hauswirth, W.W.; Berns, K.I. Integration of the adeno-associated virus genome into cellular DNA in latently infected human Detroit 6 cells. J. Virol. 1980, 33, 739–748. [Google Scholar] [CrossRef]
  20. Kotin, R.M.; Berns, K.I. Organization of adeno-associated virus DNA in latently infected Detroit 6 cells. Virology 1989, 170, 460–467. [Google Scholar] [CrossRef]
  21. Kotin, R.M.; Menninger, J.C.; Ward, D.C.; Berns, K.I. Mapping and direct visualization of a region-specific viral DNA integration site on chromosome 19q13-qter. Genomics 1991, 10, 831–834. [Google Scholar] [CrossRef]
  22. Kotin, R.M.; Siniscalco, M.; Samulski, R.J.; Zhu, X.D.; Hunter, L.; Laughlin, C.A.; McLaughlin, S.; Muzyczka, N.; Rocchi, M.; Berns, K.I. Site-specific integration by adeno-associated virus. Proc. Natl. Acad. Sci. USA 1990, 87, 2211–2215. [Google Scholar] [CrossRef] [PubMed]
  23. Linden, R.M.; Ward, P.; Giraud, C.; Winocour, E.; Berns, K.I. Site-specific integration by adeno-associated virus. Proc. Natl. Acad. Sci. USA 1996, 93, 11288–11294. [Google Scholar] [CrossRef] [PubMed]
  24. Laughlin, C.A.; Tratschin, J.D.; Coon, H.; Carter, B.J. Cloning of infectious adeno-associated virus genomes in bacterial plasmids. Gene 1983, 23, 65–73. [Google Scholar] [CrossRef] [PubMed]
  25. Myers, M.W.; Carter, B.J. Assembly of adeno-associated virus. Virology 1980, 102, 71–82. [Google Scholar] [CrossRef]
  26. Samulski, R.J.; Berns, K.I.; Tan, M.; Muzyczka, N. Cloning of adeno-associated virus into pBR322: Rescue of intact virus from the recombinant plasmid in human cells. Proc. Natl. Acad. Sci. USA 1982, 79, 2077–2081. [Google Scholar] [CrossRef]
  27. Srivastava, A.; Lusby, E.W.; Berns, K.I. Nucleotide sequence and organization of the adeno-associated virus 2 genome. J. Virol. 1983, 45, 555–564. [Google Scholar] [CrossRef]
  28. Nidetz, N.F.; McGee, M.C.; Tse, L.V.; Li, C.; Cong, L.; Li, Y.; Huang, W. Adeno-associated viral vector-mediated immune responses: Understanding barriers to gene delivery. Pharmacol. Ther. 2019, 207, 107453. [Google Scholar] [CrossRef]
  29. Colella, P.; Ronzitti, G.; Mingozzi, F. Emerging Issues in AAV-Mediated In Vivo Gene Therapy. Mol. Therapy. Methods Clin. Dev. 2018, 8, 87–104. [Google Scholar] [CrossRef]
  30. Keeler, A.M.; Flotte, T.R. Recombinant Adeno-Associated Virus Gene Therapy in Light of Luxturna (and Zolgensma and Glybera): Where Are We, and How Did We Get Here? Annu. Rev. Virol. 2019, 6, 601–621. [Google Scholar] [CrossRef]
  31. Yla-Herttuala, S. Endgame: Glybera finally recommended for approval as the first gene therapy drug in the European union. Mol. Ther. J. Am. Soc. Gene Ther. 2012, 20, 1831–1832. [Google Scholar] [CrossRef] [PubMed] [Green Version]
  32. Casto, B.C.; Atchison, R.W.; Hammon, W.M. Studies on the relationship between adeno-associated virus type I (AAV-1) and adenoviruses. I. Replication of AAV-1 in certain cell cultures and its effect on helper adenovirus. Virology 1967, 32, 52–59. [Google Scholar] [CrossRef]
  33. Lisowski, L.; Tay, S.S.; Alexander, I.E. Adeno-associated virus serotypes for gene therapeutics. Curr. Opin. Pharmacol. 2015, 24, 59–67. [Google Scholar] [CrossRef] [PubMed]
  34. Gao, G.; Vandenberghe, L.H.; Alvira, M.R.; Lu, Y.; Calcedo, R.; Zhou, X.; Wilson, J.M. Clades of Adeno-associated viruses are widely disseminated in human tissues. J. Virol. 2004, 78, 6381–6388. [Google Scholar] [CrossRef]
  35. Manfredsson, F.P.; Rising, A.C.; Mandel, R.J. AAV9: A potential blood-brain barrier buster. Mol. Ther. J. Am. Soc. Gene Ther. 2009, 17, 403–405. [Google Scholar] [CrossRef] [PubMed]
  36. Foust, K.D.; Nurre, E.; Montgomery, C.L.; Hernandez, A.; Chan, C.M.; Kaspar, B.K. Intravascular AAV9 preferentially targets neonatal neurons and adult astrocytes. Nat. Biotechnol. 2009, 27, 59–65. [Google Scholar] [CrossRef]
  37. Thompson, A.J.; de Vries, R.P.; Paulson, J.C. Virus recognition of glycan receptors. Curr. Opin. Virol. 2019, 34, 117–129. [Google Scholar] [CrossRef]
  38. Mietzsch, M.; Broecker, F.; Reinhardt, A.; Seeberger, P.H.; Heilbronn, R. Differential adeno-associated virus serotype-specific interaction patterns with synthetic heparins and other glycans. J. Virol. 2014, 88, 2991–3003. [Google Scholar] [CrossRef]
  39. Shen, S.; Bryant, K.D.; Brown, S.M.; Randell, S.H.; Asokan, A. Terminal N-linked galactose is the primary receptor for adeno-associated virus 9. J. Biol. Chem. 2011, 286, 13532–13540. [Google Scholar] [CrossRef]
  40. Bell, C.L.; Vandenberghe, L.H.; Bell, P.; Limberis, M.P.; Gao, G.P.; Van Vliet, K.; Agbandje-McKenna, M.; Wilson, J.M. The AAV9 receptor and its modification to improve in vivo lung gene transfer in mice. J. Clin. Investig. 2011, 121, 2427–2435. [Google Scholar] [CrossRef]
  41. Lee, S.H.; Yang, J.Y.; Madrakhimov, S.; Park, H.Y.; Park, K.; Park, T.K. Adeno-Associated Viral Vector 2 and 9 Transduction Is Enhanced in Streptozotocin-Induced Diabetic Mouse Retina. Mol. Therapy. Methods Clin. Dev. 2019, 13, 55–66. [Google Scholar] [CrossRef] [PubMed] [Green Version]
  42. Gray, S.J.; Matagne, V.; Bachaboina, L.; Yadav, S.; Ojeda, S.R.; Samulski, R.J. Preclinical differences of intravascular AAV9 delivery to neurons and glia: A comparative study of adult mice and nonhuman primates. Mol. Ther. J. Am. Soc. Gene Ther. 2011, 19, 1058–1069. [Google Scholar] [CrossRef] [PubMed]
  43. Dashkoff, J.; Lerner, E.P.; Truong, N.; Klickstein, J.A.; Fan, Z.; Mu, D.; Maguire, C.A.; Hyman, B.T.; Hudry, E. Tailored transgene expression to specific cell types in the central nervous system after peripheral injection with AAV9. Mol. Therapy. Methods Clin. Dev. 2016, 3, 16081. [Google Scholar] [CrossRef] [PubMed]
  44. Dayton, R.D.; Wang, D.B.; Klein, R.L. The advent of AAV9 expands applications for brain and spinal cord gene delivery. Expert Opin. Biol. Ther. 2012, 12, 757–766. [Google Scholar] [CrossRef]
  45. Hsueh, Y.P.; Sheng, M. Regulated expression and subcellular localization of syndecan heparan sulfate proteoglycans and the syndecan-binding protein CASK/LIN-2 during rat brain development. J. Neurosci. 1999, 19, 7415–7425. [Google Scholar] [CrossRef]
  46. Zhang, Y.; Chen, K.; Sloan, S.A.; Bennett, M.L.; Scholze, A.R.; O’Keeffe, S.; Phatnani, H.P.; Guarnieri, P.; Caneda, C.; Ruderisch, N.; et al. An RNA-sequencing transcriptome and splicing database of glia, neurons, and vascular cells of the cerebral cortex. J. Neurosci. 2014, 34, 11929–11947. [Google Scholar] [CrossRef]
  47. Tkachenko, E.; Rhodes, J.M.; Simons, M. Syndecans: New kids on the signaling block. Circ. Res. 2005, 96, 488–500. [Google Scholar] [CrossRef]
  48. Couchman, J.R. Transmembrane signaling proteoglycans. Annu. Rev. Cell Dev. Biol. 2010, 26, 89–114. [Google Scholar] [CrossRef]
  49. Hudak, A.; Kusz, E.; Domonkos, I.; Josvay, K.; Kodamullil, A.T.; Szilak, L.; Hofmann-Apitius, M.; Letoha, T. Contribution of syndecans to cellular uptake and fibrillation of alpha-synuclein and tau. Sci. Rep. 2019, 9, 16543. [Google Scholar] [CrossRef]
  50. Letoha, T.; Hudak, A.; Kusz, E.; Pettko-Szandtner, A.; Domonkos, I.; Josvay, K.; Hofmann-Apitius, M.; Szilak, L. Contribution of syndecans to cellular internalization and fibrillation of amyloid-beta(1-42). Sci. Rep. 2019, 9, 1393. [Google Scholar] [CrossRef]
  51. Letoha, T.; Keller-Pinter, A.; Kusz, E.; Kolozsi, C.; Bozso, Z.; Toth, G.; Vizler, C.; Olah, Z.; Szilak, L. Cell-penetrating peptide exploited syndecans. Biochim. Biophys. Acta 2010, 1798, 2258–2265. [Google Scholar] [CrossRef] [PubMed] [Green Version]
  52. Letoha, T.; Kolozsi, C.; Ekes, C.; Keller-pinter, A.; Kusz, E.; Szakonyi, G.; Duda, E.; Szilak, L. Contribution of syndecans to lipoplex-mediated gene delivery. Eur. J. Pharm. Sci. 2013, 49, 550–555. [Google Scholar] [CrossRef] [PubMed]
  53. Kokenyesi, R.; Bernfield, M. Core protein structure and sequence determine the site and presence of heparan sulfate and chondroitin sulfate on syndecan-1. J. Biol. Chem. 1994, 269, 12304–12309. [Google Scholar] [CrossRef] [PubMed]
  54. Bartlett, A.H.; Park, P.W. Proteoglycans in host-pathogen interactions: Molecular mechanisms and therapeutic implications. Expert Rev. Mol. Med. 2010, 12, e5. [Google Scholar] [CrossRef]
  55. Aquino, R.S.; Park, P.W. Glycosaminoglycans and infection. Front. Biosci. (Landmark Ed.) 2016, 21, 1260–1277. [Google Scholar] [CrossRef]
  56. Cagno, V.; Tseligka, E.D.; Jones, S.T.; Tapparel, C. Heparan Sulfate Proteoglycans and Viral Attachment: True Receptors or Adaptation Bias? Viruses 2019, 11, 596. [Google Scholar] [CrossRef]
  57. Hudak, A.; Letoha, A.; Szilak, L.; Letoha, T. Contribution of Syndecans to the Cellular Entry of SARS-CoV-2. Int. J. Mol. Sci. 2021, 22, 5336. [Google Scholar] [CrossRef]
  58. Hudak, A.; Veres, G.; Letoha, A.; Szilak, L.; Letoha, T. Syndecan-4 Is a Key Facilitator of the SARS-CoV-2 Delta Variant’s Superior Transmission. Int. J. Mol. Sci. 2022, 23, 796. [Google Scholar] [CrossRef]
  59. Christianson, H.C.; Belting, M. Heparan sulfate proteoglycan as a cell-surface endocytosis receptor. Matrix Biol. 2014, 35, 51–55. [Google Scholar] [CrossRef]
  60. Kramer, K.L.; Yost, H.J. Heparan sulfate core proteins in cell-cell signaling. Annu. Rev. Genet. 2003, 37, 461–484. [Google Scholar] [CrossRef]
  61. Szilak, L.; Letoha, T.; Ughy, B. What is the potential of syndecan-4-targeted novel delivery technologies? Ther. Deliv. 2013, 4, 1479–1481. [Google Scholar] [CrossRef] [PubMed]
  62. Weksler, B.; Romero, I.A.; Couraud, P.O. The hCMEC/D3 cell line as a model of the human blood brain barrier. Fluids Barriers CNS 2013, 10, 16. [Google Scholar] [CrossRef] [PubMed]
  63. Hudak, A.; Letoha, A.; Vizler, C.; Letoha, T. Syndecan-3 as a Novel Biomarker in Alzheimer’s Disease. Int. J. Mol. Sci. 2022, 23, 3407. [Google Scholar] [CrossRef] [PubMed]
  64. Ellis, B.L.; Hirsch, M.L.; Barker, J.C.; Connelly, J.P.; Steininger, R.J., 3rd; Porteus, M.H. A survey of ex vivo/in vitro transduction efficiency of mammalian primary cells and cell lines with Nine natural adeno-associated virus (AAV1-9) and one engineered adeno-associated virus serotype. Virol. J. 2013, 10, 74. [Google Scholar] [CrossRef] [PubMed]
  65. Shafti-Keramat, S.; Handisurya, A.; Kriehuber, E.; Meneguzzi, G.; Slupetzky, K.; Kirnbauer, R. Different heparan sulfate proteoglycans serve as cellular receptors for human papillomaviruses. J. Virol. 2003, 77, 13125–13135. [Google Scholar] [CrossRef]
  66. Shi, W.; Bartlett, J.S. RGD inclusion in VP3 provides adeno-associated virus type 2 (AAV2)-based vectors with a heparan sulfate-independent cell entry mechanism. Mol. Ther. J. Am. Soc. Gene Ther. 2003, 7, 515–525. [Google Scholar] [CrossRef] [PubMed]
  67. Haridas, V.; Ranjbar, S.; Vorobjev, I.A.; Goldfeld, A.E.; Barteneva, N.S. Imaging flow cytometry analysis of intracellular pathogens. Methods 2017, 112, 91–104. [Google Scholar] [CrossRef]
  68. Dunn, K.W.; Kamocka, M.M.; McDonald, J.H. A practical guide to evaluating colocalization in biological microscopy. Am. J. Physiol. Cell Physiol. 2011, 300, C723–C742. [Google Scholar] [CrossRef]
  69. Safaiyan, F.; Kolset, S.O.; Prydz, K.; Gottfridsson, E.; Lindahl, U.; Salmivirta, M. Selective effects of sodium chlorate treatment on the sulfation of heparan sulfate. J. Biol. Chem. 1999, 274, 36267–36273. [Google Scholar] [CrossRef]
  70. Fadel, S.; Eley, A. Chlorate: A reversible inhibitor of proteoglycan sulphation in Chlamydia trachomatis-infected cells. J. Med. Microbiol. 2004, 53, 93–95. [Google Scholar] [CrossRef]
  71. Takacs, C.N.; Andreo, U.; Dao Thi, V.L.; Wu, X.; Gleason, C.E.; Itano, M.S.; Spitz-Becker, G.S.; Belote, R.L.; Hedin, B.R.; Scull, M.A.; et al. Differential Regulation of Lipoprotein and Hepatitis C Virus Secretion by Rab1b. Cell Rep. 2017, 21, 431–441. [Google Scholar] [CrossRef] [PubMed] [Green Version]
  72. Ethell, I.M.; Yamaguchi, Y. Cell surface heparan sulfate proteoglycan syndecan-2 induces the maturation of dendritic spines in rat hippocampal neurons. J. Cell Biol. 1999, 144, 575–586. [Google Scholar] [CrossRef] [PubMed]
  73. Lukashchuk, V.; Lewis, K.E.; Coldicott, I.; Grierson, A.J.; Azzouz, M. AAV9-mediated central nervous system-targeted gene delivery via cisterna magna route in mice. Mol. Therapy. Methods Clin. Dev. 2016, 3, 15055. [Google Scholar] [CrossRef] [PubMed]
  74. Irvin, S.C.; Herold, B.C. Molecular mechanisms linking high dose medroxyprogesterone with HIV-1 risk. PLoS ONE 2015, 10, e0121135. [Google Scholar] [CrossRef] [PubMed]
  75. Connor, J.P.; Felder, M.; Kapur, A.; Onujiogu, N. DcR3 binds to ovarian cancer via heparan sulfate proteoglycans and modulates tumor cells response to platinum with corresponding alteration in the expression of BRCA1. BMC Cancer 2012, 12, 176. [Google Scholar] [CrossRef]
  76. Dieudonne, F.X.; Marion, A.; Marie, P.J.; Modrowski, D. Targeted inhibition of T-cell factor activity promotes syndecan-2 expression and sensitization to doxorubicin in osteosarcoma cells and bone tumors in mice. J. Bone Miner Res. 2012, 27, 2118–2129. [Google Scholar] [CrossRef]
  77. Eustace, A.D.; McNaughton, E.F.; King, S.; Kehoe, O.; Kungl, A.; Mattey, D.; Nobbs, A.H.; Williams, N.; Middleton, J. Soluble syndecan-3 binds chemokines, reduces leukocyte migration in vitro and ameliorates disease severity in models of rheumatoid arthritis. Arthritis Res. Ther. 2019, 21, 172. [Google Scholar] [CrossRef]
  78. Nakase, I.; Tadokoro, A.; Kawabata, N.; Takeuchi, T.; Katoh, H.; Hiramoto, K.; Negishi, M.; Nomizu, M.; Sugiura, Y.; Futaki, S. Interaction of arginine-rich peptides with membrane-associated proteoglycans is crucial for induction of actin organization and macropinocytosis. Biochemistry 2007, 46, 492–501. [Google Scholar] [CrossRef]
  79. Bolte, S.; Cordelieres, F.P. A guided tour into subcellular colocalization analysis in light microscopy. J. Microsc. 2006, 224, 213–232. [Google Scholar] [CrossRef]
  80. Horvath, B.M.; Kourova, H.; Nagy, S.; Nemeth, E.; Magyar, Z.; Papdi, C.; Ahmad, Z.; Sanchez-Perez, G.F.; Perilli, S.; Blilou, I.; et al. Arabidopsis RETINOBLASTOMA RELATED directly regulates DNA damage responses through functions beyond cell cycle control. EMBO J. 2017, 36, 1261–1278. [Google Scholar] [CrossRef]
  81. Li, Y.; Collins, M.; An, J.; Geiser, R.; Tegeler, T.; Tsantilas, K.; Garcia, K.; Pirrotte, P.; Bowser, R. Immunoprecipitation and mass spectrometry defines an extensive RBM45 protein-protein interaction network. Brain Res. 2016, 1647, 79–93. [Google Scholar] [CrossRef] [PubMed] [Green Version]
Figure 1. SDC4 contributes to AAV9’s entry into hCMEC/D3 cells. (AF) Imaging flow cytometry assessment of SDC4 expression and AAV9-mediated gene (GFP) delivery in wild-type (WT) and SDC4 KD hCMEC/D3 cells. SDC4 KD was performed using SDC4-specific shRNA plasmids. WT and SDC4 KD hCMEC/D3 cells were treated 4 × 10⁴ vg/cell AAV9-GFP for 72 h at 37 °C. SDC4 and GFP expression levels were measured with imaging flow cytometry, as shown by the representative histograms and cellular images of three independent experiments. Scale bar = 20 μm. The effect of SDC4 KD on SDC4 and GFP expression expressed as percent inhibition. The bars represent the mean ± SEM of three independent experiments. Statistical significance vs. WT was assessed with analysis of variance (ANOVA). ** p < 0.01; *** p < 0.001. (G) SDS-PAGE showing VP1-3 immunoprecipitated with SDC4 from AAV9-treated (4 × 10⁴ vg/cell AAv9 for 6 h at 37 °C) hCMEC/D3 cells’ extracts. Lane 1: 106 vg recombinant AAV9; lane 2–3: immunoprecipitates of AAV9-treated WT hCMEC/D3 and SDC4 KD cells; lane 4: MW marker; lane 5–6: immunoprecipitates of WT and SDC4 KD hCMEC/D3 cells untreated with AAV9 (i.e., controls). Standard protein size markers are indicated on the right.
Ijms 24 03141 g001
Figure 2. AAV9 colocalizes with SDC4 during cellular internalization. hCMEC/D3 cells were incubated with AAV9 (4 × 10⁴ vg/cell) for 6 h at 37 °C. The cells were then trypsinized, fixed, permeabilized and treated with AF488-labeled AAV9 (green) and APC-labeled SDC4 (red) antibodies. AAV9’s colocalization with SDC4 was analyzed with confocal microscopy. Representative images of three independent experiments are shown. Scale bar = 10 μm. The MOC ± SEM and PCC ± SEM for the overlap and colocalization of SDC4 with AAV9 are indicated below the images.
Ijms 24 03141 g002
Figure 3. AAV9-mediated GFP transduction into SDC transfectants. WT K562 cells and SDC transfectants were incubated with AAV9-GFP vectors (4 × 10⁴ vg/cell) for 72 h at 37 °C. After incubation, GFP expression was analyzed with imaging flow cytometry and confocal microscopy. (A,B) Representative flow cytometry histograms and fluorescent images showing the intracellular fluorescence of AAV9-GFP-treated WT K562 cells and SDC transfectants. Scale bar = 20 μm. (C) Detected fluorescence intensities were normalized to AAV9-GFP-treated WT K562 cells as standards. The bars represent the mean ± SEM of seven independent experiments. Statistical significance vs. standards was assessed with ANOVA. * p < 0.05; ** p < 0.01; *** p < 0.001. (D) Confocal microscopic visualization of AAV9-GFP-treated WT K562 cells and SDC transfectants. Representative images of three independent experiments are shown. Scale bar = 10 μm.
Ijms 24 03141 g003
Figure 4. Contribution of the various parts of the SDC4 ectodomain to AAV9 uptake. GFP-tagged SDC4 mutants incubated with AAV9 vectors at 4 × 10⁴ vg/cell for 6 h were fixed, permeabilized, and treated with specific primary AAV9 and AF 633-labeled secondary antibodies. The cellular uptake of AAV9 was then analyzed with imaging flow cytometry and confocal microscopy. (A,B) Representative fluorescent images and flow cytometry histograms showing the intracellular fluorescence of AAV9-treated SDC4 mutants. Scale bar = 20 μm. The indicated BDS values of AAV9 and SDCs represent the mean + SEM of eight independent experiments. Statistical significance was assessed with ANOVA. (C) Detected fluorescence intensities were normalized to AAV9-treated transfectants expressing GFP-labeled WT SDC4 as standards. The bars represent mean + SEM of eight independent experiments. Statistical significance vs. standards was assessed with ANOVA. * p < 0.05; *** p < 0.001. (D) Confocal microscopic visualization of AAV9-treated SDC4 mutants. Scale bar = 10 μm. MOC ± SEM for the overlap of AAV9 with the mutants was calculated by analysis of 15 images with ~10 cells in each image (from three separate samples). Statistical significance vs. AAV9-treated transfectants expressing WT SDC4 (standards) was assessed with ANOVA. *** p < 0.001.
Ijms 24 03141 g004
Figure 5. The effect of undersulfation on SDC4 expression and AAV9-mediated gene transduction. Stable SDC4 transfectants (created in K562 cells) were preincubated with or without NaClO3 for 48 h. Effect of NaClO3 preincubation on HS and SDC4 expression was measured with imaging flow cytometry by incubating the cells with HS- and SDC4-specific antibodies. SDC4 transfectants preincubated with or without NaClO3 were then treated with AAV9-GFP vectors at 4 × 10⁴ vg/cell. After 72 h of incubation with AAV9-GFP, GFP expression was measured with imaging flow cytometry. (AD) Representative flow cytometry histograms and fluorescent cellular images showing HS, GFP, and SDC4 expression of cells preincubated with or without NaClO3. Scale bar = 20 μm. (E) Detected HS, GFP, and SDC4 expression levels in SDC4 transfectants were normalized to those untreated with NaClO3 (controls). The bars represent the mean + SEM of six independent experiments. Statistical significance was assessed with ANOVA. *** p < 0.001. (F) Linear regression between SDC4 expression and AAV9-mediated GFP transduction.
Ijms 24 03141 g005
Figure 6. SDC4 overexpression increases AAV9-mediated GFP transduction in SH-SY5Y cells. SDC4 transfectants (created in SH-SY5Y cells) and WT SH-SY5Y cells were incubated with AAV9-GFP (4 × 10⁴ vg/cell) at 37 °C for 72 h. GFP expression was then analyzed with imaging flow cytometry. (AC) Representative flow cytometry histograms and fluorescent images showing the GFP and SDC4 expression levels in WT SH-SY5Y cells and SDC4 transfectants treated with AAV9-GFP. Scale bar = 20 μm. (D,E) Detected SDC4 and GFP expression levels of AAV9-treated SDC4 transfectants were normalized to that of WT SH-SY5Y cells as standards. The bars represent the mean + SEM of three independent experiments. Statistical significance vs. standards was assessed with ANOVA. * p < 0.05; ** p < 0.01.
Ijms 24 03141 g006
Figure 7. AAV9-mediated GFP transduction is more efficient in U-87 MG than in SH-SY5Y cells. WT U-87 MG and SH-SY5Y cells were incubated with AAV9-GFP (4 × 10⁴ vg/cell) for 72 h. GFP expression was then analyzed with imaging flow cytometry. (AC) Representative flow cytometry histograms and fluorescent images showing the SDC4 and GFP expression levels in SH-SY5Y and U-87 MG cells treated with AAV9-GFP. Scale bar = 20 μm. (D,E) Detected SDC4 and GFP expression levels of AAV9-treated U-87 MG cells were normalized to that of SH-SY5Y cells as standards. The bars represent the mean + SEM of three independent experiments. Statistical significance vs. standards was assessed with ANOVA. * p < 0.05; ** p < 0.01.
Ijms 24 03141 g007
Table 1. The AAV9 interactome in SDC4 transfectants.
UniProtNumber UniquePeptide CountRelativePeptide
Count
% CoverageMWProtein Name
P31431470.10919.221,641.7Syndecan-4
P2603812271.28623.967,820.6Moesin
P18206560.2867.1123,800.4Vinculin
Q9H0U411210.77855.722,171.4Ras-related protein Rab-1B
P511496140.66738.223,490Ras-related protein Rab-7a
P624917140.66734.324,393.7Ras-related protein Rab-11A
Q96FV9360.2869.475,667THO complex subunit 1
Q8NI279150.7147.7182,776.2THO complex subunit 2
Q86V81590.42936.626,888.1THO complex subunit 4
O4329030642.37043.290,255.5U4/U6.U5 tri-snRNP-associated protein 1
Q8WVK216643.04839.418,860.3U4/U6.U5 small nuclear ribonucleoprotein 27 kDa protein
Q9BV40340.1903811,438.4Vesicle-associated membrane protein 8
Q13838580.38116.848,991.8Spliceosome RNA helicase DDX39B
Q53FV3330.1439.646,268.3COP9 signalosome subunit 4 variant (Fragment)
P265839261.23823.324,894High mobility group protein B1
Q15436340.6674.886,161.6Protein transport protein Sec23A
P16949491.50024.817,302.7Stathmin
A0A024R210340.66716.813,938.6Interferon-induced transmembrane protein 1 (9–27), isoform CRA_a
P170965345.66741.111,676.1High mobility group protein HMG-I/HMG-Y
Q7Z3Y83330.0093.949,822.8Keratin, type I cytoskeletal 27
F8VV574130.00426.512,157.3Keratin, type II cytoskeletal 5 (Fragment)
Q0241312211.00012113,748.6Desmoglein-1: desmosome resident
P1592411150.7145.2331,776.7Desmoplakin
Disclaimer/Publisher’s Note: The statements, opinions and data contained in all publications are solely those of the individual author(s) and contributor(s) and not of MDPI and/or the editor(s). MDPI and/or the editor(s) disclaim responsibility for any injury to people or property resulting from any ideas, methods, instructions or products referred to in the content.

