
Substituent Effects of the Nitrogen Heterocycle on Indole and Quinoline HDN Performance: A Combination of Experiments and Theoretical Study

Abstract
:1. Introduction
2. Results and Discussion
2.1. HDN Behaviors of Indole and Quinoline on the Ni-Mo-S/γ-Al2O3 Catalyst
2.1.1. Experimental Phenomenon
2.1.2. Theoretical Explanation
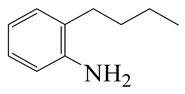
2.2. Substituent Effects of the Heterocycle on the HDN Behavior
2.2.1. Substituent Effects on the Indole HDN
2.2.2. Theoretical Explanation
2.2.3. Substituent Effects on the Quinoline Self-HDN Behavior on Ni-Mo-S/γ-Al2O3
2.2.4. Theoretical Explanation
2.2.5. Substituent Effects on Quinoline HDN Competitive Ability
2.2.6. Theoretical Explanation
3. Materials and Methods
3.1. Experimental
3.1.1. Preparation of the NiMo/γ-Al2O3 Catalysts
3.1.2. HDN Evaluation and Analysis
3.2. Theoretical Calculation
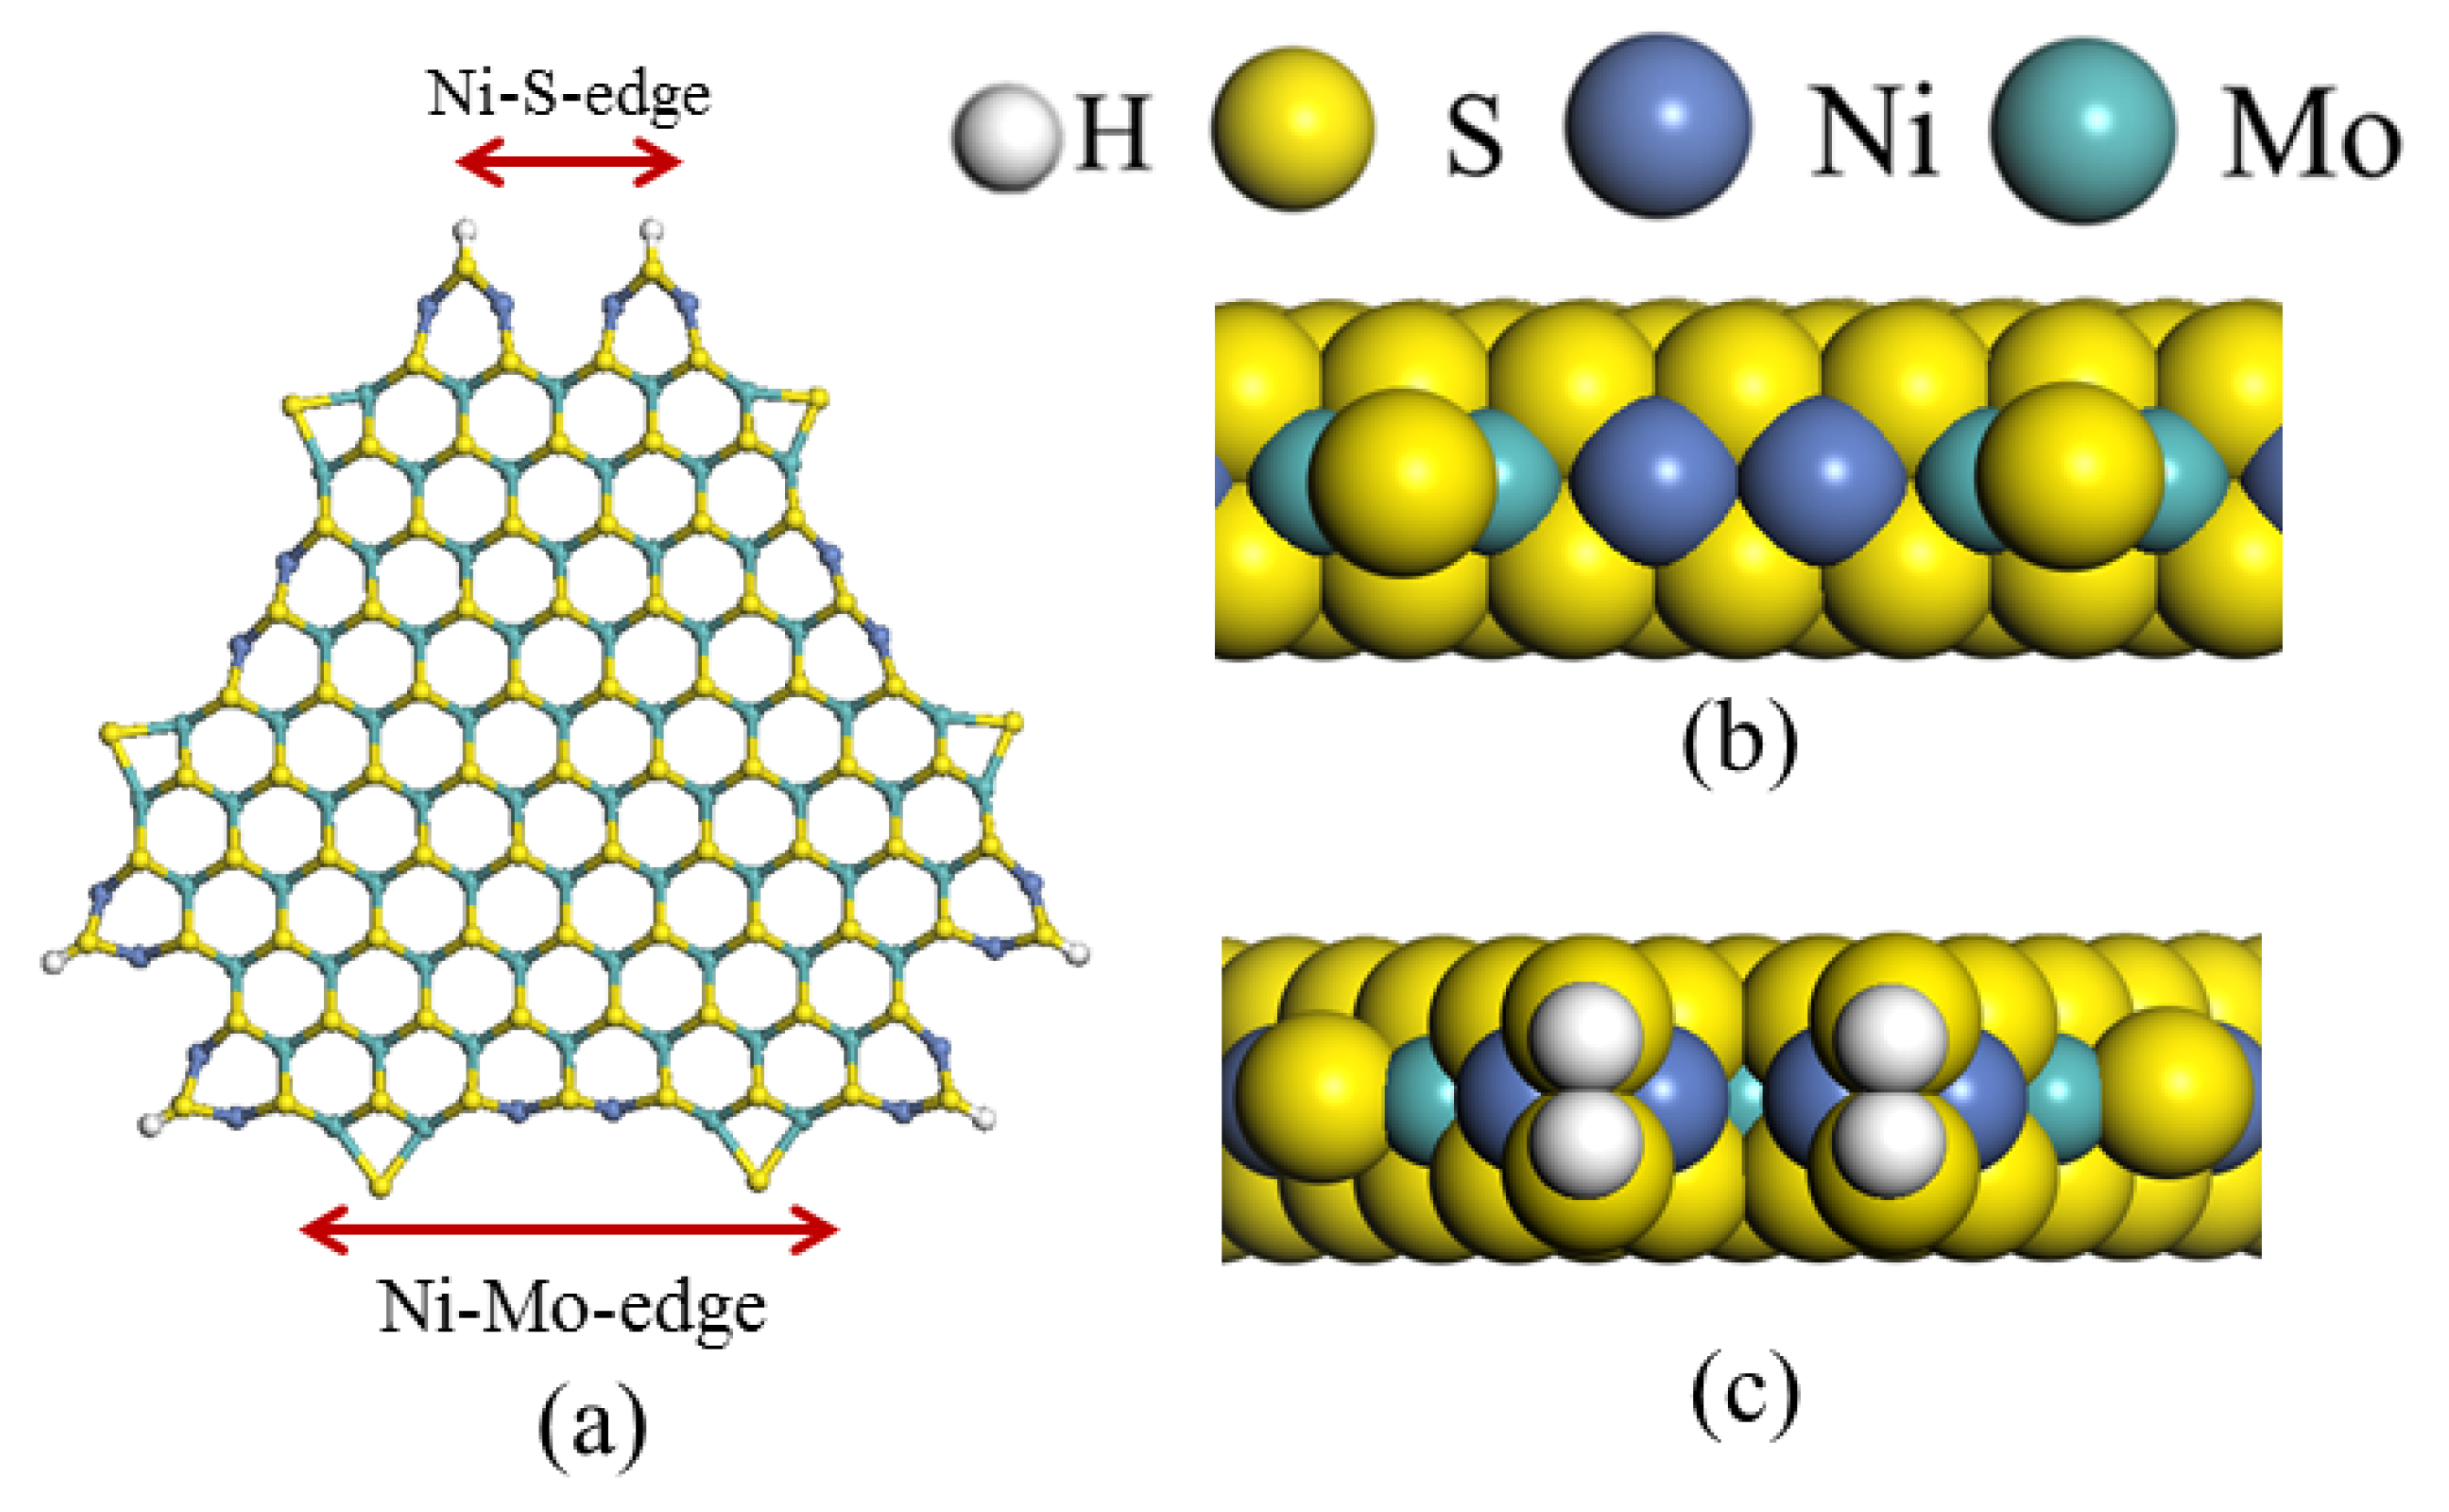
3.2.1. Modeling
3.2.2. Computational Methods
4. Conclusions
Supplementary Materials
Author Contributions
Funding
Institutional Review Board Statement
Informed Consent Statement
Data Availability Statement
Conflicts of Interest
References
- Klimov, O.V.; Nadeina, K.A.; Vatutina, Y.V.; Stolyarova, E.A.; Danilova, I.G.; Gerasimov, E.Y.; Prosvirin, I.P.; Noskov, A.S. CoMo/Al2O3 hydrotreating catalysts of diesel fuel with improved hydrodenitrogenation activity. Catal. Today 2017, 307, 73–83. [Google Scholar] [CrossRef]
- Permyakov, E.A.; Dorokhov, V.S.; Maximov, V.V.; Nikulshin, P.A.; Pimerzin, A.A.; Kogan, V.M. Computational and experimental study of the second metal effect on the structure and properties of bi-metallic MeMoS-sites in transition metal sulfide catalysts. Catal. Today 2017, 305, 19–27. [Google Scholar] [CrossRef]
- Nikulshin, P.A.; Salnikov, V.A.; Mozhaev, A.V.; Minaev, P.P.; Kogan, V.M.; Pimerzin, A.A. Relationship between active phase morphology and catalytic properties of the carbon–alumina-supported Co(Ni)Mo catalysts in HDS and HYD reactions. J. Catal. 2014, 309, 386–396. [Google Scholar] [CrossRef]
- Prins, R. Catalytic hydrodenitrogenation. Adv. Catal. 2001, 46, 399–464. [Google Scholar] [CrossRef]
- Zhao, Y.; Czyzniewska, J.; Prins, R. Mechanism of the Direct Hydrodenitrogenation of Naphthylamine on Sulfided NiMo/Al2O3. Catal. Lett. 2003, 88, 155–162. [Google Scholar] [CrossRef]
- Kanda, W.; Siu, I.; Adjaye, J.; Nelson, A.E.; Gray, M.R. Inhibition and Deactivation of Hydrodenitrogenation (HDN) Catalysts by Narrow-Boiling Fractions of Athabasca Coker Gas Oil. Energy Fuels 2004, 18, 539–546. [Google Scholar] [CrossRef]
- Egorova, M.; Prins, R. Hydrodesulfurization of dibenzothiophene and 4,6-dimethyldibenzothiophene over sulfided NiMo/gamma-Al2O3, CoMo/gamma-Al2O3, and Mo/gamma-Al2O3 catalysts. J. Catal. 2004, 225, 417–427. [Google Scholar] [CrossRef]
- Turaga, U.T.; Ma, X.; Song, C. Influence of nitrogen compounds on deep hydrodesulfurization of 4,6-dimethyldibenzothiophene over Al2O3-and MCM-41-supported Co-Mo sulfide catalysts. Catal. Today 2003, 86, 265–275. [Google Scholar] [CrossRef]
- Sau, M.; Basak, K.; Manna, U.; Santra, M.; Verma, R.P. Effects of organic nitrogen compounds on hydrotreating and hydrocracking reactions. Catal. Today 2005, 109, 112–119. [Google Scholar] [CrossRef]
- Kogan, V.M.; Gaziev, R.G.; Lee, S.W.; Rozhdestvenskaya, N.N. Radioisotopic study of (Co)Mo/Al2O3 sulfide catalysts for HDS: Part III. Poisoning by N-containing compounds. Appl. Catal. A 2003, 251, 187–198. [Google Scholar] [CrossRef]
- Egorova, M.; Prins, R. Competitive hydrodesulfurization of 4,6-dimethyldibenzothiophene, hydrodenitrogenation of 2-methylpyridine, and hydrogenation of naphthalene over sulfided NiMo/gamma-Al2O3. J. Catal. 2004, 224, 278–287. [Google Scholar] [CrossRef]
- Wei, Q.; Wen, S.; Tao, X.; Zhang, T.; Zhou, Y.; Chung, K.; Xu, C. Hydrodenitrogenation of basic and non-basic nitrogen-containing compounds in coker gas oil. Fuel Process. Technol. 2015, 129, 76–84. [Google Scholar] [CrossRef]
- Tao, Z.; Zhang, L.; Zhou, Y.; Qiang, W.; Chung, K.H.; Zhao, S.; Xu, C.; Quan, S. Transformation of Nitrogen Compounds in Deasphalted Oil Hydrotreating: Characterized by Electrospray Ionization Fourier Transform-Ion Cyclotron Resonance Mass Spectrometry. Energy Fuels 2013, 27, 2952–2959. [Google Scholar] [CrossRef]
- Li, X. Kinetics of the HDS of 4,6-dimethyldibenzothiophene and its hydrogenated intermediates over sulfided Mo and NiMo on gamma-Al2O3. J. Catal. 2007, 250, 283–293. [Google Scholar] [CrossRef]
- Ding, S.J.; Zhou, Y.S.; Wei, Q.; Jiang, S.J.; Zhou, W.W. Substituent effects of 4,6-DMDBT on direct hydrodesulfurization routes catalyzed by Ni-Mo-S active nanocluster-A theoretical study. Catal. Today 2018, 305, 28–39. [Google Scholar] [CrossRef]
- Grønborg, S.S.; Šarić, M.; Moses, P.G.; Rossmeisl, J.; Lauritsen, J.V. Atomic scale analysis of sterical effects in the adsorption of 4,6-dimethyldibenzothiophene on a CoMoS hydrotreating catalyst. J. Catal. 2016, 344, 121–128. [Google Scholar] [CrossRef]
- Gutiérrez, O.Y.; Klimova, T. Effect of the support on the high activity of the (Ni)Mo/ZrO2 –SBA-15 catalyst in the simultaneous hydrodesulfurization of DBT and 4,6-DMDBT. J. Catal. 2011, 281, 50–62. [Google Scholar] [CrossRef]
- Zhao, Y.; Prins, R.; Zhao, Y. Mechanisms of hydrodenitrogenation of alkylamines and hydrodesulfurization of alkanethiols on NiMo/Al2O3, CoMo/Al2O3, and Mo/Al2O3. J. Catal. 2005, 229, 213–226. [Google Scholar] [CrossRef]
- Bunch, A.; Zhang, L.; Karakas, G.; Ozkan, U.S. Reaction network of indole hydrodenitrogenation over NiMoS/γ-Al2O3 catalysts. Appl. Catal. A 2000, 190, 51–60. [Google Scholar] [CrossRef]
- Al-Megren, H.A.; González-Cortés, S.L.; Xiao, T.; Green, M.L.H. A comparative study of the catalytic performance of Co-Mo and Co(Ni)-W carbide catalysts in the hydrodenitrogenation (HDN) reaction of pyridine. Appl. Catal. A 2007, 329, 36–45. [Google Scholar] [CrossRef]
- Hrabar, A.; Hein, J.; Gutiérrez, O.Y.; Lercher, J.A. Selective poisoning of the direct denitrogenation route in o-propylaniline HDN by DBT on Mo and NiMo/γ-Al2O3 sulfide catalysts. J. Catal. 2011, 281, 325–338. [Google Scholar] [CrossRef]
- Gutiérrez, O.Y.; Singh, S.; Schachtl, E.; Kim, J.; Kondratieva, E.; Hein, J.; Lercher, J.A. Effects of the Support on the Performance and Promotion of (Ni)MoS2 Catalysts for Simultaneous Hydrodenitrogenation and Hydrodesulfurization. ACS Catal. 2014, 4, 1487–1499. [Google Scholar] [CrossRef]
- Hein, D.C.J.; Hrabar, A.; Jentys, A.; Gutiérrez, O.Y. γ-Al2O3-Supported and Unsupported (Ni)MoS2 for the Hydrodenitrogenation of Quinoline in the Presence of Dibenzothiophene. Chem. Cat. Chem. 2014, 6, 485–499. [Google Scholar] [CrossRef]
- Cattaneo, R.; Rota, F.; Prins, R. An XAFS Study of the Different Influence of Chelating Ligands on the HDN and HDS of γ-Al2O3-Supported NiMo Catalysts. J. Catal. 2001, 199, 318–327. [Google Scholar] [CrossRef]
- Jiao, J.Q.; Fu, J.Y.; Wei, Y.C.; Zhao, Z.; Duan, A.J.; Xu, C.M.; Li, J.M.; Song, H.; Zheng, P.; Wang, X.L.; et al. Al-modified dendritic mesoporous silica nanospheres-supported NiMo catalysts for the hydrodesulfurization of dibenzothiophene: Efficient accessibility of active sites and suitable metal-support interaction. J. Catal. 2017, 356, 269–282. [Google Scholar] [CrossRef]
- Li, G.; Liu, Y.; Tang, Z.; Liu, C. Effects of rehydration of alumina on its structural properties, surface acidity, and HDN activity of quinoline. Appl. Catal. A 2012, 437, 79–89. [Google Scholar] [CrossRef]
- Aboul-Gheit, A.K. Comparison of the hydrodenitrogenation of the petroleum model nitrogen compounds quinoline and indole. Appl. Catal. A 1985, 16, 39–47. [Google Scholar] [CrossRef]
- Callant, M.; Holder, K.A.; Viehe, H.G.; Grange, P.; Delmon, B. Methylation of indole during catalytic tests for hydrodenitrogenation (HDN) reactions. J. Mol. Catal. A Chem. 1995, 97, 57–64. [Google Scholar] [CrossRef]
- Nguyen, M.T.; Pirngruber, G.D.; Chainet, F.; Tayakoutfayolle, M.; Geantet, C. Indole Hydrodenitrogenation over Alumina and Silica-Alumina-Supported Sulfide Catalysts-Comparison with Quinoline. Ind. Eng. Chem. Res. 2017, 56, 11088–11099. [Google Scholar] [CrossRef]
- Kim, S.C.; Massoth, F.E. Hydrodenitrogenation Activities of Methyl-Substituted Indoles. J. Catal. 2000, 189, 70–78. [Google Scholar] [CrossRef]
- Kim, S.C.; Simons, J.; Massoth, F.E. HDN Activities of Methyl-Substituted Quinolines. J. Catal. 2002, 212, 201–206. [Google Scholar] [CrossRef]
- Krebs, E.; Silvi, B.; Raybaud, P. Mixed sites and promoter segregation: A DFT study of the manifestation of Le Chatelier's principle for the Co(Ni)MoS active phase in reaction conditions. Catal. Today 2008, 130, 160–169. [Google Scholar] [CrossRef]
- Dinter, N.; Rusanen, M.; Raybaud, P.; Kasztelan, S.; Silva, P.D.; Toulhoat, H. Temperature-programed reduction of unpromoted MoS2 -based hydrodesulfurization catalysts: Experiments and kinetic modeling from first principles. J. Catal. 2009, 267, 67–77. [Google Scholar] [CrossRef]
- Schweiger, H.; Raybaud, P.; Kresse, G.; Toulhoat, H. Shape and Edge Sites Modifications of MoS2 Catalytic Nanoparticles Induced by Working Conditions: A Theoretical Study. J. Catal. 2002, 207, 76–87. [Google Scholar] [CrossRef]
- Travert, A.; Nakamura, H.; Santen, R.A.V.; Cristol, S.; Paul, J.; Edmond, P. Hydrogen Activation on Mo-Based Sulfide Catalysts, a Periodic DFT Study. J. Am. Chem. Soc. 2002, 124, 7084–7095. [Google Scholar] [CrossRef]
- Raybaud, P. Understanding and predicting improved sulfide catalysts: Insights from first principles modeling. Appl. Catal. A 2007, 322, 76–91. [Google Scholar] [CrossRef]
- Humbert, S.; Izzet, G.; Raybaud, P. Competitive adsorption of nitrogen and sulphur compounds on a multisite model of NiMoS catalyst: A theoretical study. J. Catal. 2016, 333, 78–93. [Google Scholar] [CrossRef]
- Krebs, E.; Daudin, A.; Raybaud, P. A DFT Study of CoMoS and NiMoS Catalysts: From Nano-Crystallite Morphology to Selective Hydrodesulfurization. Oil. Gas Sci. Technol. 2009, 64, 707–718. [Google Scholar] [CrossRef]
- Krebs, E.; Silvi, B.; Daudin, A.; Raybaud, P. A DFT study of the origin of the HDS/HydO selectivity on Co(Ni)MoS active phases. J. Catal. 2008, 260, 276–287. [Google Scholar] [CrossRef]
- Zheng, P.; Duan, A.; Chi, K.; Zhao, L.; Zhang, C.; Xu, C.; Zhao, Z.; Song, W.; Wang, X.; Fan, J. Influence of sulfur vacancy on thiophene hydrodesulfurization mechanism at different MoS2 edges: A DFT study. Chem. Eng. Sci. 2017, 164, 292–306. [Google Scholar] [CrossRef]
- Lin, Z. Pulay forces in density functional theory for periodic and molecular systems. Phys. Lett. A 2002, 299, 413–417. [Google Scholar] [CrossRef]
- Ding, S.; Jiang, S.; Zhou, Y.; Wei, Q.; Zhou, W. Catalytic characteristics of active corner sites in Co mathContainer Loading Mathjax Mo mathContainer Loading Mathjax S nanostructure hydrodesulfurization—A mechanism study based on DFT calculations. J. Catal. 2017, 345, 24–38. [Google Scholar] [CrossRef]
- Moses, P.G.; Hinnemann, B.; Topsøe, H.; Nørskov, J.K. The effect of Co-promotion on MoS2 catalysts for hydrodesulfurization of thiophene: A density functional study. J. Catal. 2009, 268, 201–208. [Google Scholar] [CrossRef]
- Jian, M.; Prins, R. Kinetic study of the HDN of quinoline over NiMo(P)/Al2O3 catalysts. Stud. Surf. Sci. Catal. 1998, 113, 111–123. [Google Scholar] [CrossRef]
- Besenbacher, F.; Brorson, M.; Clausen, B.S.; Helveg, S.; Hinnemann, B.; Kibsgaard, J.; Lauritsen, J.V.; Moses, P.G.; Nørskov, J.K.; Topsøe, H. Recent STM, DFT and HAADF-STEM studies of sulfide-based hydrotreating catalysts: Insight into mechanistic, structural and particle size effects. Catal. Today 2008, 130, 86–96. [Google Scholar] [CrossRef]
- Damyanova, S.; Andonova, S.; Stereva, I.; Vladov, C.; Petrov, L.; Grange, P. Molybdenum HDS catalysts supported on niobia-silica. React. Kinet. Catal. Lett. 2003, 79, 35–42. [Google Scholar] [CrossRef]
- Zhu, Y.; Ramasse, Q.M.; Brorson, M.; Moses, P.G.; Hansen, L.P.; Topsøe, H.; Kisielowski, C.F.; Helveg, S. Location of Co and Ni promoter atoms in multi-layer MoS2 nanocrystals for hydrotreating catalysis. Catal. Today 2016, 261, 75–81. [Google Scholar] [CrossRef]
- Lauritsen, J.V.; Kibsgaard, J.; Olesen, G.H.; Moses, P.G.; Hinnemann, B.; Helveg, S.; Nørskov, J.K.; Clausen, B.S.; Topsøe, H.; Lægsgaard, E. Location and coordination of promoter atoms in Co- and Ni-promoted MoS2 -based hydrotreating catalysts. J. Catal. 2007, 249, 220–233. [Google Scholar] [CrossRef]
- Dupont, C.; Lemeur, R.; Daudin, A.; Raybaud, P. Hydrodeoxygenation pathways catalyzed by MoS2 and NiMoS active phases: A DFT study. J. Catal. 2011, 279, 276–286. [Google Scholar] [CrossRef]
- Weber, T.; Veen, J.A.R.V. A density functional theory study of the hydrodesulfurization reaction of dibenzothiophene to biphenyl on a single-layer NiMoS cluster. Catal. Today 2008, 130, 170–177. [Google Scholar] [CrossRef]
- Maragakis, P.; Andreev, S.A.; Brumer, Y.; Reichman, D.R.; Kaxiras, E. Adaptive nudged elastic band approach for transition state calculation. J. Chem. Phys. 2002, 117, 4651–4658. [Google Scholar] [CrossRef]
- Ochterski, J.W. Thermochemistry in Gaussian; Gaussian Inc.: Wallingford, CT, USA, 2000. [Google Scholar]
- Hammer, B. Improved adsorption energetics within density-functional theory using revised Perdew-Burke-Ernzerhof functionals. Phys. Rev. B 1999, 59, 7413–7421. [Google Scholar] [CrossRef]
- Inada, Y.; Orita, H. Efficiency of numerical basis sets for predicting the binding energies of hydrogen bonded complexes: Evidence of small basis set superposition error compared to Gaussian basis sets. J. Comput. Chem. 2008, 29, 225–232. [Google Scholar] [CrossRef]
- Delley, B. Efficient and accurate expansion methods for molecules in local density models. J. Chem. Phys. 1982, 76, 1949–1960. [Google Scholar] [CrossRef]
- Chigo Anota, E.; Cocoletzi, G.H. GGA-based analysis of the metformin adsorption on BN nanotubes. Physica E 2014, 56, 134–140. [Google Scholar] [CrossRef]
- Grimme, S. Semiempirical GGA-type density functional constructed with a long-range dispersion correction. J. Comput. Chem. 2006, 27, 1787–1799. [Google Scholar] [CrossRef]

| Indole | Quinoline | ||||
|---|---|---|---|---|---|
| Product | Formula | Structural | Product | Formula | Structural |
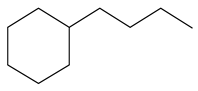
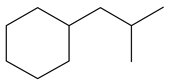
| Ethyl-cyclohexane (ECH) | C8H16 |  | Propyl-cyclohexane (PCH) | C9H18 | 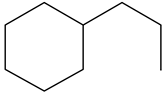 |
| Ethyl-benzene (EB) | C8H10 | 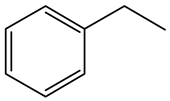 | Propyl-benzene (PB) | C9H12 |  |
| Ethyl-cyclohexene (ECHE) | C8H14 |  | Propyl-cyclohexene (PCHE) | C9H16 | 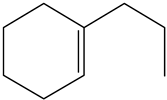 |
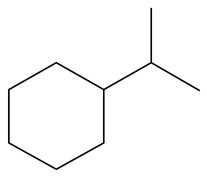
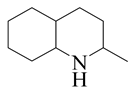
| o-Ethylaniline (OEA) | C8NH15 | 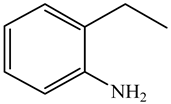 | Decahydroquinoline (DHQ) | C9NH17 | 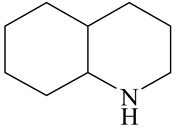 |
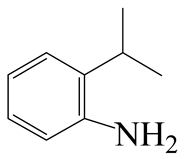
| Indoline (DHI) | C8NH9 |  | o-Propylaniline (OPA) | C9NH13 | 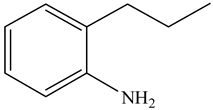 |
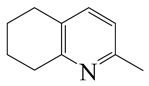
| Indole (IND) | C8NH7 | 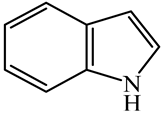 | 5,6,7,8-Tetrahydroquinoline (THQ-5) | C9NH11 | 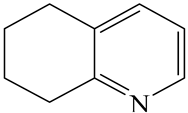 |
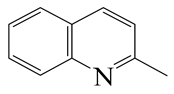
| Quinoline (QL) | C9NH7 | 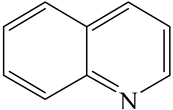 | |||
| 1,2,3,4-Tetrahydroquinoline (THQ-1) | C9NH11 | 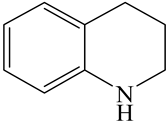 | |||
| Reactant | Relative Concentration, m/m% | ||||||||
|---|---|---|---|---|---|---|---|---|---|
| Indole | LHSV/h−1 | IND | DHI | OEA | ECHE | EB | ECH | ||
| 20.0 | 60.92 | 20.96 | 7.42 | 2.67 | 2.54 | 5.49 | |||
| 10.0 | 36.52 | 12.14 | 18.24 | 4.84 | 2.86 | 25.16 | |||
| 5.0 | 18.19 | 7.48 | 18.94 | 3.92 | 1.57 | 49.95 | |||
| 2.5 | 7.03 | 1.92 | 3.81 | 1.02 | 1.34 | 85.39 | |||
| Quinoline | LHSV/h−1 | THQ-1 | QL | THQ-5 | OPA | DHQ | PCHE | PB | PCH |
| 20.0 | 79.77 | 1.92 | 8.20 | 0.22 | 6.16 | 1.10 | 0.29 | 2.34 | |
| 10.0 | 64.89 | 1.49 | 11.83 | 1.10 | 10.99 | 2.45 | 0.52 | 7.25 | |
| 5.0 | 36.24 | 0.74 | 15.86 | 1.65 | 15.64 | 3.67 | 2.12 | 24.22 | |
| 2.5 | 21.46 | 0.39 | 15.30 | 1.82 | 11.70 | 2.77 | 1.82 | 43.74 | |
| Position | Step | Indole Adsorption | TS-1 | Hydrogen Activation | TS-2 |
| Ni-S-edge | Morphology |  | - | - | 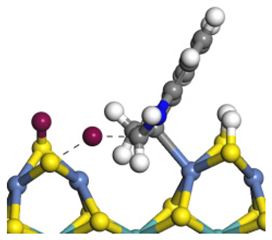 |
| ΔE/kJ·mol−1 | −124.18 | +128.27 | |||
| Ni-Mo-edge | Morphology | 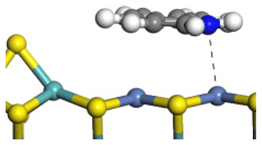 | 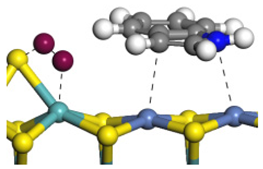 | 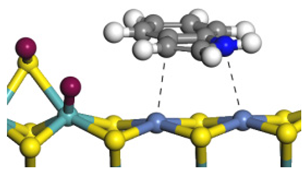 | 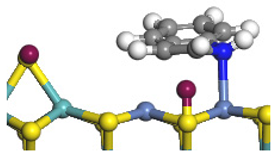 |
| ΔE/kJ·mol−1 | −121.63 | +145.09 | −108.42 | +129.65 | |
| Position | Step | Monohydrogen- Indole | TS-3 | DHI | Desorption |
| Ni-S-edge | Morphology |  | 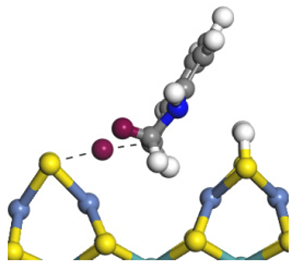 | 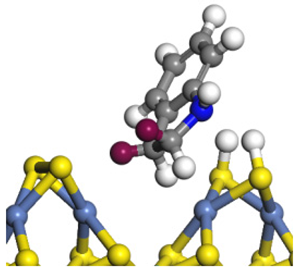 |  |
| ΔE/kJ·mol−1 | −96.20 | +108.75 | −202.39 | +163.85 | |
| Ni-Mo-edge | Morphology | 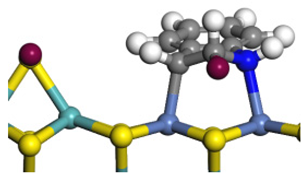 | 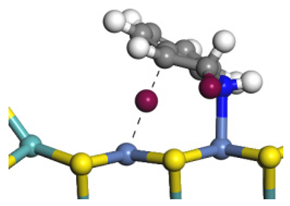 | 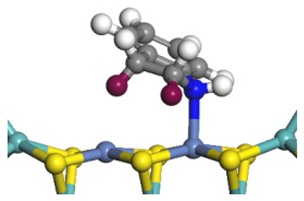 | 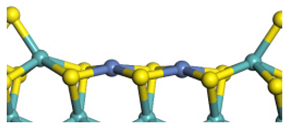 |
| ΔE/kJ·mol−1 | −133.33 | +101.24 | −220.00 | ||
 | |||||
| Position | Step | Quinoline Adsorption | TS-1 | Hydrogen Activation | TS-2 | Monohydrogen-Quinoline | TS-3 | Dihydrogen -Quinoline |
|---|---|---|---|---|---|---|---|---|
| Ni-S -edge | Morphology |  | - | - | 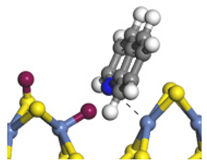 |  |  | 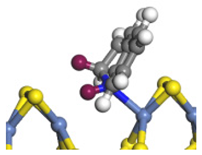 |
| ΔE/kJ·mol−1 | −169.22 | +140.22 | −109.88 | +114.82 | −87.56 | |||
| Ni-Mo -edge | Morphology |  |  | 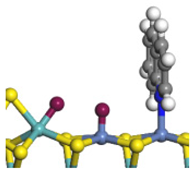 | 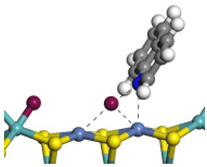 | 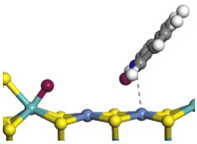 | 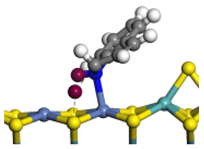 | 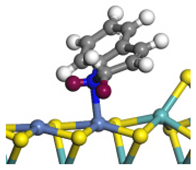 |
| ΔE/kJ·mol−1 | −146.34 | +90.67 | −85.79 | +115.98 | −137.52 | +64.83 | −82.22 | |
| Step | TS-4 | Hydrogen Activation | TS-5 | Tri-hydrogen -quinoline | TS-6 | THQ-1 | Desorption | |
| Ni-S -edge | Morphology | 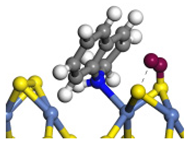 | 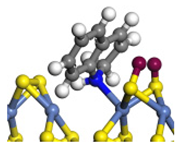 | 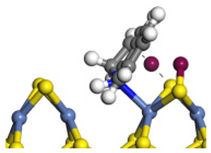 |  | 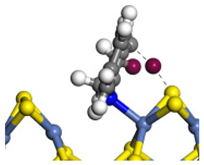 | 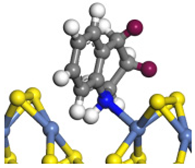 |  |
| ΔE/kJ·mol−1 | +127.12 | −186.74 | +102.68 | −110.58 | +85.99 | −143.26 | +163.85 | |
| Ni-Mo -edge | Morphology | 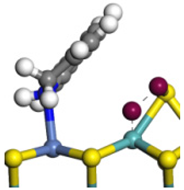 | 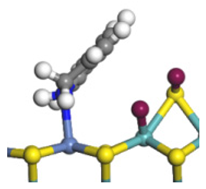 | 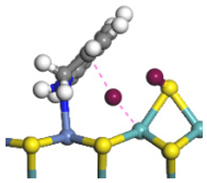 | 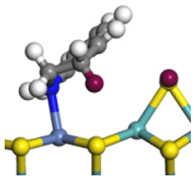 | 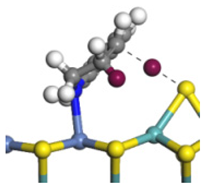 | 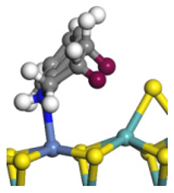 | 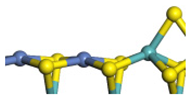 |
| ΔE/kJ·mol−1 | +144.33 | −100.79 | +95.55 | −81.09 | +76.77 | −198.53 | ||
 | ||||||||
| Reaction Pathway | SN2 | E2 Step1 | E2 Step2 |
|---|---|---|---|
| Reaction equation | 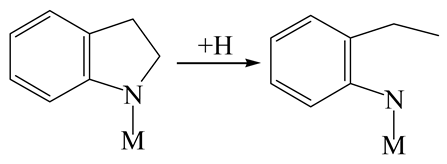 | 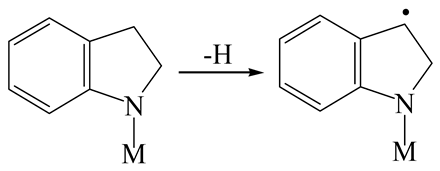 | 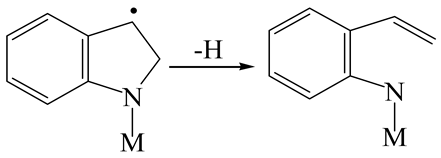 |
| Pre-hydrogenolysis | 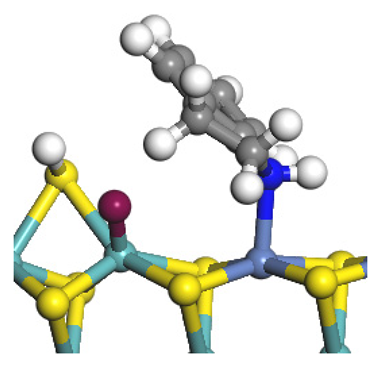 |  |  |
| Transition state | 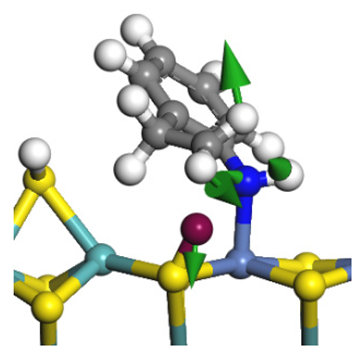 |  | 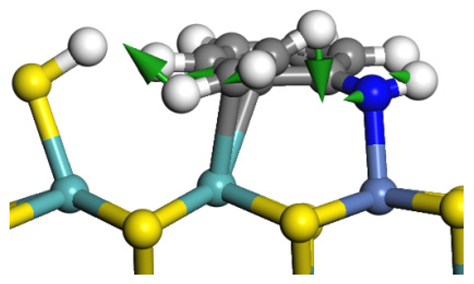 |
| Post-hydrogenolysis |  |  | 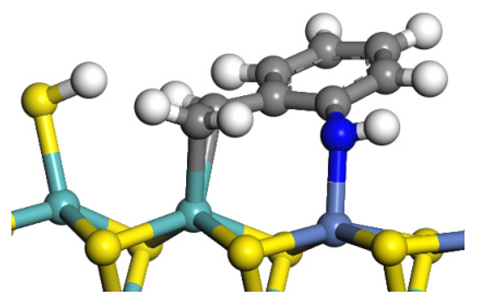 |
| Activation energy/kJ·mol−1 | +269.39 | +136.93 | +132.47 |
| Reaction energy/kJ·mol−1 | −57.87 | +56.75 | +59.02 |
 | |||
| Nitrogen Compounds |  DHI | 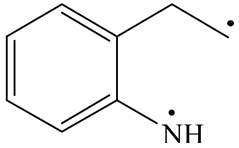 C–N Bond Cleavage | |
|---|---|---|---|
| Bonding Energy Difference/kJ·mol−1 | 281.84 | ||
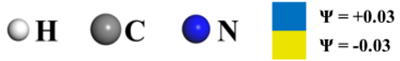
| Molecular orbitals participating in adsorption |  | 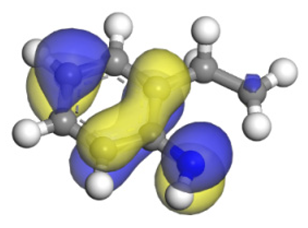 | 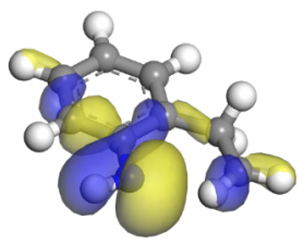 |
| MO Eigenvalue/eV | −4.56 | −4.51 | −5.76 |
| Adsorption morphology | 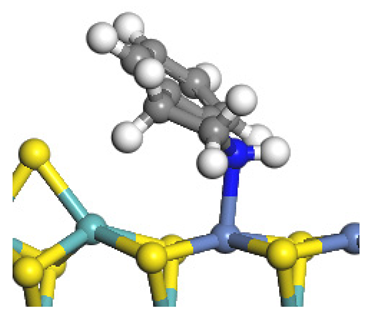 | 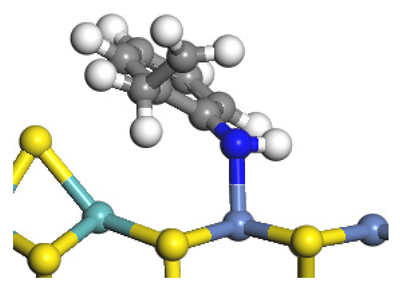 | |
| Adsorption energy/kJ·mol−1 | −156.88 | −258.59 | |
 | |||
| Reaction | 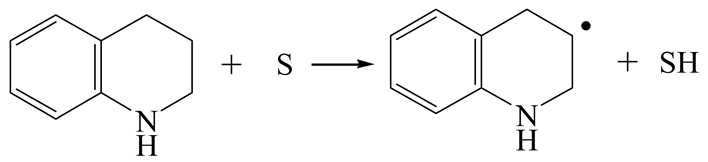 | 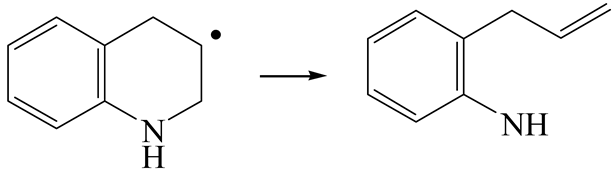 |
|---|---|---|
| Initial state | 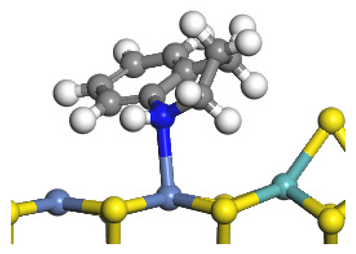 |  |
| Transition state |  | 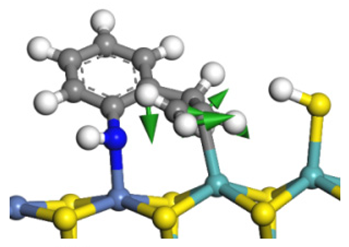 |
| Final state | 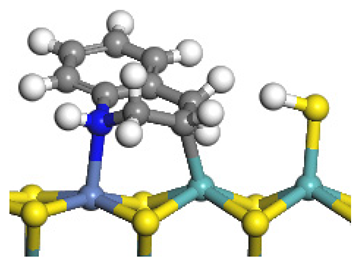 | 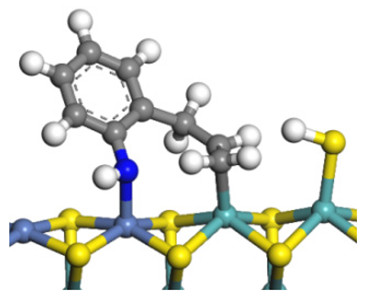 |
| Activation energy/kJ·mol−1 | +142.37 | +208.81 |
| Reaction energy/kJ·mol−1 | +75.97 | +95.02 |
 | ||
| Nitrogen Compounds | 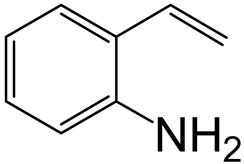 | 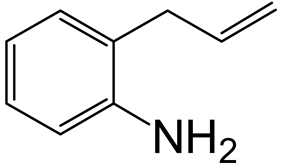 | ||
|---|---|---|---|---|
| Molecular orbitals participate in adsorption |  |  | 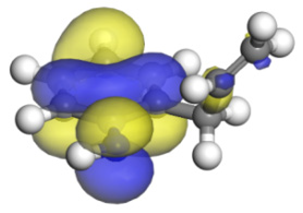 | 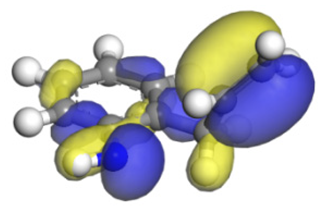 |
| MO Eigenvalue/eV | −4.84 | −5.72 | −4.91 | −5.90 |
 | ||||
| Reaction | 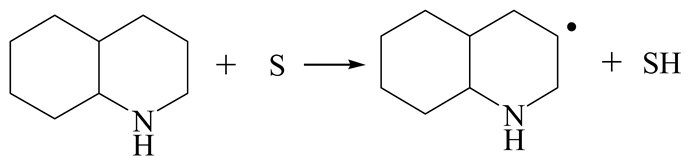 | 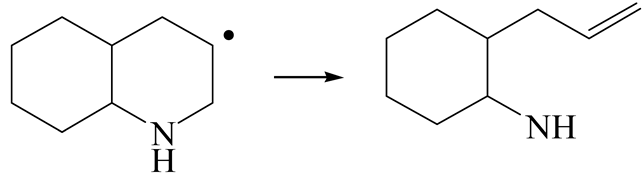 |
|---|---|---|
| Initial state |  | 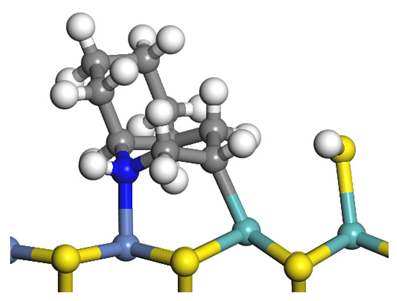 |
| Transition state | 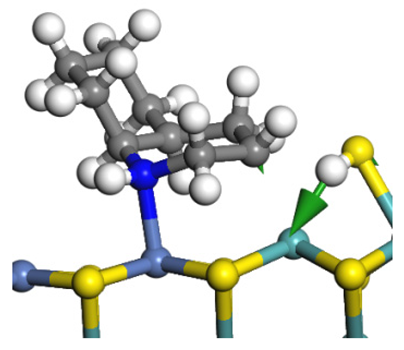 | 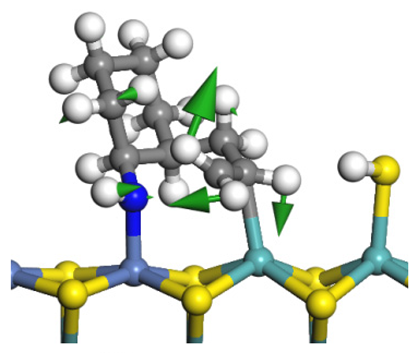 |
| Final state | 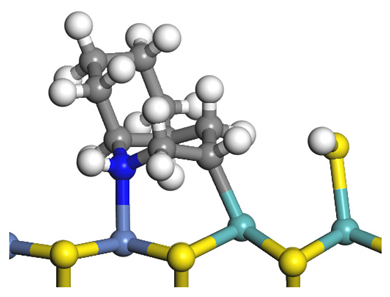 | 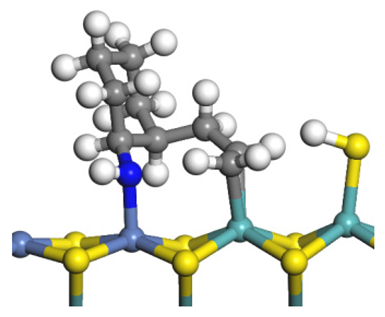 |
| Activation energy/kJ·mol−1 | +130.25 | +172.85 |
| Reaction energy/kJ·mol−1 | +81.54 | +80.44 |
 | ||
| Reactant | Relative Concentration of HDN Products, m/m% | ||||||
|---|---|---|---|---|---|---|---|
| 2-Methyl -indole | LHSV/h−1 | 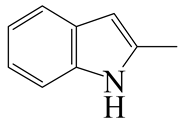 |  | 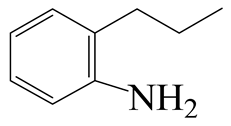 | 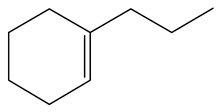 | 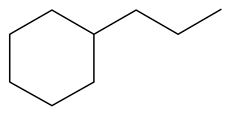 | 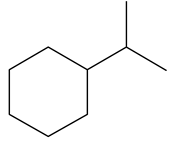 |
| 2-M-IND | DH-2-M-IND | OPA | PCHE | PCH | i-PCH | ||
| 20.0 | 68.96 | 10.84 | 7.42 | 1.91 | 14.17 | 0.59 | |
| 10.0 | 46.29 | 6.56 | 8.24 | 1.52 | 33.13 | 1.19 | |
| 5.0 | 27.40 | 2.09 | 4.33 | 2.09 | 52.95 | 2.81 | |
| 2.5 | 13.73 | 1.73 | 2.42 | 1.95 | 75.86 | 3.71 | |
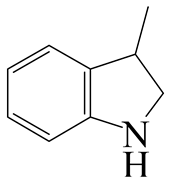
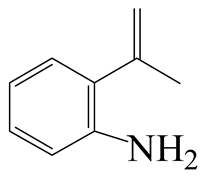
| 3-Methyl -indole | LHSV/h−1 | 3-M-IND | DH-3-M-IND | i-OPEA | i-OPA | i-PCHE | i-PCH |
 |  |  |  |  |  | ||
| 20.0 | 78.84 | 4.93 | 1.21 | 3.53 | 2.19 | 9.30 | |
| 10.0 | 59.14 | 4.82 | 1.24 | 5.76 | 2.17 | 26.87 | |
| 5.0 | 40.56 | 1.85 | 1.57 | 5.81 | 2.31 | 47.90 | |
| 2.5 | 22.11 | 0.66 | 1.58 | 3.73 | 1.43 | 70.49 | |
| Reaction | 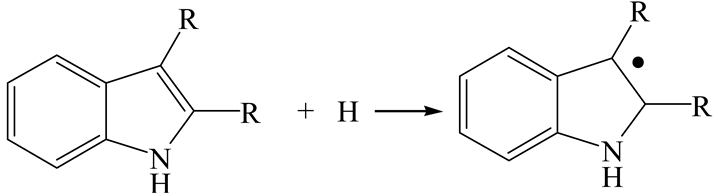 | ||
|---|---|---|---|
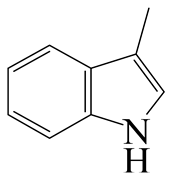
| Reactant | Indole | 2-Methyl-Indole | 3-Methyl-Indole |
| Adsorption morphology | 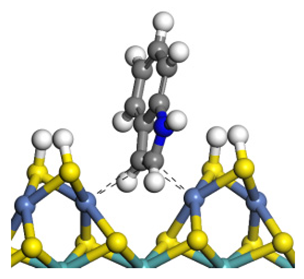 | 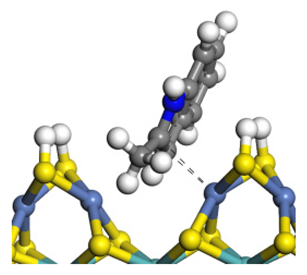 | 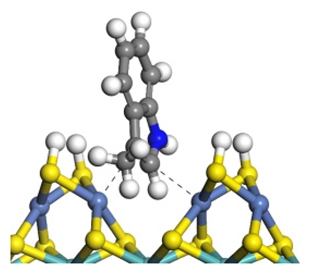 |
| Adsorption energy/kJ·mol−1 | −124.18 | −131.32 | −117.66 |
| Transition state | 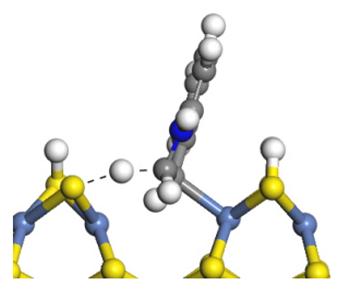 | 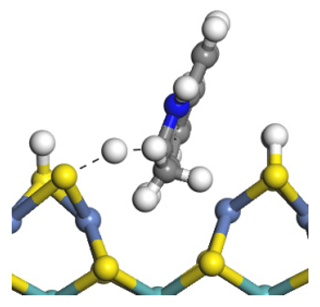 | 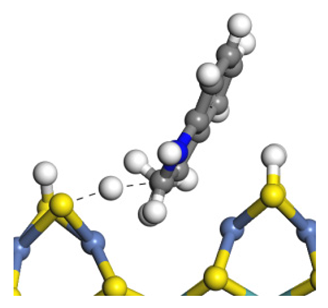 |
| Activation energy/kJ·mol−1 | +128.27 | +151.35 | +156.48 |
| Final state | 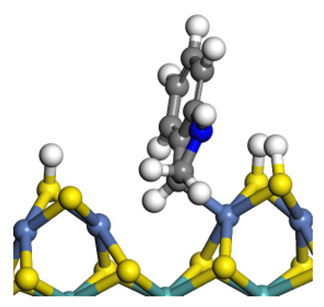 |  | 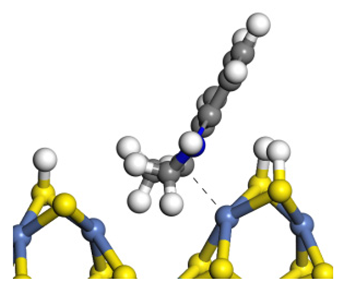 |
| Reaction energy/kJ·mol−1 | +32.29 | +60.74 | +72.57 |
 | |||
| Relative Concentration, m/m% | ||||||||
|---|---|---|---|---|---|---|---|---|
| 2-Methyl -quinoline LHSV/h−1 | 2-M- THQ-1 | OBA | 2-M-QL | 2-M- THQ-5 | 2-M-DHQ | 1-BCHE | 2-BCHE | BCH |
 |  |  |  |  |  |  |  | |
| 20.0 | 72.57 | 2.04 | 4.17 | 9.03 | 7.21 | 1.16 | 0.82 | 3.06 |
| 10.0 | 57.05 | 4.33 | 4.16 | 12.49 | 11.30 | 2.17 | 1.63 | 6.87 |
| 5.0 | 35.94 | 5.47 | 3.27 | 14.20 | 12.03 | 1.71 | 0.13 | 27.25 |
| 2.5 | 22.49 | 1.16 | 2.20 | 14.75 | 11.24 | 1.22 | 1.29 | 45.65 |
| 3-Methyl -quinoline LHSV/h−1 | 3-M- THQ-1 | 3-M-QL | 3-M- THQ-5 | i-OBA | 3-M-DHQ | 1-i-BCHE | 2-i-BCHE | i-BCH |
 |  |  |  |  |  |  |  | |
| 20.0 | 72.73 | 4.88 | 11.27 | 0.81 | 8.16 | 0.58 | 0.11 | 1.46 |
| 10.0 | 59.10 | 3.95 | 14.49 | 1.73 | 13.55 | 1.24 | 0.23 | 5.71 |
| 5.0 | 36.69 | 3.84 | 17.13 | 2.36 | 19.91 | 2.29 | 0.40 | 15.37 |
| 2.5 | 24.88 | 2.50 | 13.14 | 2.39 | 25.22 | 1.26 | 1.88 | 28.73 |
| Reaction | 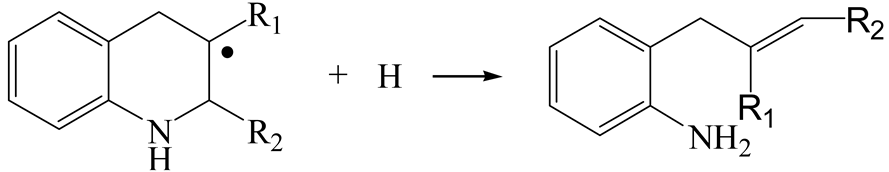 | ||
|---|---|---|---|
| Reactant | DHQ | 2-M-DHQ | 3-M-DHQ |
| Initial state |  |  |  |
| Transition state | 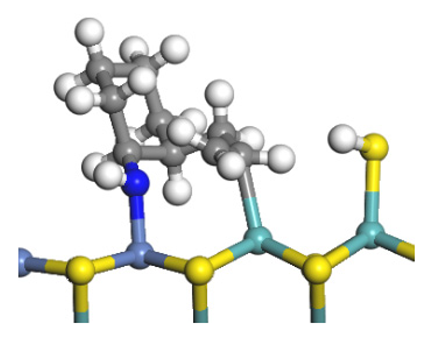 | 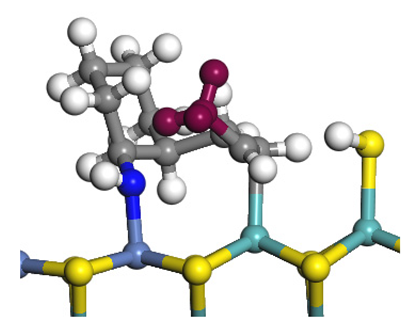 | 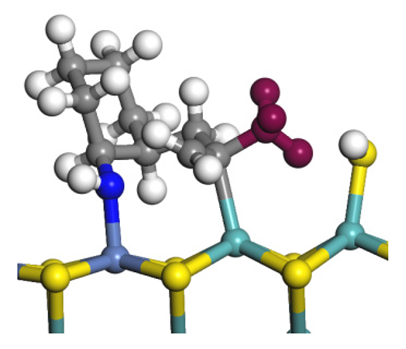 |
| Activation energy/kJ·mol−1 | +172.85 | +174.59 | +201.08 |
| Final state | 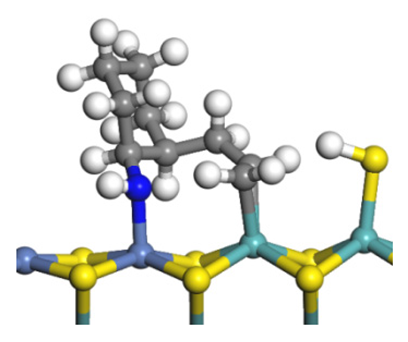 | 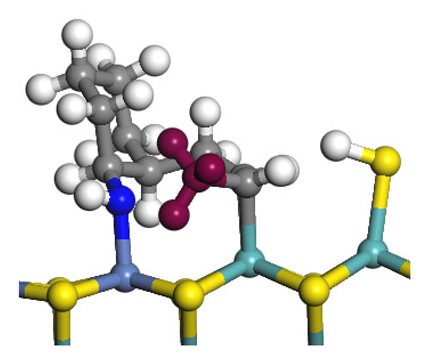 | 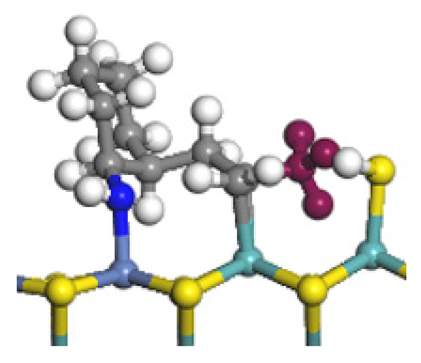 |
| Reaction energy/kJ·mol−1 | +80.44 | +86.71 | +82.93 |
 | |||
| Relative Concentration, m/m% | |||||||||
|---|---|---|---|---|---|---|---|---|---|
| 2-M-QL | LHSV/h−1 | 2-M- THQ-1 | OBA | 2-M-Q | 2-M- THQ-5 | 2-M-DHQ | 1-BCHE | 2-BCHE | BCH |
| 20.0 | 57.24 | 0.62 | 27.13 | 9.51 | 4.73 | 0.11 | 0.24 | 0.42 | |
| 10.0 | 48.86 | 2.61 | 25.62 | 12.59 | 9.31 | 0.14 | 0.17 | 0.70 | |
| 5.0 | 44.55 | 2.38 | 13.2 | 15.13 | 17.43 | 0.27 | 0.25 | 6.79 | |
| 2.5 | 26.85 | 4.96 | 7.27 | 12.26 | 25.5 | 1.14 | 0.41 | 21.61 | |
| QL | LHSV/h−1 | THQ-1 | Q | THQ-5 | DHQ | PB | PCHE | PCH | |
| 20.0 | 74.63 | 7.07 | 9.64 | 5.52 | 1.19 | 0.29 | 1.66 | ||
| 10.0 | 61.79 | 6.12 | 13.7 | 12.2 | 1.83 | 0.45 | 3.91 | ||
| 5.0 | 47.31 | 3.3 | 19.24 | 11.27 | 3.41 | 1.33 | 14.14 | ||
| 2.5 | 24.28 | 2.32 | 24.76 | 7.11 | 2.15 | 1.13 | 38.25 | ||
| Relative Concentration, m/m% | |||||||||
|---|---|---|---|---|---|---|---|---|---|
| 3-M-QL | LHSV/h−1 | 3-M- THQ-1 | 3-M -QL | 3-M- THQ-5 | i- OBA | 3-M -DHQ | 1-i- BCHE | 2-i- BCHE | i- BCH |
| 20.0 | 60.22 | 13.54 | 12.19 | 5.54 | 4.78 | 0.21 | 0.09 | 3.43 | |
| 10.0 | 56.34 | 11.67 | 12.01 | 3.82 | 11.07 | 0.25 | 0.1 | 4.74 | |
| 5.0 | 44.59 | 8.22 | 16.17 | 3.2 | 12.95 | 1.32 | 0.76 | 12.79 | |
| 2.5 | 29.24 | 4.42 | 16.49 | 3.02 | 18.34 | 2.00 | 1.12 | 25.37 | |
| QL | LHSV/h−1 | THQ-1 | Q | THQ-5 | DHQ | PB | PCHE | PCH | |
| 20.0 | 76.13 | 12.51 | 1.36 | 7.59 | 0 | 0.53 | 1.88 | ||
| 10.0 | 71.51 | 9.06 | 1.49 | 11.08 | 0 | 1.50 | 5.36 | ||
| 5.0 | 54.48 | 5.13 | 6.97 | 13.2 | 1.29 | 3.11 | 15.82 | ||
| 2.5 | 35.46 | 2.7 | 10.49 | 8.79 | 1.54 | 1.29 | 39.73 | ||
| Nitrogen Compound | Molecular Orbital of Lone Pair Electrons | Adsorption Morphology | N-Ni Bond Length/Å | Adsorption Energy/kJ·mol−1 |
|---|---|---|---|---|
| Quinoline |  | 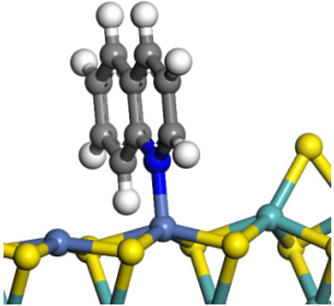 | 2.11 | −146.34 |
| 2-Mythel- quinoline | 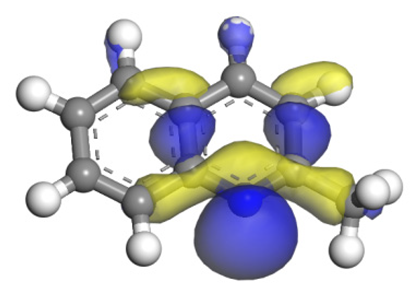 | 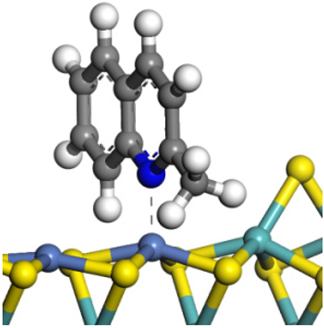 | 2.19 | −118.87 |
| 3-Mythel- quinoline | 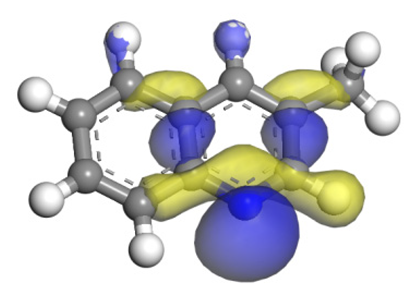 |  | 2.10 | −150.01 |
 | ||||
| Item | Parameter | ||
|---|---|---|---|
| Function | General Gradient Approximation Perdew–Burke–Ernzerhof Function (GGA-RPBE) [37,51,52] | ||
| Basis set | Double numerical plus polarization basis (DNP) [41,53] | ||
| Electron spin | Open shell/unrestricted | ||
| Symmetry | Asymmetry | ||
| Self-consistent field density convergence (SCF) | 2 × 10⁻⁵ | ||
| Thermal smearing | 1 × 10⁻³ Hartree (Ha) | ||
| Orbital cut-off | 4.90 angstroms (Å) | ||
| Core treatment | Effective core potentials (ECP) | ||
| Dispersion correction | Grimme 06 [54] | ||
| Exchange-correlation-dependent factor, s6 | 1.0 [55] | ||
| Damping coefficient, d | 20.0 [56] | ||
| Grimme 6.0 Atomic dispersion [57] | Element | Interaction distance, R0 | Dispersion coefficient C6 |
| H | 1.001 | 1.451 | |
| C | 1.452 | 18.134 | |
| N | 1.397 | 12.748 | |
| S | 1.683 | 57.729 | |
| Ni | 1.562 | 111.943 | |
| Mo | 1.639 | 255.686 | |
Disclaimer/Publisher’s Note: The statements, opinions and data contained in all publications are solely those of the individual author(s) and contributor(s) and not of MDPI and/or the editor(s). MDPI and/or the editor(s) disclaim responsibility for any injury to people or property resulting from any ideas, methods, instructions or products referred to in the content. |
© 2023 by the authors. Licensee MDPI, Basel, Switzerland. This article is an open access article distributed under the terms and conditions of the Creative Commons Attribution (CC BY) license (https://creativecommons.org/licenses/by/4.0/).
Share and Cite
Jiang, S.; Ding, S.; Zhou, Y.; Yuan, S.; Geng, X.; Cao, Z. Substituent Effects of the Nitrogen Heterocycle on Indole and Quinoline HDN Performance: A Combination of Experiments and Theoretical Study. Int. J. Mol. Sci. 2023, 24, 3044. https://doi.org/10.3390/ijms24033044
Jiang S, Ding S, Zhou Y, Yuan S, Geng X, Cao Z. Substituent Effects of the Nitrogen Heterocycle on Indole and Quinoline HDN Performance: A Combination of Experiments and Theoretical Study. International Journal of Molecular Sciences. 2023; 24(3):3044. https://doi.org/10.3390/ijms24033044
Chicago/Turabian StyleJiang, Shujiao, Sijia Ding, Yasong Zhou, Shenghua Yuan, Xinguo Geng, and Zhengkai Cao. 2023. "Substituent Effects of the Nitrogen Heterocycle on Indole and Quinoline HDN Performance: A Combination of Experiments and Theoretical Study" International Journal of Molecular Sciences 24, no. 3: 3044. https://doi.org/10.3390/ijms24033044
APA StyleJiang, S., Ding, S., Zhou, Y., Yuan, S., Geng, X., & Cao, Z. (2023). Substituent Effects of the Nitrogen Heterocycle on Indole and Quinoline HDN Performance: A Combination of Experiments and Theoretical Study. International Journal of Molecular Sciences, 24(3), 3044. https://doi.org/10.3390/ijms24033044