

Synthesis and Biological Evaluation of Potential Oncoimmunomodulator Agents

Abstract
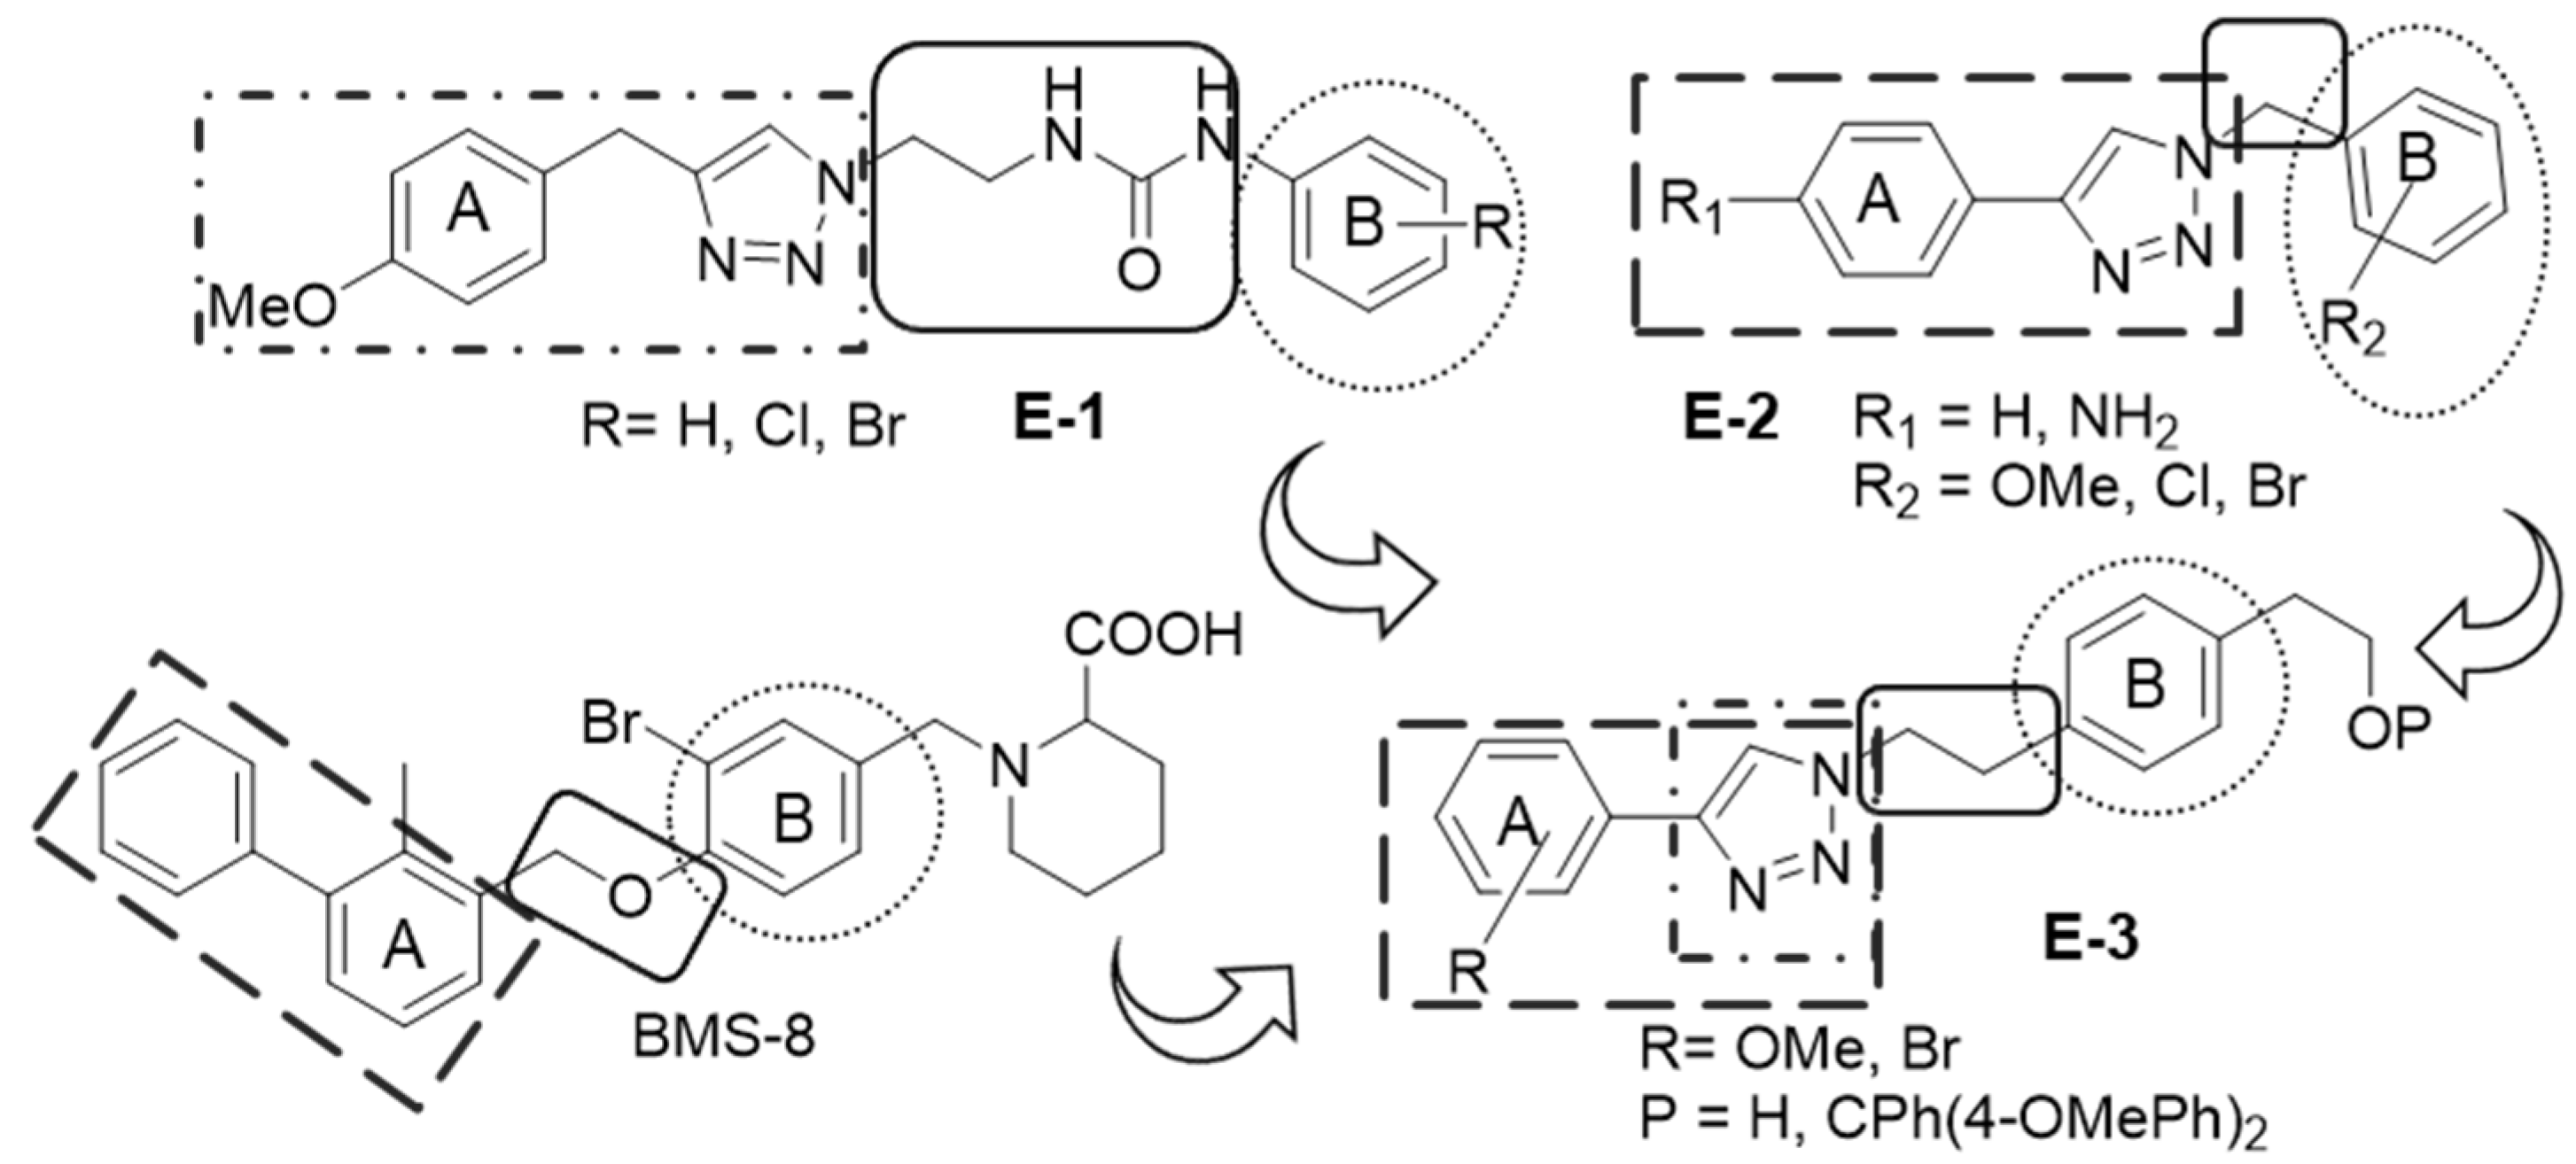
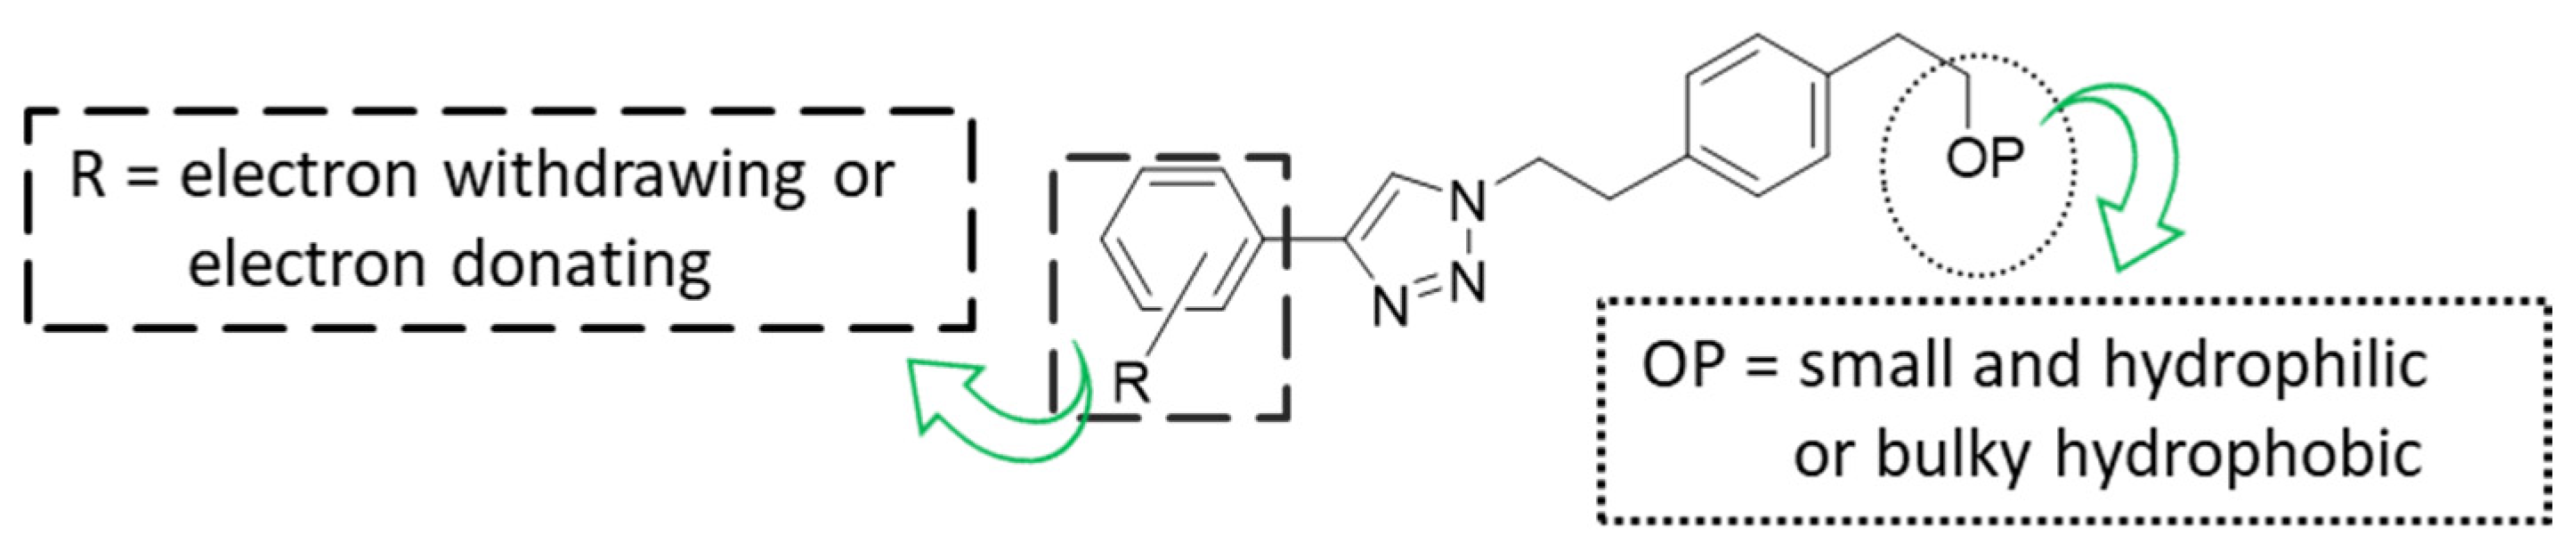
1. Introduction
2. Results
2.1. Synthetic Work
2.2. Biological Evaluation
2.2.1. Study of the Effect on Cell Viability
2.2.2. Study of the Effect on the Expression of Total PD-L1 and c-Myc in Tumor Cells
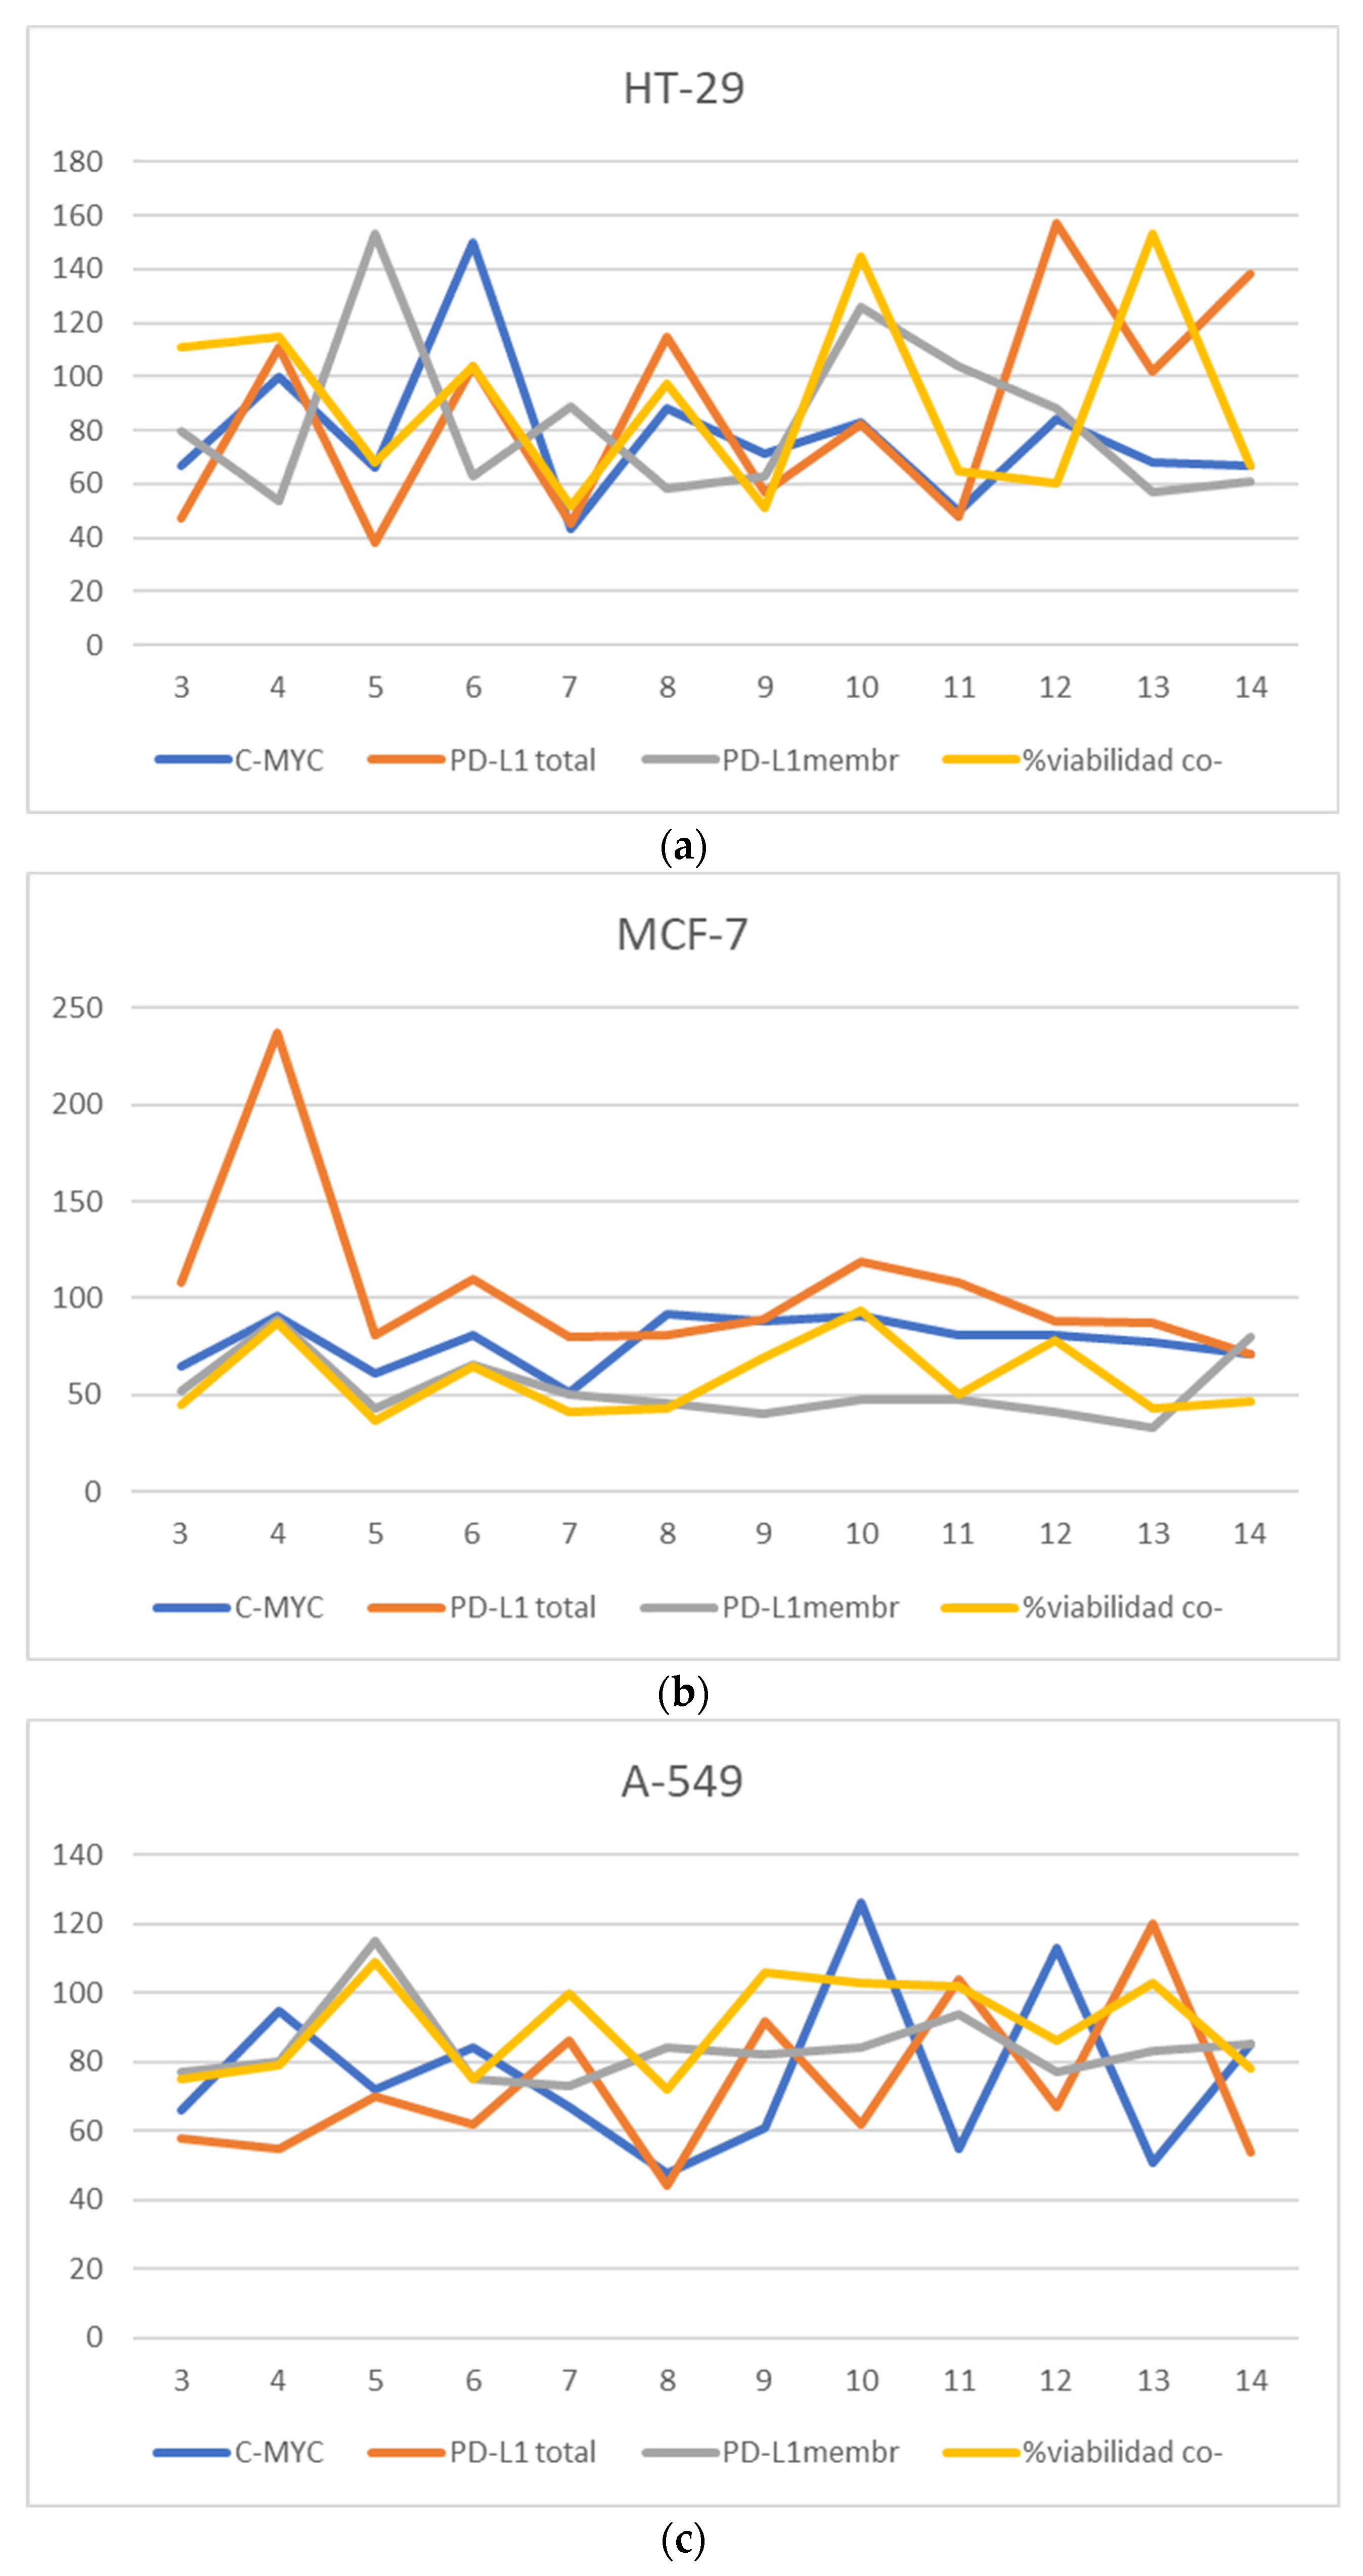
2.2.3. Study of the Effect on Viability of Cancer Cells in Co-Culture with Jurkat T Cells
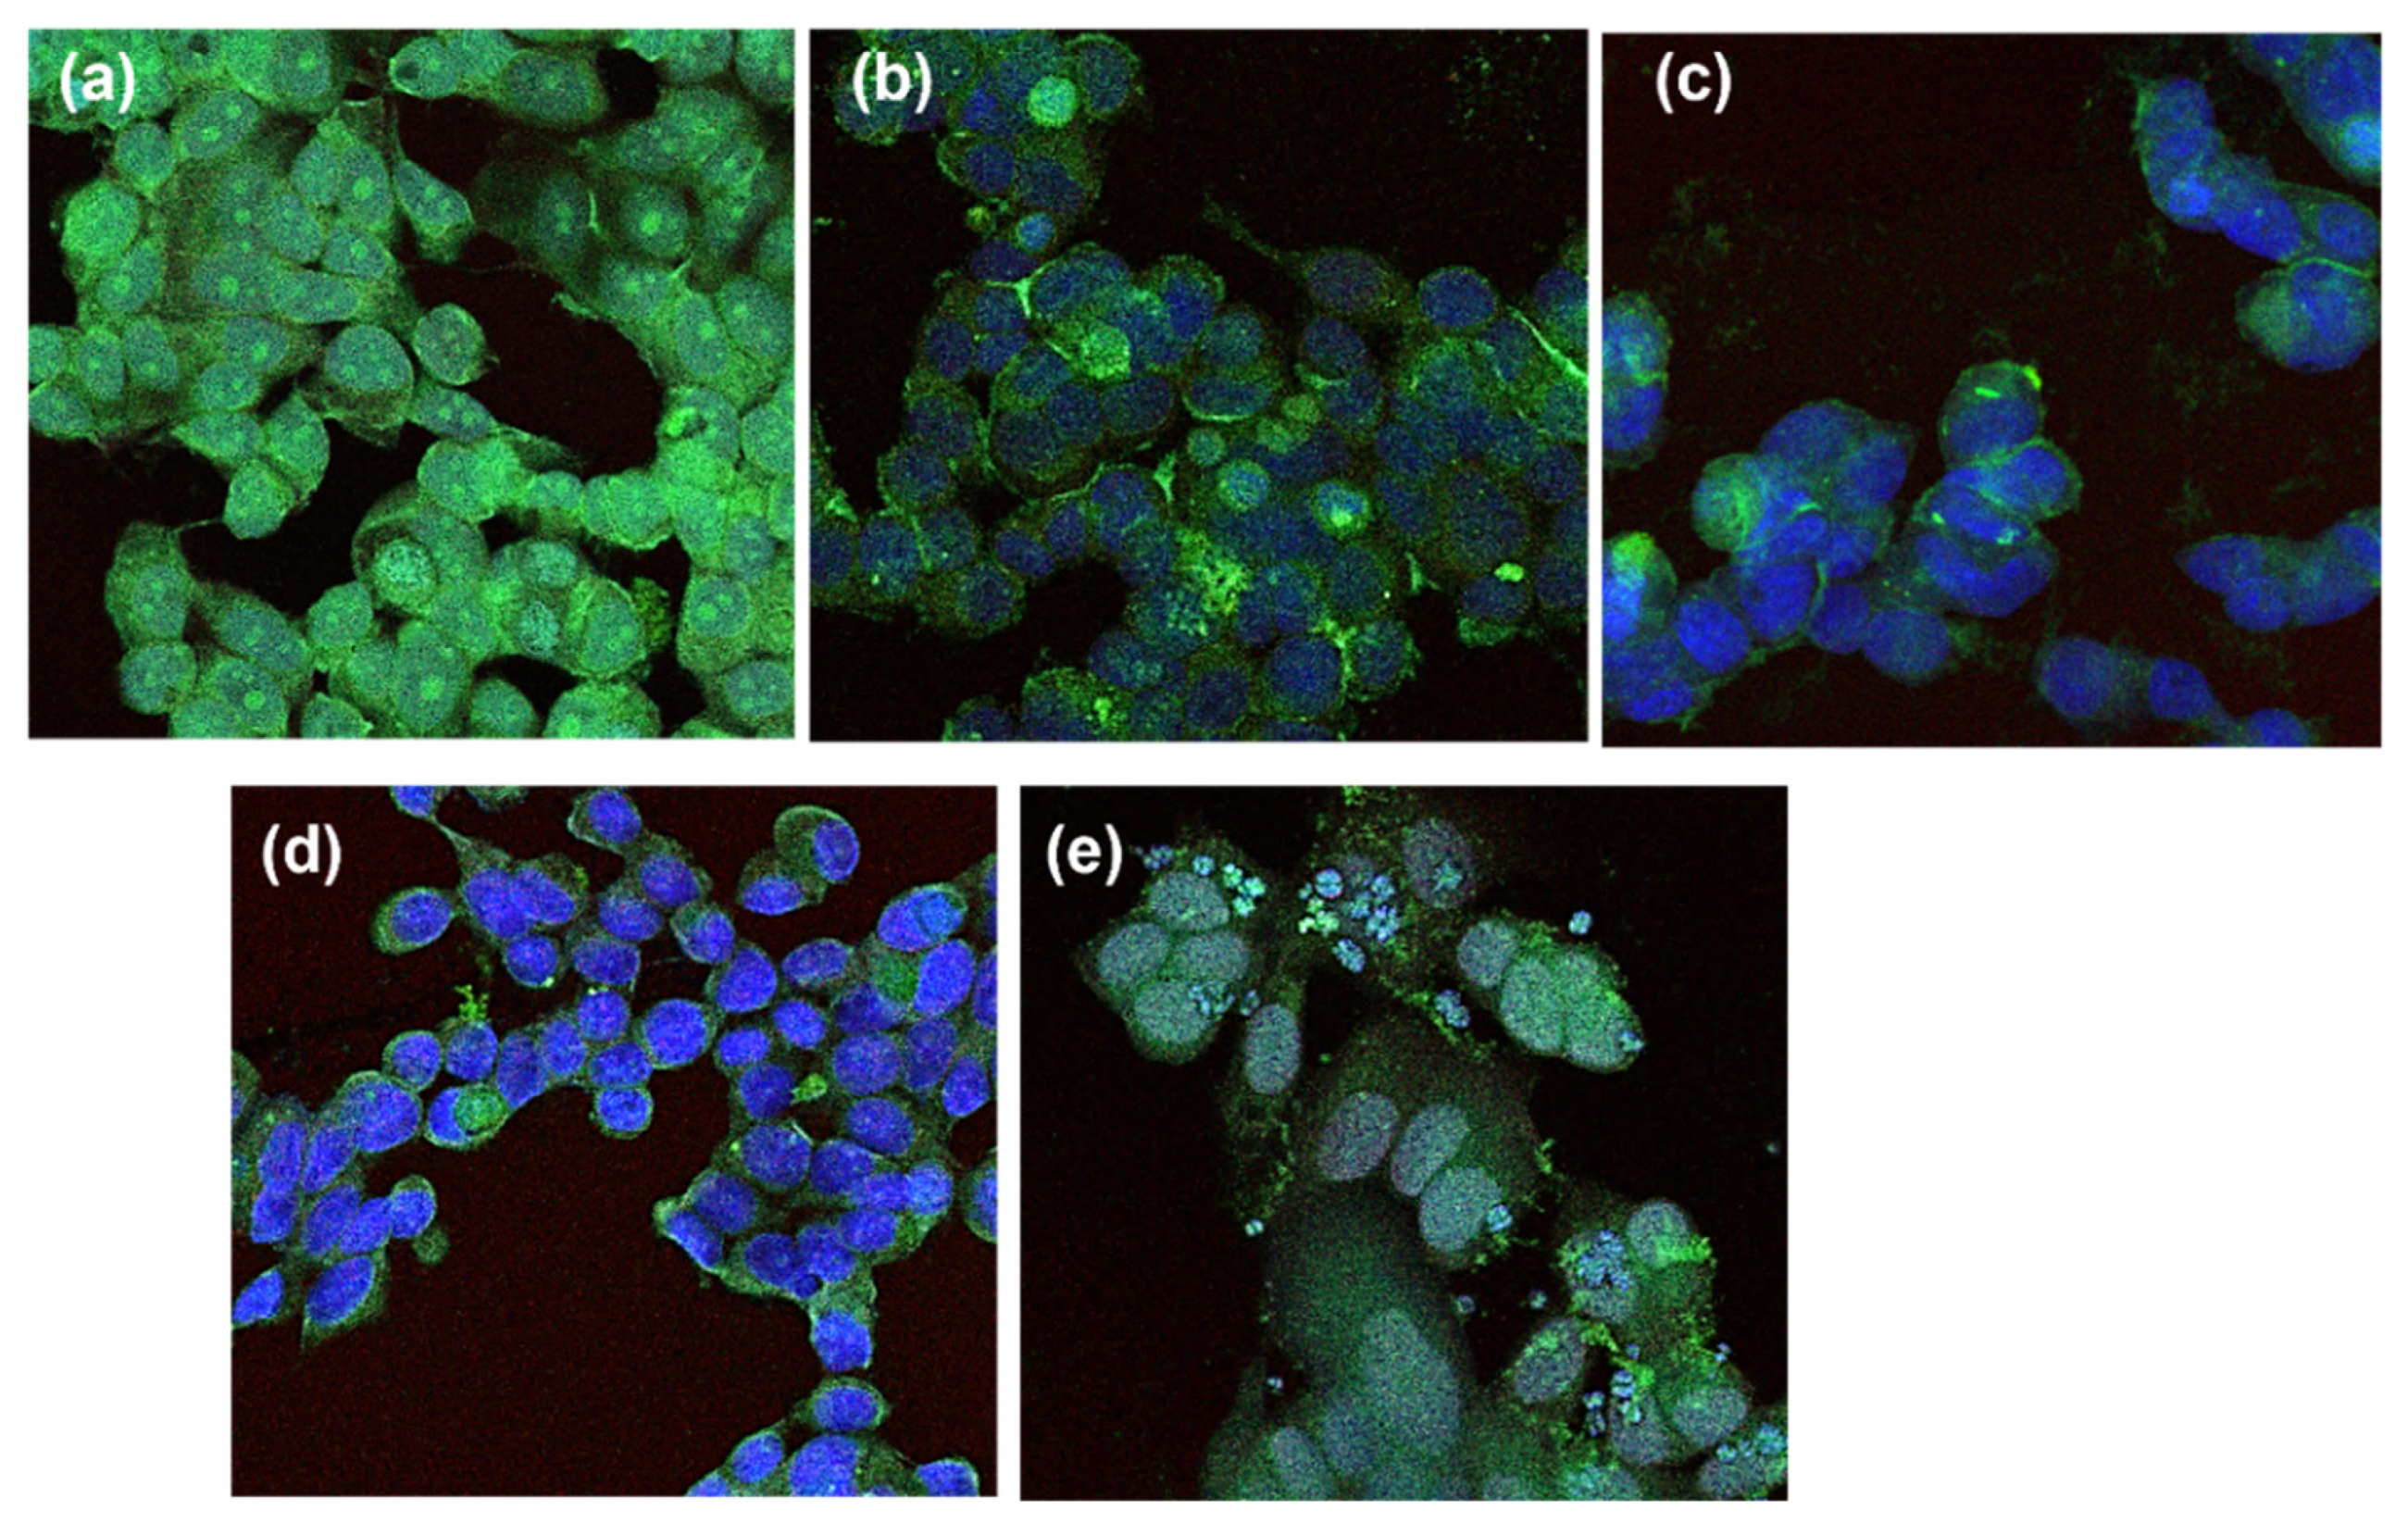
2.2.4. Study of the Effect on the Membrane PD-L1 and VEGFR-2 in Co-Culture Cancer Cells
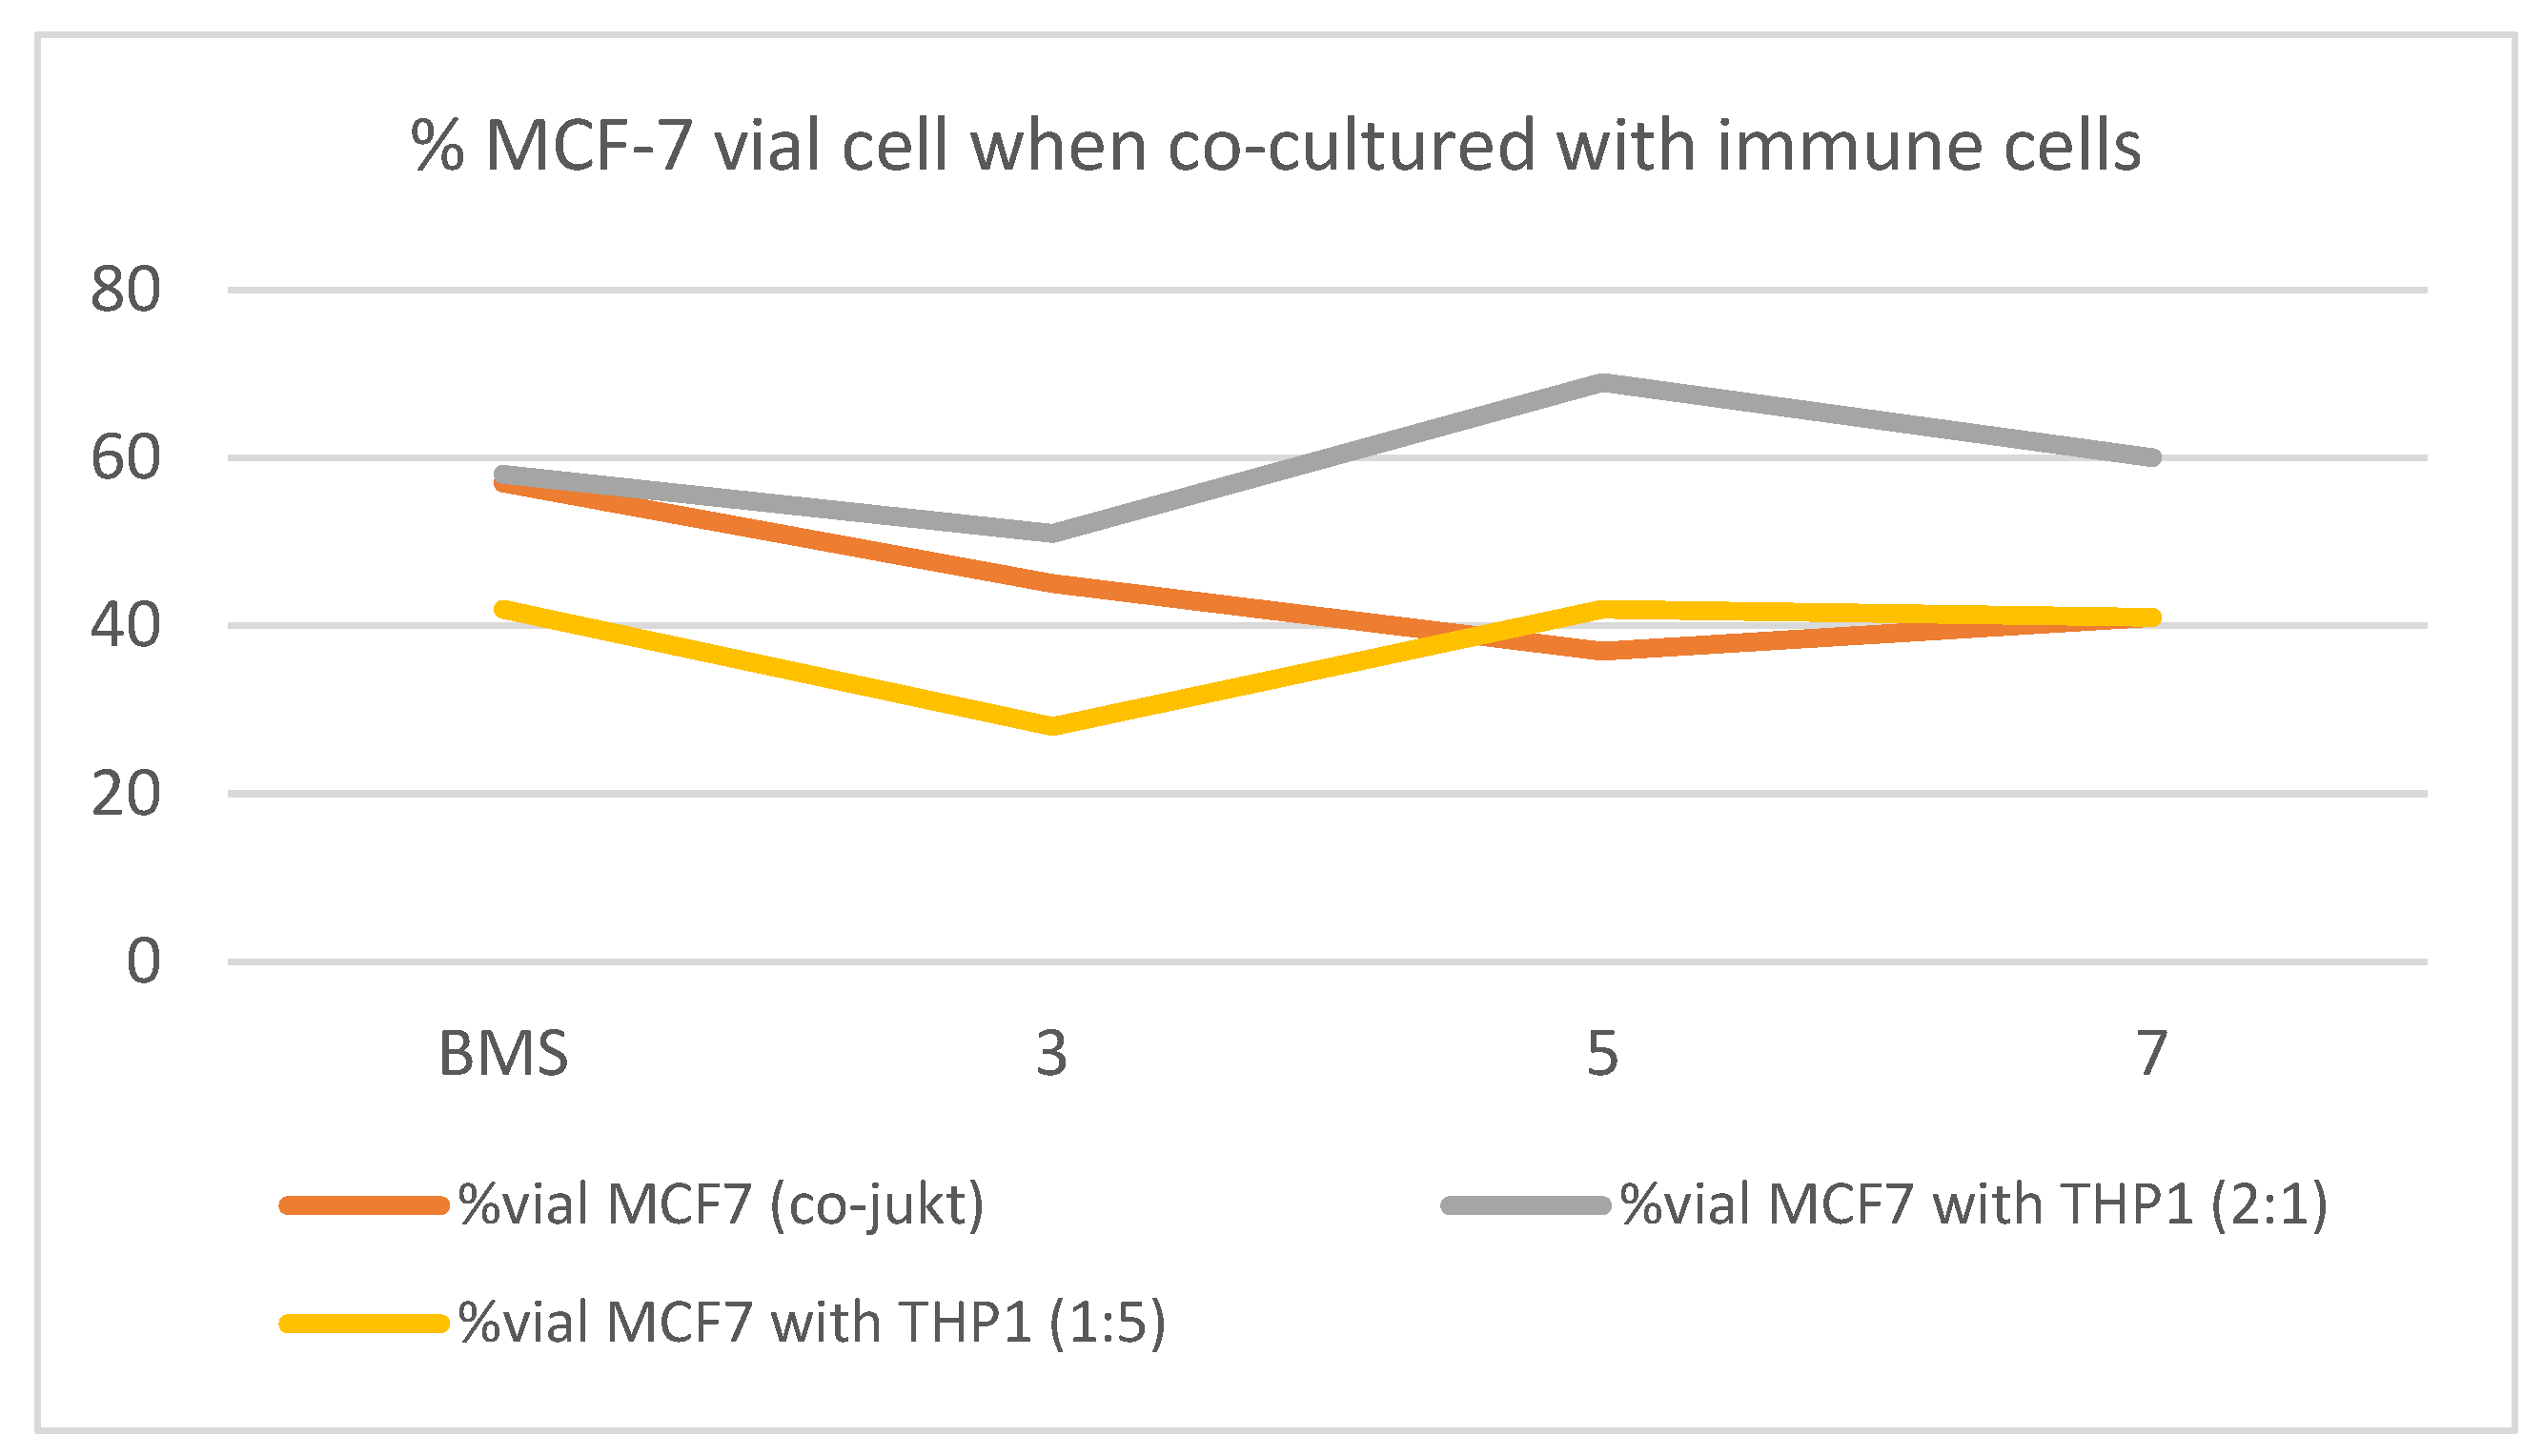
2.2.5. Study of the Effect of Selected Triazole on Viability of Cancer Cells in Co-Culture with THP-1
2.2.6. Study of the Effect of Selected Triazols on the Secretion of IL-6 to the Media
3. Discussion
4. Materials and Methods
4.1. Chemistry
4.1.1. General Procedures
4.1.2. Experimental Procedure for the Synthesis of 2,2′-(1,4-Phenylene)bis(ethan-1-ol) 16
4.1.3. Experimental Procedure for the Synthesis of 2-(4-(2-(Bis(4-methoxyphenyl)(phenyl)methoxy)ethyl)phenyl)ethan-1-ol 17
4.1.4. Experimental Procedure for the Synthesis of 4-(2-(Bis(4-methoxyphenyl)(phenyl)methoxy)ethyl)phenethyl 4-Methylbenzenesulfonate 18
4.1.5. Experimental Procedure for the Synthesis of 4,4’-((4-(2-Azidoethyl)phenethoxy)(phenyl)methylene)bis(methoxybenzene) 19
4.1.6. Experimental Procedure for the Synthesis of the Non-Commercially Available Alkynes 21–26
4.1.7. Experimental Procedure for the Synthesis of Triazole Derivates 1, 3, 5, 7, 9, 11 and 13
4.1.8. Experimental Procedure for the Deprotection of Triazole Derivates
4.2. Biological Studies
4.2.1. Cell Culture
4.2.2. Cell Proliferation Assay
4.2.3. PD-L1 and c-Myc Relative Quantification by Flow Cytometry
4.2.4. Cell Viability Evaluation in Co-Cultures
4.2.5. PD-L1 and VEGFR-2 Relative Quantification by Flow Cytometry in Co-Cultures
4.2.6. Fluorescence Microscopy
4.2.7. RT-qPCR Assay
Supplementary Materials
Author Contributions
Funding
Institutional Review Board Statement
Informed Consent Statement
Data Availability Statement
Acknowledgments
Conflicts of Interest
References
- Whiteside, T.L. The tumor microenvironment and its role in promoting tumor growth. Oncogene 2008, 27, 5904–5912. [Google Scholar] [CrossRef] [PubMed]
- Mittal, K.; Ebos, J.; Rini, B. Angiogenesis and the tumor microenvironment: Vascular endothelial growth factor and beyond. Rev. Semin. Oncol. 2014, 41, 235–251. [Google Scholar] [CrossRef] [PubMed]
- Greten, F.R.; Grivennikov, S.I. Inflammation and Cancer: Triggers, Mechanisms, and Consequences. Immunity 2019, 41, 27–35. [Google Scholar] [CrossRef] [PubMed]
- Baghban, R.; Roshangar, L.; Jahanban-Esfahlan, R.; Seidi, K.; Ebrahimi-Kalan, A.; Jaymand, M.; Kolahian, S.; Javaheri, T.; Zare, P. Tumor microenvironment complexity and therapeutic implications at a glance. Cell Commun. Signal. 2020, 18, 59–70. [Google Scholar] [CrossRef] [PubMed]
- Jin, M.-Z.; Jin, W.-L. The updated landscape of tumor microenvironment and drug repurposing. Signal Transduct. Target. Ther. 2020, 5, 166. [Google Scholar] [CrossRef]
- Zhang, Y.; Zhang, Z. The history and advances in cancer immunotherapy: Understanding the characteristics of tumor-infiltrating immune cells and their therapeutic implications. Cell. Mol. Immunol. 2020, 17, 807–821. [Google Scholar] [CrossRef]
- Akinleye, A.; Rasool, Z. Immune checkpoint inhibitors of PD-L1 as cancer therapeutics. Hematol. Oncol. 2019, 12, 92–110. [Google Scholar] [CrossRef]
- Anastasiya, S.; Poltavets, L.; Polina, A.; Vishnyakova, A.; Gennady, T.; Sukhikh, L.; Fatkhudinov, T. Macrophage Modification Strategies for Efficient Cell Therapy. Cells 2020, 9, 1535. [Google Scholar] [CrossRef]
- Chen, J.; Wei, Y.; Yang, W.; Huang, Q.; Chen, Y.; Zeng, K.; Chen, J. IL6: The Link Between Inflammation, Immunity and Breast Cancer. Front. Oncol. 2022, 12, 903800. [Google Scholar] [CrossRef]
- Fisher, D.T.; Appenheimer, M.M.; Sharon, S. Evans. The Two Faces of IL-6 in the Tumor Microenvironment. Semin. Immunol. 2014, 26, 38–47. [Google Scholar] [CrossRef]
- Roma-Rodrigues, C.; Mendes, R.; Baptista, P.V.; Fernandes, A.R. Targeting Tumor Microenvironment for Cancer Therapy. Int. J. Mol. Sci. 2019, 20, 840. [Google Scholar] [CrossRef]
- Santa-Maria, D.; Claramunt, R.; Elguero, J.; Carda, M.; Falomir, E.; Martín-Beltrán, C. New N, C-Diaryl-1,2,4-triazol-3-ones: Synthesis and Evaluation as Anticancer Agents. Med. Chem. 2019, 15, 360–372. [Google Scholar] [CrossRef] [PubMed]
- Martín-Beltrán, C.; Sánchez-Peris, M.; Conesa-Milián, L.; Falomir, E.; Murga, J.; Carda, M.; Marco, J. Arylpyridines, arylpyrimidines and related compounds as potential modulator agents of the VEGF, h-TERT and c-Myc oncogenes. Bioorg. Med. Chem. 2019, 27, 880–887. [Google Scholar] [CrossRef] [PubMed]
- Blasco, V.; Cuñat, A.C.; Sanz-Cervera, J.; Marco, J.A.; Falomir, E.; Murga, J.; Carda, M. Arylureas derived from colchicine: Enhancement of colchicine oncogene downregulation activity. Eur. J. Med. Chem. 2018, 150, 817–828. [Google Scholar] [CrossRef] [PubMed]
- Hanahan, D.; Weinberg, R.A. The hallmarks of cancer. Cell 2000, 100, 57–70. [Google Scholar] [CrossRef] [PubMed]
- Hanahan, D.; Weinberg, R.A. Hallmarks of cancer: The next generation. Cell 2011, 144, 646–674. [Google Scholar] [CrossRef]
- Martín-Beltrán, C.; Gil-Edo, R.; Hernández-Ribelles, G.; Agut, R.; Marí-Mezquita, P.; Carda, M.; Falomir, E. Aryl Urea Based Scaffolds for Multitarget Drug Discovery in Anticancer Immunotherapies. Pharmaceuticals 2021, 14, 337. [Google Scholar] [CrossRef]
- Pla-López, A.; Castillo, R.; Cejudo-Marín, R.; García-Pedrero, O.; Bakir-Laso, M.; Falomir, E.; Carda, M. Synthesis and Biological Evaluation of Small Molecules as Potential Anticancer Multitarget Agents. Int. J. Mol. Sci. 2022, 23, 7049. [Google Scholar] [CrossRef]
- Conesa-Milián, L.; Falomir, E.; Murga, J.; Carda, M.; Marco, J.A. Novel multitarget inhibitors with antiangiogenic and immunomodulator properties. Eur. J. Med. Chem. 2019, 148, 87–98. [Google Scholar] [CrossRef]
- Meškytė, E.M.; Keskas, S.; Ciribilli, Y. MYC as a Multifaceted Regulator of Tumor Microenvironment Leading to Metastasis. Int. J. Mol. Sci. 2020, 21, 7710. [Google Scholar] [CrossRef]
- Venkateswaran, N.; Conacci-Sorrell, M. Myc Leads the Way. Small Gtpases 2020, 11, 86–94. [Google Scholar] [CrossRef] [PubMed]
- Casey, S.C.; Tong, L.; Li, Y.; Do, R.; Walz, S.; Fitzgerald, K.N.; Gouw, A.M.; Baylot, V.; Gutgemann, I.; Eilers, M. Myc Regulates the Antitumor Immune Response through CD47 and Pd-L1. Science 2016, 352, 227–231. [Google Scholar] [CrossRef] [PubMed]
- Yamaguchi, H.; Hsu, J.M.; Yang, W.H.; Hung, M.C. Mechanisms regulating PD-L1 expression in cancers and associated opportunities for novel small-molecule therapeutics. Nat. Rev. Clin. Oncol. 2022, 19, 287–305. [Google Scholar] [CrossRef] [PubMed]
- Coyne, G.O.; Madan, R.A.; Gulley, J.L. Nivolumab: Promising survival signal coupled with limited toxicity raises expectations. J. Clin. Oncol. 2014, 32, 986–988. [Google Scholar] [CrossRef] [PubMed]
- Khoja, L.; Butler, M.O.; Kang, S.P.; Ebbinghaus, S.; Joshua, A.M. Pembrolizumab. J. ImmunoTher. Cancer 2015, 3, 36. [Google Scholar] [CrossRef] [PubMed]
- Apolo, A.B.; Infante, J.R.; Balmanoukian, A.; Patel, M.R.; Wang, D.; Kelly, K.; Mega, A.E.; Britten, C.D.; Ravaud, A.; Mita, A.C.; et al. Avelumab, an Anti-Programmed Death-Ligand 1 Antibody, In Patients with Refractory Metastatic Urothelial Carcinoma: Results From a Multicenter, Phase Ib Study. J. Clin. Oncol. 2017, 19, 2117–2124. [Google Scholar] [CrossRef]
- Musielak, B.; Kocik, J.; Skalniak, L.; Magiera-Mularz, K.; Sala, D.; Czub, M.; Stec, M.; Siedlar, M.; Holak, T.A.; Plewka, J. CA-170—A Potent Small-Molecule PD-L1 Inhibitor or Not? Molecules 2019, 24, 2804. [Google Scholar] [CrossRef]
- Koblish, H.K.; Wu, L.; Wang, L.-C.S.; Liu, P.C.; Wynn, R.; Rios-Doria, J.; Spitz, S.; Liu, H.; Volgina, A.; Zolotarjova, N.; et al. Characterization of INCB086550: A Potent and Novel Small-Molecule PD-L1 Inhibitor. Cancer Discov. 2022, 12, 1482–1499. [Google Scholar] [CrossRef]
- Zak, K.M.; Grudnik, P.; Skalniak, L.; Dubin, G.; Holak, T.A. Structure of Human Programmed Cell Death 1 Ligand 1 (PD-L1) with Low Molecular Mass Inhibitor. PDB. Available online: https://www.wwpdb.org/pdb?id=pdb_00006r3k (accessed on 2 September 2021).
- Guzik, K.; Zak, K.M.; Grudnik, P.; Magiera, K.; Musielak, B.; Torner, M.; Skalniak, L.; Domling, A.; Dubin, G.; Holak, T.A. Small-molecule inhibitors of the programmed cell death-1/programmed death-ligand 1 (Pd-1/Pd-L1) interaction via transiently induced protein states and dimerization of Pd-L1. J. Med. Chem. 2017, 60, 5857e5867. [Google Scholar] [CrossRef]
- Chupak, L.S.; Zheng, X. Bristol-Myers Squibb Company. WO2015034820 A1- Compounds Useful As Immunomodulators 12 March 2015. World In-ternationational Property Organization Home Page. Available online: https://patentscope.wipo.int/ (accessed on 5 April 2018).
- Liu, Y.; Zugazagoitia, J.; Ahmed, F.S.; Henick, B.S.; Gettinger, S.; Herbst, R.S.; Schalper, F.; Rimm, D.L. Immune Cell PD-L1 Colocalizes with Macrophages and is Associated with Outcome in PD-1 Pathway Blockade Therapy. Clin. Cancer Res. 2020, 26, 970–977. [Google Scholar] [CrossRef]
- Kwiatkowski, S.; Sviripa, V.M.; Zhang, Z.; Wendlandt, A.E.; Höbartner, C.; Watt, D.S.; Stamm, S. Synthesis of a norcantharidin-tethered guanosine: Protein phosphatase-1 inhibitors that change alternative splicing. Bioorg. Med. Chem. Lett. 2016, 26, 965–968. [Google Scholar] [CrossRef] [PubMed]
- Singh, M.S.; Chowdhury, S.; Koley, S. Advances of azide-alkyne cycloaddition-click chemistry over the recent decade. Tetrahedron 2016, 72, 5257–5283. [Google Scholar] [CrossRef]
- Wang, J.; Zhang, R.; Lin, Z.; Zhang, S.; Chen, Y.; Tang, J.; Hong, J.; Zhou, X.; Zong, Y.; Xu, Y.; et al. CDK7 inhibitor THZ1 enhances antiPD-1 therapy efficacy via the p38α/MYC/PD-L1 signaling in non-small cell lung cancer. J. Hematol. Oncol. 2020, 13, 99–110. [Google Scholar] [CrossRef] [PubMed]
- Sun, F.; Zhu, Q.; Li, T.; Saeed, M.; Xu, Z.; Zhong, F.; Song, R.; Huai, M.; Zheng, M.; Xie, C.; et al. Regulating Glucose Metabolism with Prodrug Nanoparticles for Promoting Photoimmunotherapy of Pancreatic Cancer. Adv. Sci. 2021, 4, 2002746. [Google Scholar] [CrossRef]
- Heesgaard Jepsen, T.; Langgaard Kristensen, J. In situ generation of the Ohira-Bestmann reagent from stable sulfonyl azide: Scalable synthesis of alkynes from aldehydes. J. Org. Chem. 2014, 79, 9423–9426. [Google Scholar] [CrossRef]


| Comp. | HT-29 | MCF-7 | A-549 | |||
|---|---|---|---|---|---|---|
| % c-Myc | % PD-L1 | % c-Myc | % PD-L1 | % c-Myc | % PD-L1 | |
| Control | 100 | 100 | 100 | 100 | 100 | 100 |
| BMS-8 | 119 ± 9 | 68 ± 10 | 130 ± 12 | 77 ± 3 | 142 ± 8 | 70 ± 8 |
| 1 | 135 ± 5 | 85 ± 3 | 73 ± 1 | 90 ± 8 | 182 ± 27 | 63 ± 16 |
| 2 | 115 ± 8 | 82 ± 6 | 122 ± 13 | 115 ± 7 | 79 ± 10 | 76 ± 2 |
| 3 | 67 ± 8 | 47 ± 1 | 65 ± 4 | 108 ± 13 | 66 ± 5 | 58 ± 10 |
| 4 | 108 ± 8 | 111 ± 8 | 91 ± 8 | 237 ± 19 | 95 ± 2 | 55 ± 8 |
| 5 | 66 ± 10 | 38 ± 1 | 61 ± 11 | 87 ± 1 | 72 ± 9 | 70 ± 16 |
| 6 | 149 ± 12 | 104 ± 6 | 81 ± 6 | 110 ± 4 | 84 ± 9 | 62 ± 4 |
| 7 | 43 ± 7 | 45 ± 7 | 51 ± 3 | 80 ± 4 | 67 ± 6 | 86 ± 20 |
| 8 | 88 ± 2 | 115 ± 5 | 92 ± 6 | 81 ± 1 | 48 ± 7 | 44 ± 8 |
| 9 | 71 ± 10 | 57 ± 8 | 88 ± 4 | 89 ± 5 | 61 ± 3 | 92 ± 21 |
| 10 | 83 ± 8 | 82 ± 2 | 91 ± 6 | 114 ± 9 | 126 ± 2 | 62 ± 14 |
| 11 | 50 ± 3 | 48 ± 4 | 81 ± 2 | 108 ± 7 | 55 ± 4 | 104 ± 1 |
| 12 | 84 ± 2 | 157 ± 6 | 81 ± 4 | 88 ± 1 | 113 ± 9 | 67 ± 8 |
| 13 | 68 ± 3 | 102 ± 1 | 77 ± 5 | 87 ± 6 | 51 ± 2 | 120 ± 5 |
| 14 | 67 ± 4 | 138 ± 2 | 71 ± 5 | 71 ± 0 | 85 ± 10 | 54 ± 7 |
| % c-Myc | % PD-L1 | |
|---|---|---|
| Control | 100 | 100 |
| BMS-8 | 30 ± 10 | 31 ± 12 |
| 3 | 50 ± 7 | 33 ± 10 |
| 5 | 33 ± 5 | 21 ± 8 |
| 7 | 12 ± 5 | 36 ± 9 |
| HT-29 | MCF-7 | |||
|---|---|---|---|---|
| Dose | % c-Myc | % PD-L1 | % c-Myc | % PD-L1 |
| 100µM | 67 ± 8 | 47 ± 1 | 65 ± 4 | 108 ± 13 |
| 50µM | 88 ± 5 | 90 ± 3 | 75 ± 9 | 69 ± 4 |
| 25µM | 100 ± 3 | 111 ± 4 | 62 ± 5 | 58 ± 3 |
| 10µM | 109 ± 9 | 101 ± 2 | 56 ± 5 | 52 ± 2 |
| A-549/Jurkat T | HT-29/Jurkat T | MCF-7/JurkatT | ||||
|---|---|---|---|---|---|---|
| Comp. | A-549 | Jurkat | HT-29 | Jurkat | MCF-7 | Jurkat |
| Control | 100 | 100 | 100 | 100 | 100 | 100 |
| BMS-8 | 111 ± 9 | 99 ± 9 | 34 ± 5 | 148 ± 11 | 57 ± 7 | 53 ± 27 |
| 1 | 127 ± 1 | 88 ± 18 | 81 ± 12 | 108 ± 6 | 56 ± 6 | 86 ± 13 |
| 2 | 123 ± 25 | 89 ± 17 | 79 ± 20 | 107 ± 4 | 80 ± 6 | 87 ± 22 |
| 3 | 75 ± 7 | 86 ± 4 | 111 ± 5 | 108 ± 33 | 45 ± 4 | 75± 10 |
| 4 | 79 ± 5 | 122 ± 11 | 115 ± 14 | 145 ± 9 | 87 ± 6 | 218 ± 69 |
| 5 | 105 ± 3 | 93 ± 9 | 68 ± 3 | 48 ± 1 | 37 ± 5 | 96 ± 8 |
| 6 | 75 ± 3 | 119 ± 6 | 104 ± 4 | 116 ± 7 | 65 ± 8 | 119 ± 1 |
| 7 | 100 ± 4 | 79 ± 11 | 52 ± 6 | 70 ± 8 | 41 ± 4 | 94 ± 12 |
| 8 | 72 ± 9 | 88 ± 34 | 97 ± 10 | 95 ± 5 | 49 ± 10 | 164 ± 9 |
| 9 | 106 ± 1 | 462 ± 99 | 51 ± 17 | 56 ± 18 | 69 ± 9 | 84 ± 17 |
| 10 | 103 ± 4 | 100 ± 4 | 145 ± 16 | 120 ± 23 | 94 ± 2 | 148 ± 20 |
| 11 | 102 ± 4 | 511 ± 86 | 65 ± 6 | 76 ± 52 | 50 ± 1 | 79 ± 13 |
| 12 | 86 ± 2 | 83 ± 6 | 60 ± 3 | 104 ± 5 | 78 ± 4 | 123 ± 11 |
| 13 | 103 ± 4 | 90 ± 2 | 153 ± 15 | 110 ± 9 | 43 ± 1 | 79 ± 5 |
| 14 | 78 ± 9 | 109 ± 20 | 67 ± 10 | 106 ± 9 | 47 ± 1 | 127 ± 6 |
| Comp. | HT29 | MCF7 | A549 | |||
|---|---|---|---|---|---|---|
| %VEGFR2 | % PDL1 | %VEGFR2 | % PDL1 | % VEGFR2 | % PDL1 | |
| Control | 100 | 100 | 100 | 100 | 100 | 100 |
| BMS-8 | 63 ± 4 | 105 ± 3 | 100 ± 2 | 97 ± 33 | 104 ± 9 | 103 ± 3 |
| 1 | 85 ± 0 | 143 ± 48 | 76 ± 1 | 109 ± 9 | 79 ± 7 | 96 ± 9 |
| 2 | 101 ± 11 | 124 ± 34 | 86 ± 2 | 82 ± 6 | 90 ± 10 | 60 ± 6 |
| 3 | 81 ± 7 | 80 ± 2 | 81 ± 4 | 52 ± 9 | 73 ± 4 | 77 ± 4 |
| 4 | 94 ± 3 | 54 ± 3 | 121 ± 19 | 89 ± 3 | 99 ± 4 | 80 ± 3 |
| 5 | 85 ± 4 | 153 ± 17 | 85 ± 4 | 43 ± 6 | 92 ± 2 | 115 ± 0 |
| 6 | 98 ± 2 | 63 ± 6 | 98 ± 6 | 66 ± 11 | 87 ± 7 | 75 ± 1 |
| 7 | 93 ± 3 | 89 ± 4 | 100 ± 0 | 50 ± 14 | 89 ± 5 | 73 ± 6 |
| 8 | 97 ± 4 | 58 ± 6 | 108 ± 6 | 46 ± 9 | 104 ± 5 | 84 ± 8 |
| 9 | 76 ± 13 | 63 ± 11 | 76 ± 10 | 40 ± 5 | 92 ± 3 | 82 ± 2 |
| 10 | 94 ± 6 | 126 ± 7 | 105 ± 3 | 48 ± 7 | 107 ± 1 | 84 ± 6 |
| 11 | 79 ± 10 | 104 ± 14 | 92 ± 10 | 48 ± 7 | 85 ± 1 | 94 ± 1 |
| 12 | 113 ± 4 | 88 ± 5 | 103 ± 8 | 41 ± 2 | 99 ± 6 | 77 ± 3 |
| 13 | 89 ± 2 | 57 ± 12 | 120 ± 8 | 33 ± 4 | 80 ± 8 | 83 ± 6 |
| 14 | 97 ± 6 | 61 ± 3 | 91 ± 6 | 80 ± 5 | 106 ± 1 | 85 ± 3 |
| 1:5 MCF-7/THP-1 | 2:1 MCF-7/THP-1 | |||
|---|---|---|---|---|
| Comp. 100 μM | 24 h | 48 h | 24 h | 48 h |
| Control | 100 | 100 | 100 | 100 |
| BMS-8 | 91 ± 30 | 42 ± 5 | 100 ± 4 | 58 ± 10 |
| 3 | 52 ± 7 | 28 ± 2 | 83 ± 9 | 51 ± 17 |
| 5 | 52 ± 4 | 42 ± 10 | 107 ± 3 | 69 ± 10 |
| 7 | 42 ± 10 | 41 ± 10 | 92 ± 11 | 60 ± 13 |
| Comp. | MCF7 | THP-1 | MCF7 + THP-1 |
|---|---|---|---|
| Control | 100 | 100 | 100 |
| BMS-8 | 41 ± 65 | --- | --- |
| 3 | 92 ± 4 | 183 ± 5 | 156 ± 12 |
| 5 | 73 ± 29 | 173 ± 24 | 137 ± 24 |
| 7 | 91 ± 39 | 158 ± 11 | 115 ± 4 |
Disclaimer/Publisher’s Note: The statements, opinions and data contained in all publications are solely those of the individual author(s) and contributor(s) and not of MDPI and/or the editor(s). MDPI and/or the editor(s) disclaim responsibility for any injury to people or property resulting from any ideas, methods, instructions or products referred to in the content. |
© 2023 by the authors. Licensee MDPI, Basel, Switzerland. This article is an open access article distributed under the terms and conditions of the Creative Commons Attribution (CC BY) license (https://creativecommons.org/licenses/by/4.0/).
Share and Cite
Gil-Edo, R.; Espejo, S.; Falomir, E.; Carda, M. Synthesis and Biological Evaluation of Potential Oncoimmunomodulator Agents. Int. J. Mol. Sci. 2023, 24, 2614. https://doi.org/10.3390/ijms24032614
Gil-Edo R, Espejo S, Falomir E, Carda M. Synthesis and Biological Evaluation of Potential Oncoimmunomodulator Agents. International Journal of Molecular Sciences. 2023; 24(3):2614. https://doi.org/10.3390/ijms24032614
Chicago/Turabian StyleGil-Edo, Raquel, Sara Espejo, Eva Falomir, and Miguel Carda. 2023. "Synthesis and Biological Evaluation of Potential Oncoimmunomodulator Agents" International Journal of Molecular Sciences 24, no. 3: 2614. https://doi.org/10.3390/ijms24032614
APA StyleGil-Edo, R., Espejo, S., Falomir, E., & Carda, M. (2023). Synthesis and Biological Evaluation of Potential Oncoimmunomodulator Agents. International Journal of Molecular Sciences, 24(3), 2614. https://doi.org/10.3390/ijms24032614