
A Mixture of Chemicals Found in Human Amniotic Fluid Disrupts Brain Gene Expression and Behavior in Xenopus laevis
 , , ,
, , ,
Abstract
1. Introduction
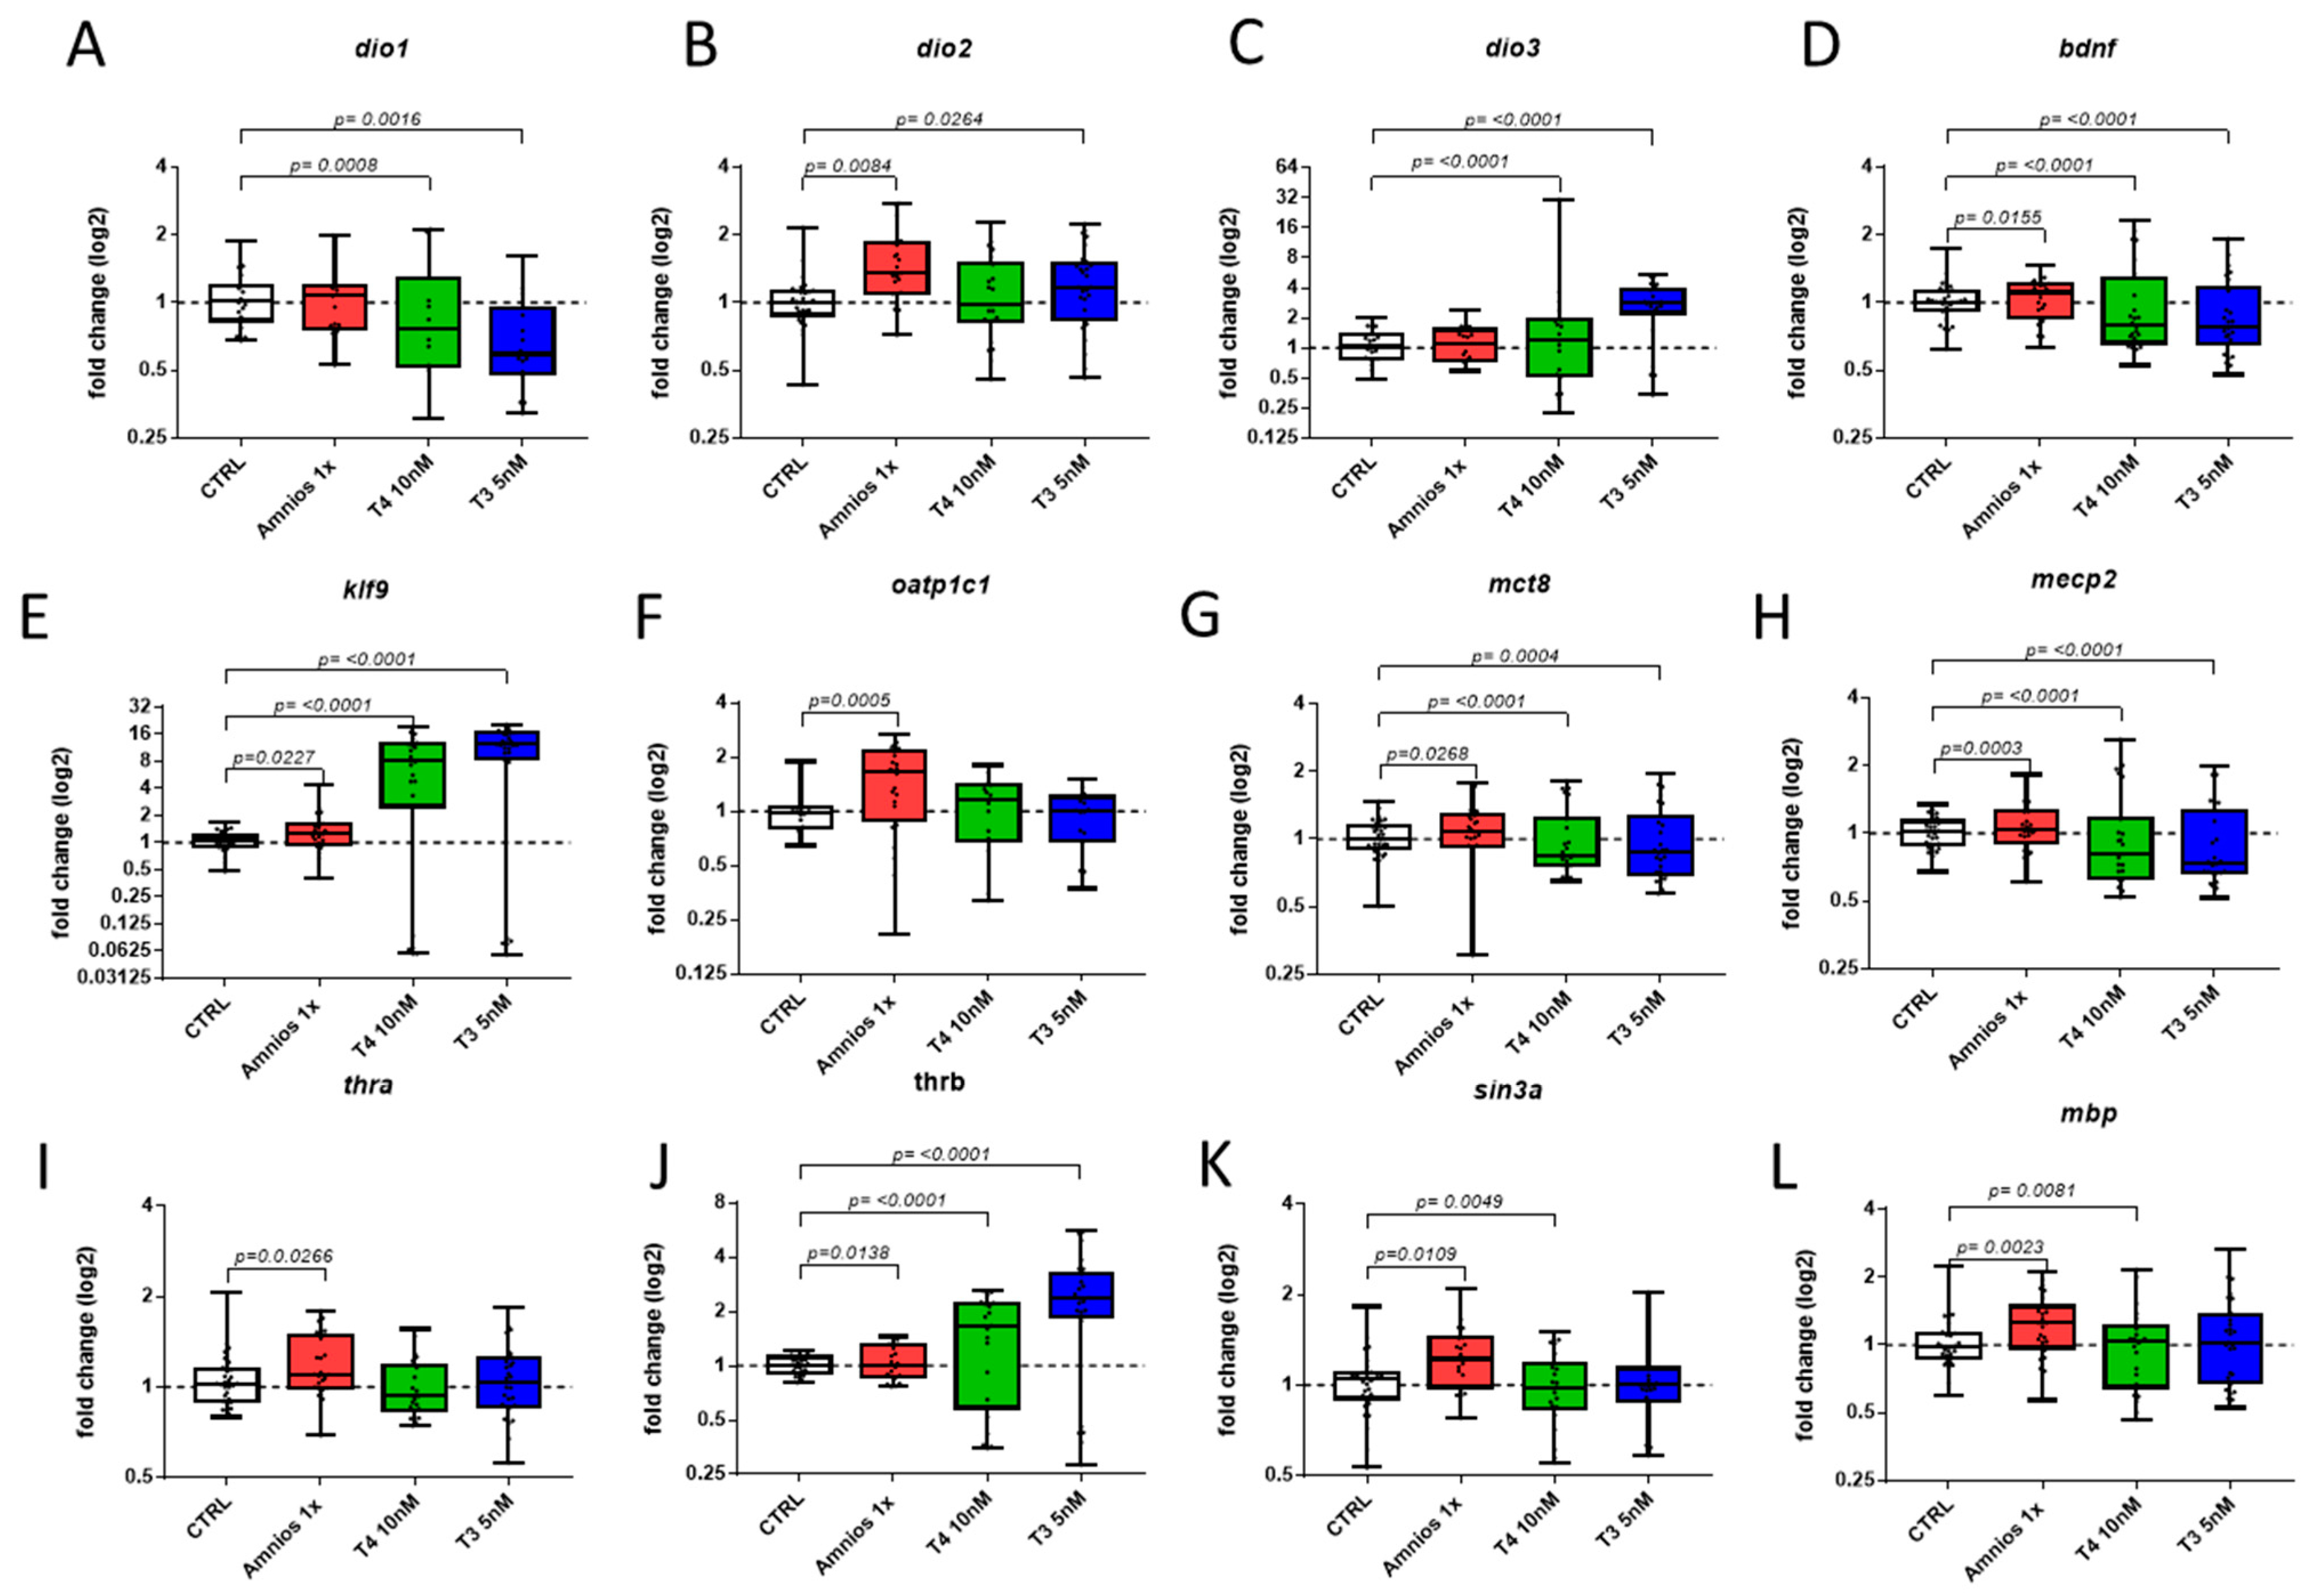
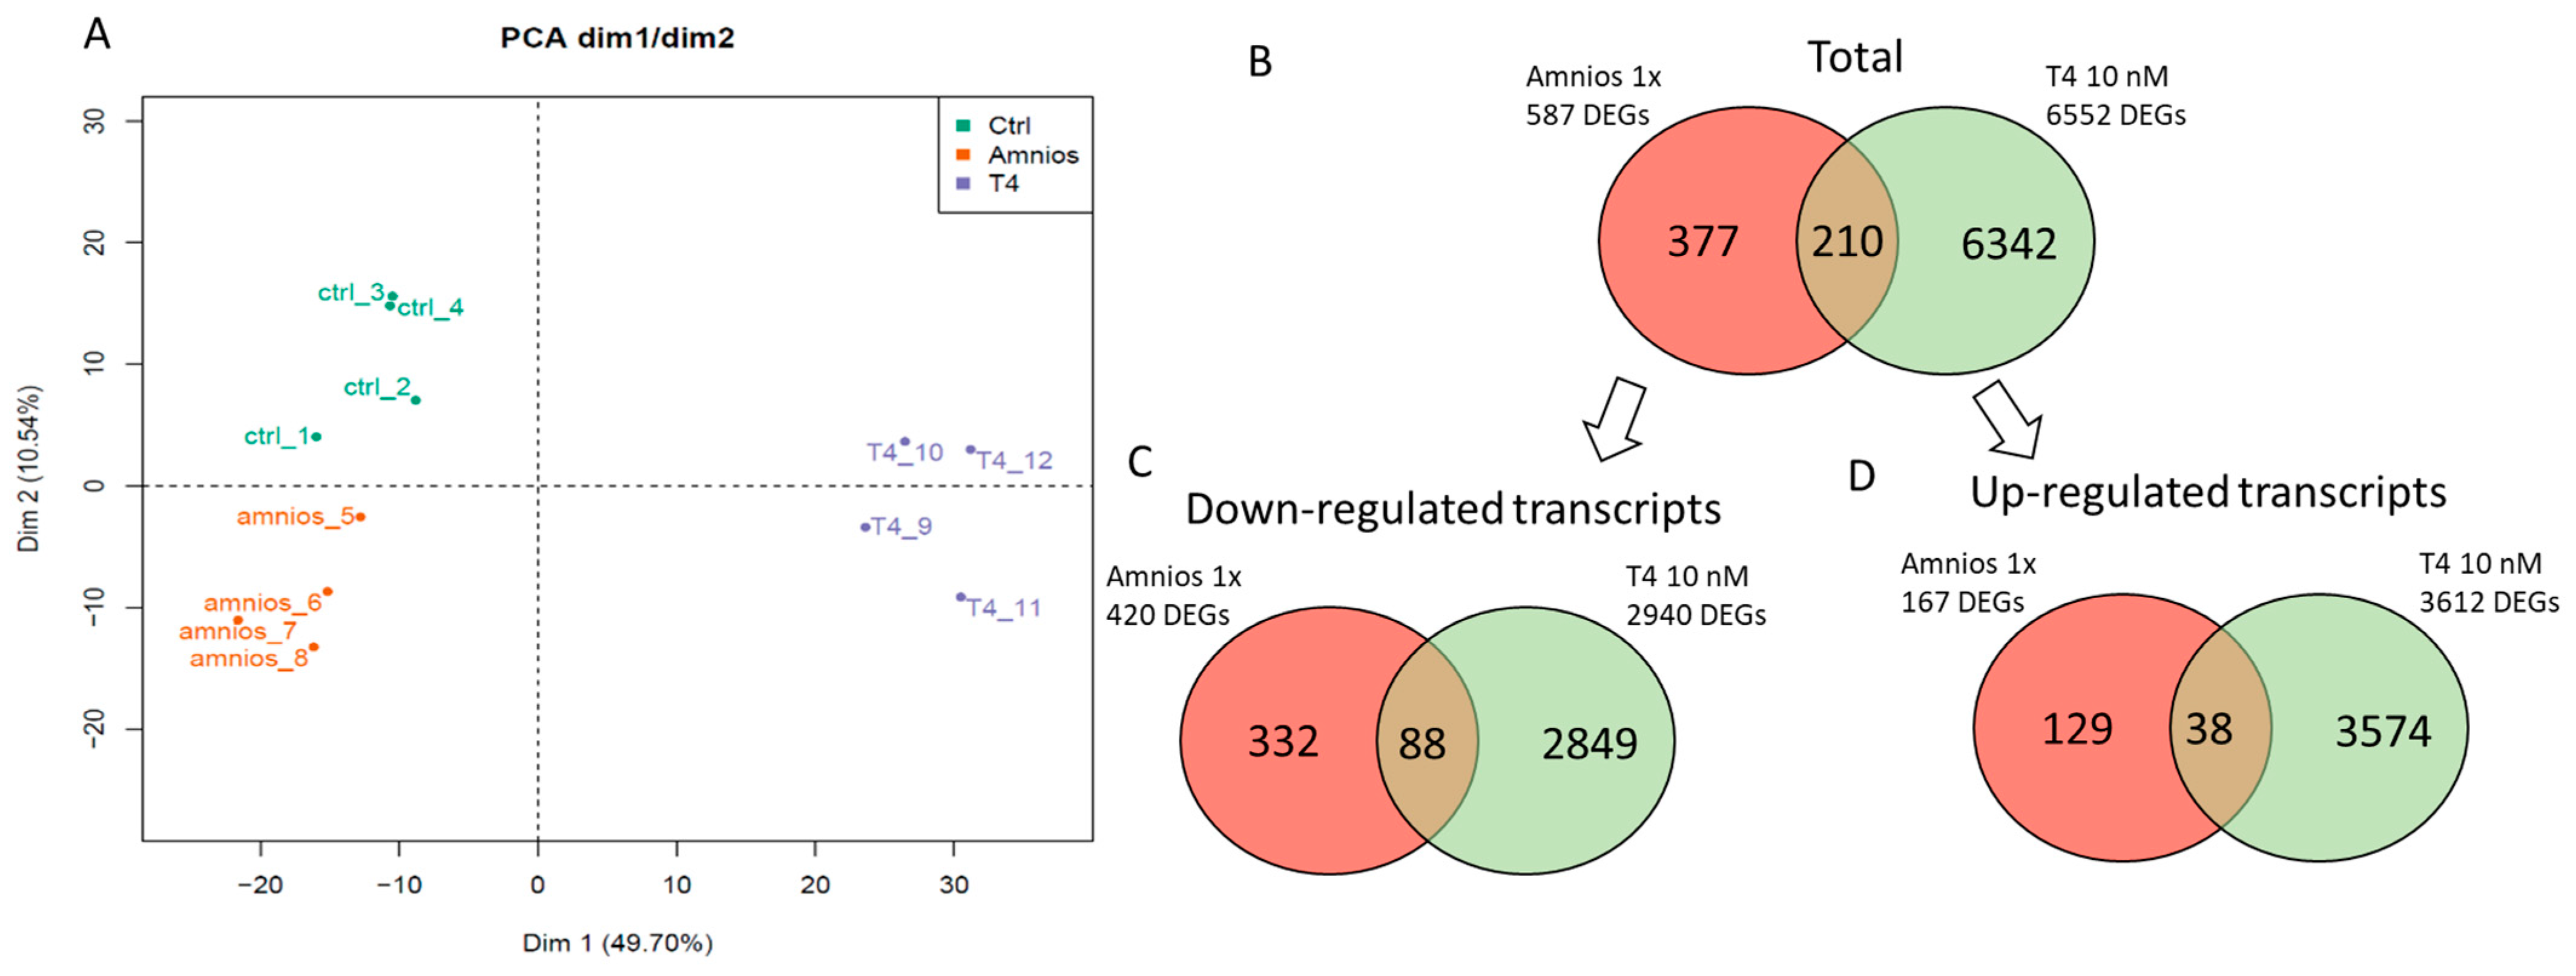
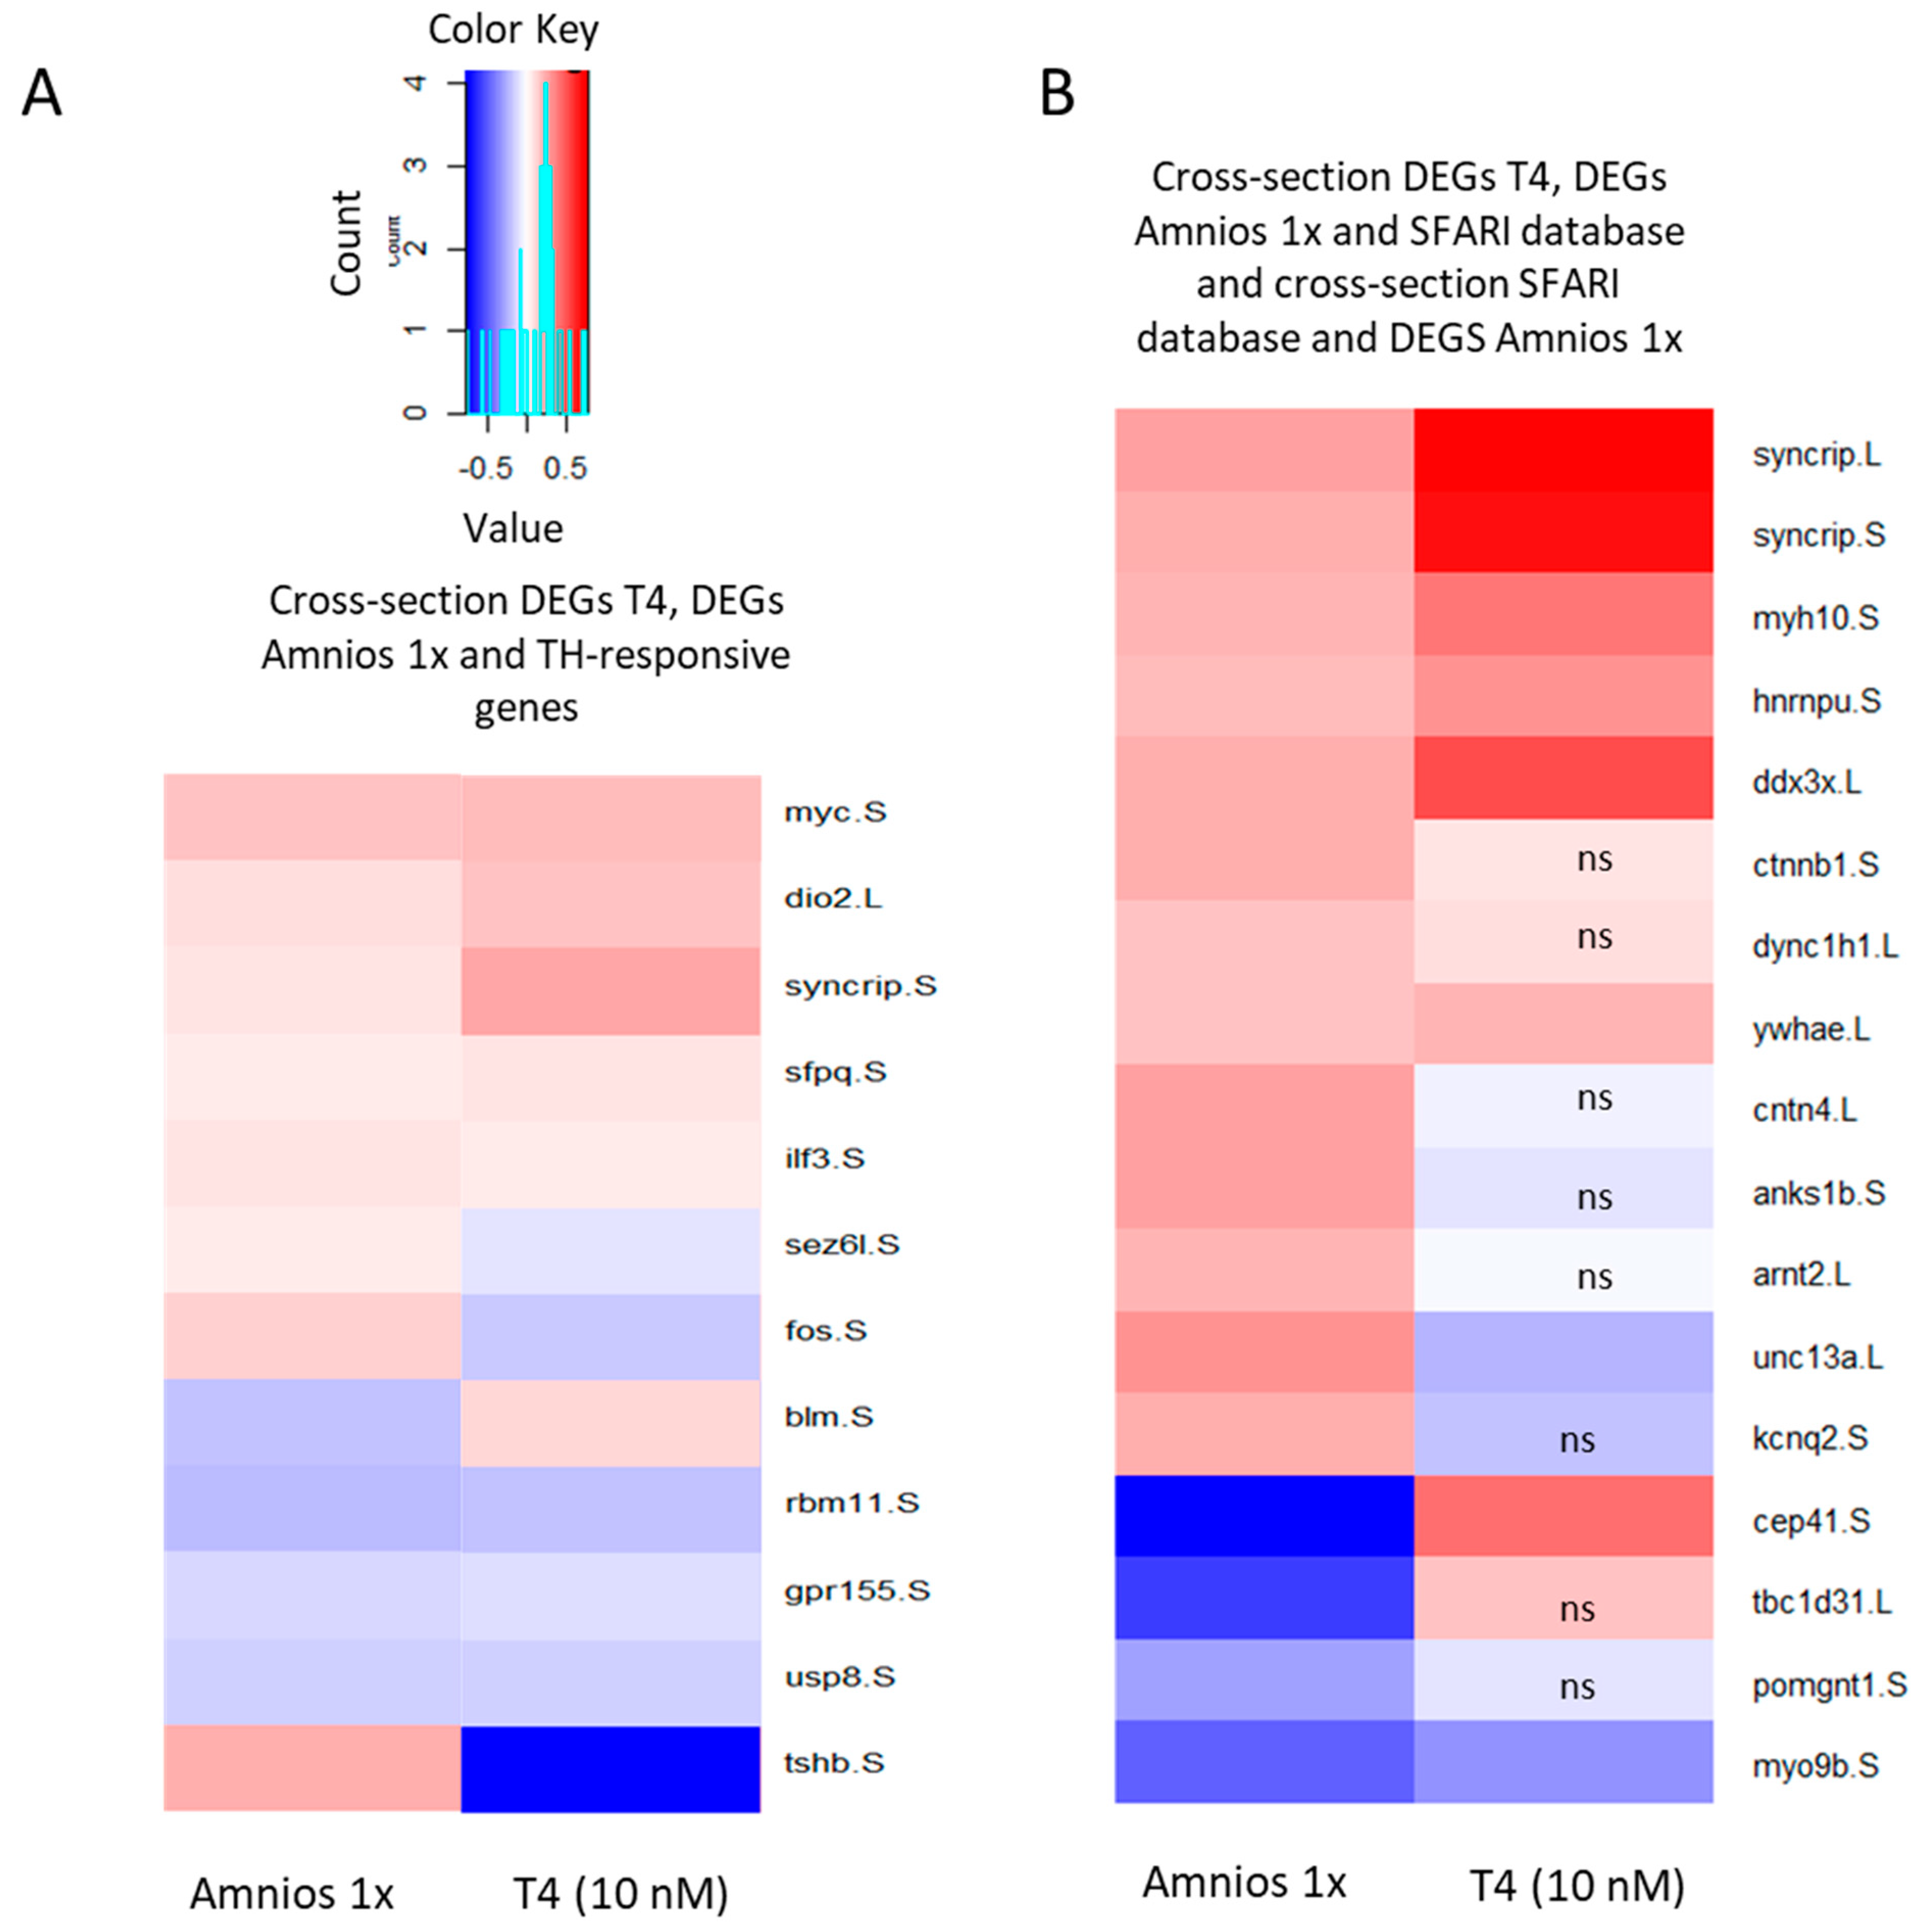
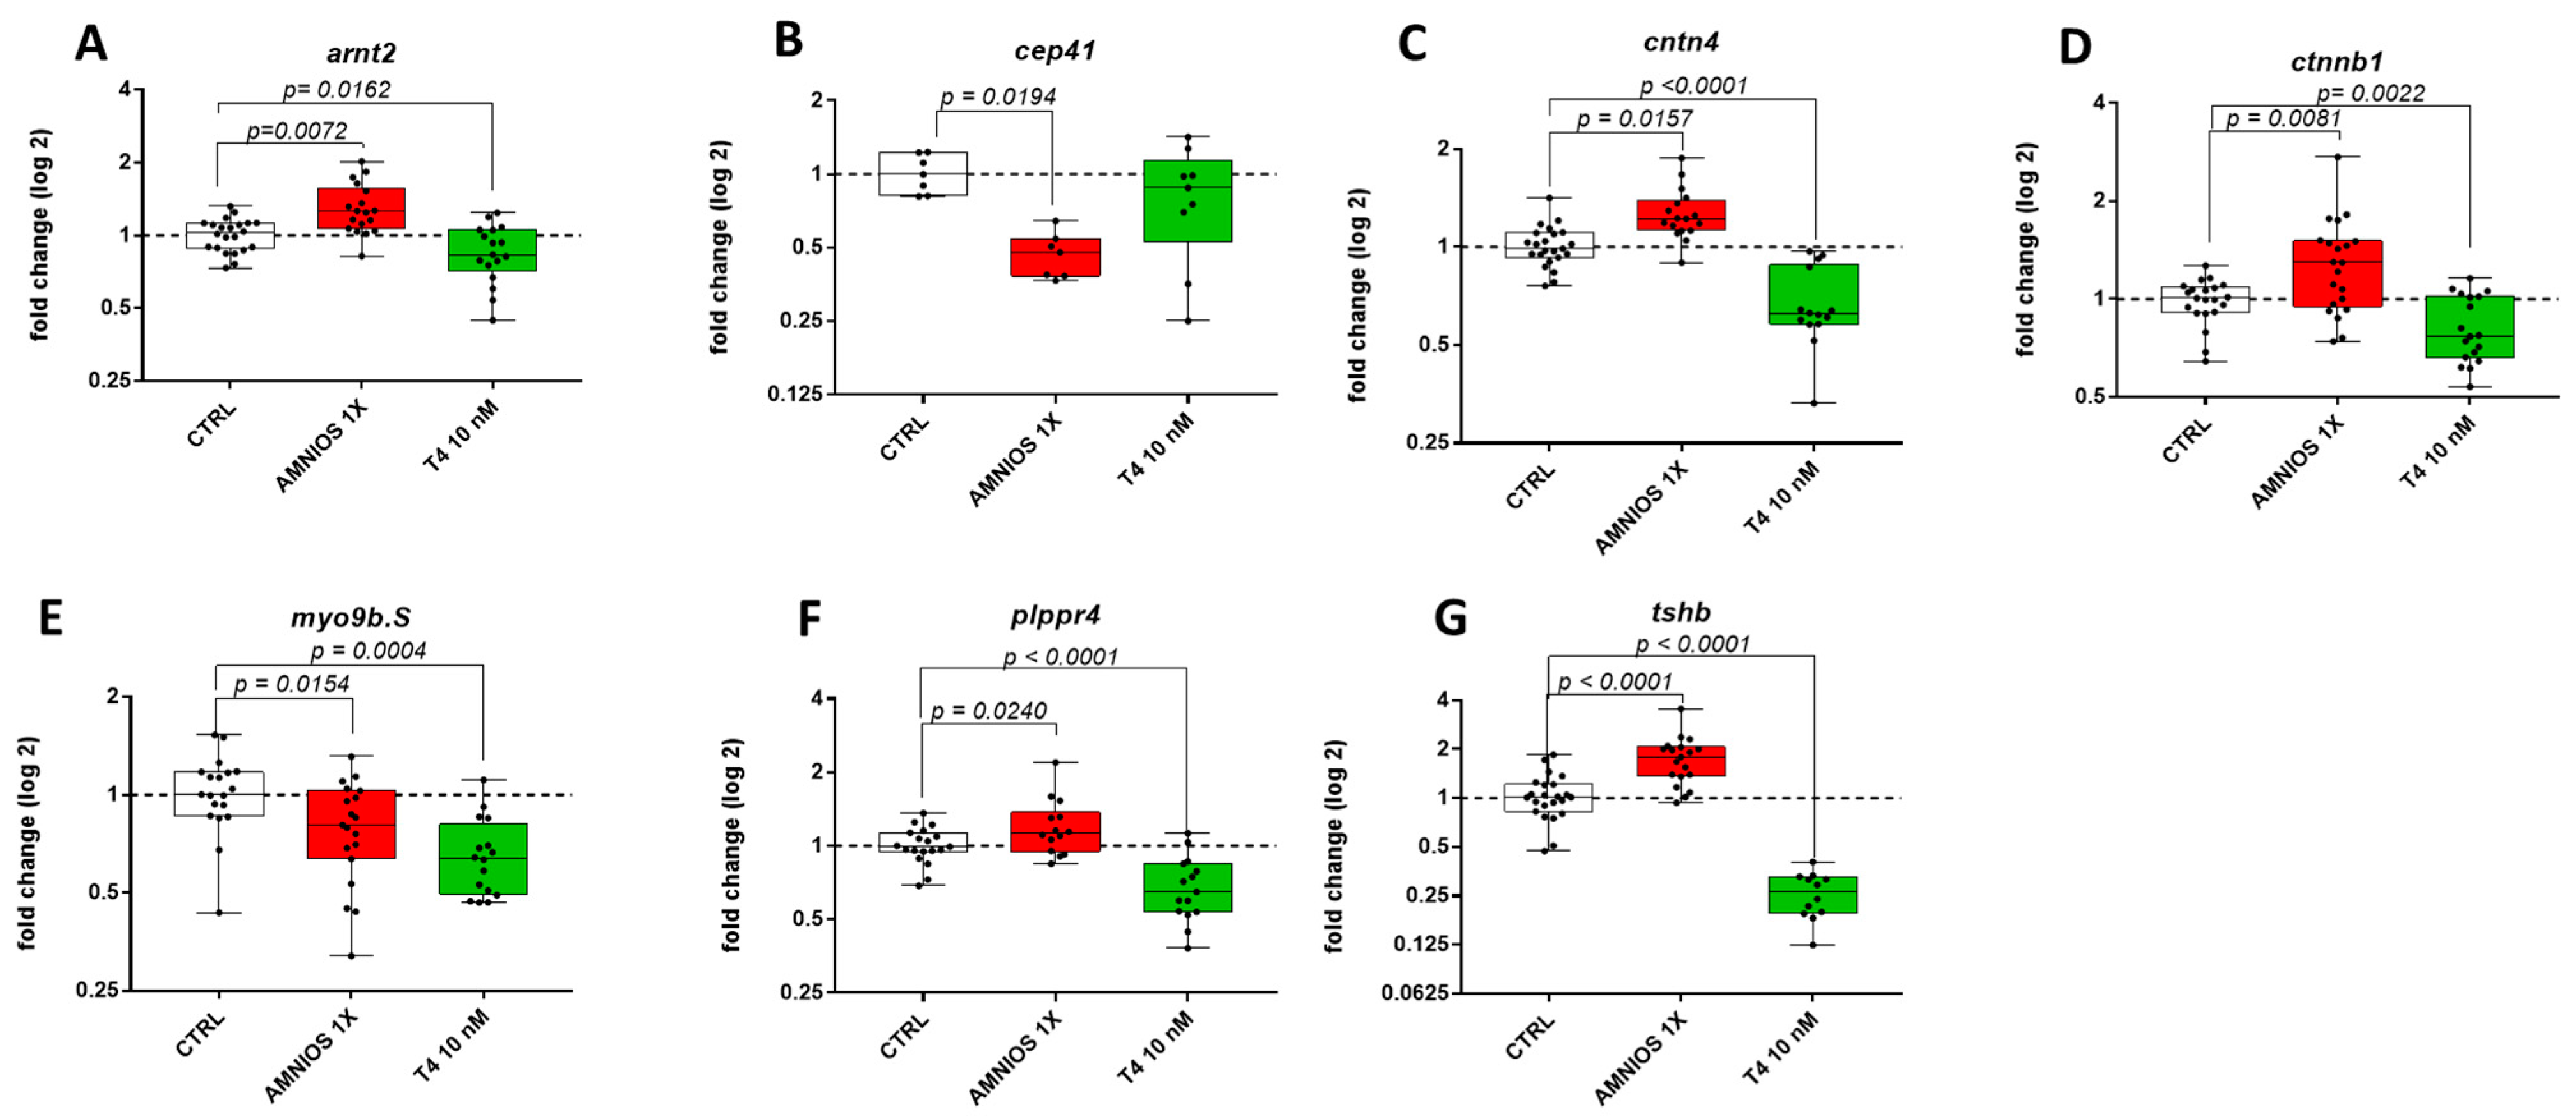
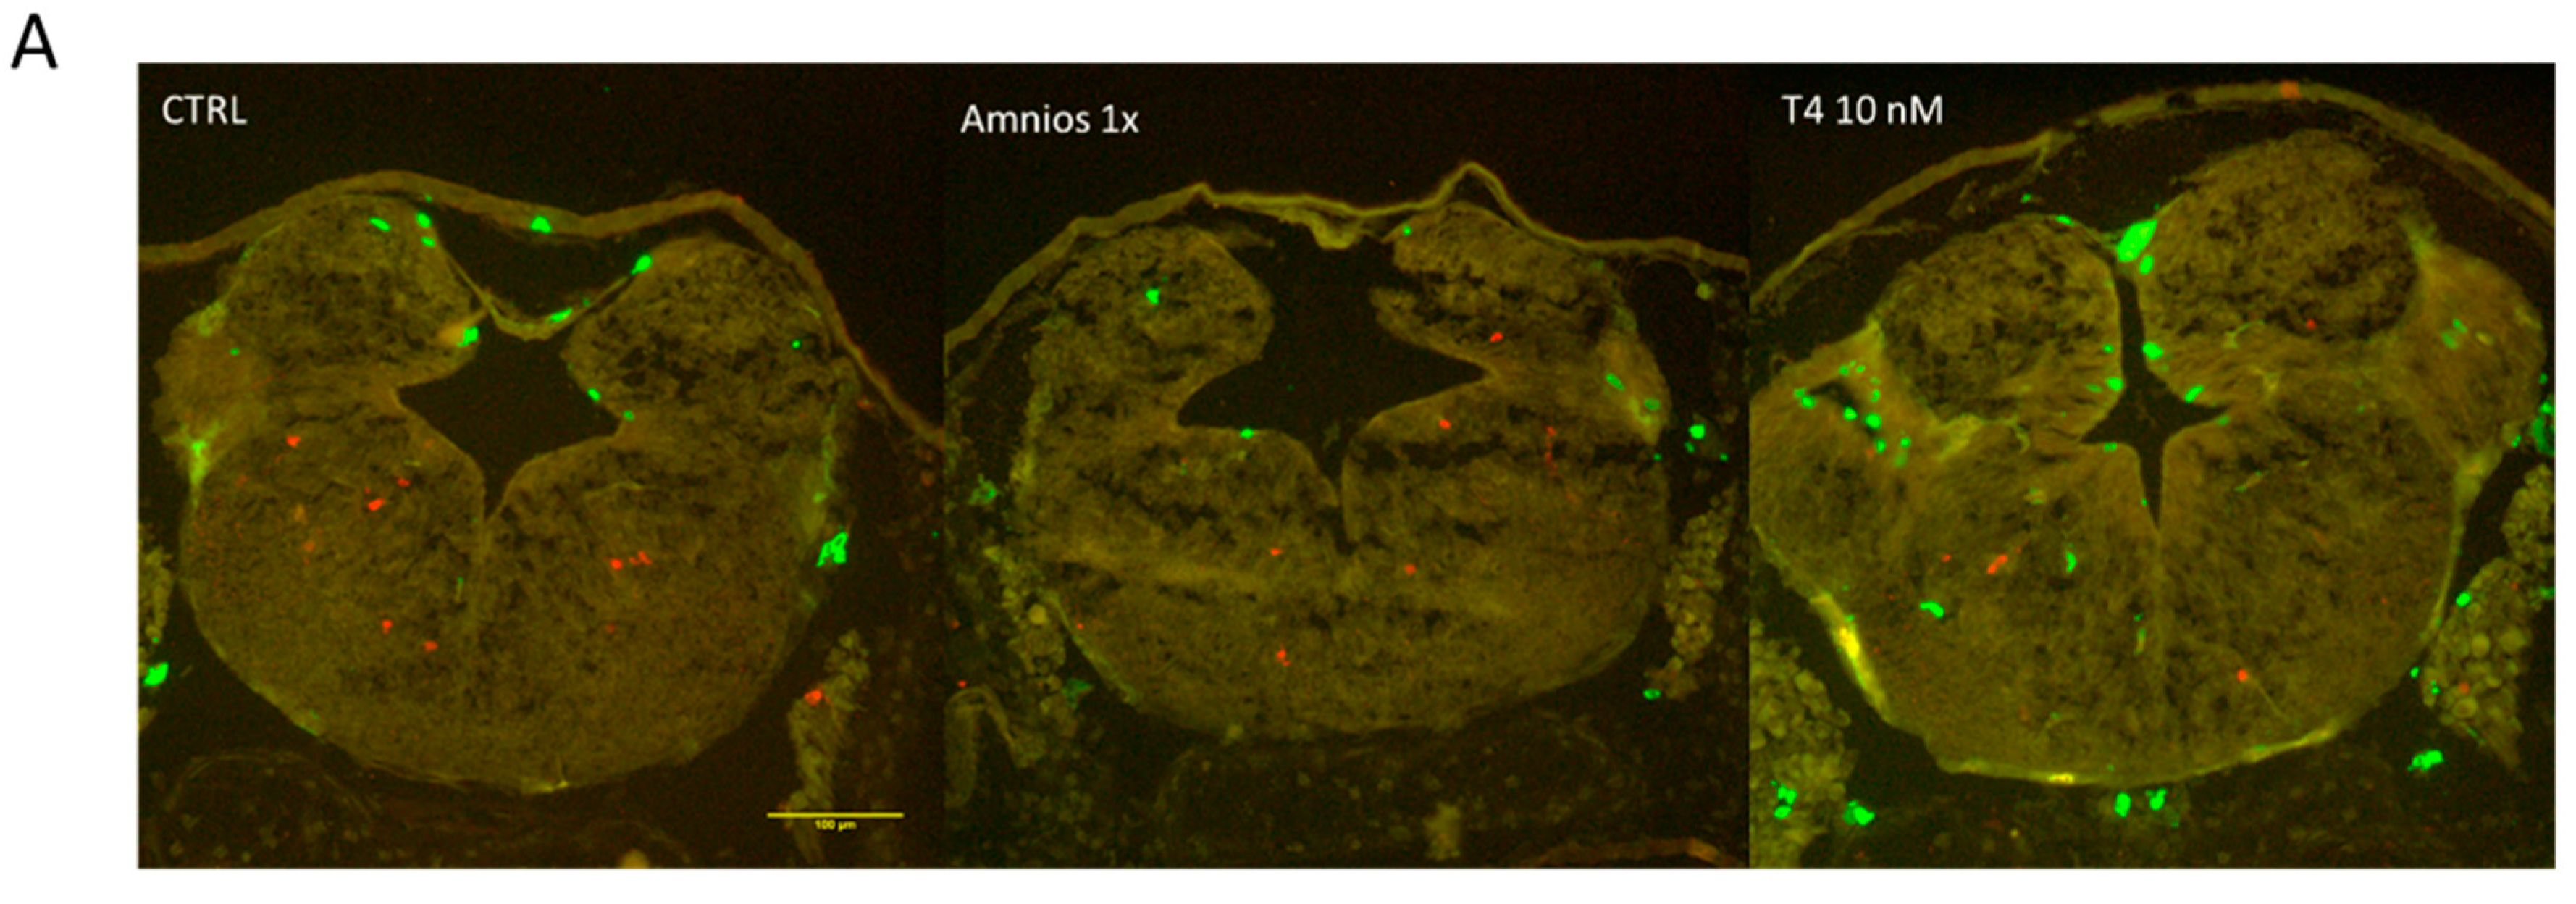
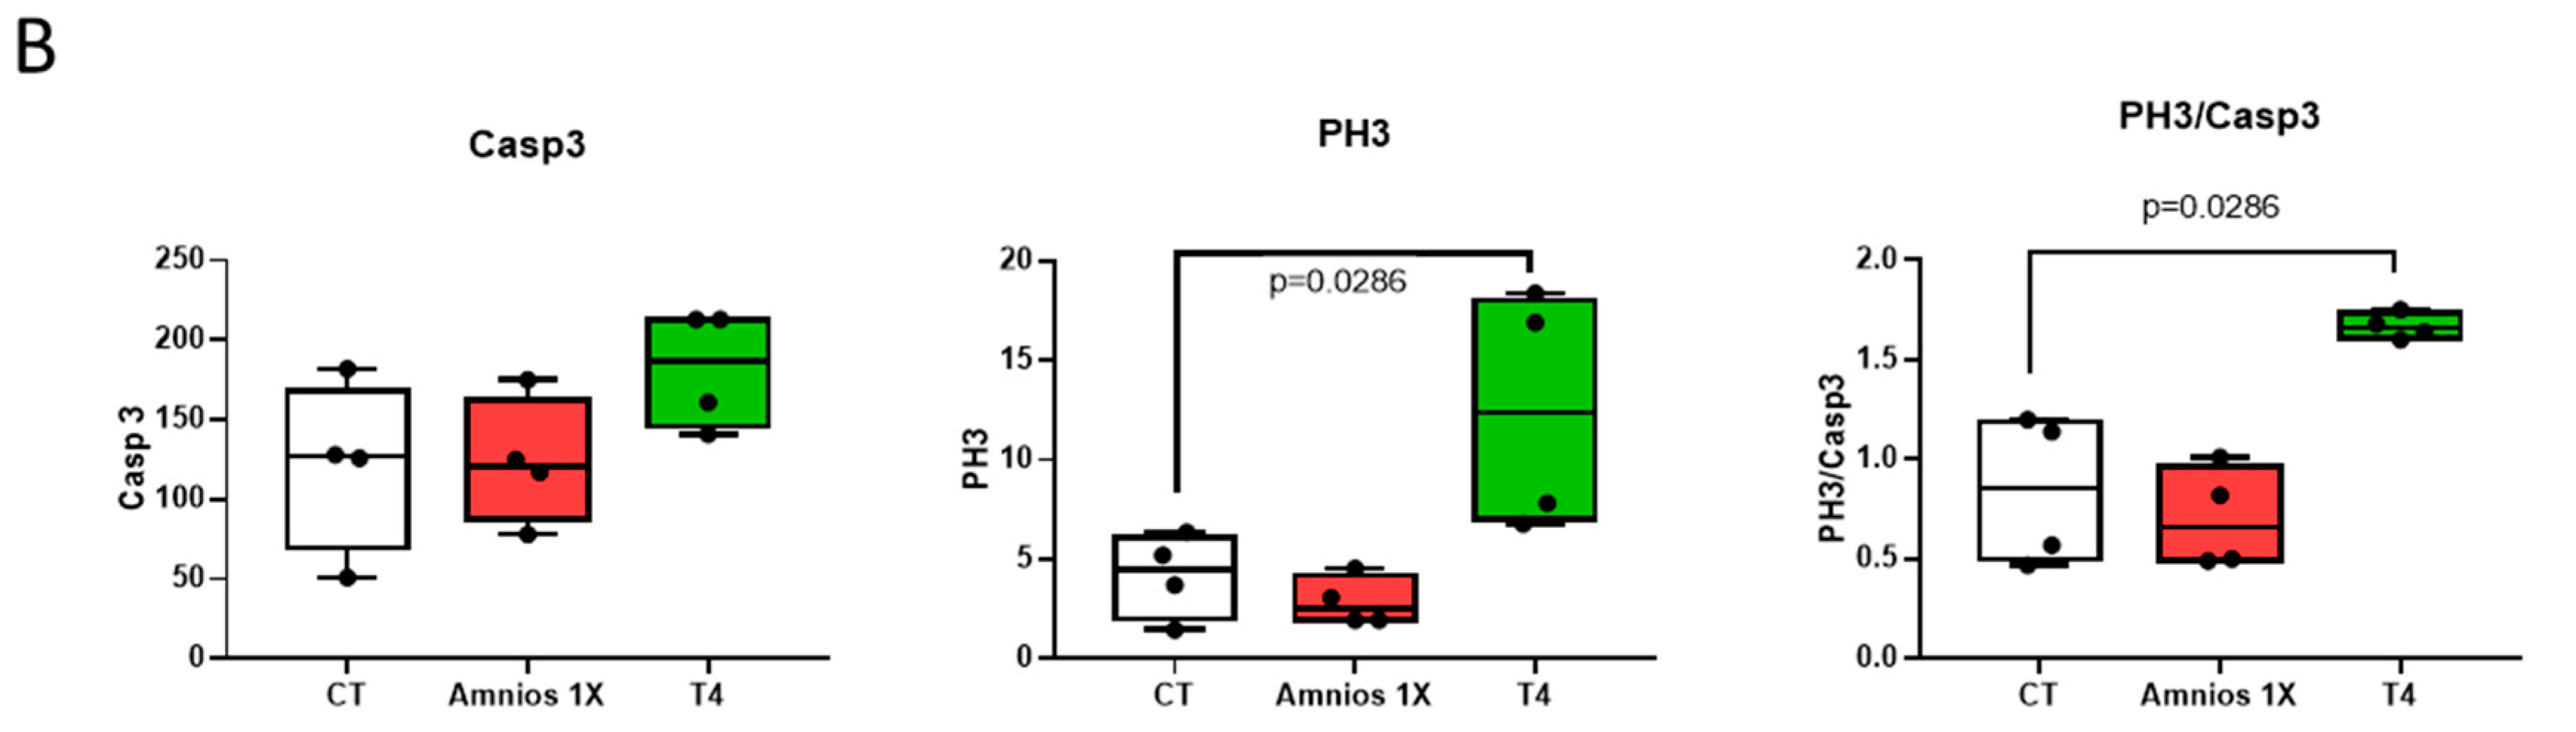
2. Results
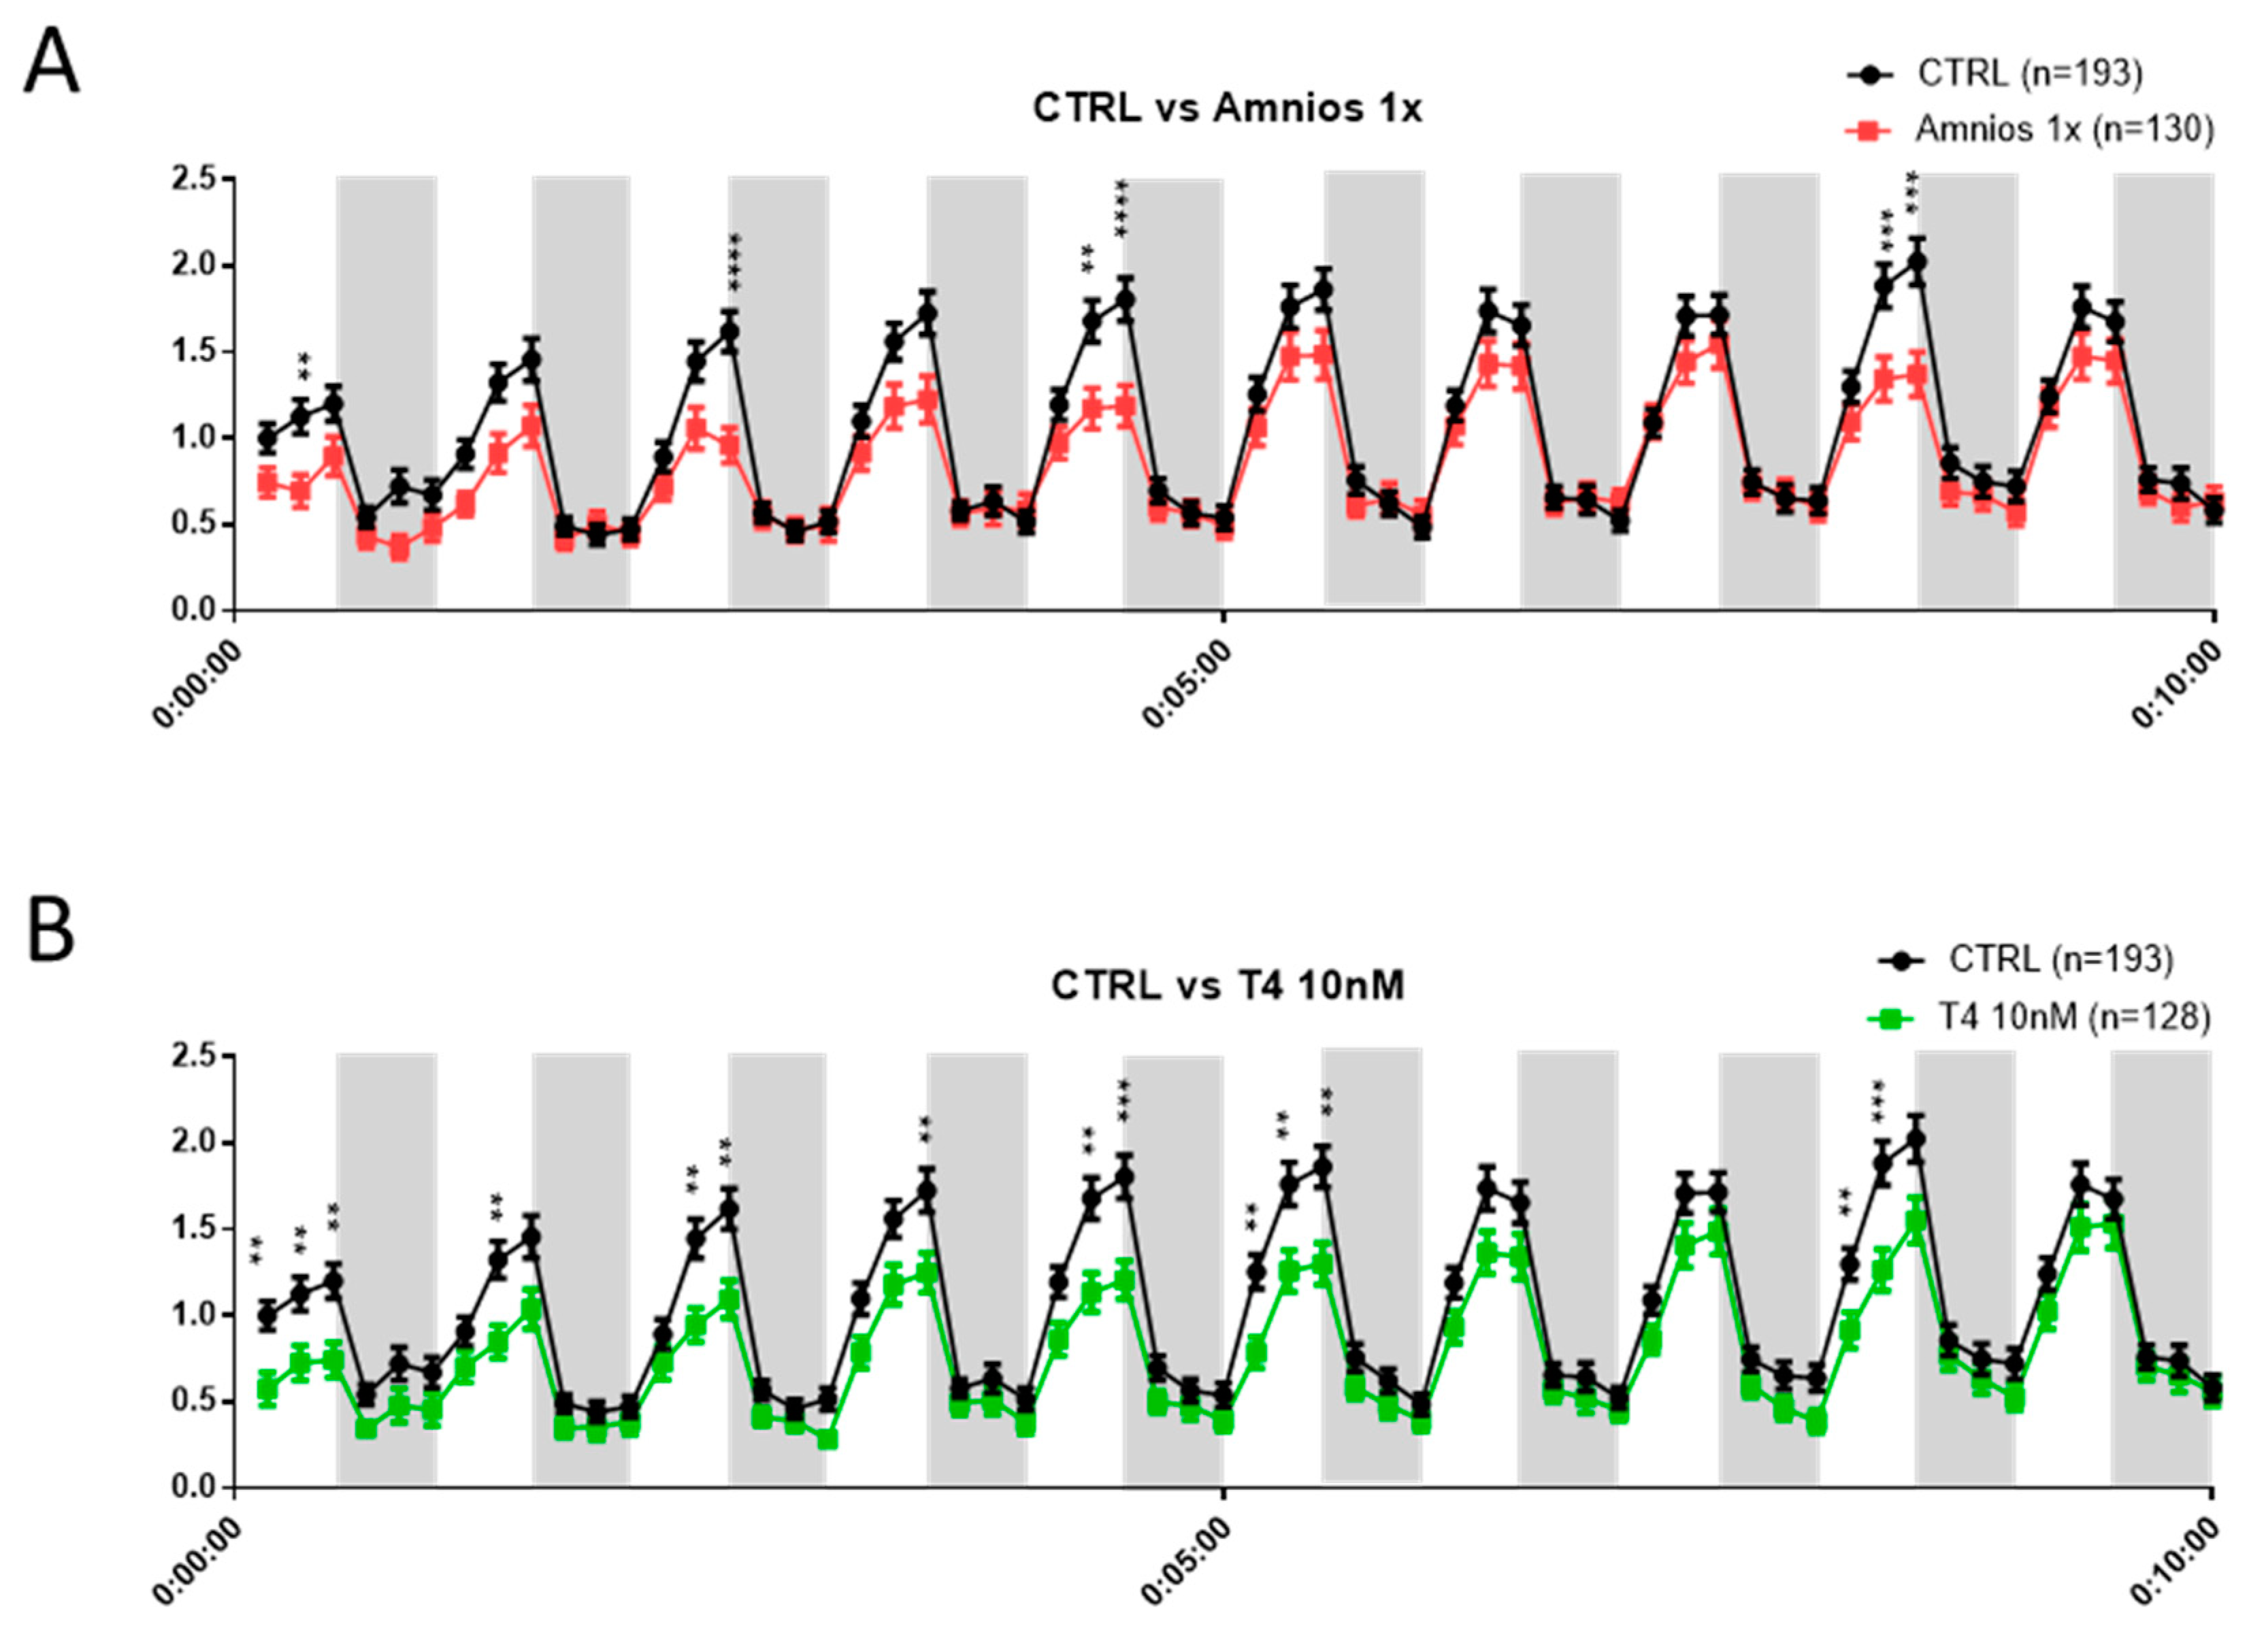
Exposure to an Amniotic Mixture Alters the Tadpole Behavior
3. Discussion
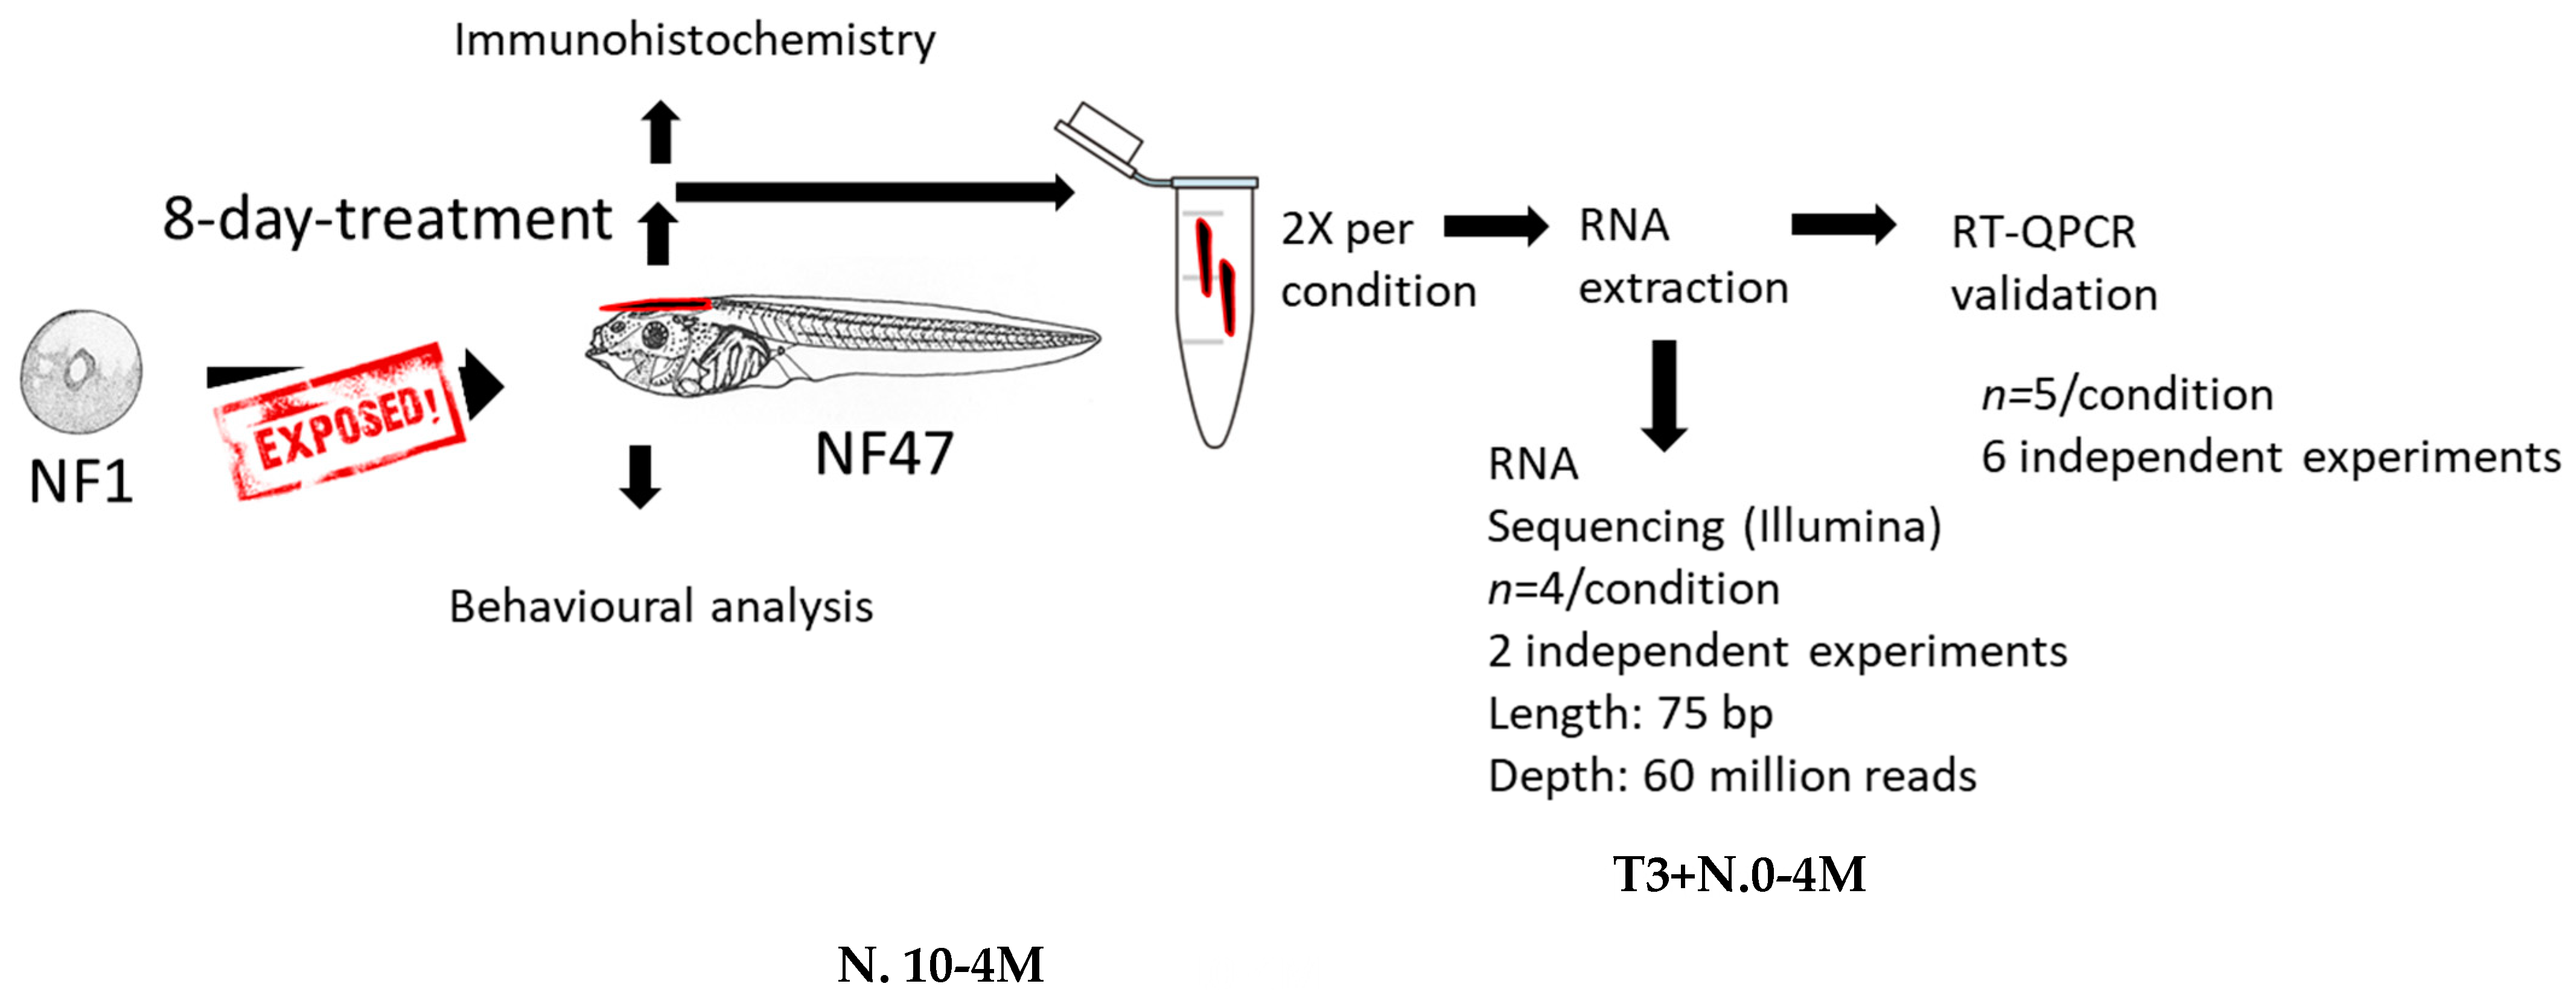
4. Material and Methods
4.1. Chemical Exposure
4.2. RNA Extraction
4.3. RT-qPCR
4.4. RNA-Sequencing
4.5. DAVID
4.6. Mobility
4.7. Immunohistochemistry
Author Contributions
Funding
Institutional Review Board Statement
Informed Consent Statement
Data Availability Statement
Acknowledgments
Conflicts of Interest
References
- Railton, T.C. Sporadic Cretinism Treated by Administration of the Thyroid Gland. Br. Med. J. 1894, 1, 1180–1181. [Google Scholar] [CrossRef] [PubMed][Green Version]
- Smith, T. Case of sporadic cretinism treated with thyroid gland. Br. Med. J. 1894, 1, 1178–1180. [Google Scholar] [CrossRef] [PubMed][Green Version]
- Bernal, J. Thyroid hormone receptors in brain development and function. Nat. Clin. Pract. Endocrinol. Metab. 2007, 3, 249–259. [Google Scholar] [CrossRef]
- Nunez, J.; Celi, F.S.; Ng, L.; Forrest, D. Multigenic control of thyroid hormone functions in the nervous system. Mol. Cell. Endocrinol. 2008, 287, 1–12. [Google Scholar] [CrossRef]
- Pharoah, P.O.; Ellis, S.M.; Ekins, R.P.; Williams, E.S. Maternal thyroid function, iodine deficiency and fetal development. Clin. Endocrinol. 1976, 5, 159–166. [Google Scholar] [CrossRef] [PubMed]
- Pop, V.J.; Kuijpens, J.L.; van Baar, A.L.; Verkerk, G.; van Son, M.M.; de Vijlder, J.J.; Vulsma, T.; Wiersinga, W.M.; Drexhage, H.A.; Vader, H.L. Low maternal free thyroxine concentrations during early pregnancy are associated with impaired psychomotor development in infancy. Clin. Endocrinol. 1999, 50, 149–155. [Google Scholar] [CrossRef] [PubMed]
- Levie, D.; Derakhshan, A.; Shu, H.; Broeren, M.; de Poortere, R.; Peeters, R.; Bornehag, C.-G.; Demeneix, B.; Korevaar, T. The association of maternal iodine status in early pregnancy with thyroid function in the SELMA study. Thyroid 2019, 29, 1660–1668. [Google Scholar] [CrossRef]
- Obregon, M.J.; Calvo, R.M.; Escobar Del Rey, F.; Morreale de Escobar, G. Ontogenesis of thyroid function and interactions with maternal function. Endocr. Dev. 2007, 10, 86–98. [Google Scholar] [CrossRef]
- Korevaar, T.I.M.; Muetzel, R.; Medici, M.; Chaker, L.; Jaddoe, V.W.V.; De Rijke, Y.B.; Steegers, E.P.; Visser, T.J.; White, T.; Peeters, R.P. Association of maternal thyroid function during early pregnancy with off spring IQ and brain morphology in childhood: A population-based prospective cohort study. Artic. Lancet Diabetes Endocrinol. 2016, 4, 35–43. [Google Scholar] [CrossRef]
- Honda, J.; Ogawa, K.; Taniguchi, K. [Immunohistochemical and morphometric studies on the development of the thyroid, parathyroid and ultimobranchial body in Xenopus laevis Daudin]. Jikken Dobutsu 1993, 42, 23–32. [Google Scholar] [CrossRef]
- Tata, J.R. Early metamorphic competence of Xenopus larvae. Dev. Biol. 1968, 18, 415–440. [Google Scholar] [CrossRef]
- Baker, B.S.; Tata, J.R. Accumulation of proto-oncogene c-erb-A related transcripts during Xenopus development: Association with early acquisition of response to thyroid hormone and estrogen. EMBO J. 1990, 9, 879–885. [Google Scholar] [CrossRef] [PubMed]
- Shi, Y.B.; Wong, J.; Puzianowska-Kuznicka, M.; Stolow, M.A. Tadpole competence and tissue-specific temporal regulation of amphibian metamorphosis: Roles of thyroid hormone and its receptors. BioEssays News Rev. Mol. Cell. Dev. Biol. 1996, 18, 391–399. [Google Scholar] [CrossRef]
- Fini, J.B.; Le Mével, S.; Palmier, K.; Darras, V.M.; Punzon, I.; Richardson, S.J.; Clerget-Froidevaux, M.S.; Demeneix, B.A. Thyroid hormone signaling in the Xenopus laevis embryo is functional and susceptible to endocrine disruption. Endocrinology 2012, 153, 5068–5081. [Google Scholar] [CrossRef] [PubMed]
- Woodruff, T.J.; Zota, A.R.; Schwartz, J.M. Environmental Chemicals in Pregnant Women in the United States: NHANES 2003–2004. Environ. Health Perspect. 2011, 119, 878–885. [Google Scholar] [CrossRef] [PubMed]
- Saaristo, M.; Brodin, T.; Balshine, S.; Bertram, M.G.; Brooks, B.W.; Ehlman, S.M.; McCallum, E.S.; Sih, A.; Sundin, J.; Wong, B.B.M.; et al. Direct and indirect effects of chemical contaminants on the behaviour, ecology and evolution of wildlife. Proc. Biol. Sci. 2018, 285, 20181297. [Google Scholar] [CrossRef] [PubMed]
- Boas, M.; Feldt-rasmussen, U.; Main, K.M. Molecular and Cellular Endocrinology Thyroid effects of endocrine disrupting chemicals. Mol. Cell. Endocrinol. 2012, 355, 240–248. [Google Scholar] [CrossRef]
- Crofton, K.M. Thyroid disrupting chemicals: Mechanisms and mixtures. Int. J. Androl. 2008, 31, 209–223. [Google Scholar] [CrossRef]
- Fini, J.; Mughal, B.B.; Mével, S.L.; Leemans, M.; Lettmann, M.; Spirhanzlova, P.; Affaticati, P.; Jenett, A. Human amniotic fluid contaminants alter thyroid hormone signalling and early brain development in Xenopus embryos. Sci. Rep. 2017, 7, 43786. [Google Scholar] [CrossRef]
- Zhang, W.; Liu, H.T. MAPK signal pathways in the regulation of cell proliferation in mammalian cells. Cell Res. 2002, 12, 9–18. [Google Scholar] [CrossRef]
- Kavčič, N.; Pegan, K.; Turk, B. Lysosomes in programmed cell death pathways: From initiators to amplifiers. Biol. Chem. 2017, 398, 289–301. [Google Scholar] [CrossRef] [PubMed]
- Chatonnet, F.; Flamant, F.; Morte, B. A temporary compendium of thyroid hormone target genes in brain. Biochim. Biophys. Acta Gene Regul. Mech. 2015, 1849, 122–129. [Google Scholar] [CrossRef] [PubMed]
- Rosina, E.; Battan, B.; Siracusano, M.; Di Criscio, L.; Hollis, F.; Pacini, L.; Curatolo, P.; Bagni, C. Disruption of mTOR and MAPK pathways correlates with severity in idiopathic autism. Transl. Psychiatry 2019, 9, 50. [Google Scholar] [CrossRef] [PubMed]
- Ryu, H.-H.; Lee, Y.-S. Cell type-specific roles of RAS-MAPK signaling in learning and memory: Implications in neurodevelopmental disorders. Neurobiol. Learn. Mem. 2016, 135, 13–21. [Google Scholar] [CrossRef] [PubMed]
- Vithayathil, J.; Pucilowska, J.; Landreth, G.E. ERK/MAPK signaling and autism spectrum disorders. In Progress in Brain Research; Elsevier B.V.: Amsterdam, The Netherlands, 2018; Volume 241, pp. 63–112. [Google Scholar]
- Faridar, A.; Jones-Davis, D.; Rider, E.; Li, J.; Gobius, I.; Morcom, L.; Richards, L.J.; Sen, S.; Sherr, E.H. Mapk/Erk activation in an animal model of social deficits shows a possible link to autism. Mol. Autism 2014, 5, 57. [Google Scholar] [CrossRef] [PubMed]
- Thompson, C.K.; Cline, H.T. Thyroid Hormone Acts Locally to Increase Neurogenesis, Neuronal Differentiation, and Dendritic Arbor Elaboration in the Tadpole Visual System. J. Neurosci. 2016, 36, 10356–10375. [Google Scholar] [CrossRef]
- Straka, H.; Simmers, J. Xenopus laevis: An ideal experimental model for studying the developmental dynamics of neural network assembly and sensory-motor computations. Dev. Neurobiol. 2012, 72, 649–663. [Google Scholar] [CrossRef]
- Leloup, J.; Buscaglia, M. La triiodothyronine, hormone de la metamorphose des Amphibiens. C. R. Acad. Sci. Paris D 1977, 284, 2261–2263. [Google Scholar]
- Regard, E. Cytophysiology of the Amphibian Thyroid Gland through Larval Development and Metamorphosis. Int. Rev. Cytol. 1978, 52, 81–118. [Google Scholar] [CrossRef]
- Prati, M.; Calvo, R.; Morreale De Escobar, G. L-thyroxine and 3,5,3′-triiodothyronine concentrations in the chicken egg and in the embryo before and after the onset of thyroid function. Endocrinology 1992, 130, 2651–2659. [Google Scholar] [CrossRef]
- McNabb, F.M.A.; Darras, V.M. Thyroids. In Sturkie’s Avian Physiology, 6th ed.; Elsevier Inc.: Amsterdam, The Netherlands, 2014; pp. 535–547. ISBN 978-0-12-407160-5. [Google Scholar]
- Ruuskanen, S.; Darras, V.M.; Visser, M.E.; Groothuis, T.G.G. Effects of experimentally manipulated yolk thyroid hormone levels on offspring development in a wild bird species. Horm. Behav. 2016, 81, 38–44. [Google Scholar] [CrossRef] [PubMed]
- Flickinger, R.A. Sequential appearance of monoiodotyrosine, diiodotyrosine, and thyroxine in the developing frog embryo. Gen. Comp. Endocrinol. 1964, 4, 285–289. [Google Scholar] [CrossRef] [PubMed]
- Denef, C. Paracrinicity: The story of 30 years of cellular pituitary crosstalk. J. Neuroendocrinol. 2008, 20, 1–70. [Google Scholar] [CrossRef] [PubMed]
- Licht, P.; Denver, R.J. Regulation of pituitary thyrotropin secretion. Prog. Clin. Biol. Res. 1990, 342, 427–432. [Google Scholar] [PubMed]
- Büyükgebiz, A. Newborn screening for congenital hypothyroidism. JCRPE J. Clin. Res. Pediatr. Endocrinol. 2013, 5, 8–12. [Google Scholar] [CrossRef]
- Tonyushkina, K.N.; Shen, M.C.; Ortiz-Toro, T.; Karlstrom, R.O. Embryonic exposure to excess thyroid hormone causes thyrotrope cell death. J. Clin. Investig. 2014, 124, 321–327. [Google Scholar] [CrossRef]
- Zucchi, R.; Rutigliano, G.; Saponaro, F. Novel thyroid hormones. Endocrine 2019, 66, 95–104. [Google Scholar] [CrossRef]
- Tindall, A.J.; Morris, I.D.; Pownall, M.E.; Isaacs, H.V. Expression of enzymes involved in thyroid hormone metabolism during the early development of Xenopus tropicalis. Biol. Cell 2007, 99, 151–163. [Google Scholar] [CrossRef]
- Dubois, G.M.; Sebillot, A.; Kuiper, G.G.J.M.; Verhoelst, C.H.J.; Darras, V.M.; Visser, T.J.; Demeneix, B.A. Deiodinase activity is present in Xenopus laevis during early embryogenesis. Endocrinology 2006, 147, 4941–4949. [Google Scholar] [CrossRef]
- Spirhanzlova, P.; Leemans, M.; Demeneix, B.A.; Fini, J.-B. Following Endocrine-Disrupting Effects on Gene Expression in Xenopus laevis. Cold Spring Harb. Protoc. 2019, 2019, prot098301. [Google Scholar] [CrossRef]


| n° | Family | Molecule | Concentration 1X (Actual Concentration Found in Amniotic Fluid) |
|---|---|---|---|
| 1 | Phenol | Bisphenol A | 0.2 × 10⁻⁸ M |
| 2 | Phenol | Triclosan | 0.7 × 10⁻⁷ M |
| 3 | Phenol | Benzophenone-3 | 0.86 × 10⁻⁷ M |
| 4 | Phthalate | Dibutyl phthalate | 0.24 × 10⁻⁶ M |
| 5 | Phthalate | Di-2-ethylhexyl phthalate | 0.1 × 10⁻⁶ M |
| 6 | Organochlorine pesticide | Hexachlorobenzene | 0.8 × 10⁻¹¹ M |
| 7 | Organochlorine pesticide | Dichlorodiphenyldichloroethylene | 0.66 × 10⁻⁹ M |
| 8 | Perfluorinated compound | Perfluorooctanoic acid | 0.43 × 10⁻⁸ M |
| 9 | Perfluorinated compound | Perfluorooctanesulfonic acid | 0.8 × 10⁻⁸ M |
| 10 | Poly aromatic hydroxylated compound | 2-napthol | 0.5 × 10⁻⁸ M |
| 11 | Polychlorinated compound | Sodium perchlorate monohydrate | 0.3 × 10⁻⁸ M |
| 12 | Polybrominated compound | Decabromodiphenyl ether | 0.63 × 10⁻⁹ M |
| 13 | Polychlorinated compound | PCB-153 | 0.2 × 10⁻⁸ M |
| 14 | Heavy metal | Methyl mercury(III) chloride | 0.5 × 10⁻⁷ M |
| 15 | Heavy metal | Lead (II) chloride | 0.21 × 10⁻⁸ M |
| Exposure | Gene | Pathway | |
|---|---|---|---|
| Mixture 1x | cacnb1.S (calcium channel, voltage-dependent, beta 1 subunit S) nfkb2.S (nuclear factor of kappa light polypeptide gene enhancer in B-cells 2 (p49/p100) S) myd88.S (myeloid differentiation primary response 88 S) irak4.L (interleukin 1 receptor associated kinase 4 L) fos.S (FBJ murine osteosarcoma viral oncogene S) myc.S (v-myc avian myelocytomatosis viral oncogene S) hspa8.L (heat shock protein family A (Hsp70) member 8) | MAPK signaling pathway | |
| Mixture 1x | ctns.L (cystinosin, lysosomal cystine transporter glb1l.L (galactosidase beta 1 like L) naga.L (N-acetylgalactosaminidase, alpha- L) mfsd8.L (major facilitator superfamily domain containing 8 L) galc.L (galactosylceramidase L) arsa.1.S (arylsulfatase A, gene 1 S) ap3s2.S (adaptor related protein complex 3 sigma 2 subunit S) gm2a.L (GM2 ganglioside activator L) | Lysosome | |
| T4 (10 nM) | gria1.L/S (glutamate receptor, ionotropic, AMPA 1 L/S) kiss1.S (kisspeptin S) tshb.L.S (thyroid stimulating hormone, beta L/S) gabrd.L (gamma-aminobutyric acid (GABA) A receptor, delta L) gnrh2.L (gonadotropin releasing hormone 2 L) htr2C.L (5-hydroxytryptamine (serotonin) receptor 2C, G protein-coupled L) glrb.L/S (glycine receptor beta L/S) gabbr1.S (gamma-aminobutyric acid (GABA) B receptor, 1 S) pth2R.L (parathyroid hormone 2 receptor L) pyy.S (peptide YY S) pth2R.L (nociceptin receptor-like S) sstr5.S (somatostatin receptor 5 S) nmur1.L (neuromedin U receptor 1 L) grpr.L (gastrin releasing peptide receptor L) p2rx5.L (purinergic receptor P2X, ligand gated ion channel, 5 L) gpr83.2.L (G protein-coupled receptor 83 L) s1pr5. L (sphingosine-1-phosphate receptor 5 L) avpr1a.L (arginine vasopressin receptor 1A L) nts.L (neurotensin L) drd1.S (dopamine receptor D1 S) chrna7.S (cholinergic receptor, nicotinic alpha 7 S) galr3.L/S (galanin receptor 3 L/S) adm.S (adrenomedullin S) thrb.L (thyroid hormone receptor, beta L) | vip.S (vasoactive intestinal peptide S) htr5.L (5-hydroxytryptamine (serotonin) receptor 5A, G protein-coupled L) mc5r.L (melanocortin 5 receptor L) tacr3.L (tachykinin receptor 3 L) calcr.S (calcitonin receptor S) lpar1.L (lysophosphatidic acid receptor 1 L) drd2.L/S (dopamine receptor D2 L/S) grik2 (glutamate receptor, ionotropic, kainate 2) crhr2.S (corticotropin releasing hormone receptor 2 L/S) cga.L/S (glycoprotein hormones, alpha polypeptide S) ednrb2.S (endothelin receptor B subtype 2 S) lpar1.S (lysophosphatidic acid receptor 1 S) trh.L (thyrotropin-releasing hormone L) adcyap1.L (adenylate cyclase activating polypeptide 1 (pituitary) L) ghr.L (growth hormone receptor L) aplnr.L (apelin receptor L) pdyn.L/S (prodynorphin L) s1pr1.L (sphingosine-1-phosphate receptor 1 L) penk.L (proenkephalin L) prl.1.S (prolactin, gene 1) tac1.L/S (tachykinin precursor 1 L/S) | Neuroactive ligand-receptor interaction |
Disclaimer/Publisher’s Note: The statements, opinions and data contained in all publications are solely those of the individual author(s) and contributor(s) and not of MDPI and/or the editor(s). MDPI and/or the editor(s) disclaim responsibility for any injury to people or property resulting from any ideas, methods, instructions or products referred to in the content. |
© 2023 by the authors. Licensee MDPI, Basel, Switzerland. This article is an open access article distributed under the terms and conditions of the Creative Commons Attribution (CC BY) license (https://creativecommons.org/licenses/by/4.0/).
Share and Cite
Leemans, M.; Spirhanzlova, P.; Couderq, S.; Le Mével, S.; Grimaldi, A.; Duvernois-Berthet, E.; Demeneix, B.; Fini, J.-B. A Mixture of Chemicals Found in Human Amniotic Fluid Disrupts Brain Gene Expression and Behavior in Xenopus laevis. Int. J. Mol. Sci. 2023, 24, 2588. https://doi.org/10.3390/ijms24032588
Leemans M, Spirhanzlova P, Couderq S, Le Mével S, Grimaldi A, Duvernois-Berthet E, Demeneix B, Fini J-B. A Mixture of Chemicals Found in Human Amniotic Fluid Disrupts Brain Gene Expression and Behavior in Xenopus laevis. International Journal of Molecular Sciences. 2023; 24(3):2588. https://doi.org/10.3390/ijms24032588
Chicago/Turabian StyleLeemans, Michelle, Petra Spirhanzlova, Stephan Couderq, Sébastien Le Mével, Alexis Grimaldi, Evelyne Duvernois-Berthet, Barbara Demeneix, and Jean-Baptiste Fini. 2023. "A Mixture of Chemicals Found in Human Amniotic Fluid Disrupts Brain Gene Expression and Behavior in Xenopus laevis" International Journal of Molecular Sciences 24, no. 3: 2588. https://doi.org/10.3390/ijms24032588
APA StyleLeemans, M., Spirhanzlova, P., Couderq, S., Le Mével, S., Grimaldi, A., Duvernois-Berthet, E., Demeneix, B., & Fini, J.-B. (2023). A Mixture of Chemicals Found in Human Amniotic Fluid Disrupts Brain Gene Expression and Behavior in Xenopus laevis. International Journal of Molecular Sciences, 24(3), 2588. https://doi.org/10.3390/ijms24032588