
High Temperature CO2 Capture Performance and Kinetic Analysis of Novel Potassium Stannate


Abstract
1. Introduction
2. Results and Discussion
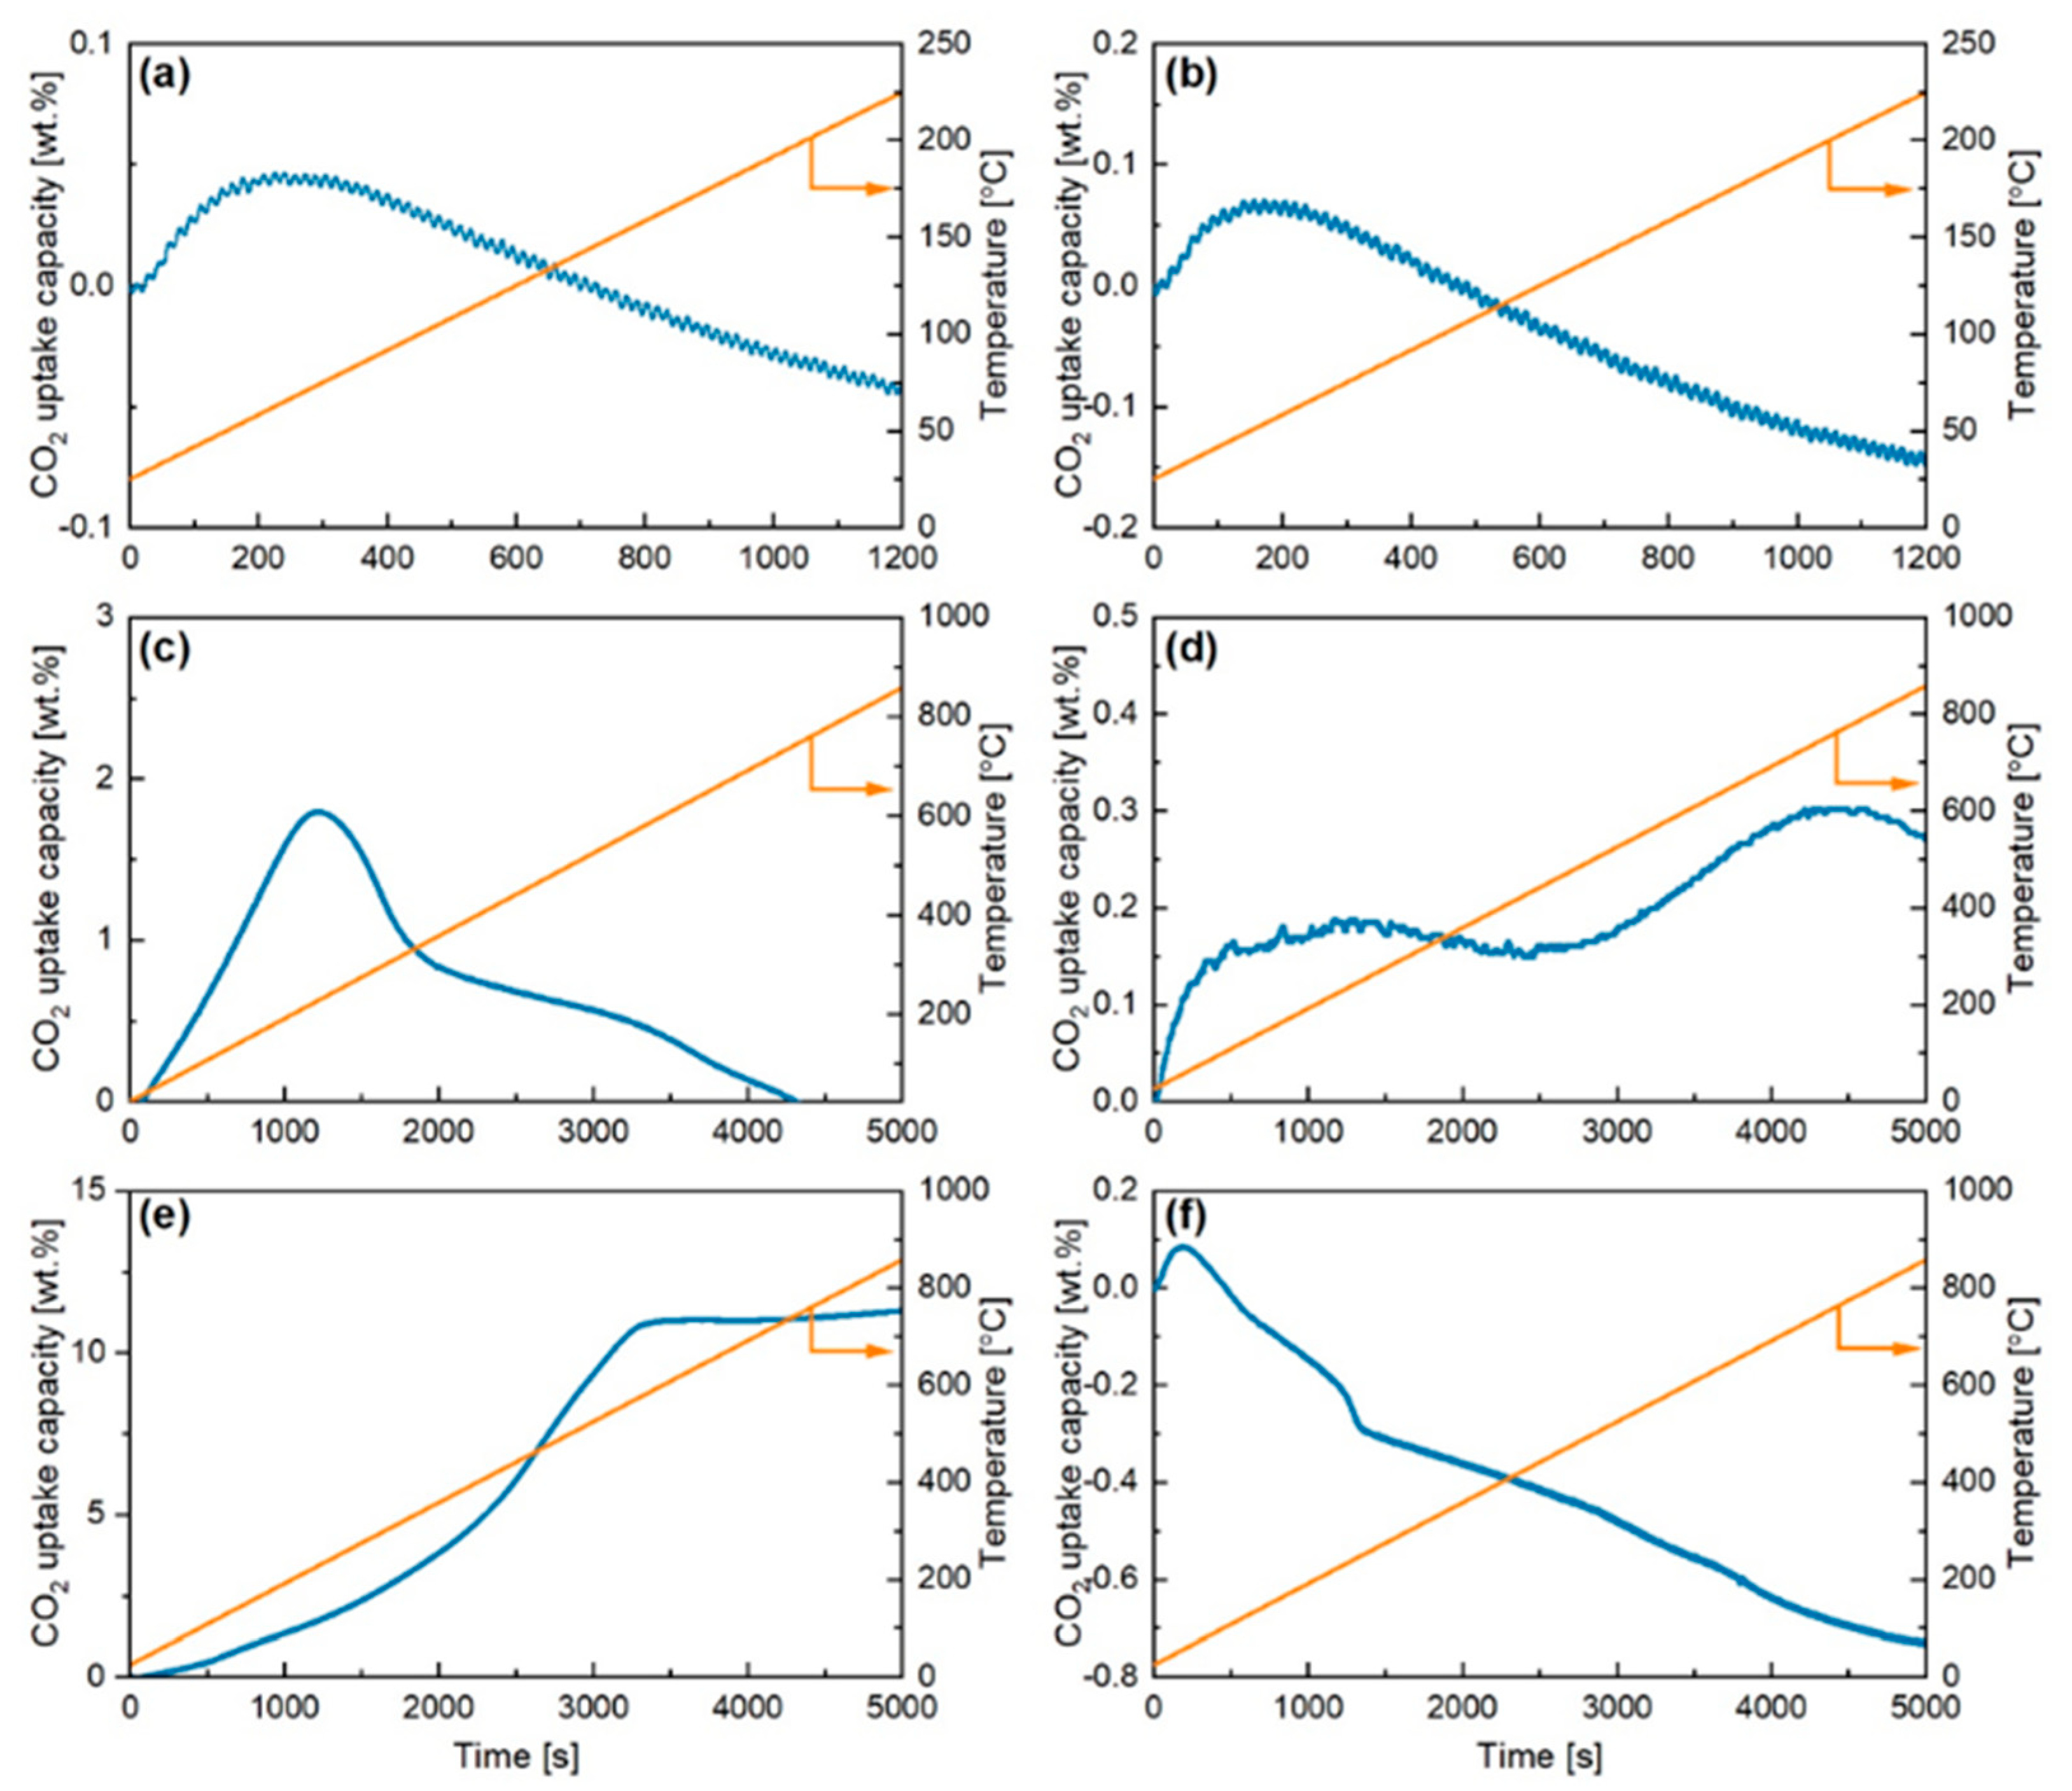
2.1. Thermogravimetric Dynamic Analysis
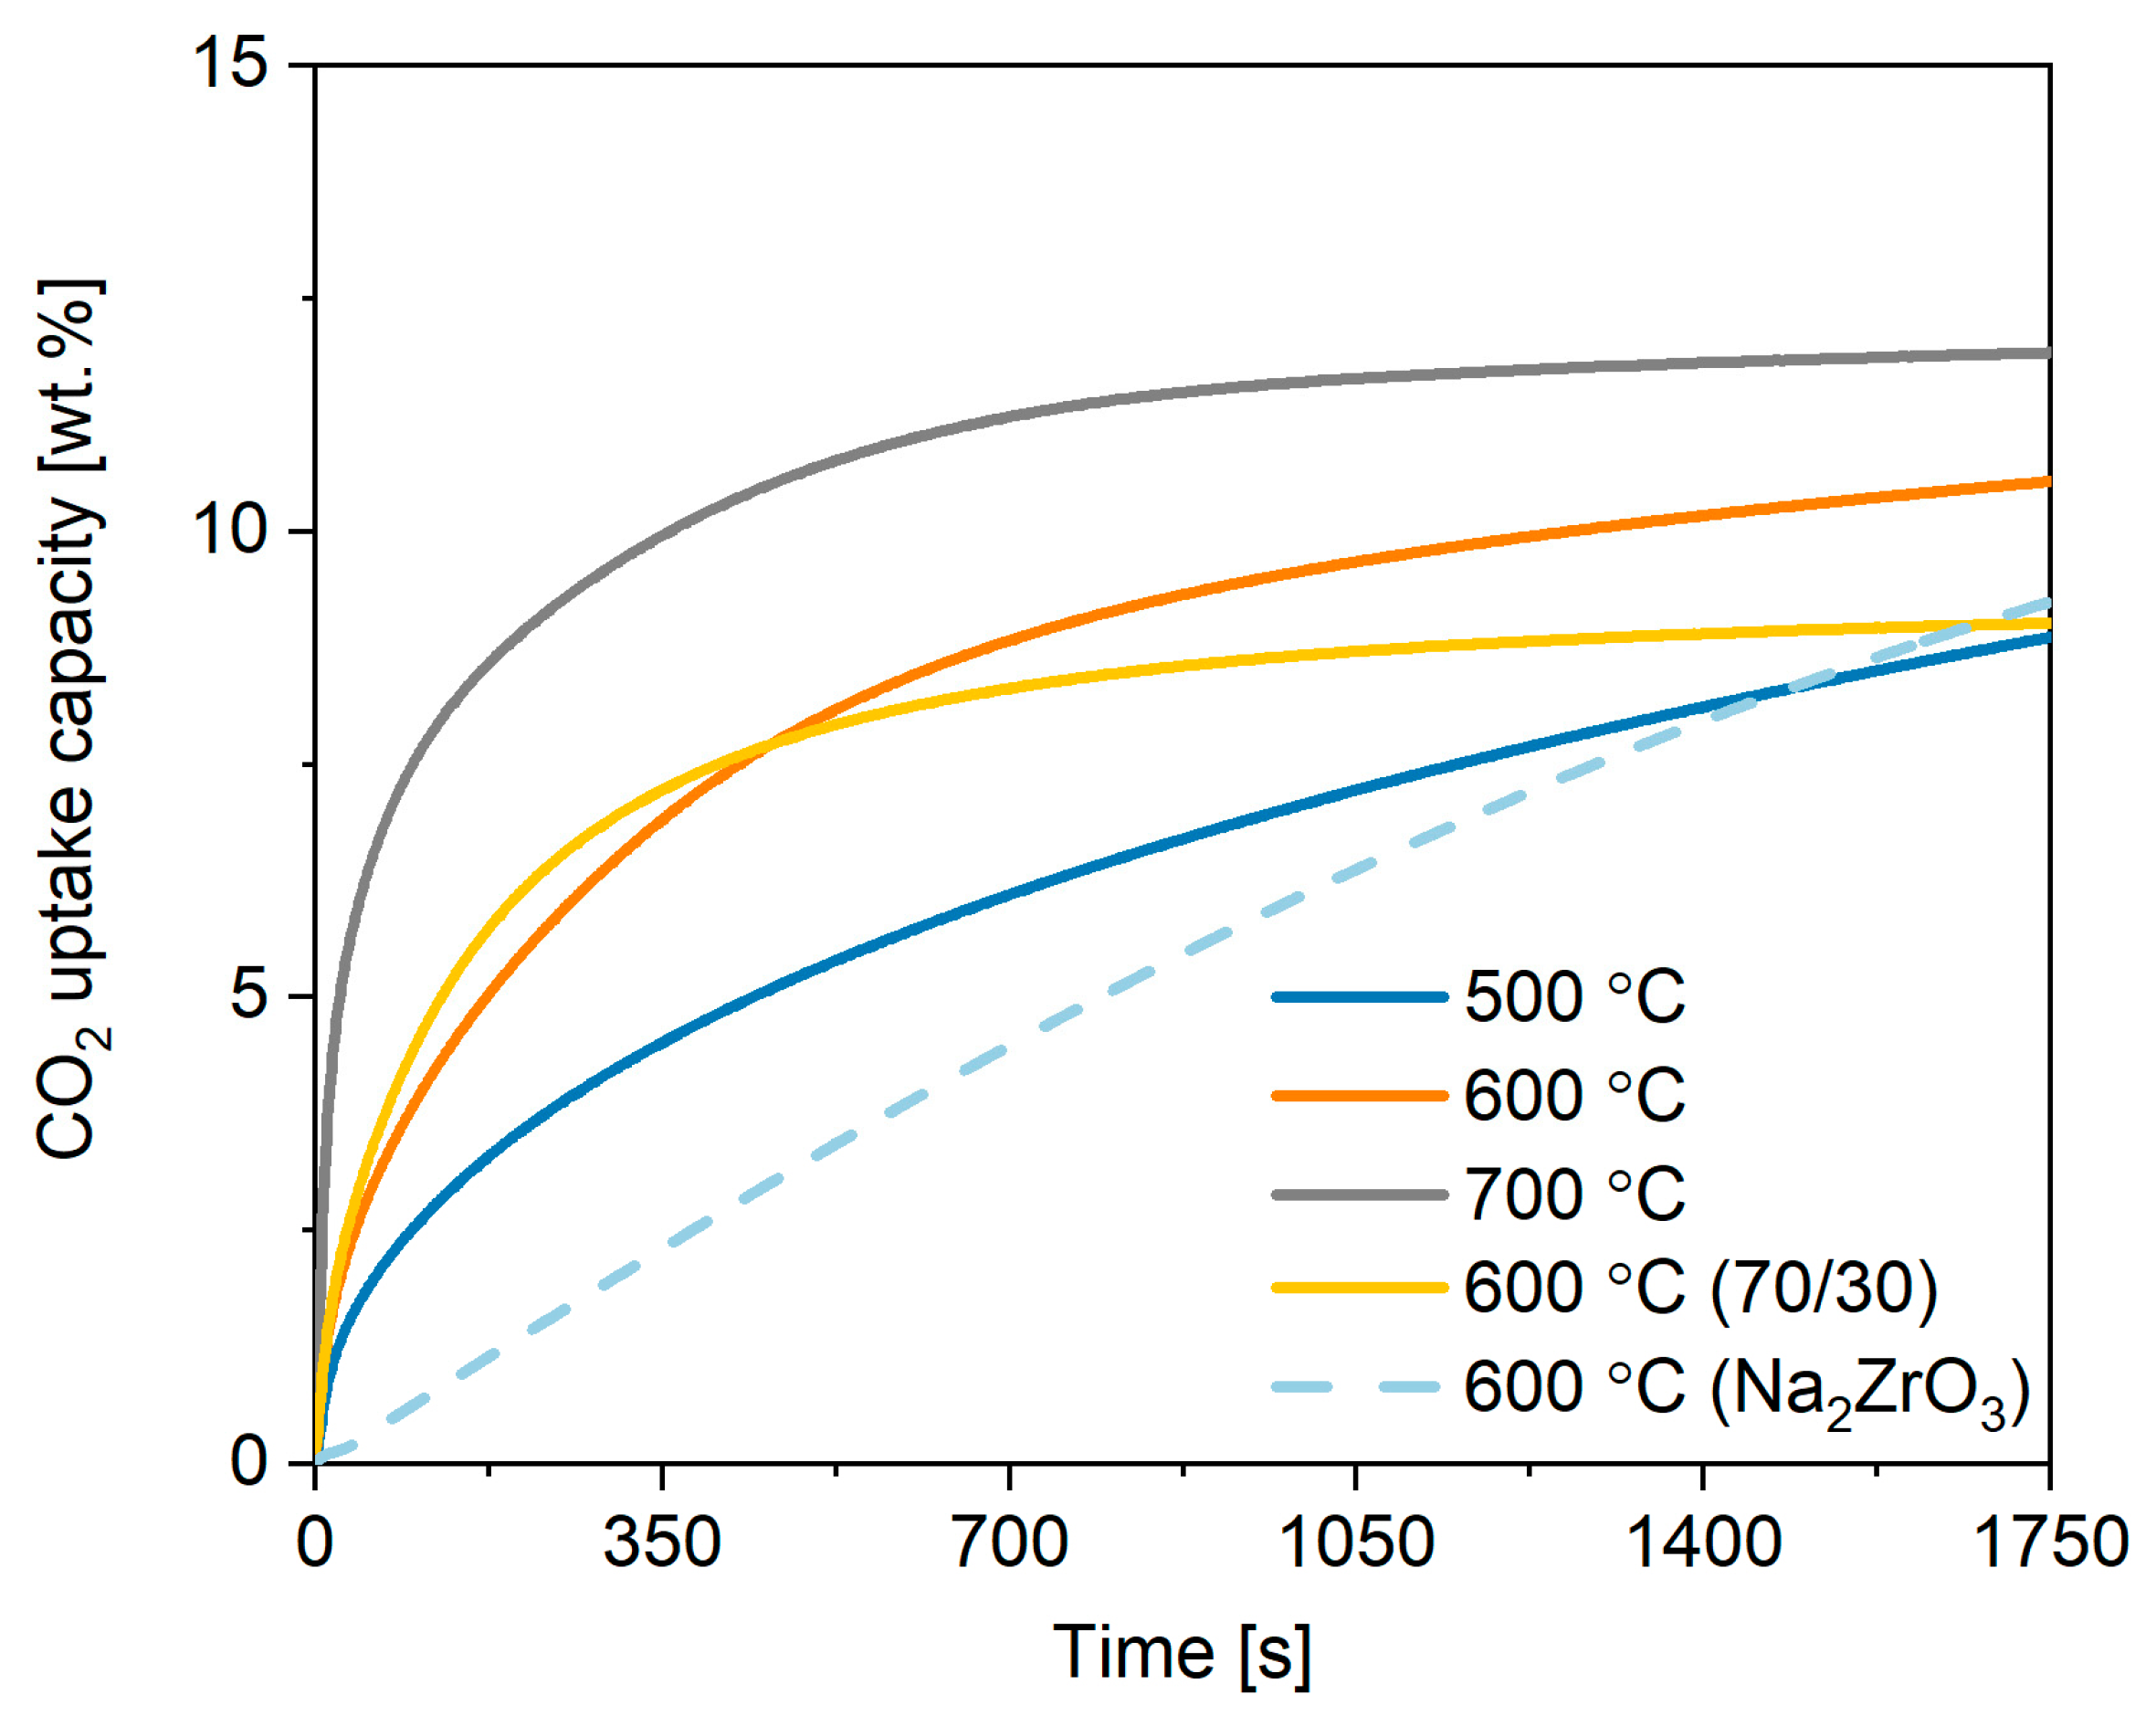
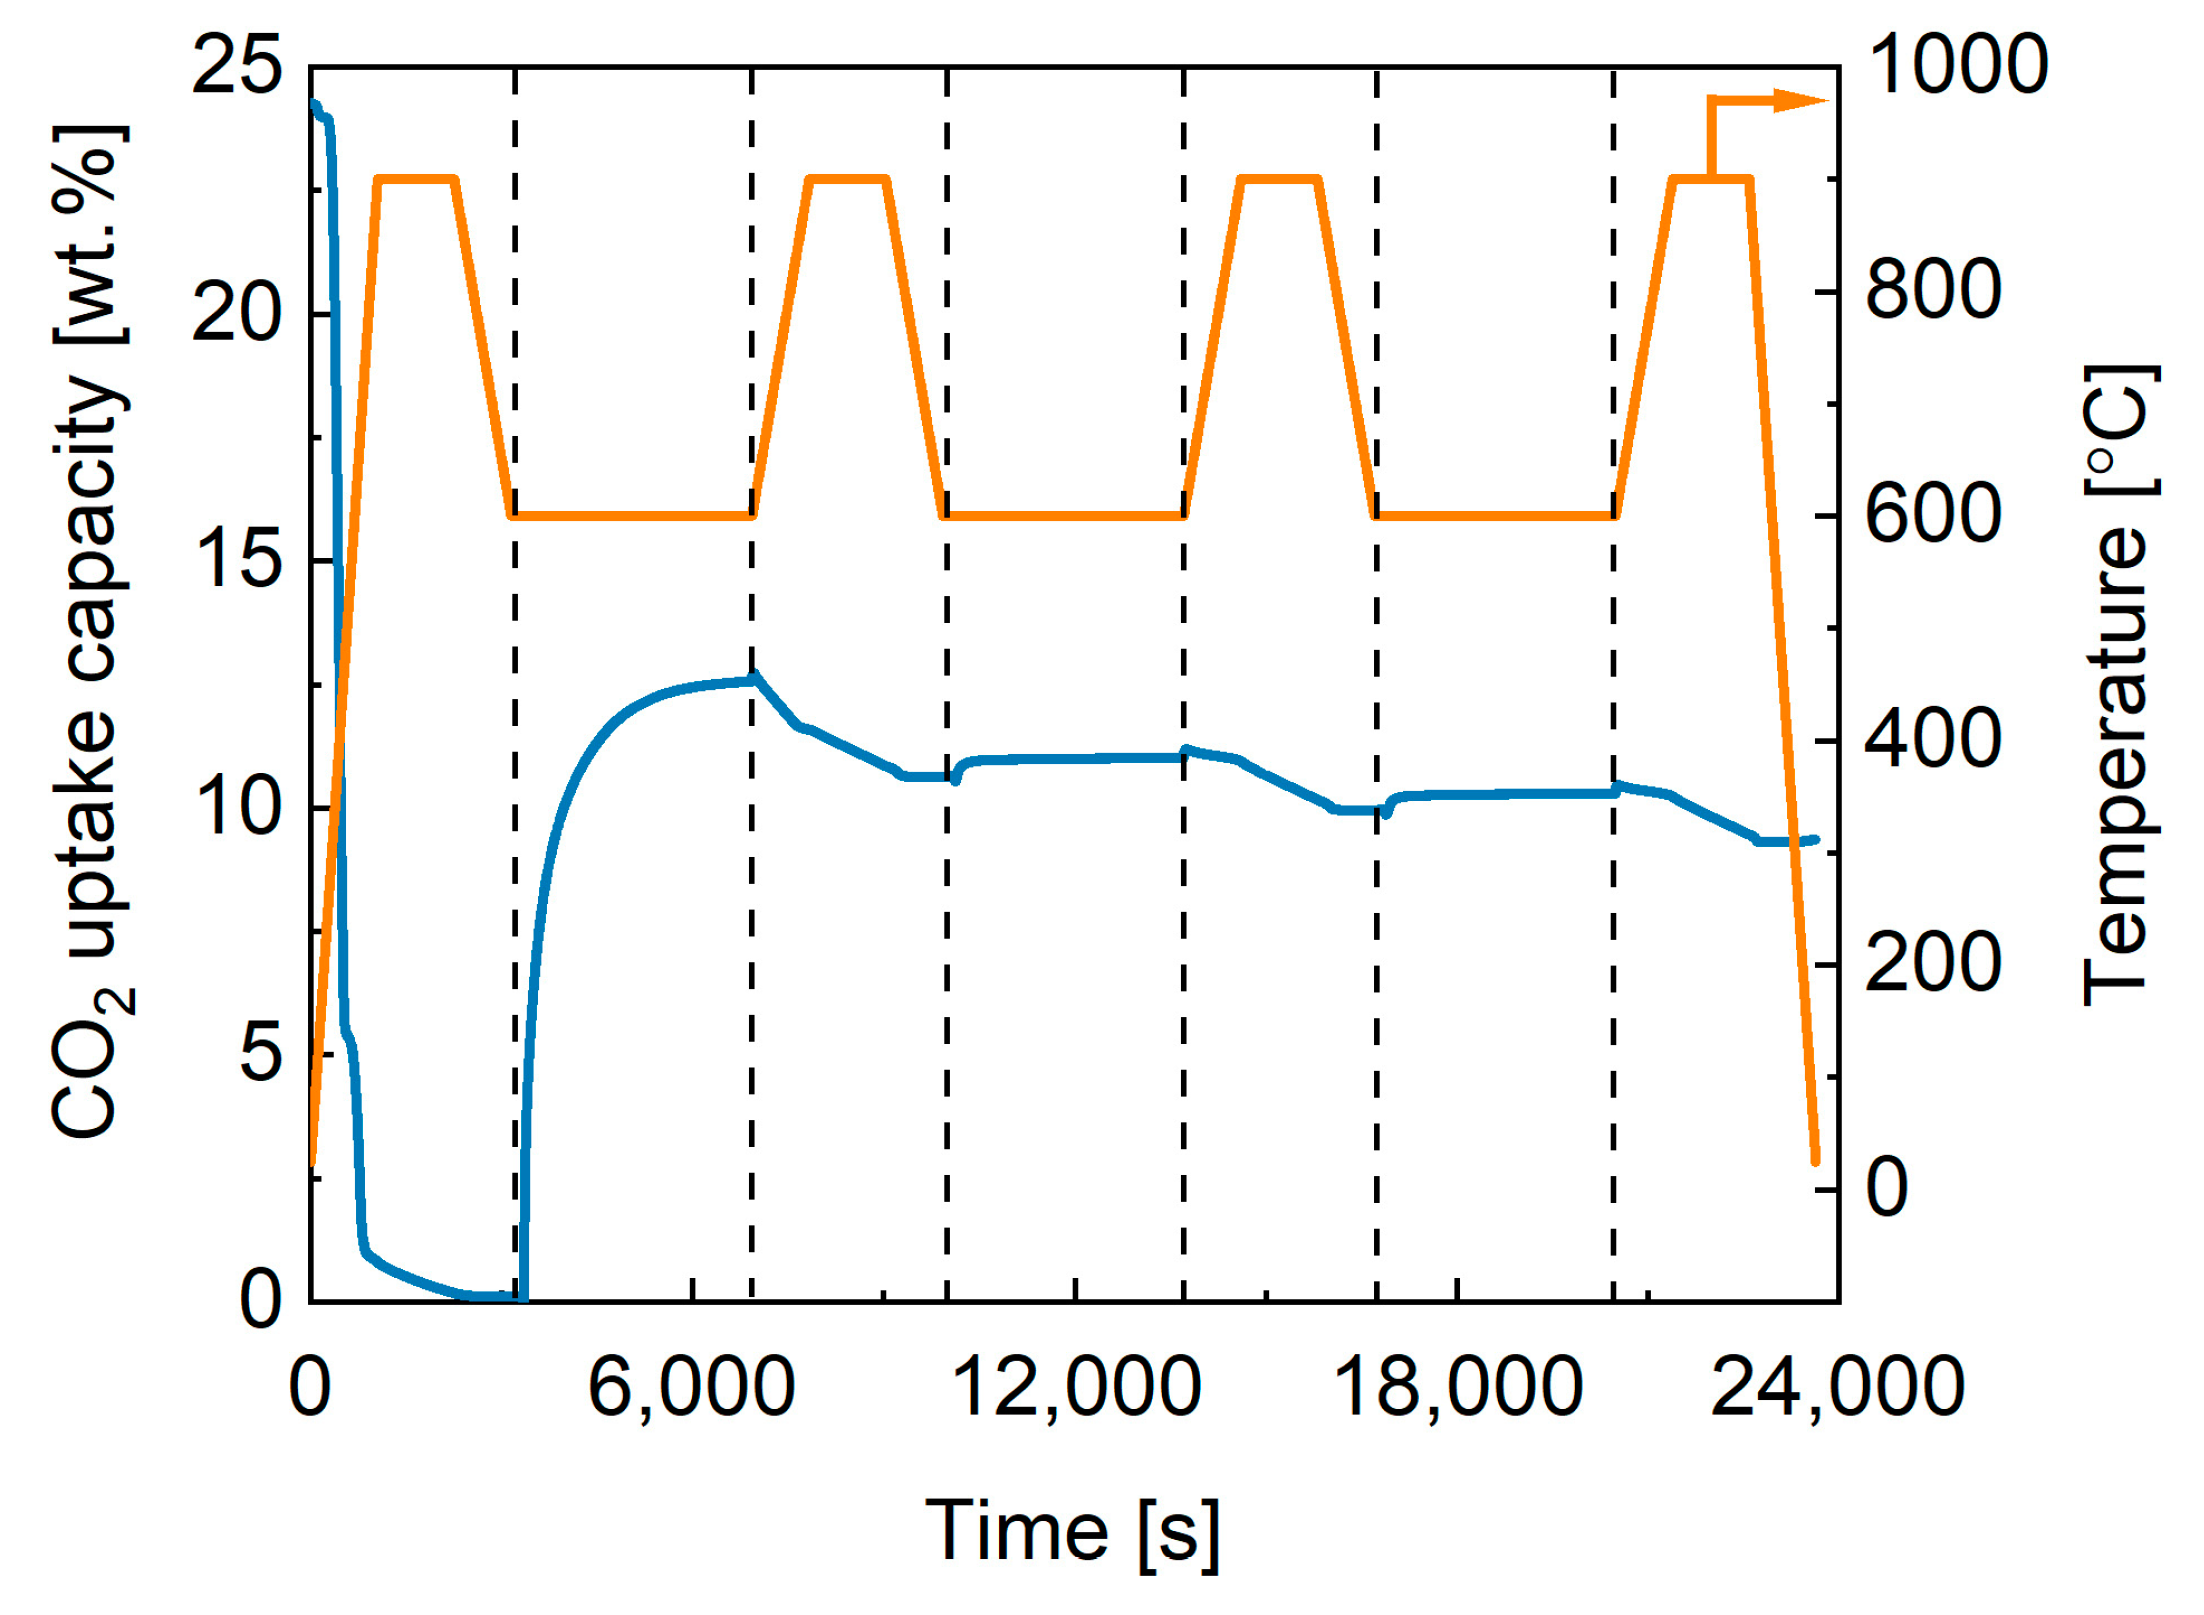
2.2. Performance of Commercial Potassium Stannate under Different Conditions
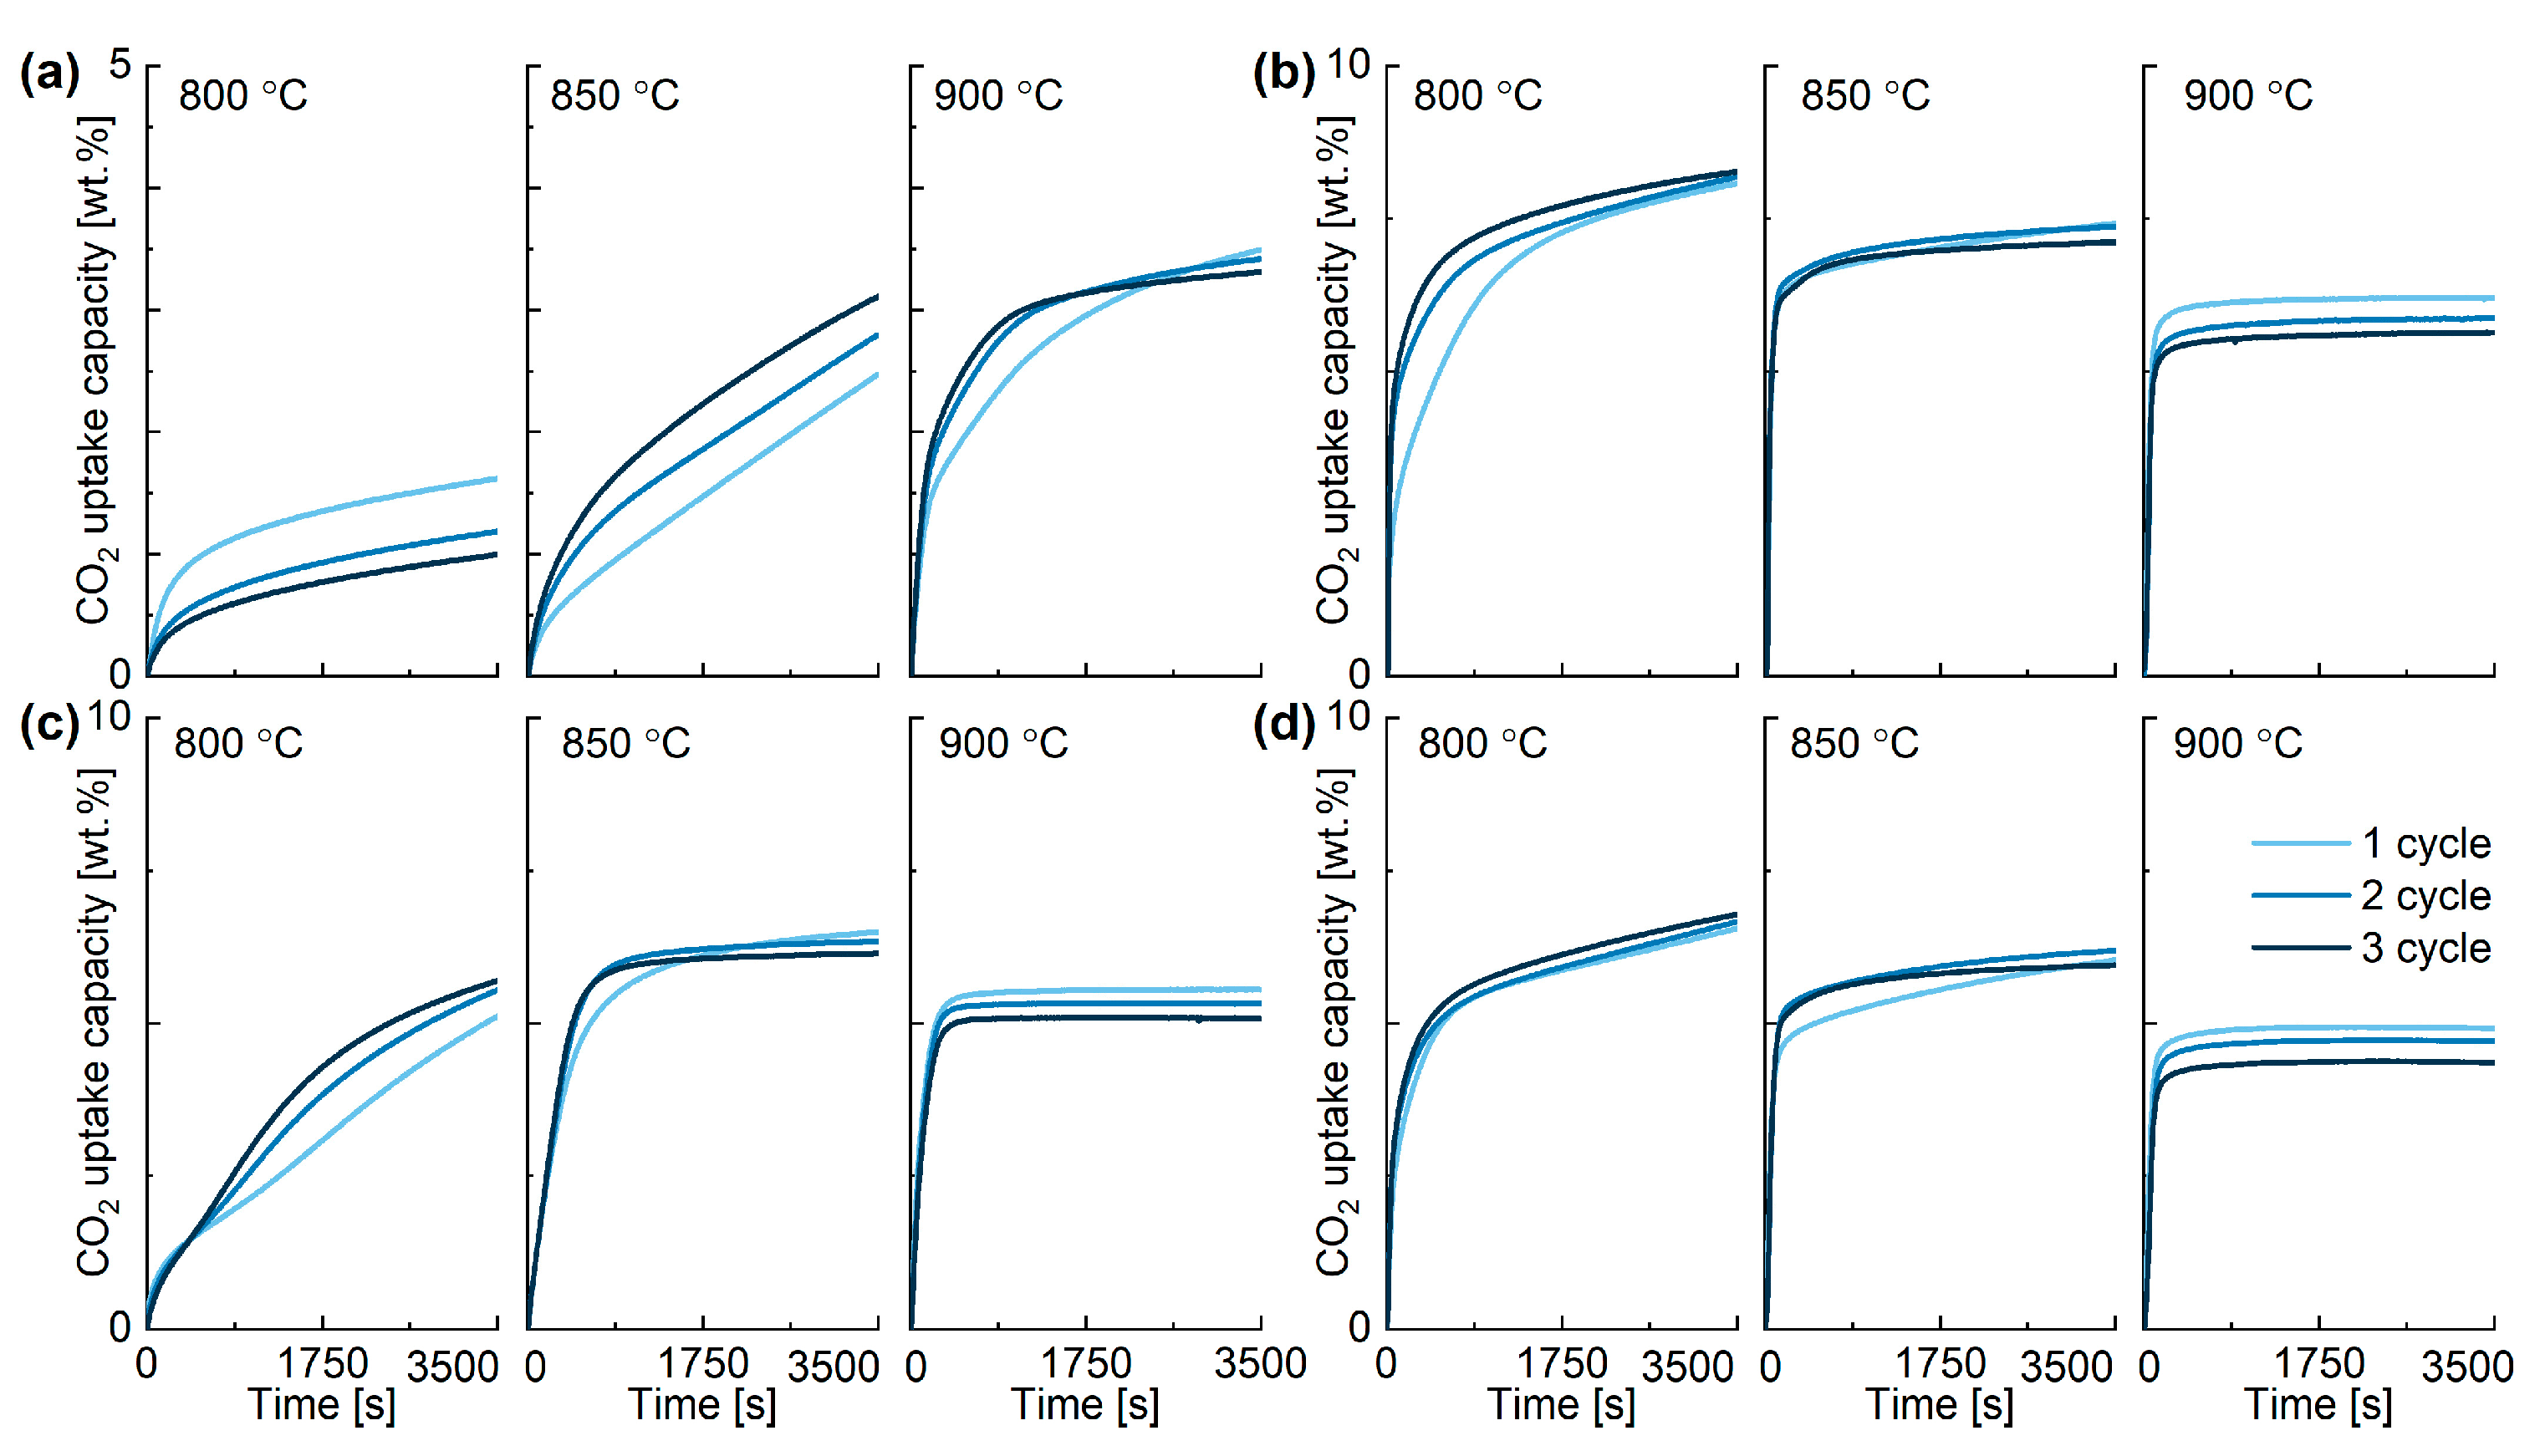
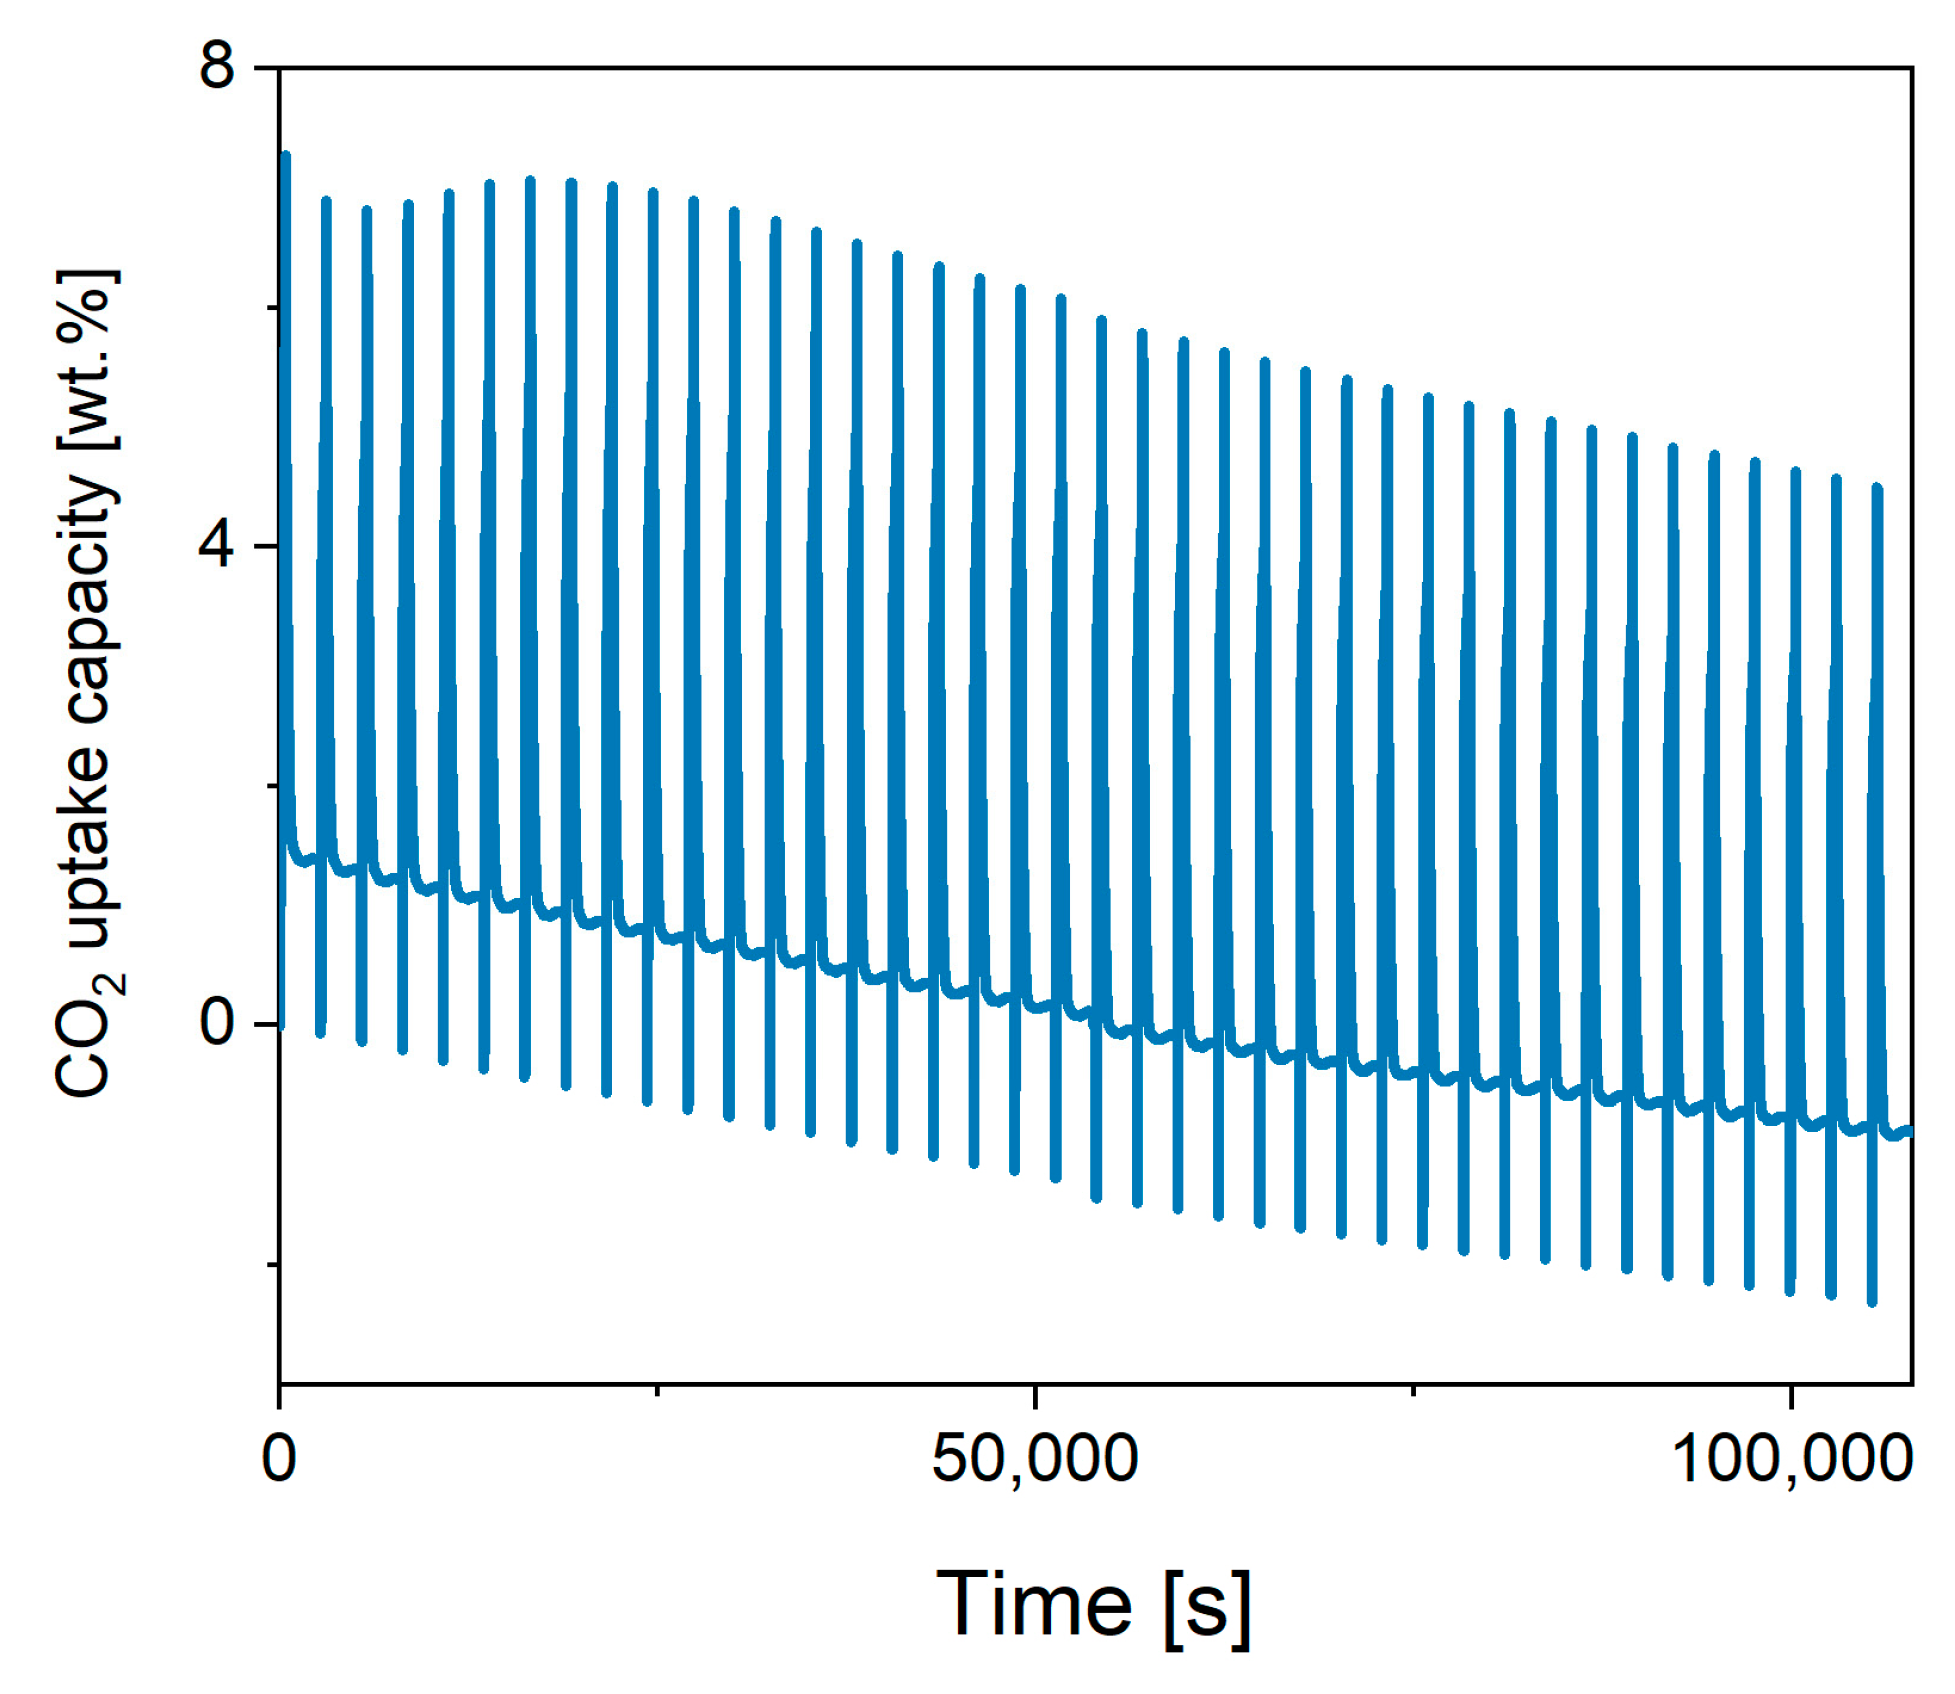
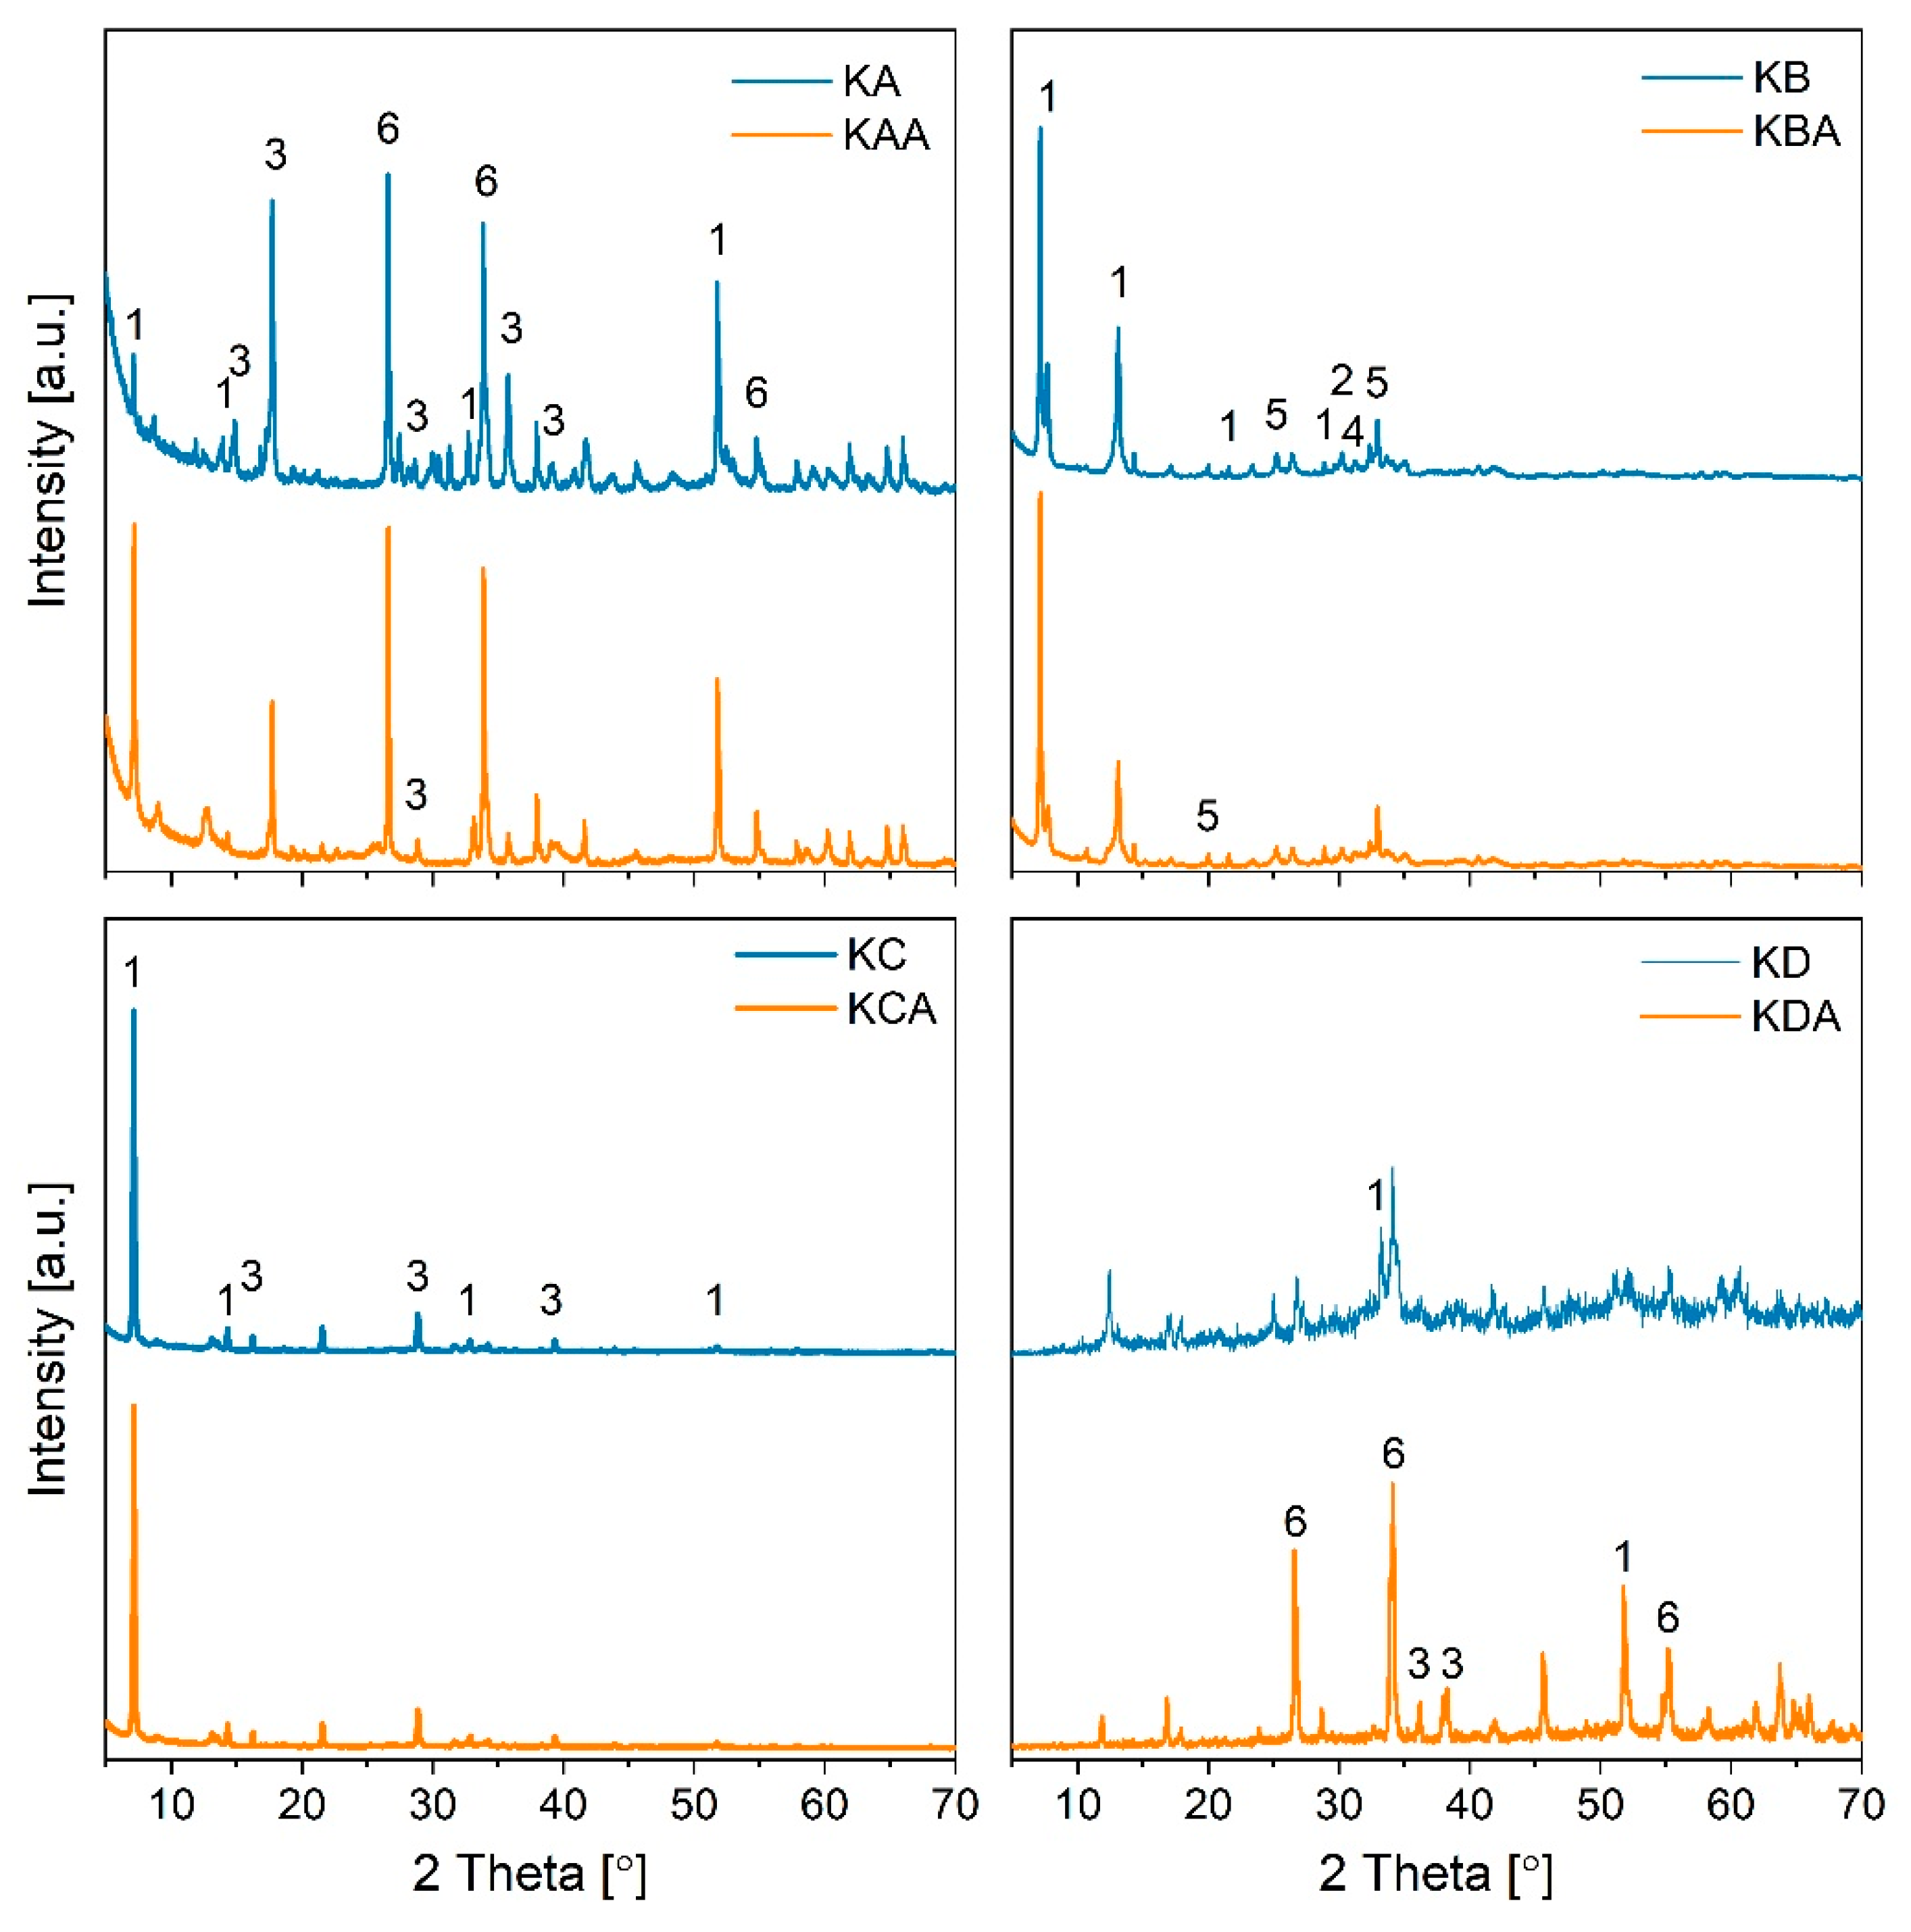
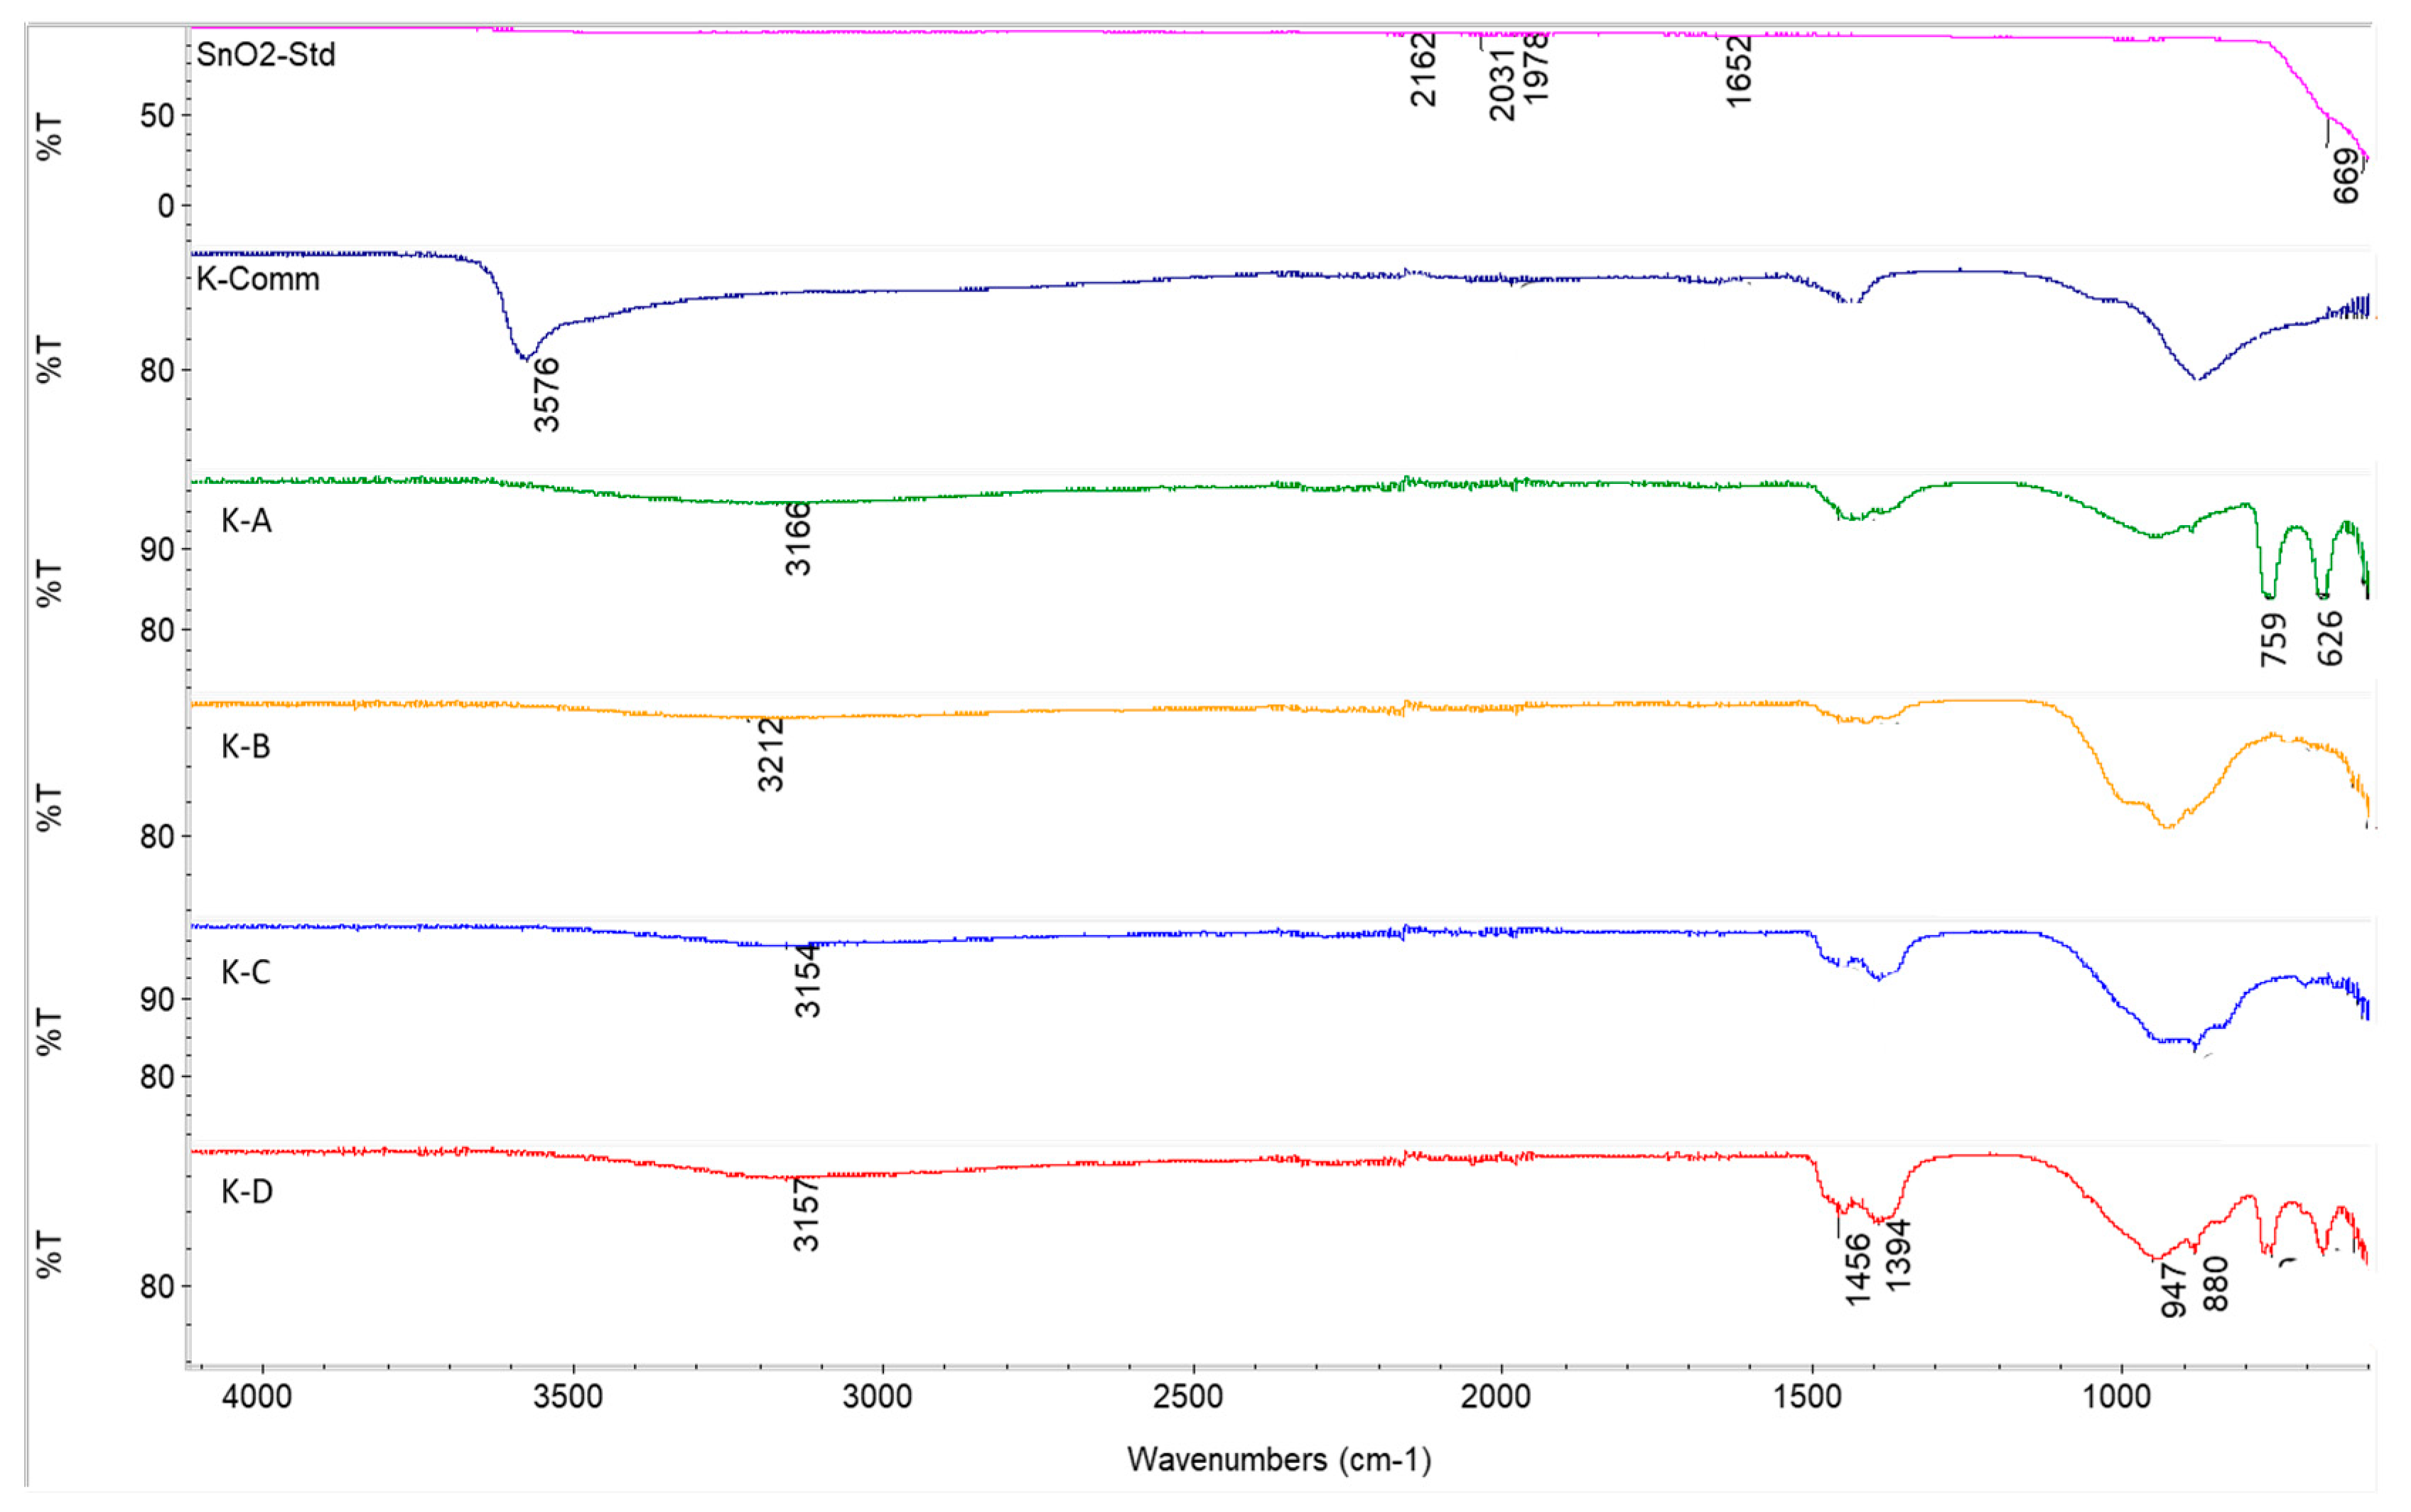
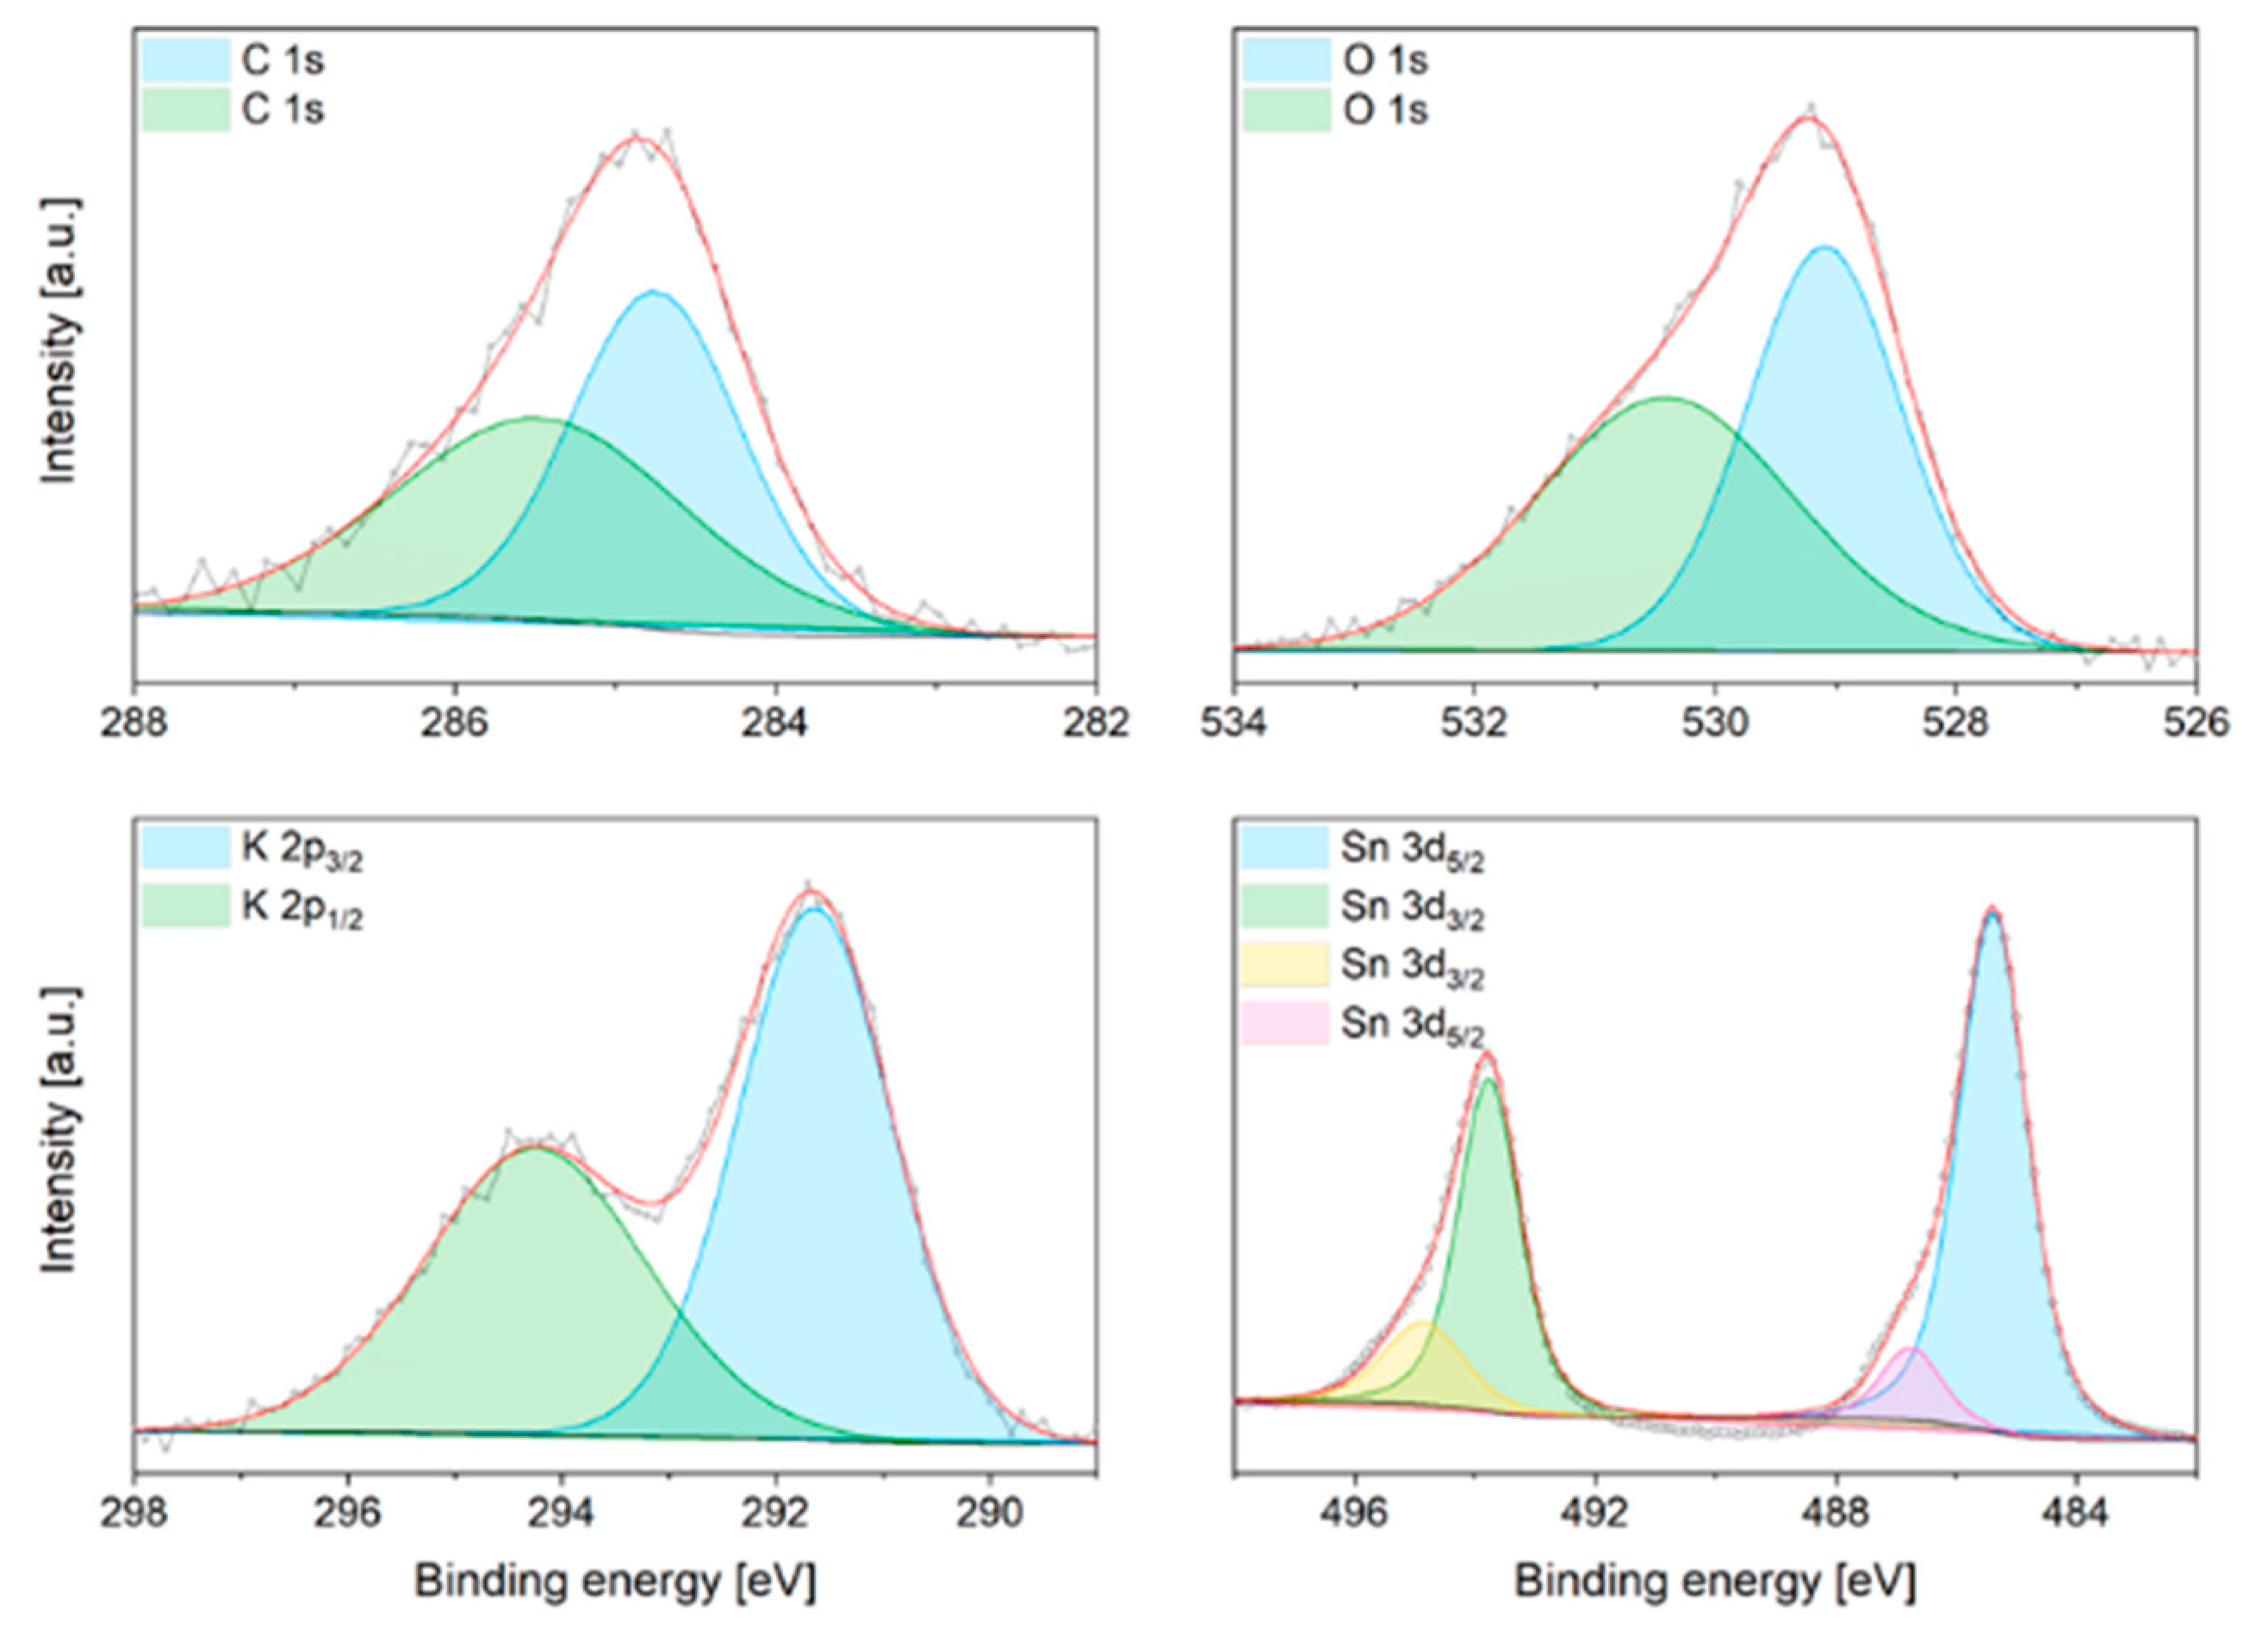
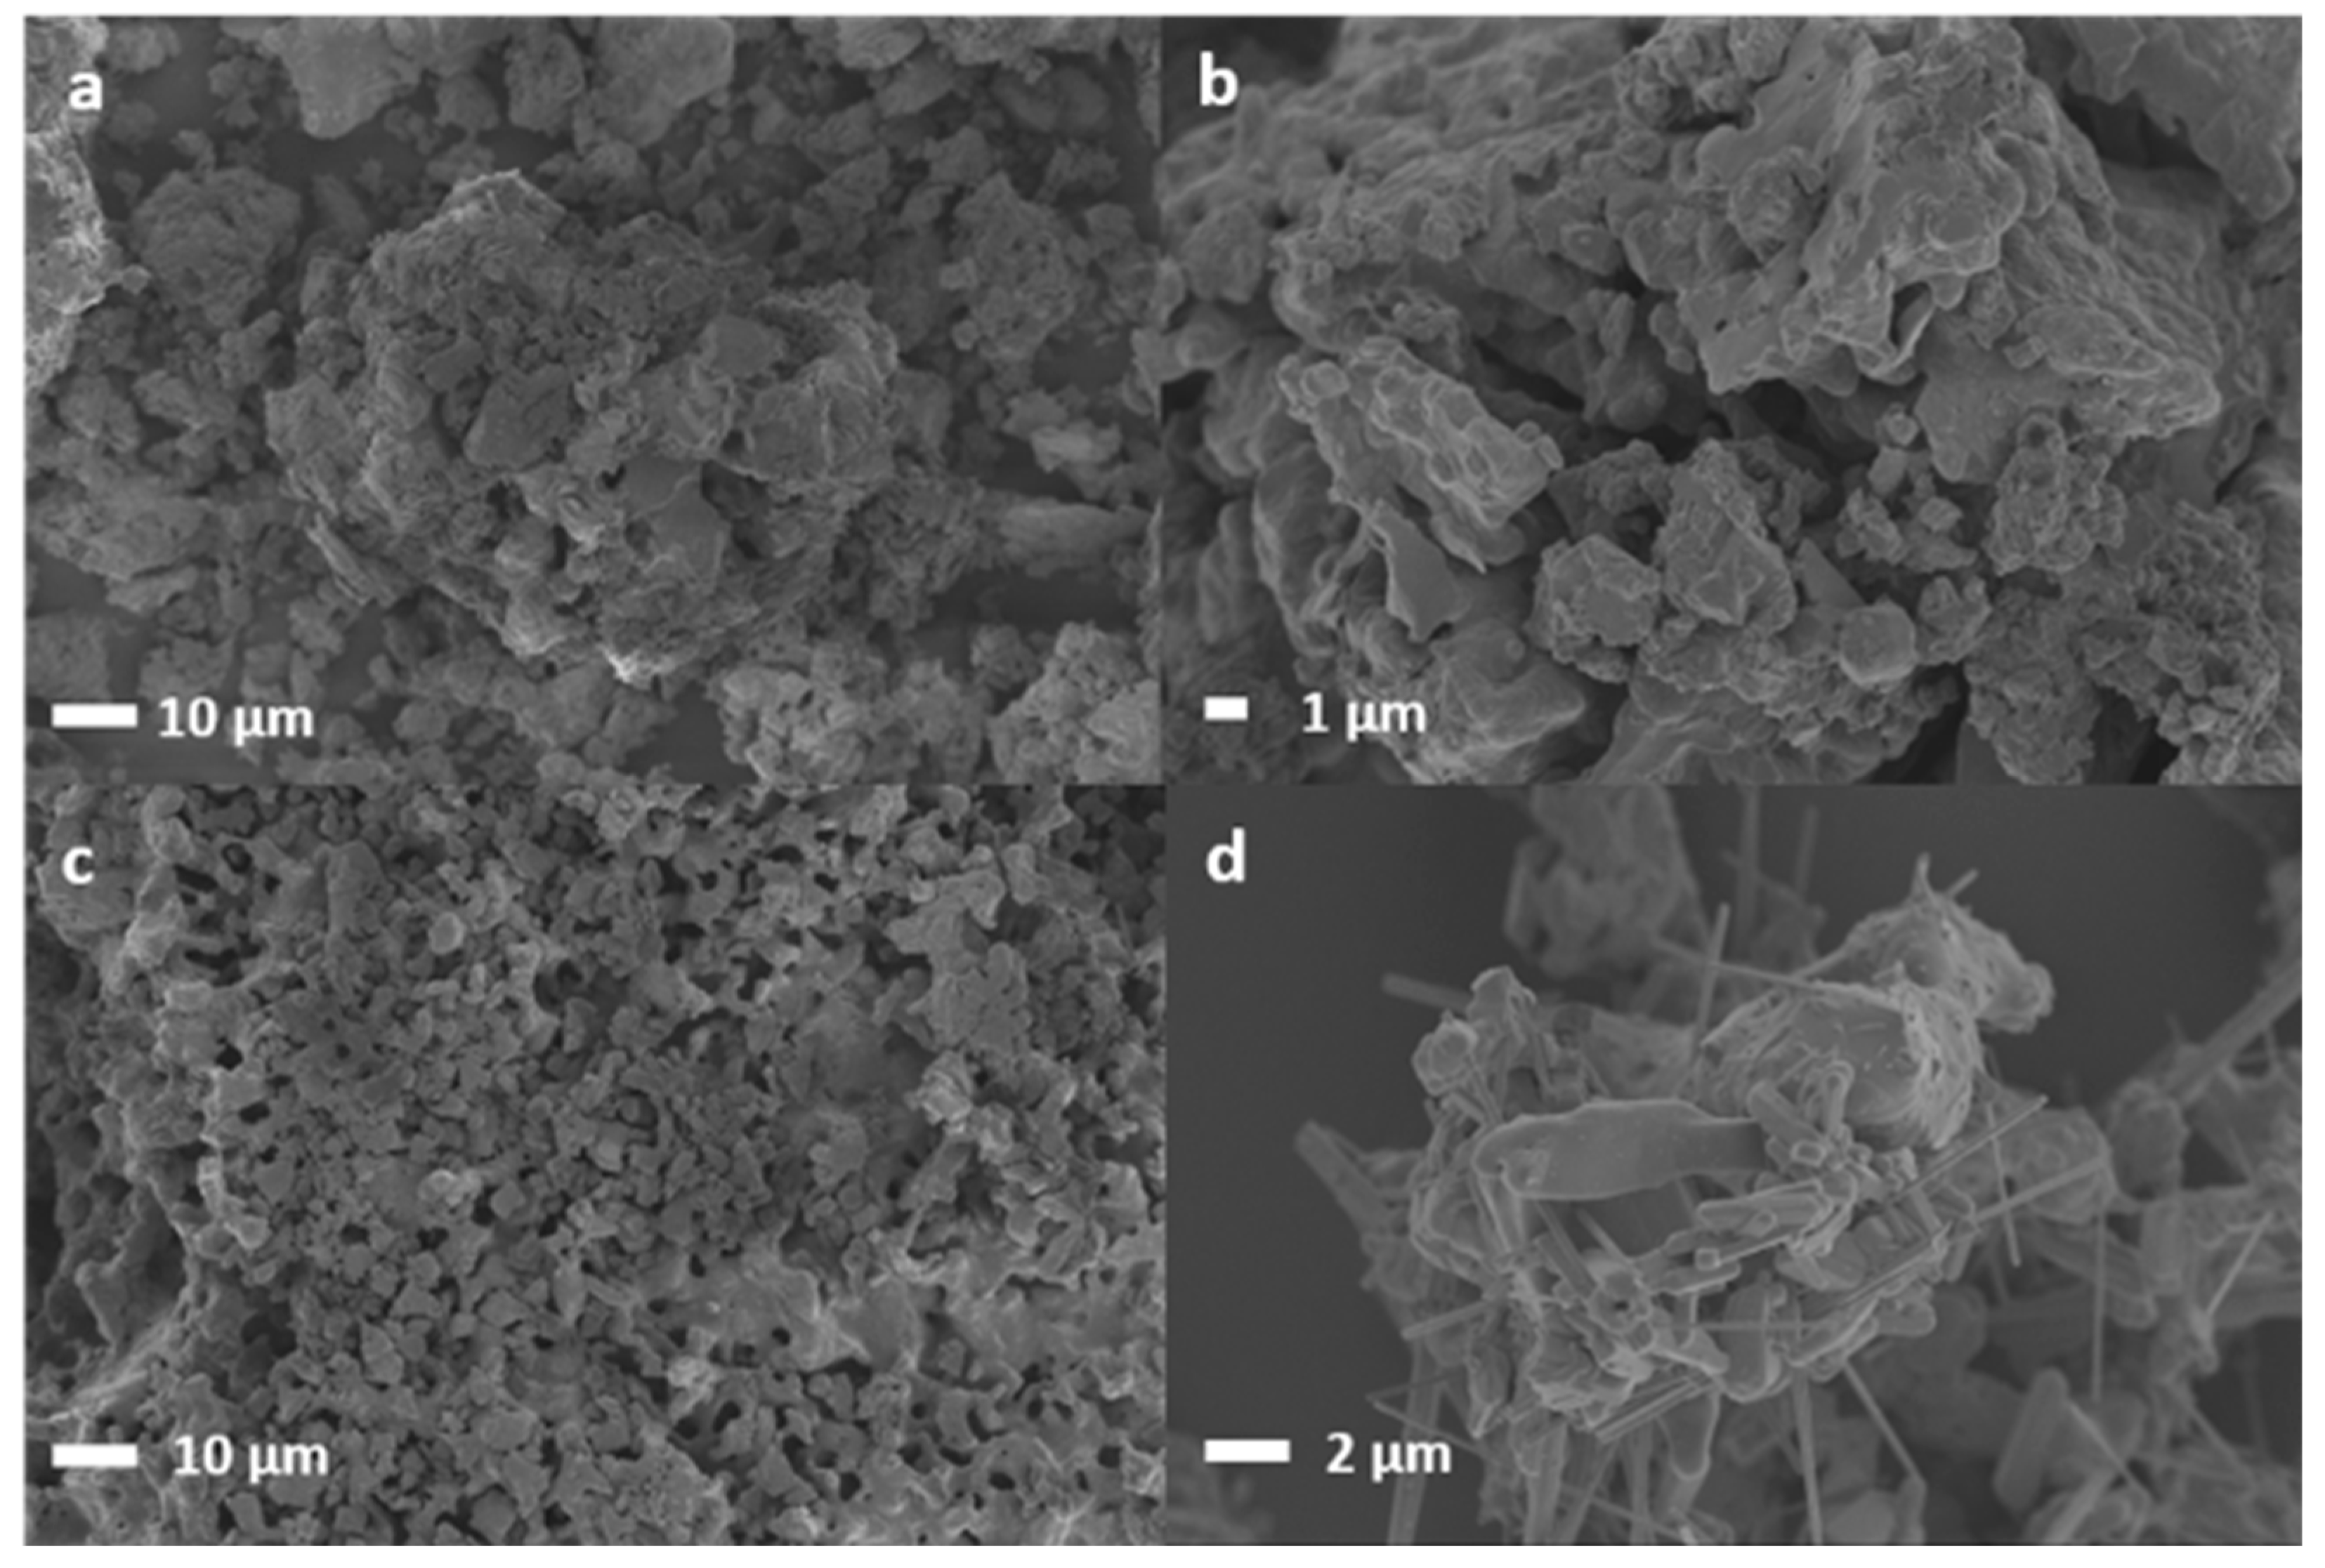
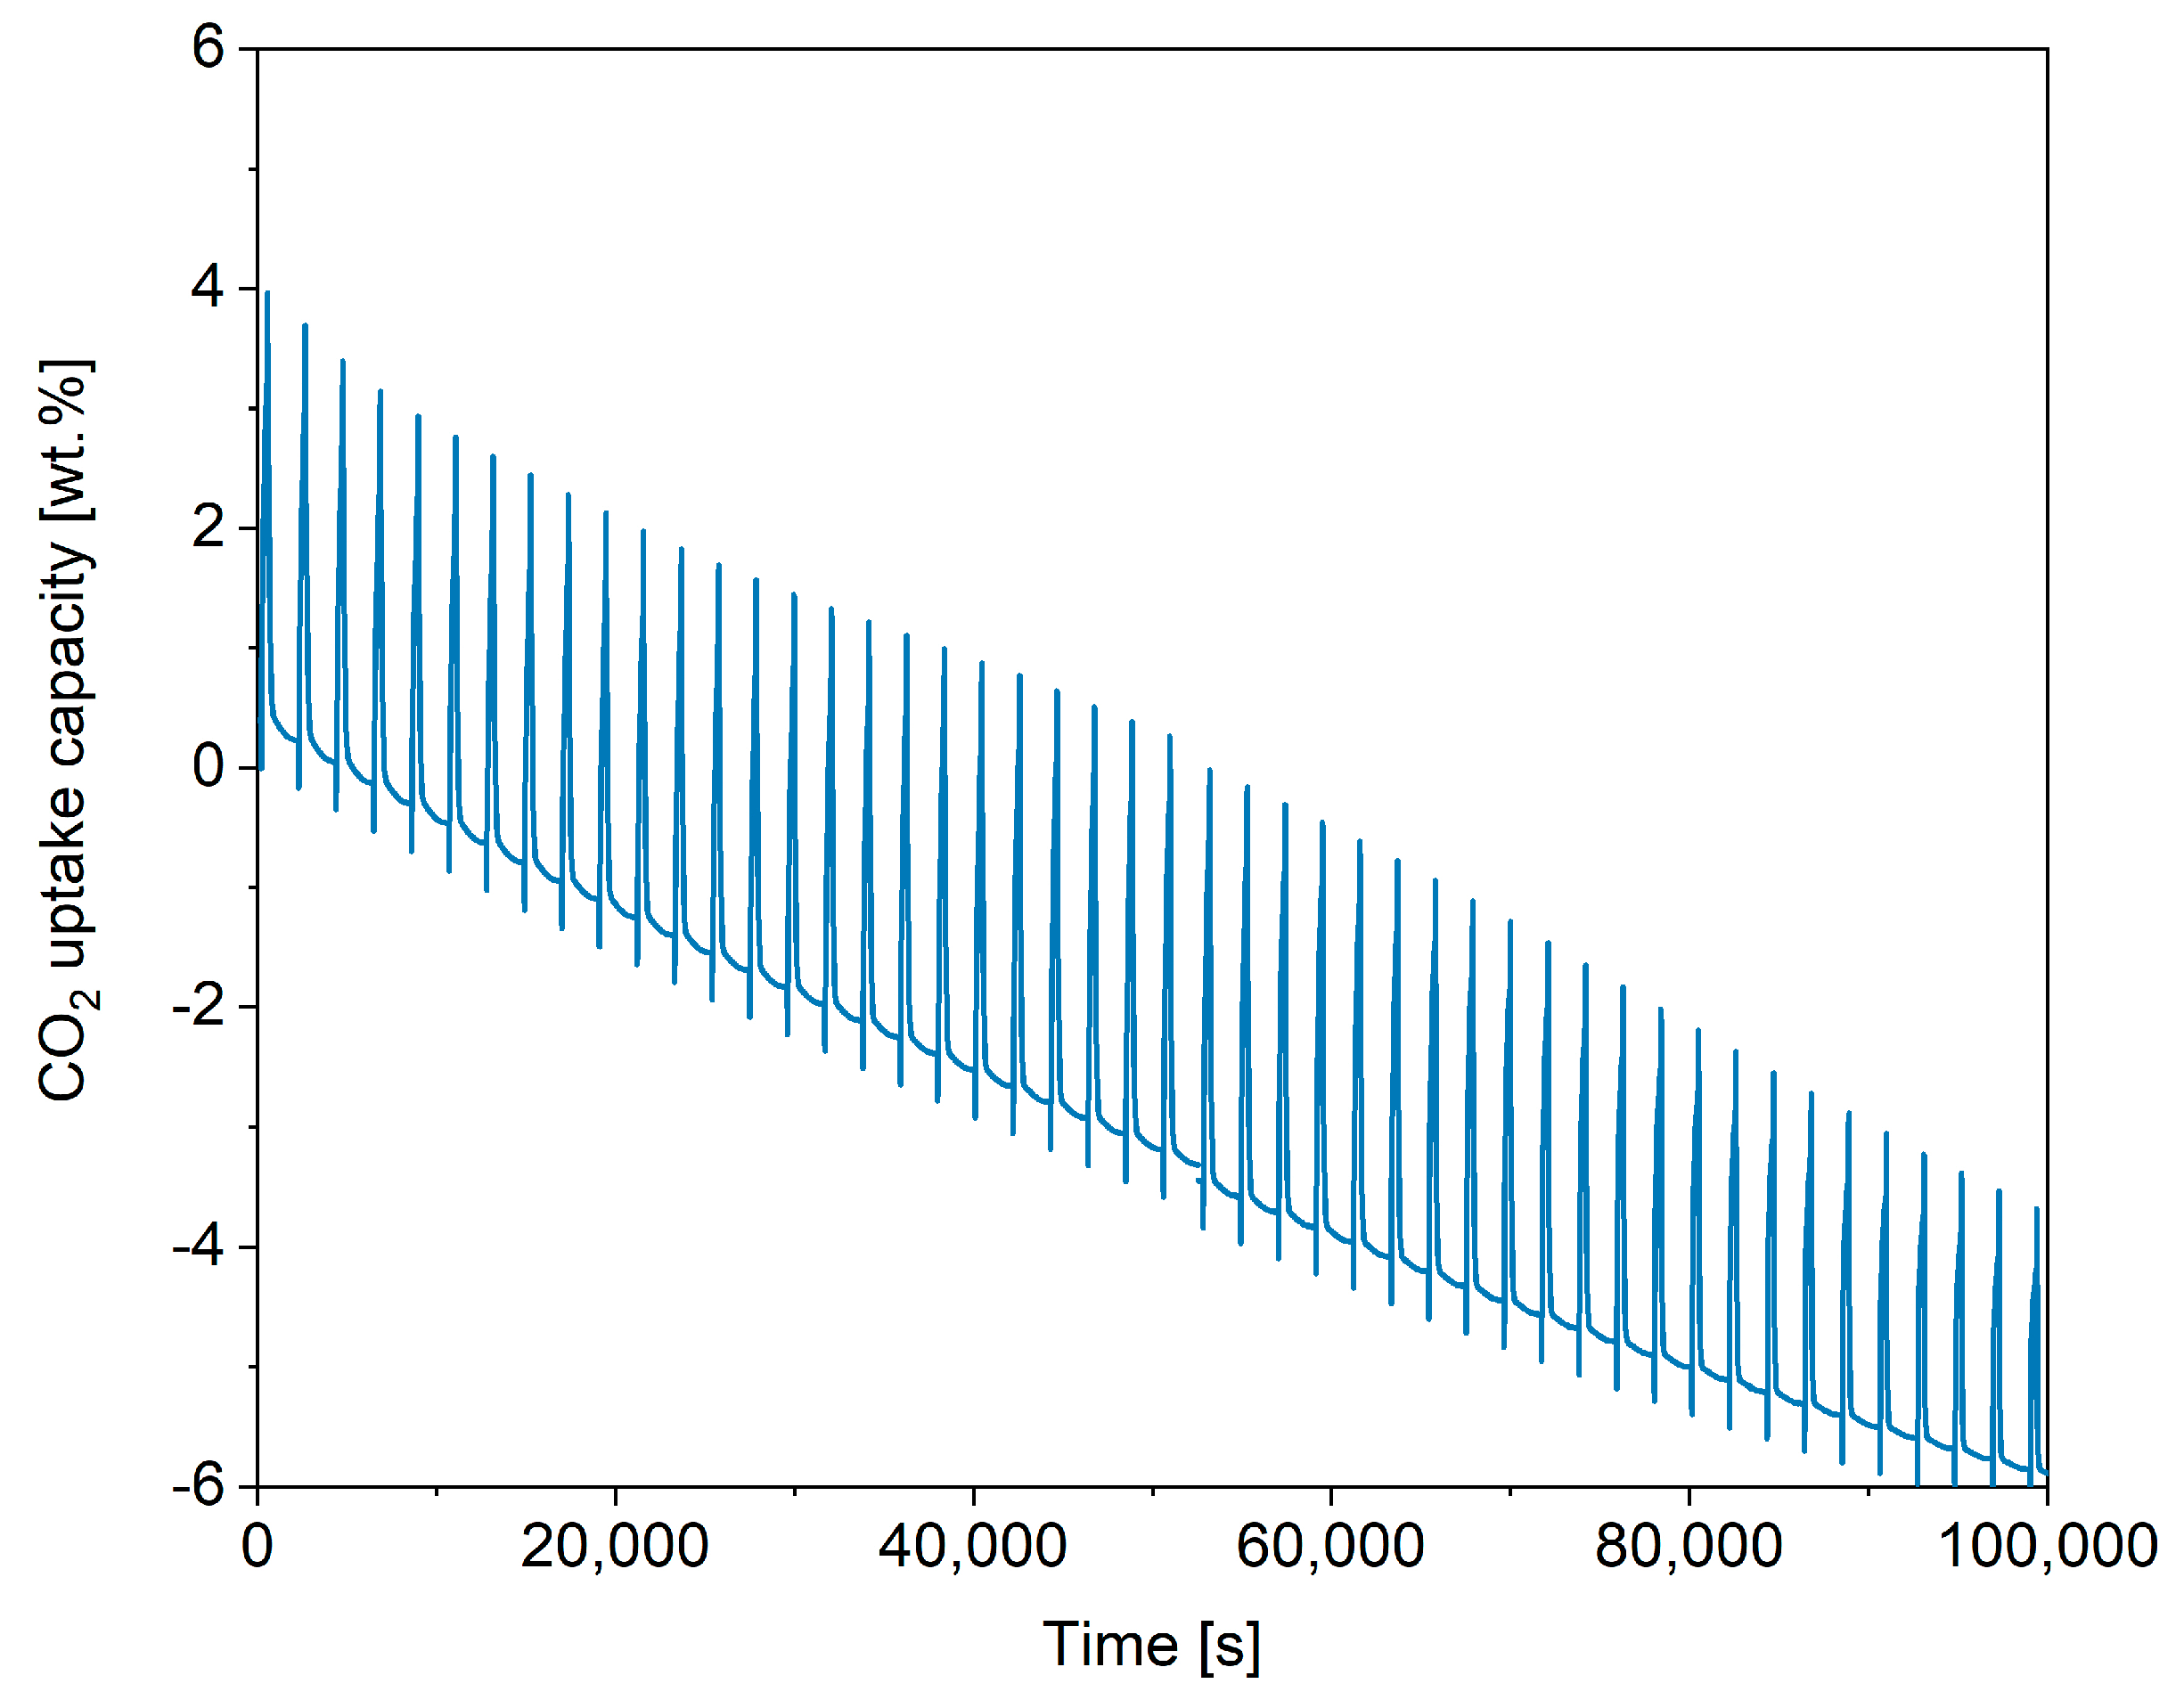
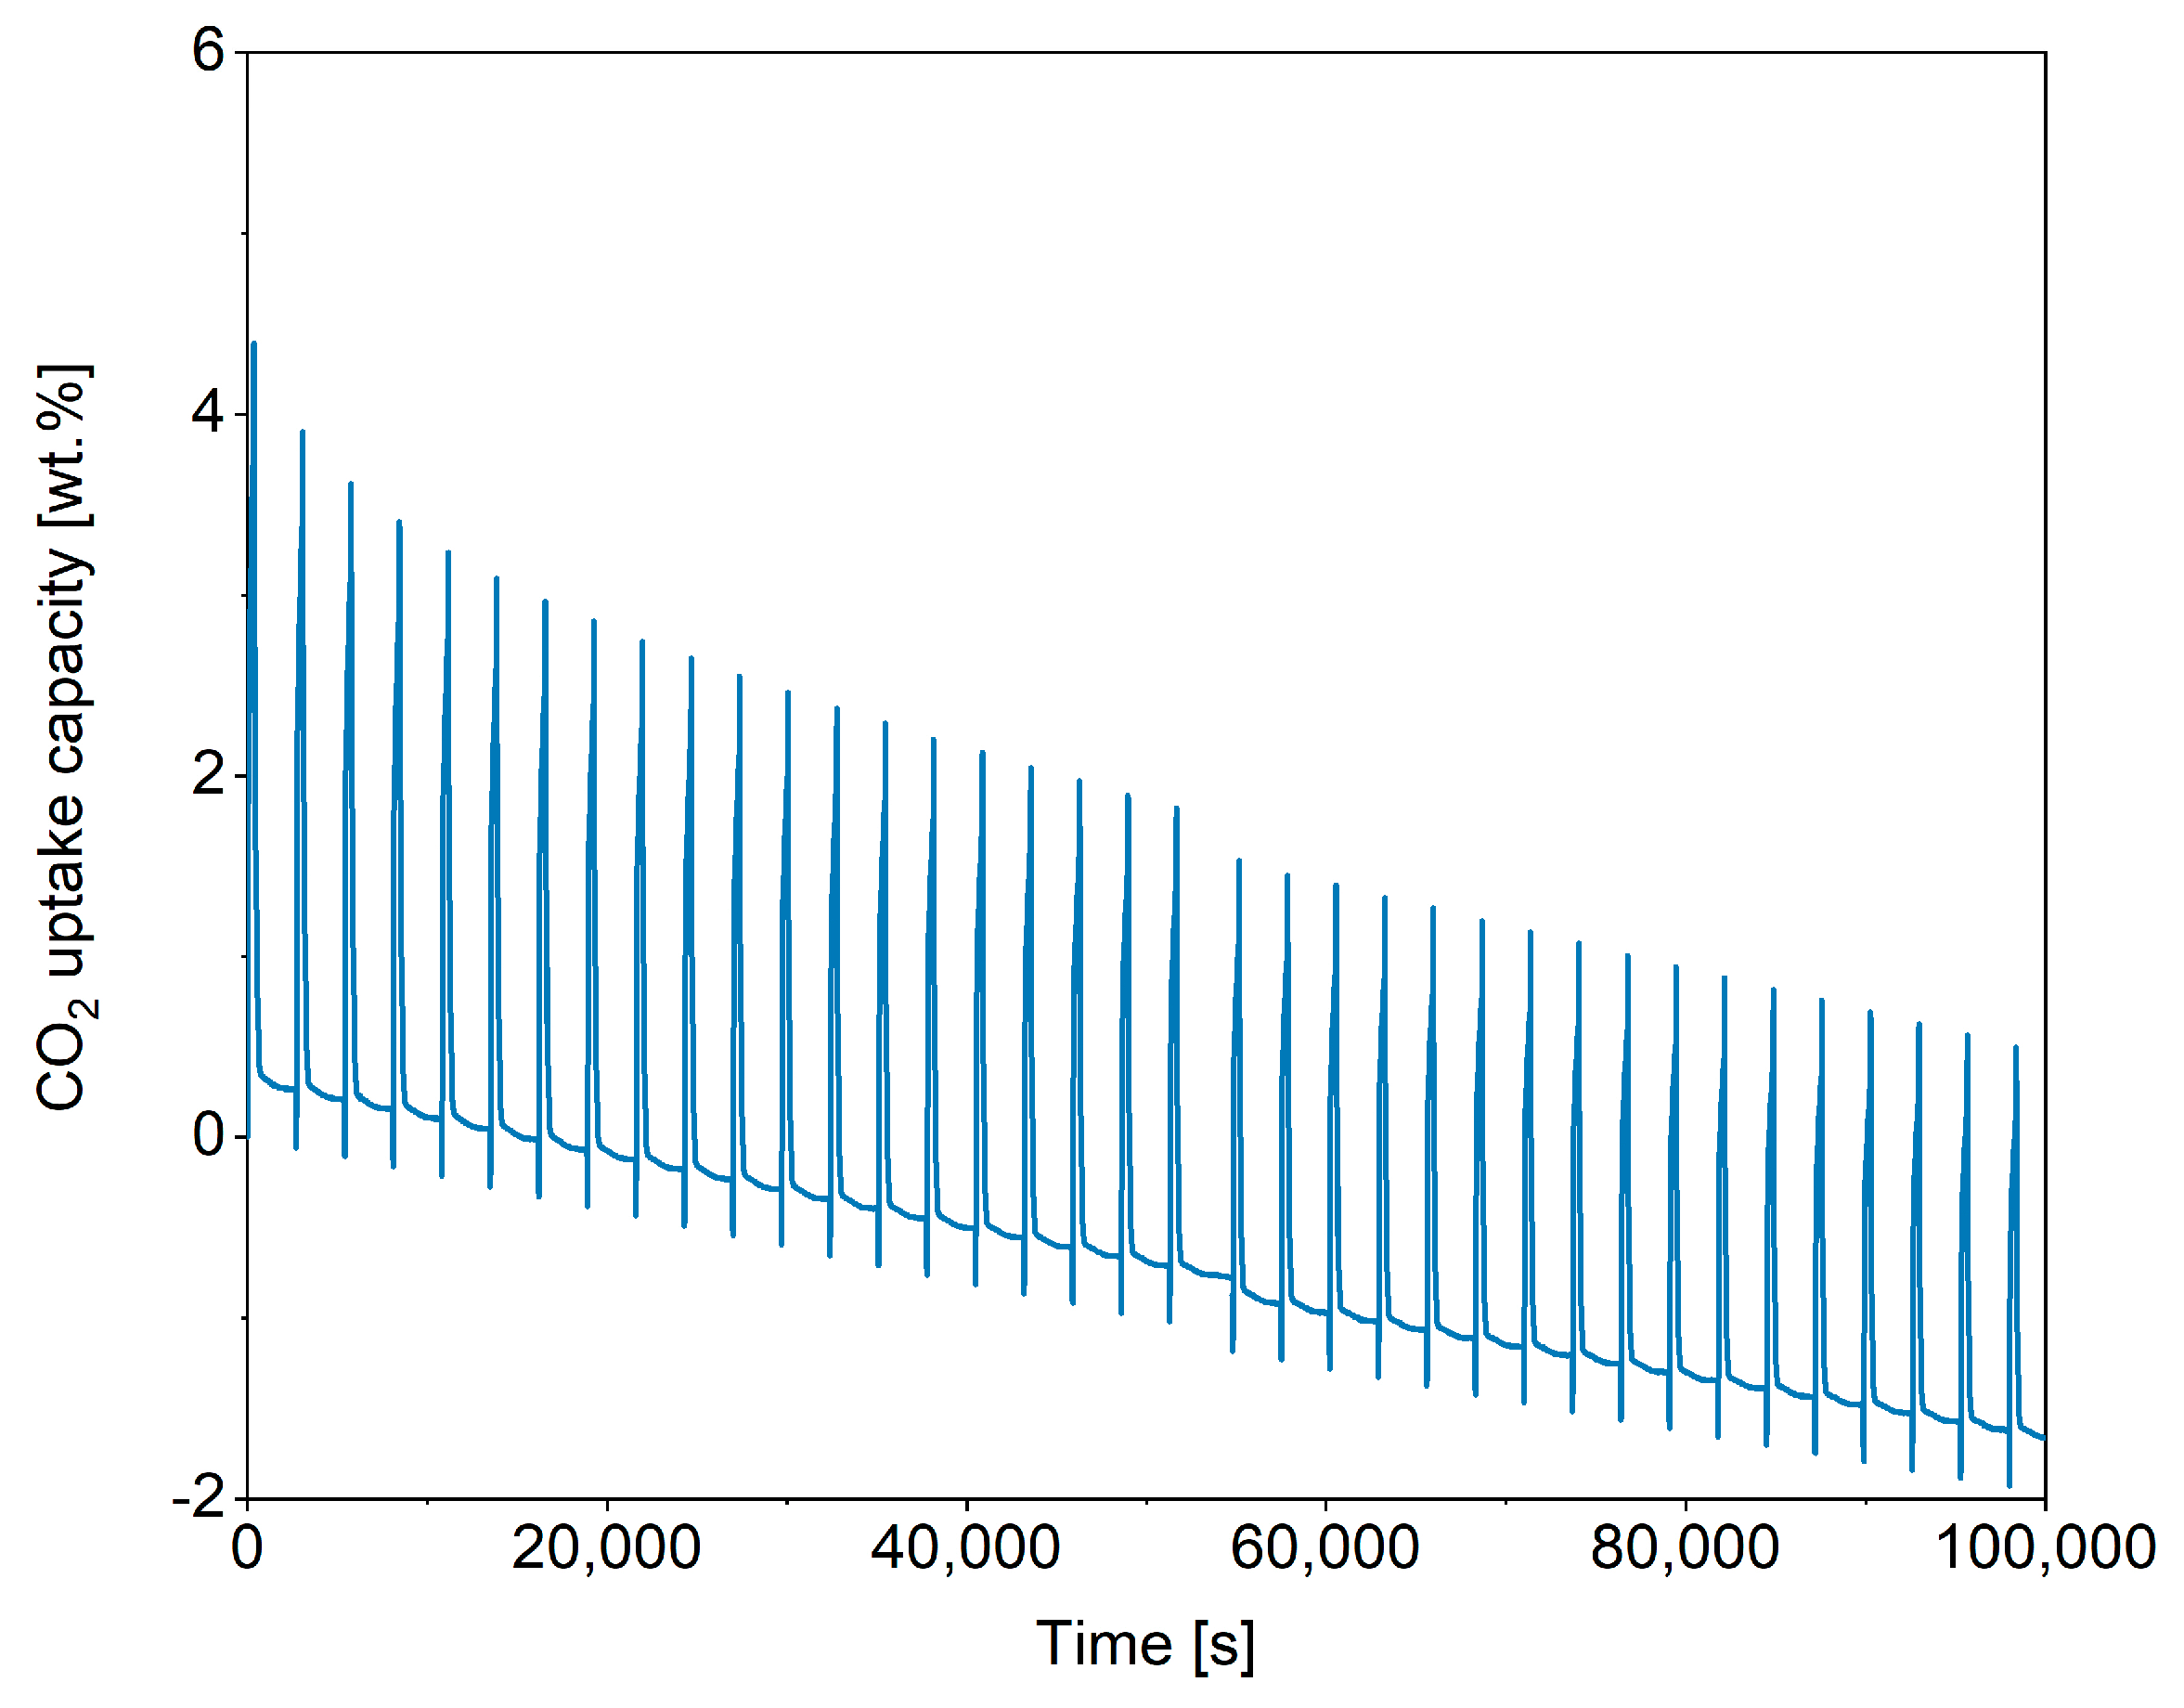
2.3. Performance of In-House Synthesised Potassium Stannates
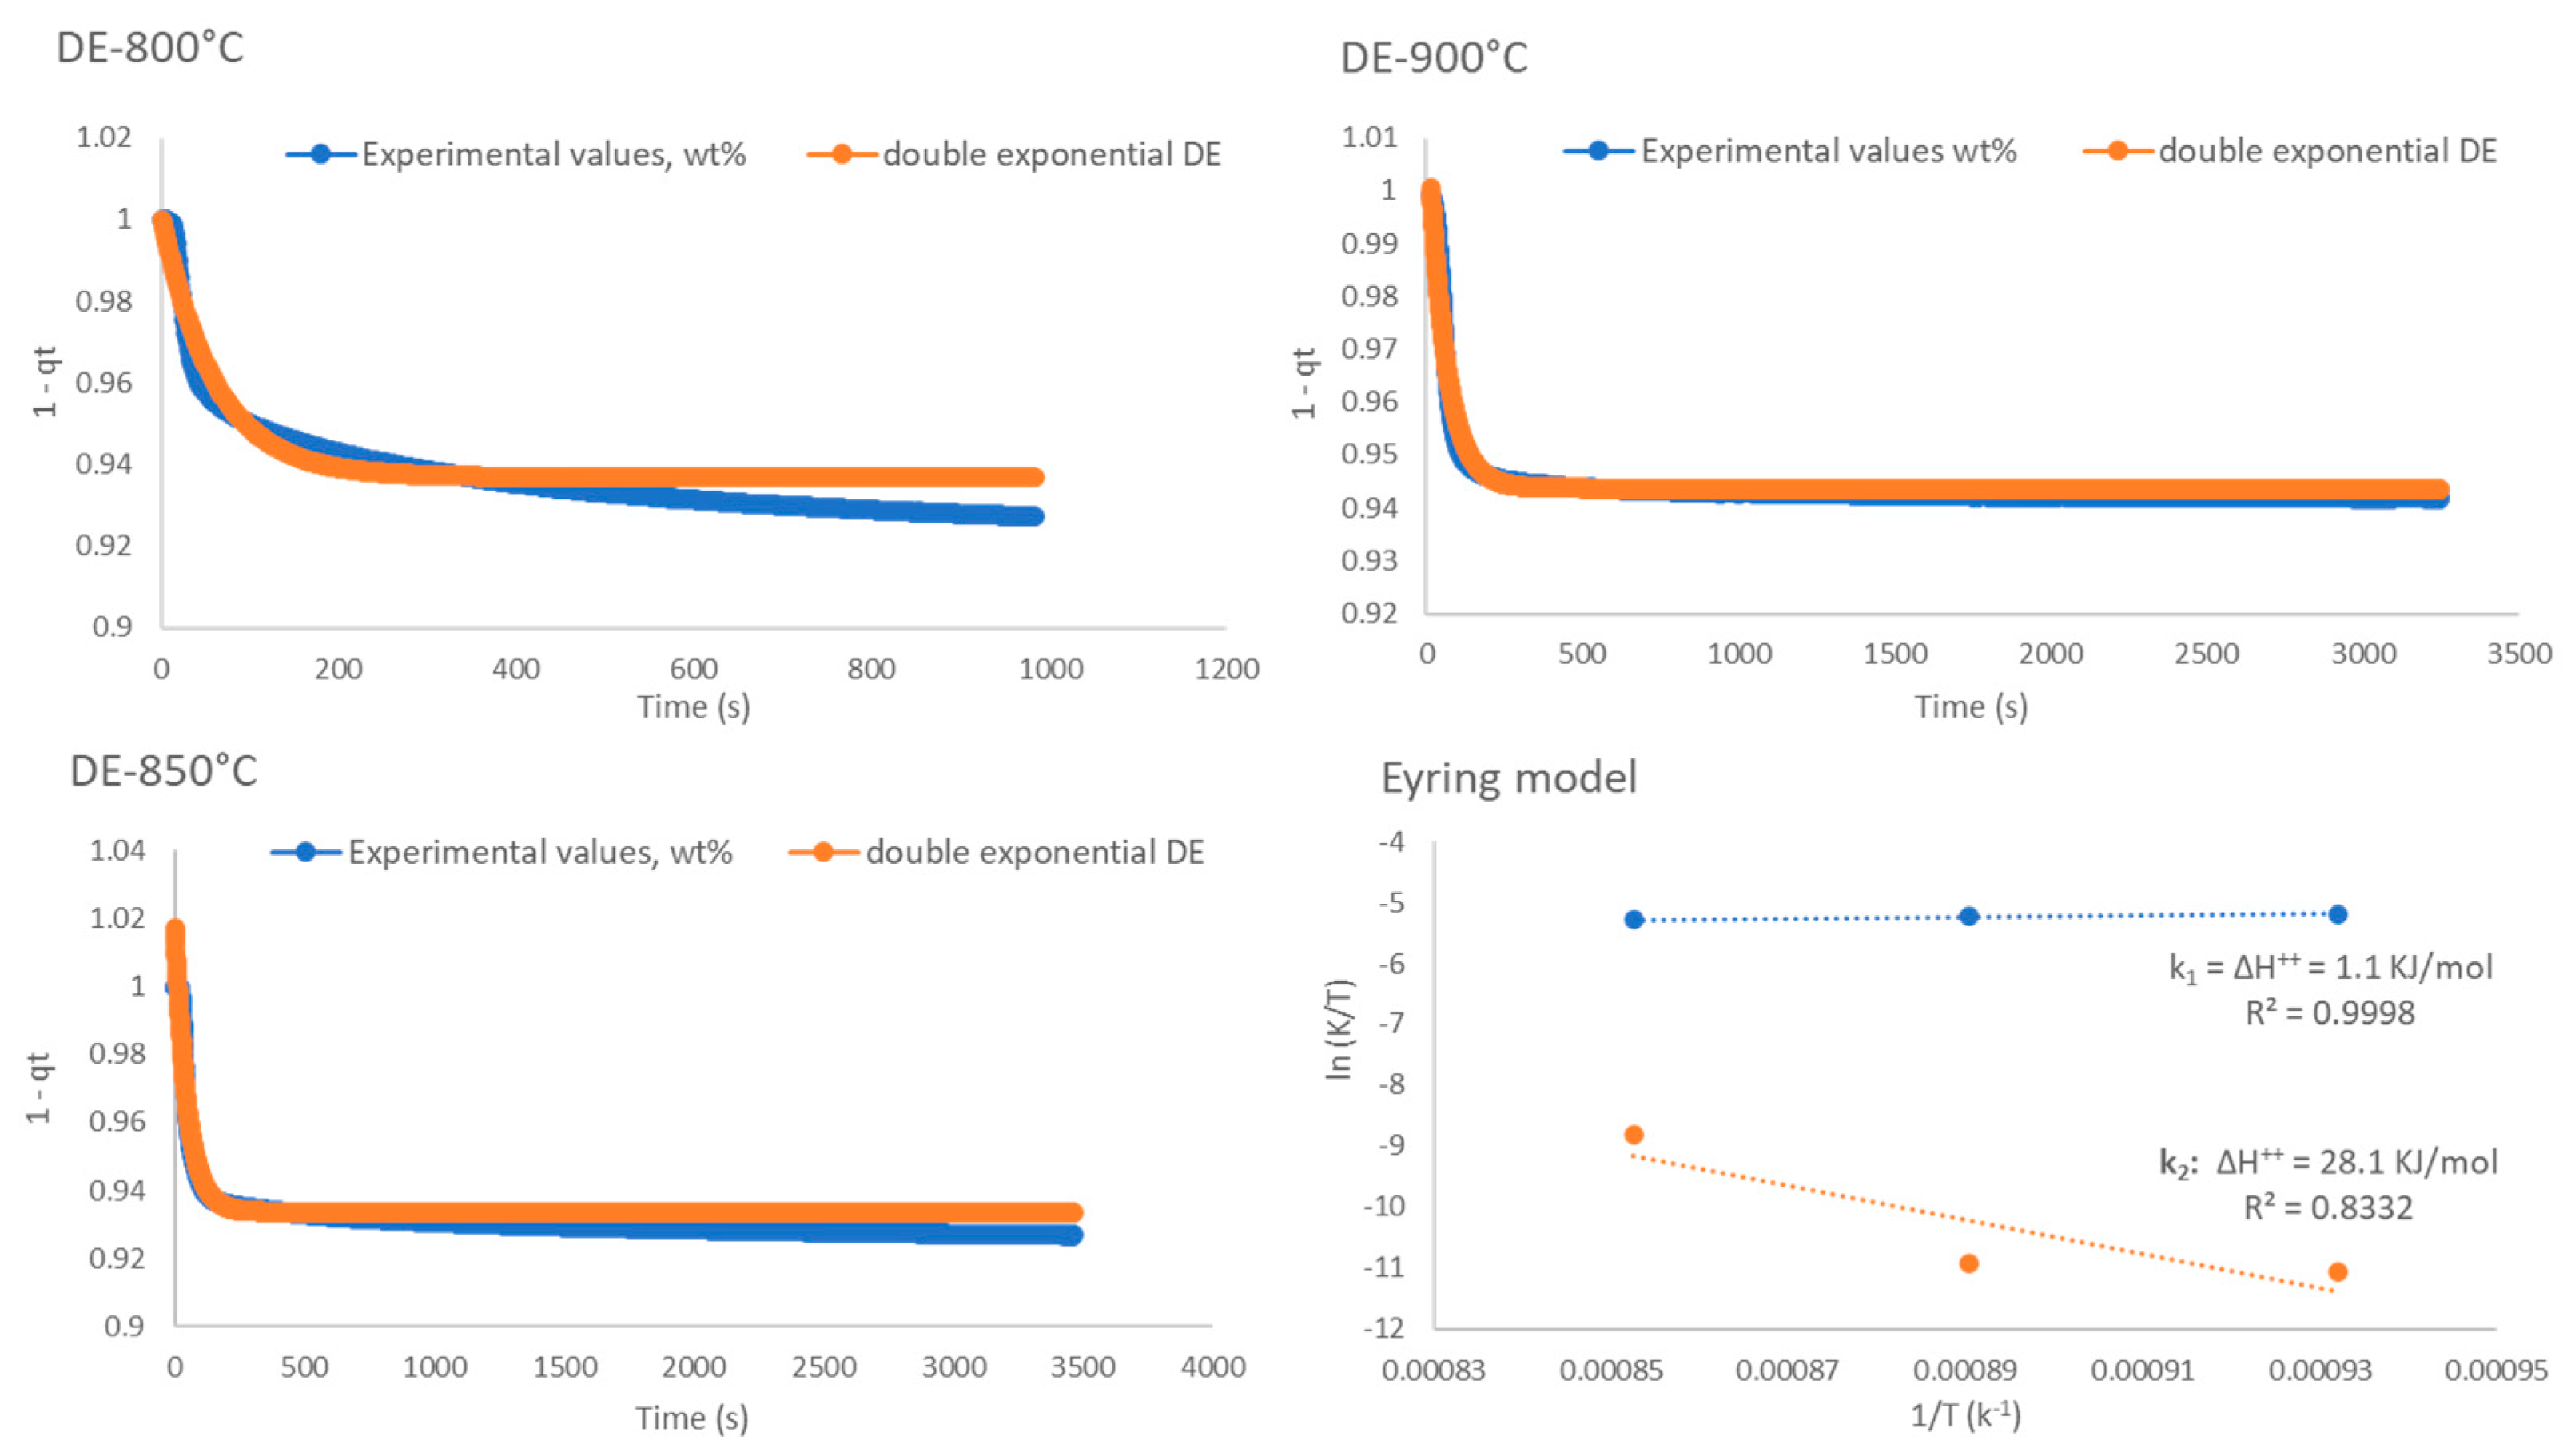
2.4. Kinetic Analysis
3. Materials and Methods
3.1. Materials
3.2. Experiments
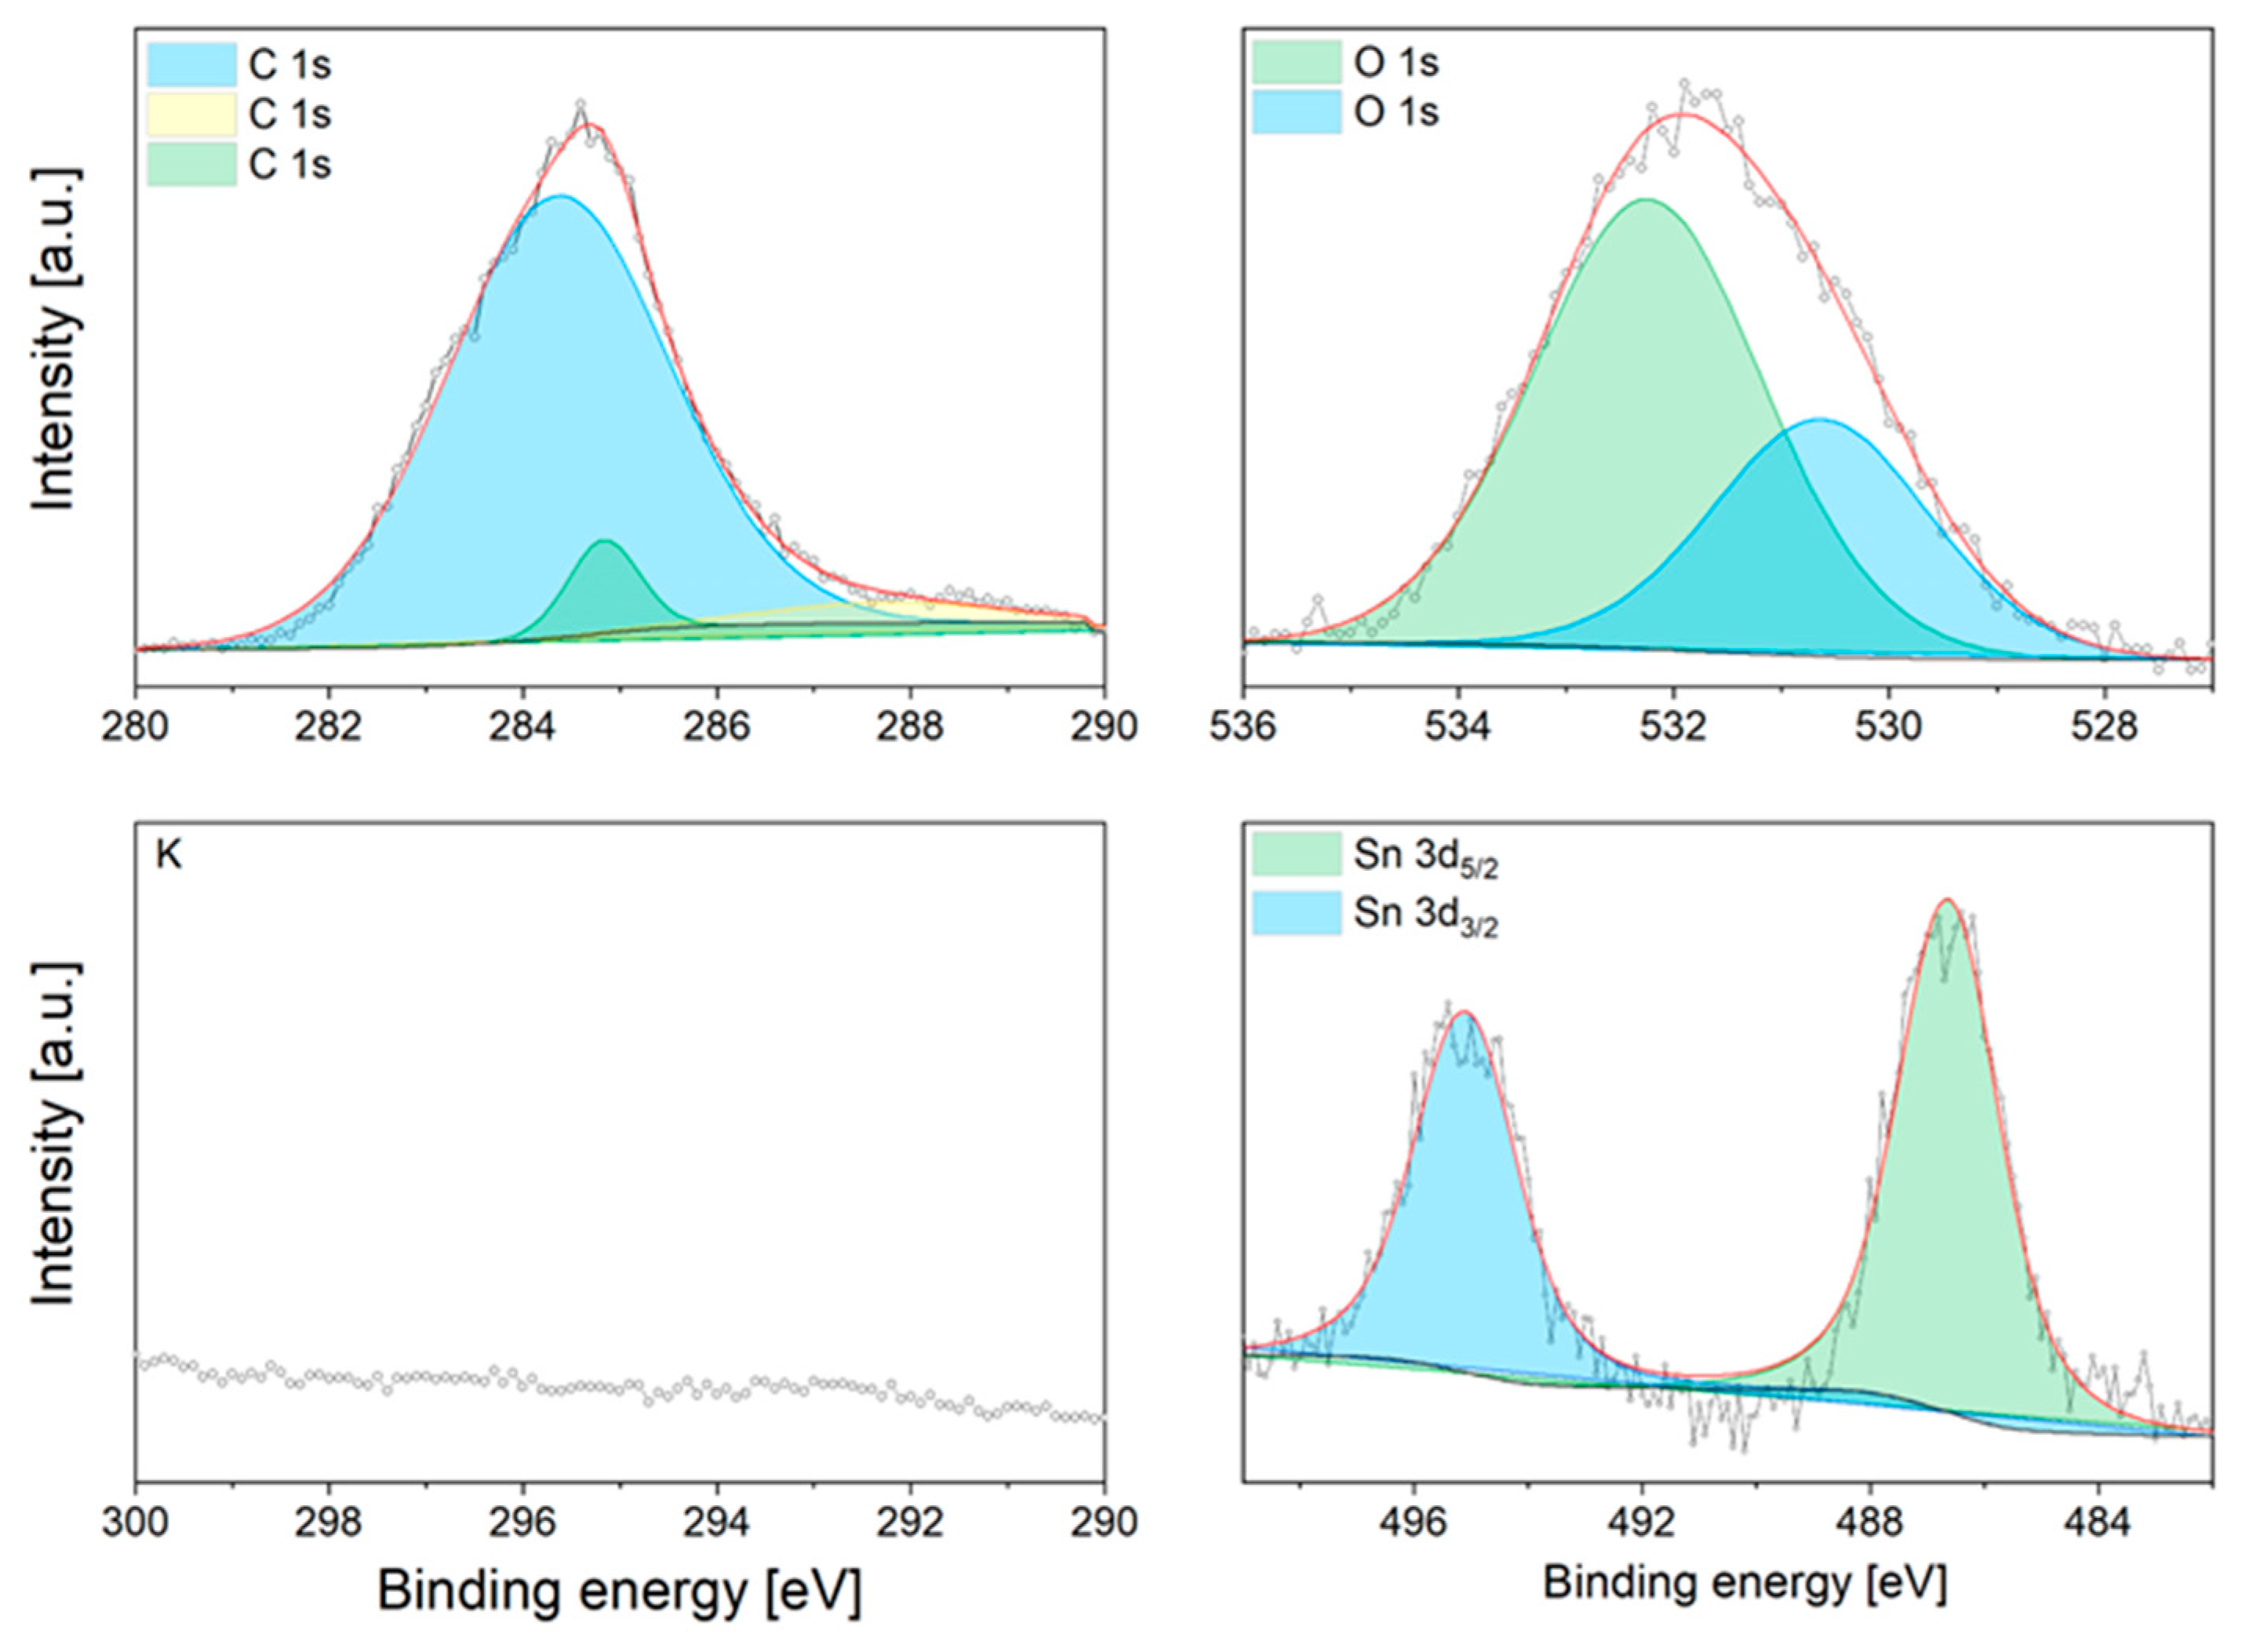
3.3. Characterisation
4. Conclusions
Author Contributions
Funding
Data Availability Statement
Conflicts of Interest
Appendix A


References
- National Oceanic and Atmospheric Administration (NOAA). 2022. Available online: https://www.noaa.gov/news-release/carbon-dioxide-now-more-than-50-higher-than-pre-industrial-levels (accessed on 5 July 2022).
- Martin-Roberts, E.; Scott, V.; Flude, S.; Johnson, G.; Haszeldine, R.S.; Gilfillan, S. Carbon capture and storage at the end of a lost decade. One Earth 2021, 4, 1569–1584. [Google Scholar] [CrossRef]
- Liu, X.; Liu, J.; Sun, C.; Liu, H.; Wang, W.; Smith, E.; Jiang, L.; Chen, X.; Snape, C. Design and development of 3D hierarchical ultra-microporous CO2-sieving carbon architectures for potential flow-through CO2 capture at typical practical flue gas temperatures. J. Mater. Chem. A 2020, 8, 17025–17035. [Google Scholar] [CrossRef]
- Yoo, D.K.; Jhung, S.H. Selective CO2 adsorption at low pressure with a Zr based UiO-67 metal–organic framework functionalized with aminosilanes. J. Mater. Chem. A 2022, 10, 8856–8865. [Google Scholar] [CrossRef]
- Dunstan, M.T.; Donat, F.; Bork, A.H.; Grey, C.P.; Müller, C.R. CO2 Capture at Medium to High Temperature Using Solid Oxide-Based Sorbents: Fundamental Aspects, Mechanistic Insights, and Recent Advances. Chem. Rev. 2021, 121, 12681–12745. [Google Scholar] [CrossRef]
- Gao, W.; Liang, S.; Wang, R.; Jiang, Q.; Zhang, Y.; Zheng, Q.; Xie, B.; Toe, C.; Zhu, X.; Wang, J.; et al. Park, Industrial carbon dioxide capture and utilization: State of the art and future challenges. Chem. Soc. Rev. 2020, 49, 8584–8686. [Google Scholar] [CrossRef]
- Garcia, J.A.; Villen-Guzman, M.; Rodriguez-Maroto, J.M.; Paz-Garcia, J.M. Technical analysis of CO2 capture pathways and technologies. J. Environ. Chem. Eng. 2022, 10, 108470. [Google Scholar] [CrossRef]
- Stefanelli, E.; Vitolo, S.; Puccini, M. Single-step fabrication of templated Li4SiO4-based pellets for CO2 capture at high temperature. J. Environ. Chem. Eng. 2022, 10, 108389. [Google Scholar] [CrossRef]
- Krödel, M.; Landuyt, A.; Abdala, P.M.; Müller, C.R. Mechanistic Understanding of CaO-Based Sorbents for High-Temperature CO2 Capture: Advanced Characterization and Prospects. ChemSusChem 2020, 13, 6259–6272. [Google Scholar]
- Peltzer, D.; Múnera, J.; Cornaglia, L. The effect of the Li:Na molar ratio on the structural and sorption properties of mixed zirconates for CO2 capture at high temperature. J. Environ. Chem. Eng. 2019, 7, 2829–3000. [Google Scholar] [CrossRef]
- Zhang, Y.; Gao, Y.; Pfeiffer, H.; Louis, B.; Sun, L.; O’Hare, D.; Wang, Q. Recent advances in lithium containing ceramic based sorbents for high-temperature CO2 capture. J. Mater. Chem. A 2019, 7, 7962–8005. [Google Scholar] [CrossRef]
- Hassani, E.; Cho, J.; Feyzbar-Khalkhali-Nejad, F.; Rashti, A.; Soon Jang, S.; Oh, T.-S. Ca2CuO3: A high temperature CO2 sorbent with rapid regeneration kinetics. J. Environ. Chem. Eng. 2022, 10, 107334. [Google Scholar] [CrossRef]
- Chang, R.; Wu, X.; Cheung, O.; Liu, W. Synthetic solid oxide sorbents for CO2 capture: State-of-the art and future perspectives. J. Mater. Chem. A 2022, 10, 1682–1705. [Google Scholar] [CrossRef]
- Yang, G.; Luo, H.; Ohba, T.; Kanoh, H. CO2 Capture by Carbon Aerogel–Potassium Carbonate Nanocomposites. Int. J. Chem. Eng. 2016, 2016, 4012967. [Google Scholar] [CrossRef]
- Gregory, O.J.; Luo, Q.; Crismas, E.E. High Temperature Stability of Indium Tin Oxide Thin Films. Thin Solid Film. 2002, 406, 286–293. [Google Scholar] [CrossRef]
- Salager, E.; Sarou-Kanian, V.; Sathiya, M.; Tang, M.; Leriche, J.; Melin, P.; Wang, Z.; Vezin, H.; Bassada, C.; Deschamps, M.; et al. Solid-State NMR of the Family of Positive Electrode Materials Li2Ru1–ySnyO3 for Lithium-Ion Batteries. Chem. Mater. 2014, 26, 7009–7019. [Google Scholar] [CrossRef]
- Lloy, J.; Gatehouse, B.M. The crystal structure of potassium metazirconate and potassium metastannate; K2ZrO2 and K2SnO3: Oxides with five-co-ordinate square-pyramidal zirconium(IV) and tin(IV). J. Chem. Soc. D 1969, 727–728. [Google Scholar] [CrossRef]
- Wang, Z.; Ren, Y.; Ma, T.; Zhuang, W.; Lu, S.; Xu, G.; Abouimrane, A.; Amine, K.; Chen, Z. Probing cation intermixing in Li2SnO3. Chen. RSC Adv. 2016, 6, 31559. [Google Scholar] [CrossRef]
- Hernández-Fontes, C.; Pfeiffer, H. Unraveling the CO and CO2 reactivity on Li2MnO3: Sorption and catalytic analyses. Chem. Eng. J. 2022, 428, 131998. [Google Scholar] [CrossRef]
- Inagaki, M.; Nakai, S.; Ikeda, T. Synthesis and sintering of Li2SnO3. J. Nucl. Mater. 1988, 160, 224–228. [Google Scholar] [CrossRef]
- Liu, B.; Zhang, Y.; Su, Z.; Li, G.; Jiang, T. Function mechanism of CO-CO2 atmosphere on the formation of Na2SnO3 from SnO2 and Na2CO3 during the roasting process. Powder Technol. 2016, 301, 102–109. [Google Scholar] [CrossRef]
- Iwasaki, M.; Takizawa, H.; Uheda, K.; Endo, T. Synthesis and crystal structure of Na4Sn3O8. J. Mater. Chem. 2002, 12, 1068–1070. [Google Scholar] [CrossRef]
- McAuliffe, R.D.; Miller, C.A.; Zhang, X.; Hulbert, B.S.; Huq, A.; dela Cruz, C.; Schleife, A.; Shoemaker, D.P. Structural, Electronic, and Optical Properties of K2Sn3O7 with an Offset Hollandite Structure. Inorg. Chem. 2017, 56, 2914–2918. [Google Scholar] [CrossRef] [PubMed]
- Nguyen, T.Q.; Atla, V.; Vendra, V.K.; Thapa, A.K.; Jasinski, J.B.; Druffel, T.L.; Sunkara, M.K. Scalable solvo-plasma production of porous tin oxide nanowires. Chem. Eng. Sci. 2016, 154, 20–26. [Google Scholar] [CrossRef]
- Kierzkowska, A.M.; Pacciani, R.; Müller, C.R. CaO-Based CO2 Sorbents: From Fundamentals to the Development of New, Highly Effective Materials. ChemSusChem 2013, 6, 1130–1148. [Google Scholar] [CrossRef]
- Cho, M.S.; Lee, S.C.; Chae, H.J.; Lee, J.B.; Kim, J.C. Preparation and performance of potassium-based sorbent using SnO2 for post-combustion CO2 capture. Adsorption 2016, 22, 1119–1127. [Google Scholar] [CrossRef]
- Munro, S.; Åhlén, M.; Cheung, O.; Sanna, A. Tuning Na2ZrO3 for fast and stable CO2 adsorption by solid state synthesis. Chem. Eng. J. 2020, 388, 124284. [Google Scholar] [CrossRef]
- Ji, G.; Memon, M.; Zhuo, H.; Zhao, M. Experimental study on CO2 capture mechanisms using Na2ZrO3 sorbents synthesized by soft chemistry method. Chem. Eng. J. 2017, 313, 646–654. [Google Scholar] [CrossRef]
- Sanna, A.; Maroto-Valer, M.M. Potassium-based sorbents from fly ash for high-temperature. Environ. Sci. Pollut. Res. 2016, 23, 22242–22252. [Google Scholar] [CrossRef]
- Hoppe, R.; Roehrborn, H.J.; Walker, H. Neue Plumbate und Stannate der Alkalimetalle. Naturwiss 1964, 51, 86. [Google Scholar] [CrossRef]
- Tournoux, M. Les Systèmes Étain IV-oxygène-Potassium et Zirconium-Oxygène-Potassium. Matériaux. 2007. Available online: https://tel.archives-ouvertes.fr (accessed on 9 July 2022).
- Sanchez-Camacho, P.; Romero-Ibarra, I.C.; Pfeiffer, H. Thermokinetic and microstructural analyses of the CO2 chemisorption on K2CO3-Na2ZrO3. J. CO2 Util. 2013, 3, 14–20. [Google Scholar] [CrossRef]
- Sun, S.; Lv, Z.; Qiao, Y.; Qin, C.; Xu, S.; Wu, C. Integrated CO2 capture and utilization with CaO-alone for high purity syngas production. CCST 2021, 1, 100001. [Google Scholar] [CrossRef]
- Roy, T.; Agarwal, A.K.; Sharma, Y.C. A cleaner route of biodiesel production from waste frying oil using novel potassium tin oxide catalyst: A smart liquid-waste management. Waste Manag. 2021, 135, 243–255. [Google Scholar] [CrossRef] [PubMed]
- Sarrión, B.; Perejón, A.; Sánchez-Jiménez, P.E.; Pérez-Maqueda, L.A.; Valverde, J.M. Role of calcium looping conditions on the performance of natural and synthetic Ca-based materials for energy storage. J. CO2 Util. 2018, 28, 374–384. [Google Scholar] [CrossRef]
- Raganati, F.; Chirone, R.; Ammendola, P. Calcium-looping for thermochemical energy storage in concentrating solar power applications: Evaluation of the effect of acoustic perturbation on the fluidized bed carbonation. Chem. Eng. J. 2020, 392, 123658. [Google Scholar] [CrossRef]
- Wang, K.; Zhao, Y.; Clough, P.T.; Zhao, P.; Anthony, E.J. Sorption of CO2 on NaBr co-doped Li4SiO4 ceramics: Structural and kinetic analysis. Fuel Process. Technol. 2019, 195, 106143. [Google Scholar] [CrossRef]
- Sanna, A.; Thompson, S.; Zajac, J.M.; Whitty, K.J. Evaluation of palm-oil fly ash derived lithium silicate for CO2 sorption under simulated gasification conditions. J. CO2 Util. 2022, 56, 101826. [Google Scholar] [CrossRef]
- Song, G.; Zhu, X.; Chen, R.; Liao, Q.; Ding, Y.D.; Chen, L. An investigation of CO2 adsorption kinetics on porous magnesium oxide. Chem. Eng. J. 2016, 283, 175–183. [Google Scholar] [CrossRef]


| SnO2 | ZrO2 | Na2SnO3 | c-K2SnO3 | Ca2SnO3 | Li2SnO3 | ||
|---|---|---|---|---|---|---|---|
| Max Mass CO2 Adsorbed | (wt%) | 0.1 | 0.1 | 2.0 | 11.5 | 0.3 | 0.0200 |
| Max Adsorption Rate | (mg/s) | 0.0000001 | 0.00001 | 0.001 | 0.0041 | 0.001 | 0.0002 |
| K-A | Cycle Number (Temperature °C) | |||||||||
|---|---|---|---|---|---|---|---|---|---|---|
| 1 (800) | 2 (800) | 3 (800) | 1 (850) | 2 (850) | 3 (850) | 1 (900) | 2 (900) | 3 (900) | 4 (900) | |
| CO2 ads., wt% | 1.35 | 0.78 | 0.70 | 2.22 | 2.63 | 2.83 | 3.28 | 3.17 | 2.98 | 2.91 |
| CO2 ads, mmol/g | 0.31 | 0.18 | 0.16 | 0.51 | 0.60 | 0.64 | 0.75 | 0.72 | 0.68 | 0.66 |
| heor. CO2 ads., % | 21 | 12 | 11 | 35 | 41 | 44 | 51 | 50 | 47 | 46 |
| CO2 des, mmol/g | 0.31 | 0.18 | 0.16 | 0.51 | 0.60 | 0.64 | 0.75 | 0.72 | 0.68 | 0.66 |
| CO2 ads rate, mg/s | 0.0027 | 0.0019 | 0.0013 | 0.0016 | 0.0022 | 0.0029 | 0.0043 | 0.0053 | 0.0052 | 0.0053 |
| CO2 des rate, mg/s | 0.0021 | 0.0018 | 0.0016 | 0.0044 | 0.0084 | 0.01 | 0.0094 | 0.0086 | 0.0081 | 0.0074 |
| Cycle number (Temperature °C) | ||||||||||
| K-B | 1 (800) | 2 (800) | 3 (800) | 1 (850) | 2 (850) | 3 (850) | 1 (900) | 2 (900) | 3 (900) | 4 (900) |
| CO2 ads., wt% | 7.02 | 7.29 | 7.32 | 6.52 | 6.69 | 6.48 | 5.29 | 4.95 | 4.74 | 4.27 |
| CO2 ads, mmol/g | 1.59 | 1.66 | 1.66 | 1.48 | 1.52 | 1.47 | 1.20 | 1.13 | 1.08 | 0.97 |
| Theor. CO2 ads., % | 46 | 48 | 48 | 43 | 44 | 43 | 35 | 33 | 31 | 28 |
| CO2 des, mmol/g | 1.59 | 1.64 | 1.63 | 1.52 | 1.50 | 1.46 | 1.35 | 1.20 | 1.11 | 1.04 |
| CO2 ads rate, mg/s | 0.0062 | 0.016 | 0.018 | 0.012 | 0.016 | 0.016 | 0.009 | 0.008 | 0.008 | 0.008 |
| CO2 des rate, mg/s | 0.017 | 0.012 | 0.011 | 0.015 | 0.016 | 0.015 | 0.019 | 0.018 | 0.017 | 0.017 |
| K-C | Cycle number (Temperature °C) | |||||||||
| 1 (800) | 2 (800) | 3 (800) | 1 (850) | 2 (850) | 3 (850) | 1 (900) | 2 (900) | 3 (900) | 4 (900) | |
| CO2 ads., wt% | 4.88 | 5.21 | 5.25 | 6.14 | 5.98 | 6.29 | 5.16 | 4.73 | 4.64 | 4.39 |
| CO2 ads, mmol/g | 1.11 | 1.19 | 1.19 | 1.40 | 1.36 | 1.43 | 1.17 | 1.08 | 1.06 | 1.00 |
| Theor. CO2 ads., % | 37 | 40 | 40 | 47 | 45 | 48 | 39 | 36 | 35 | 33 |
| CO2 des, mmol/g | 1.11 | 1.19 | 1.19 | 1.40 | 1.36 | 1.43 | 1.17 | 1.08 | 1.06 | 1.00 |
| CO2 ads rate, mg/s | 0.0051 | 0.0043 | 0.0026 | 0.0031 | 0.0037 | 0.0031 | 0.0092 | 0.007 | 0.0063 | 0.0061 |
| CO2 des rate, mg/s | 0.0091 | 0.0098 | 0.01 | 0.022 | 0.022 | 0.022 | 0.026 | 0.025 | 0.024 | 0.024 |
| K-D | Cycle number (Temperature °C) | |||||||||
| 1 (800) | 2 (800) | 3 (800) | 1 (850) | 2 (850) | 3 (850) | 1 (900) | 2 (900) | 3 (900) | 4 (900) | |
| CO2 ads., wt% | 5.91 | 5.99 | 6.14 | 5.64 | 5.73 | 5.38 | 4.51 | 4.08 | 3.88 | 3.60 |
| CO2 ads, mmol/g | 1.34 | 1.36 | 1.40 | 1.28 | 1.30 | 1.22 | 1.03 | 0.93 | 0.88 | 0.82 |
| Theor. CO2 ads., % | 45 | 45 | 47 | 43 | 43 | 41 | 34 | 31 | 29 | 27 |
| CO2 des, mmol/g | 1.34 | 1.36 | 1.39 | 1.28 | 1.30 | 1.22 | 0.98 | 0.90 | 0.84 | 0.77 |
| CO2 ads rate, mg/s | 0.0051 | 0.0043 | 0.0026 | 0.0031 | 0.0037 | 0.0031 | 0.0092 | 0.007 | 0.0063 | 0.0061 |
| CO2 des rate, mg/s | 0.0091 | 0.0098 | 0.01 | 0.022 | 0.022 | 0.022 | 0.026 | 0.025 | 0.024 | 0.024 |
| K-B | |||||
| Cycle | 1 | 10 | 20 | 30 | 40 |
| CO2 ads., wt.% | 5.78 | 6.28 | 5.70 | 5.65 | 5.35 |
| % lost | 0 | −8.7 | 1.4 | 2.2 | 7.4 |
| K-C | |||||
| Cycle | 1 | 10 | 20 | 30 | 40 |
| CO2 ads., wt.% | 3.44 | 3.30 | 3.32 | 3.31 | 2.84 |
| % lost | 0 | 4.1 | 3.5 | 3.8 | 17.4 |
| K-D | |||||
| Cycle | 1 | 10 | 20 | 30 | 40 |
| CO2 ads., wt.% | 3.55 | 2.29 | 2.16 | 1.88 | 1.69 |
| % lost | 0 | 35.5 | 39.2 | 47.0 | 52.4 |
| Sample | Peak Position 2θ (°) | FWHM Bsize (°) | Dp (nm) |
|---|---|---|---|
| KA-K2SnO3 | 51.77 | 0.15 | 102.85 |
| KA-K2Sn3O7 | 17.72 | 0.2 | 59.60 |
| KA-SnO2 | 26.6 | 0.16 | 84.48 |
| KAA-K2SnO3 | 51.77 | 0.16 | 91.38 |
| KAA-K2Sn3O7 | 17.72 | 0.17 | 75.71 |
| KAA-SnO2 | 26.6 | 0.15 | 93.76 |
| KB-K2SnO3 | 7.15 | 0.13 | 117.18 |
| KB-K4SnO4 | 32.94 | 0.23 | 50.64 |
| KBA-K2SnO3 | 7.15 | 0.15 | 91.43 |
| KBA-K4SnO4 | 32.94 | 0.216 | 55.15 |
| KC-K2SnO3 | 7.15 | 0.11 | 126.04 |
| KC-K2Sn3O7 | 29.46 | 0.18 | 70.96 |
| Model | R2 | ||
|---|---|---|---|
| 800 °C | 850 °C | 900 °C | |
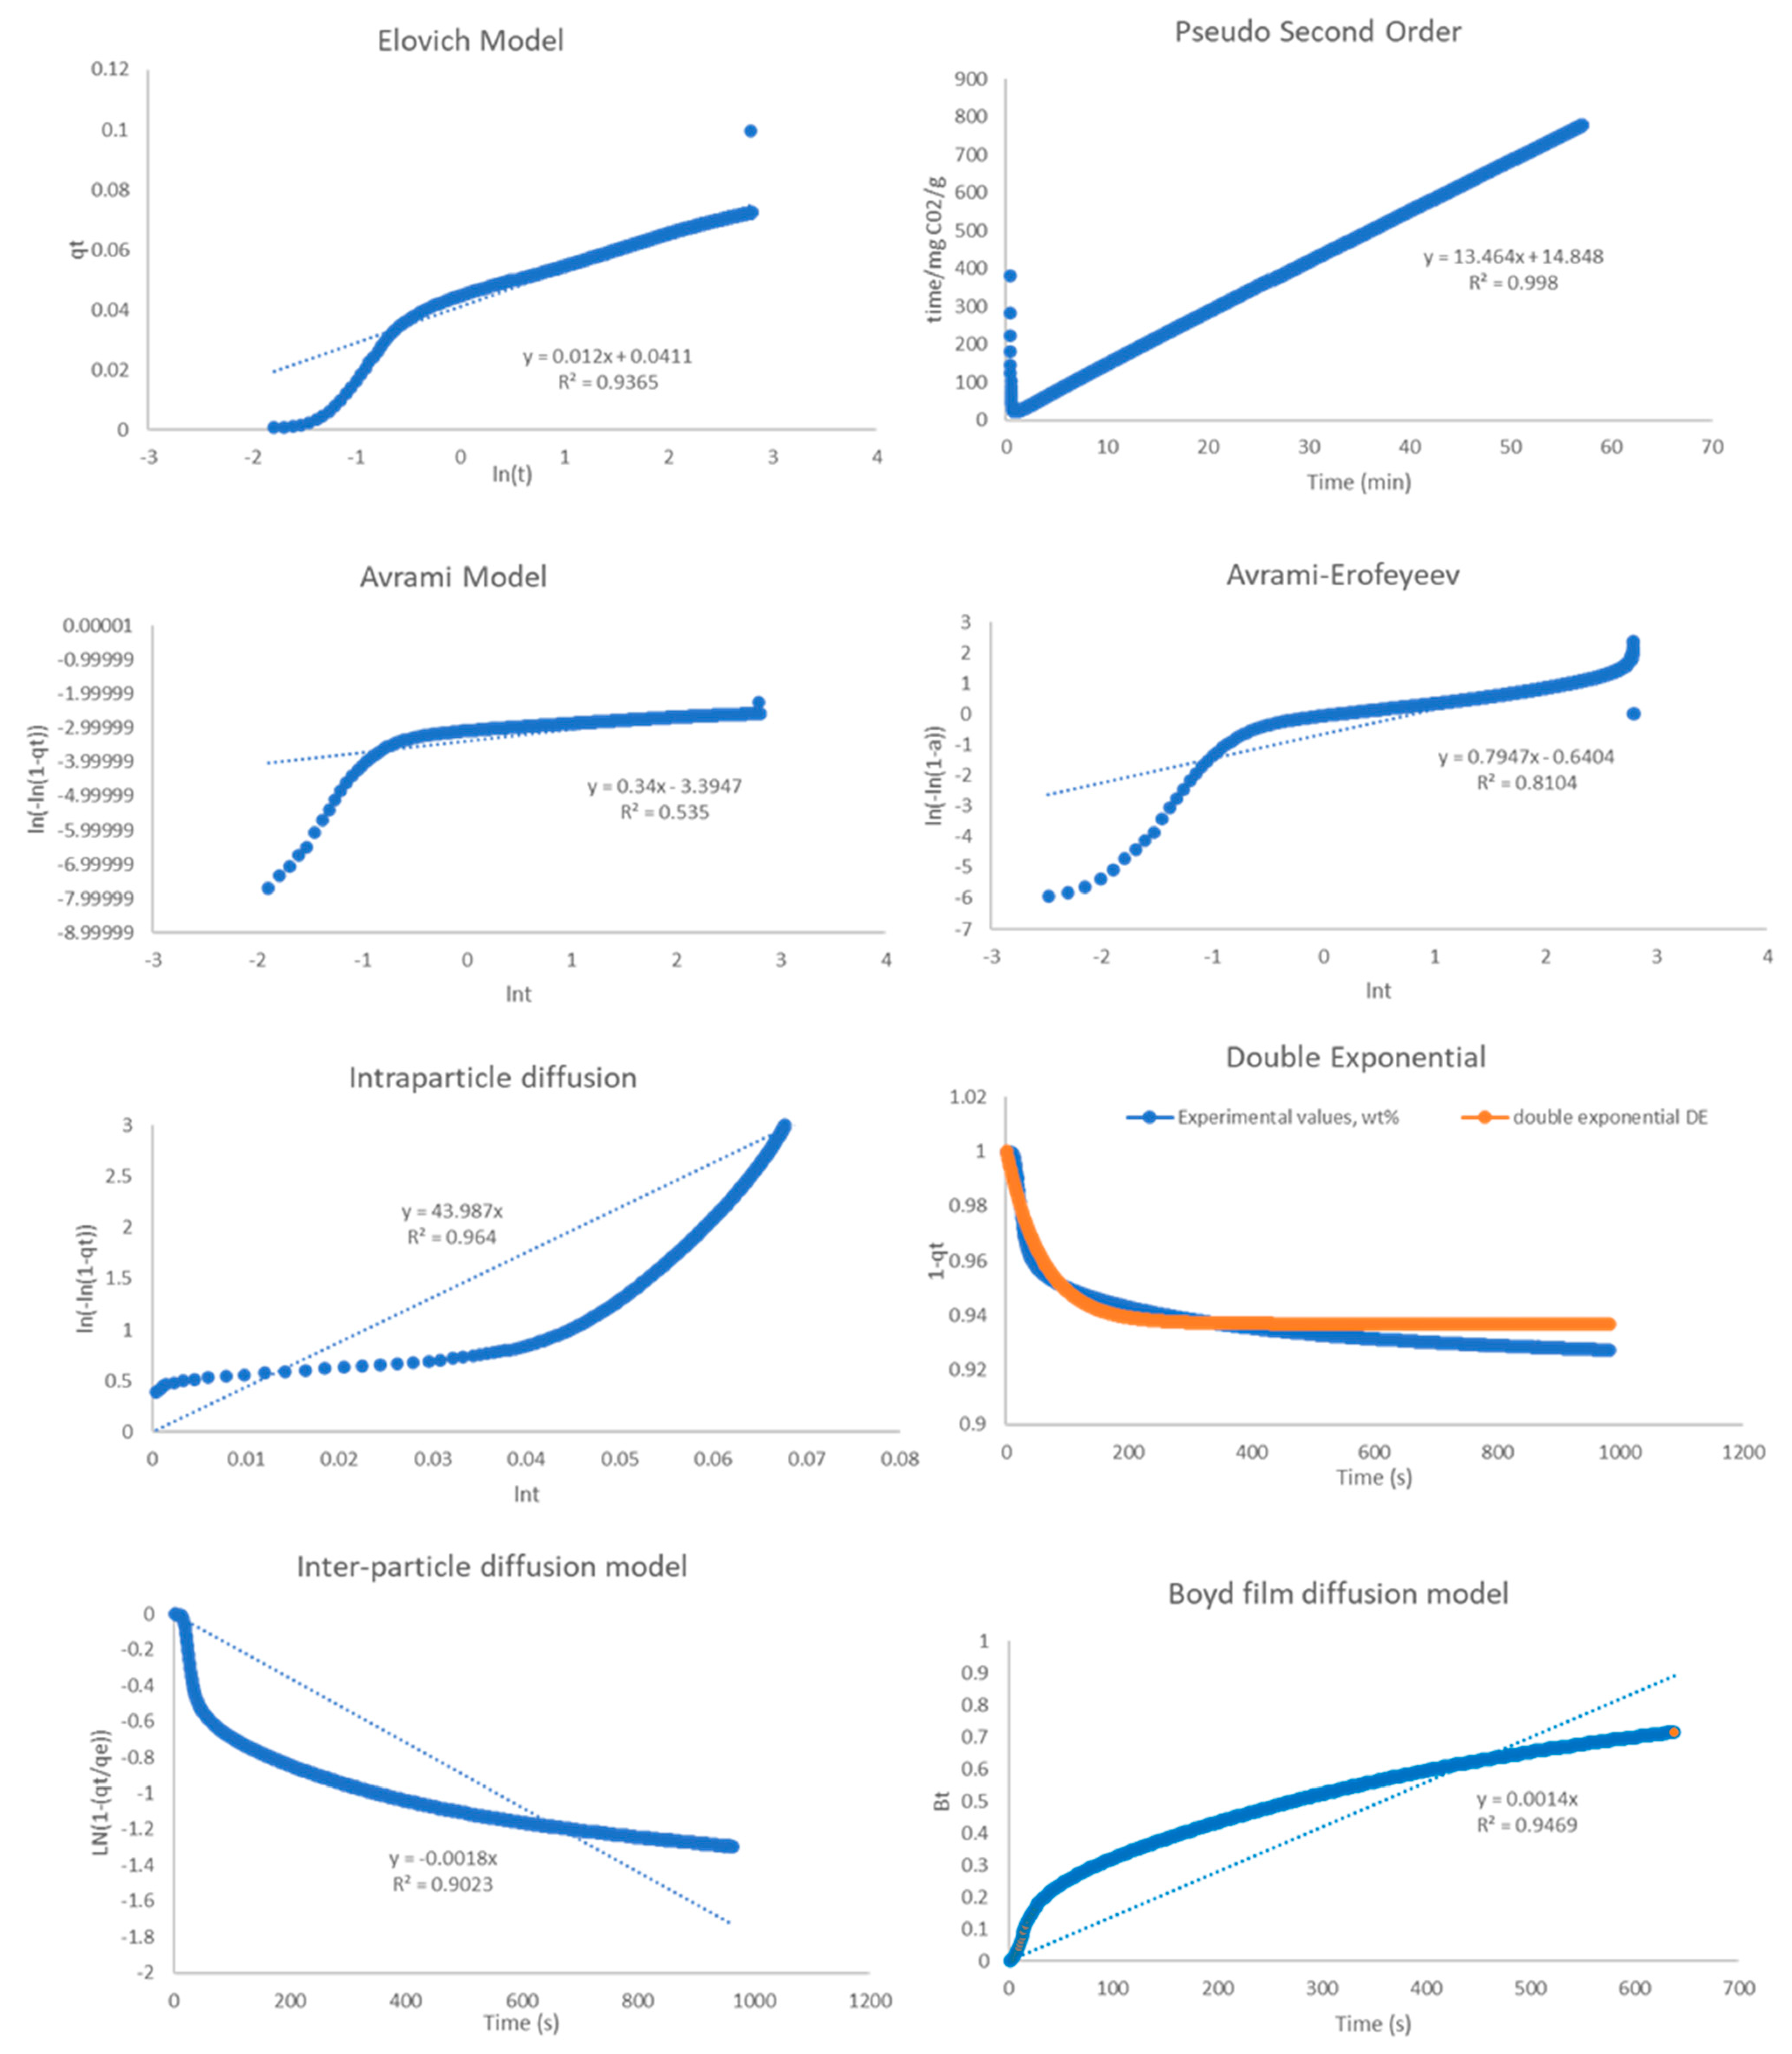
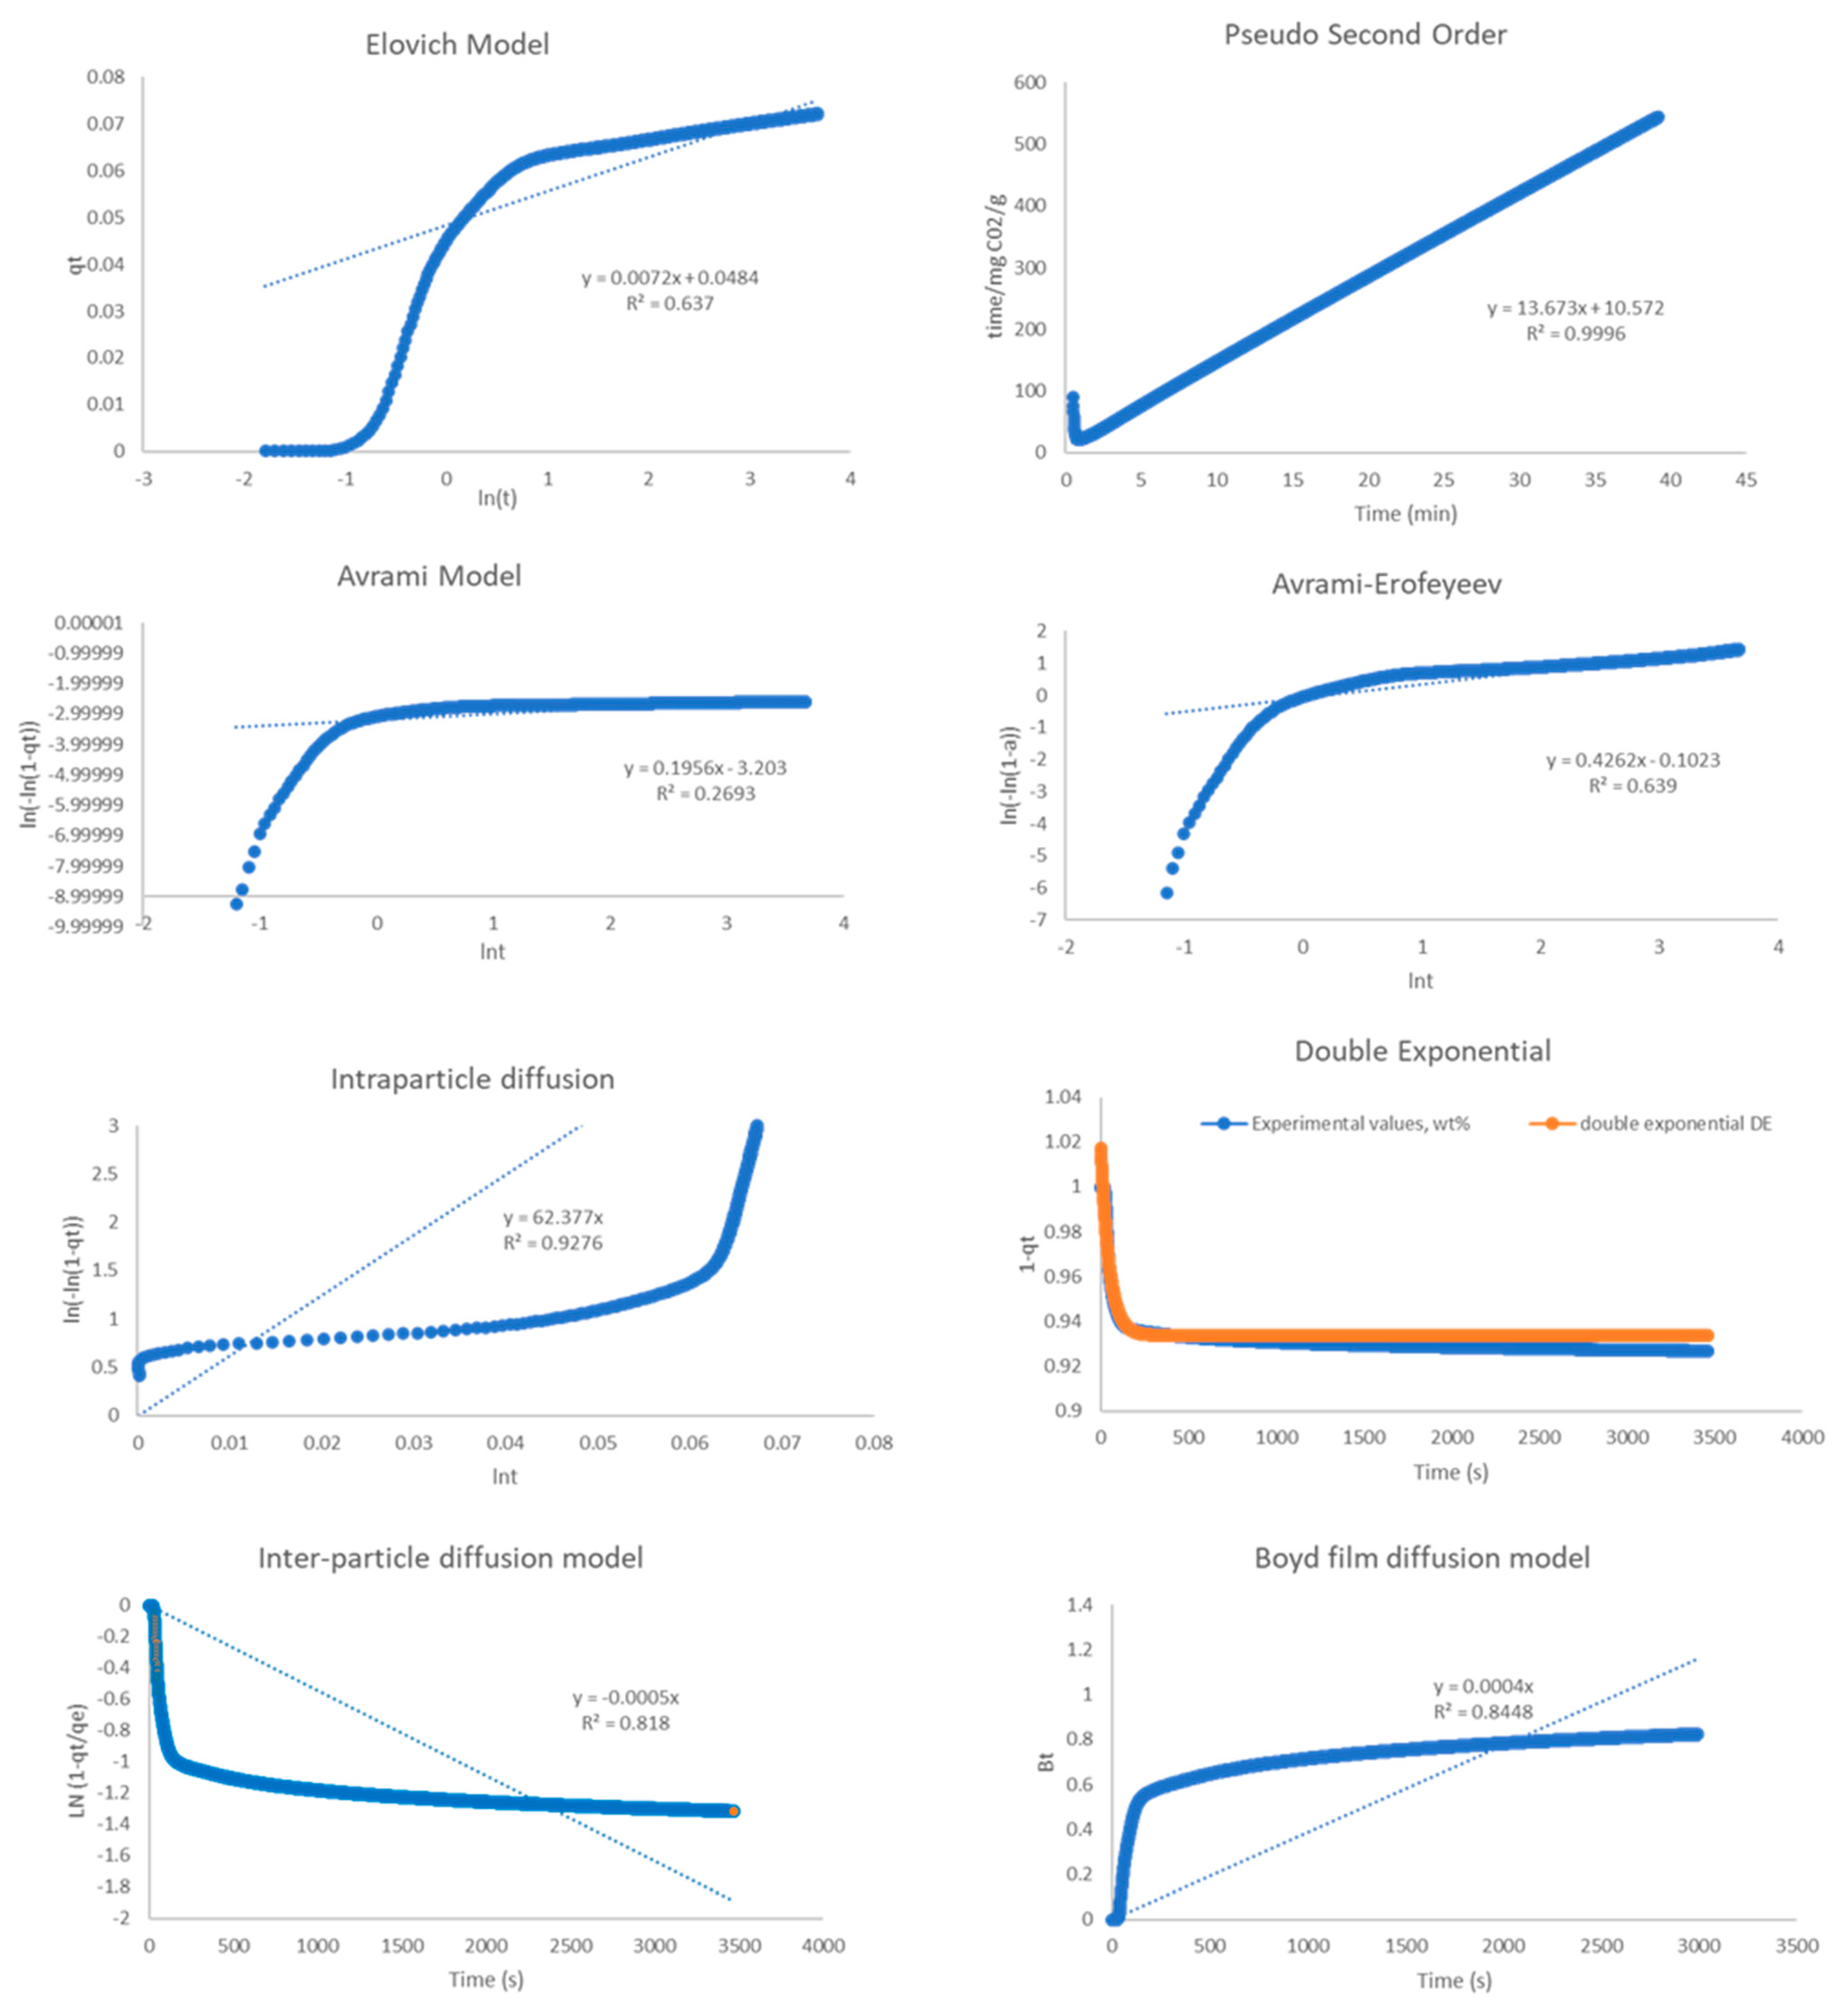
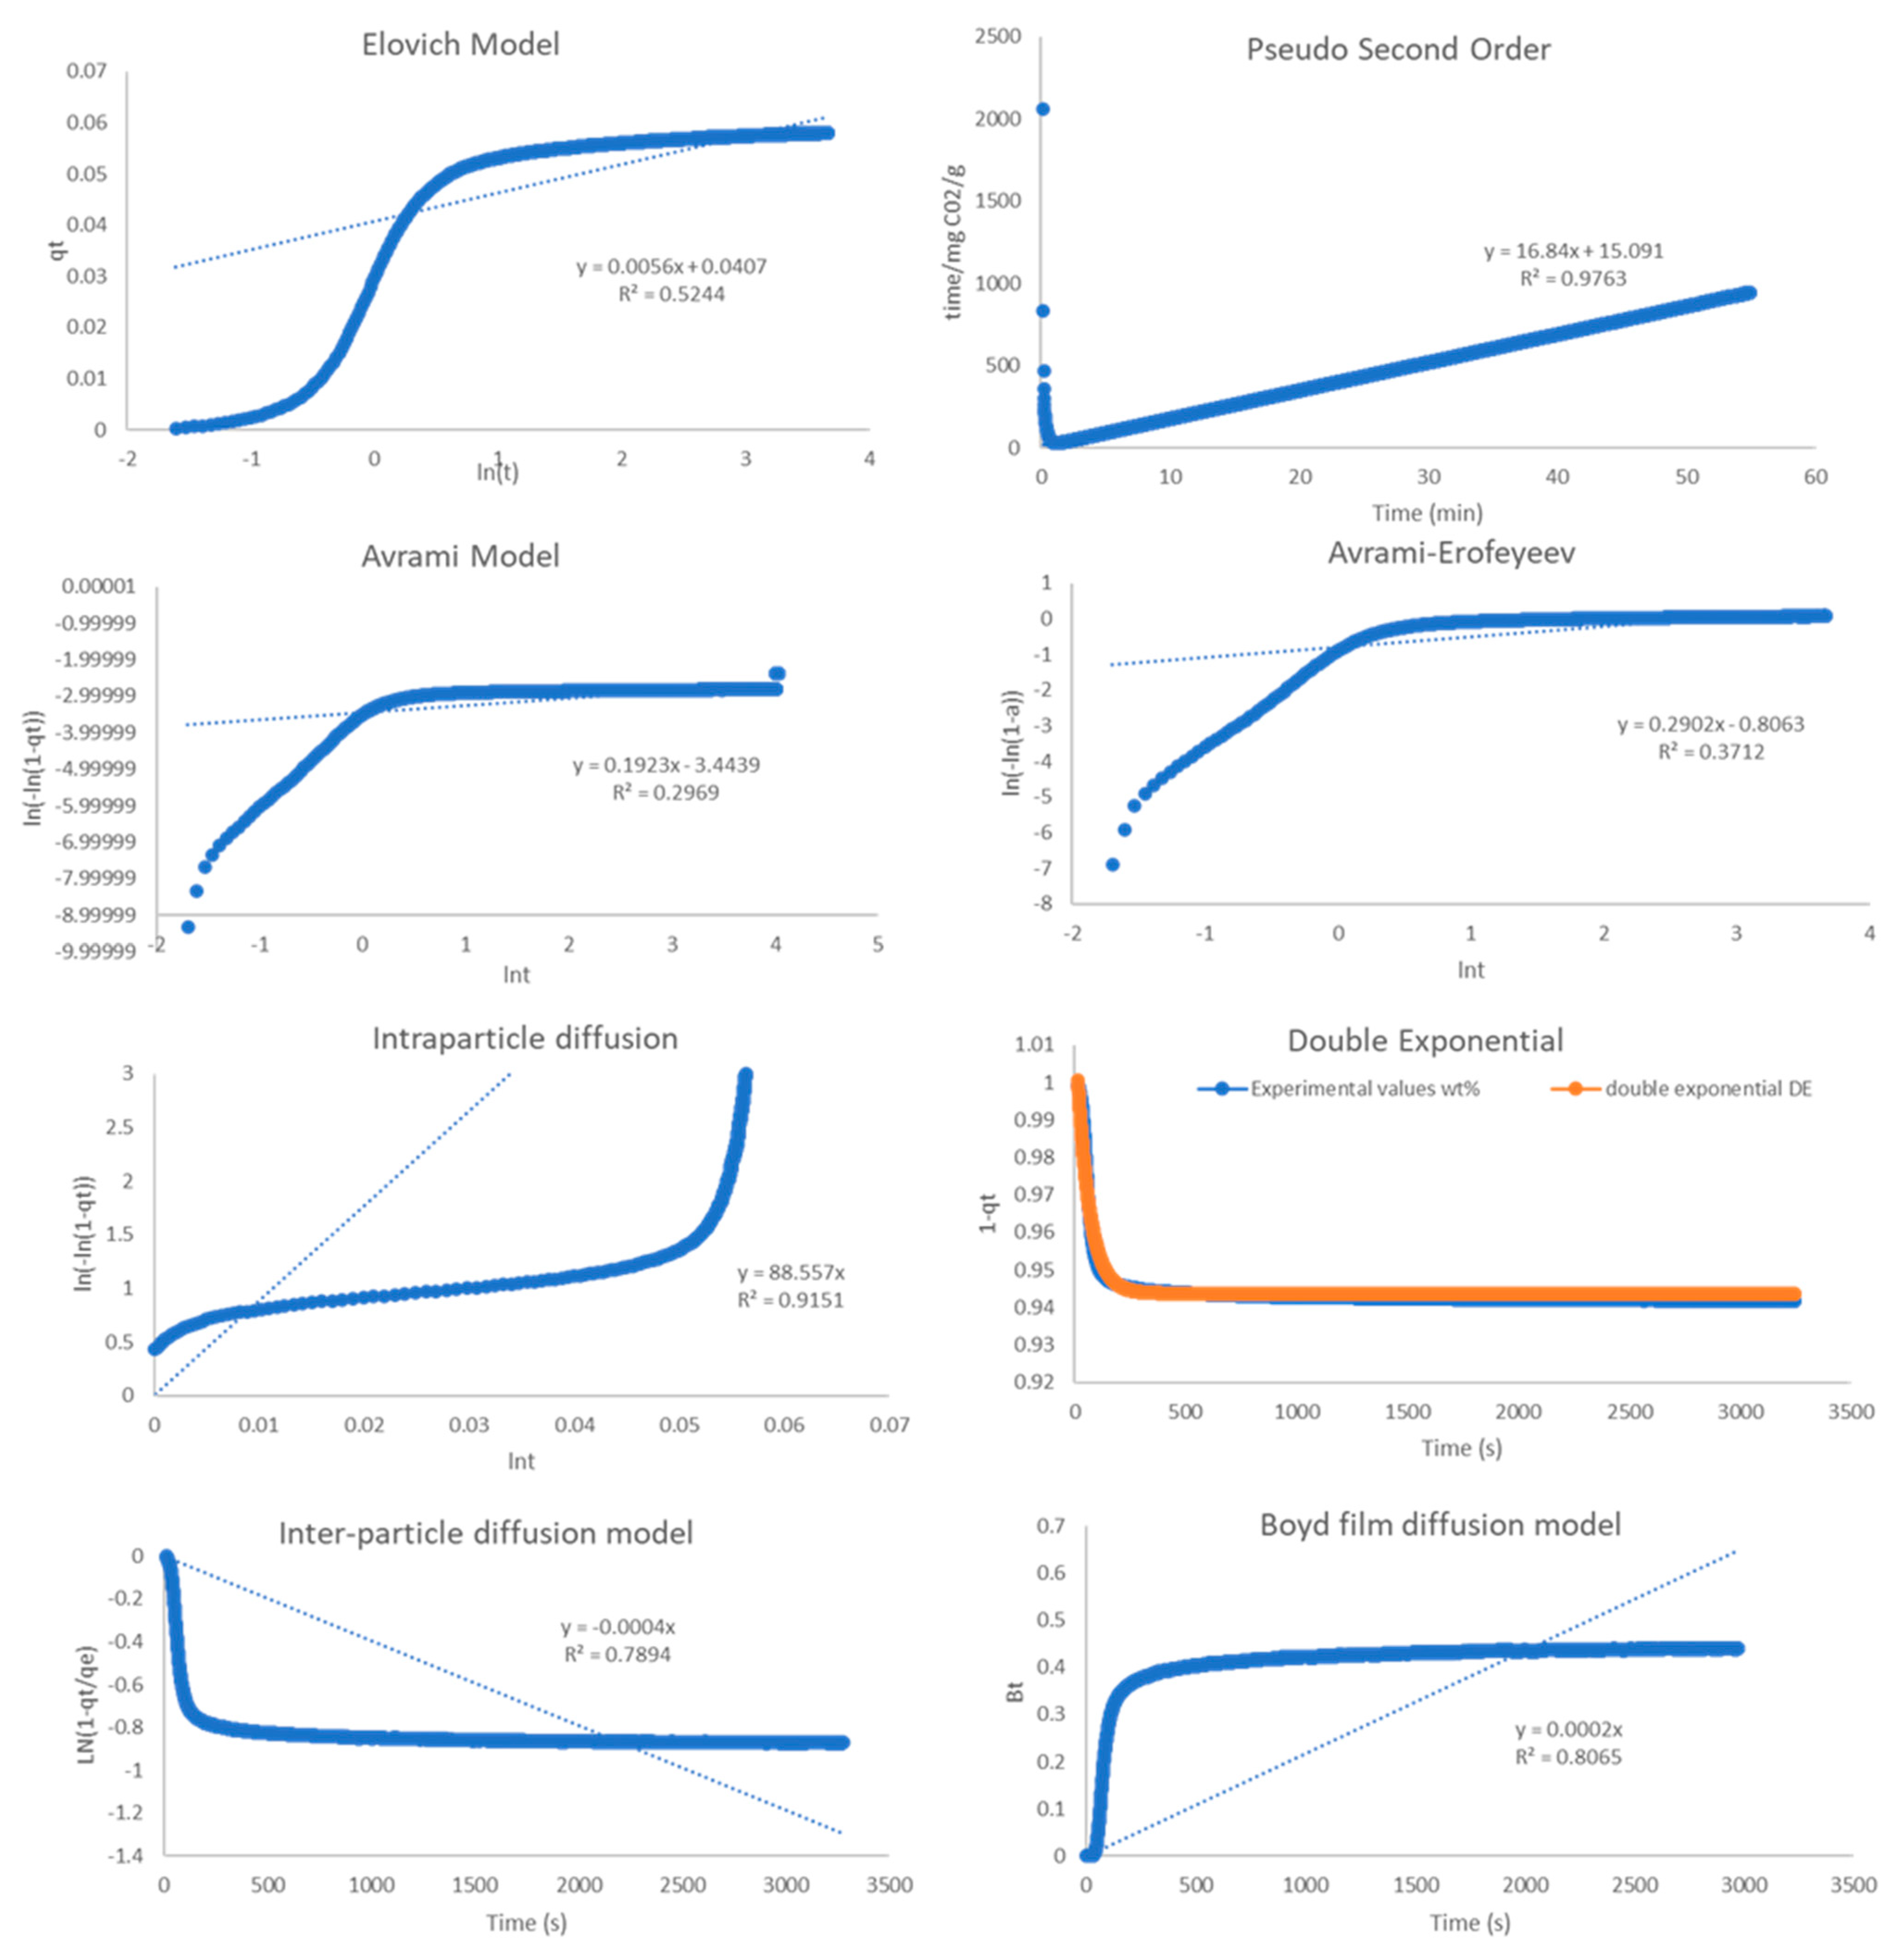
| Pseudo-2nd order | 0.999 | 0.999 | 0.976 |
| Elovich | 0.941 | 0.637 | 0.524 |
| Avrami | 0.534 | 0.269 | 0.297 |
| A-E | 0.81 | 0.639 | 0.371 |
| Double Exp. | 0.975 | 0.996 | 0.944 |
| Intra-P Diffusion | 0.964 | 0.928 | 0.915 |
| Inter-P Diffusion | 0.902 | 0.818 | 0.789 |
| Boyd Film Diff. | 0.947 | 0.845 | 0.806 |
| Double Exponential Model | Eyring’s Model | ln(k1/T) | ln(k2/T) | ||||||
|---|---|---|---|---|---|---|---|---|---|
| T, K | k1, s−1 | k2, s−1 | A | B | C | T, K | 1/T | k1 | k2 |
| 1073 | 4.8870 | 0.0168 | 0.01 | 0.06 | 0.94 | 1073 | 0.0009 | −5.392 | −11.065 |
| 1123 | 5.9870 | 0.0203 | 0.01 | 0.09 | 0.93 | 1123 | 0.0009 | −5.234 | −10.923 |
| 1173 | 6.2270 | 0.1762 | 0.00 | 0.07 | 0.97 | 1173 | 0.0009 | −5.238 | −8.8035 |
Disclaimer/Publisher’s Note: The statements, opinions and data contained in all publications are solely those of the individual author(s) and contributor(s) and not of MDPI and/or the editor(s). MDPI and/or the editor(s) disclaim responsibility for any injury to people or property resulting from any ideas, methods, instructions or products referred to in the content. |
© 2023 by the authors. Licensee MDPI, Basel, Switzerland. This article is an open access article distributed under the terms and conditions of the Creative Commons Attribution (CC BY) license (https://creativecommons.org/licenses/by/4.0/).
Share and Cite
Baird, R.; Chang, R.; Cheung, O.; Sanna, A. High Temperature CO2 Capture Performance and Kinetic Analysis of Novel Potassium Stannate. Int. J. Mol. Sci. 2023, 24, 2321. https://doi.org/10.3390/ijms24032321
Baird R, Chang R, Cheung O, Sanna A. High Temperature CO2 Capture Performance and Kinetic Analysis of Novel Potassium Stannate. International Journal of Molecular Sciences. 2023; 24(3):2321. https://doi.org/10.3390/ijms24032321
Chicago/Turabian StyleBaird, Ross, Ribooga Chang, Ocean Cheung, and Aimaro Sanna. 2023. "High Temperature CO2 Capture Performance and Kinetic Analysis of Novel Potassium Stannate" International Journal of Molecular Sciences 24, no. 3: 2321. https://doi.org/10.3390/ijms24032321
APA StyleBaird, R., Chang, R., Cheung, O., & Sanna, A. (2023). High Temperature CO2 Capture Performance and Kinetic Analysis of Novel Potassium Stannate. International Journal of Molecular Sciences, 24(3), 2321. https://doi.org/10.3390/ijms24032321