
In Silico Simulation of Impacts of Metal Nano-Oxides on Cell Viability in THP-1 Cells Based on the Correlation Weights of the Fragments of Molecular Structures and Codes of Experimental Conditions Represented by Means of Quasi-SMILES


Abstract
1. Introduction
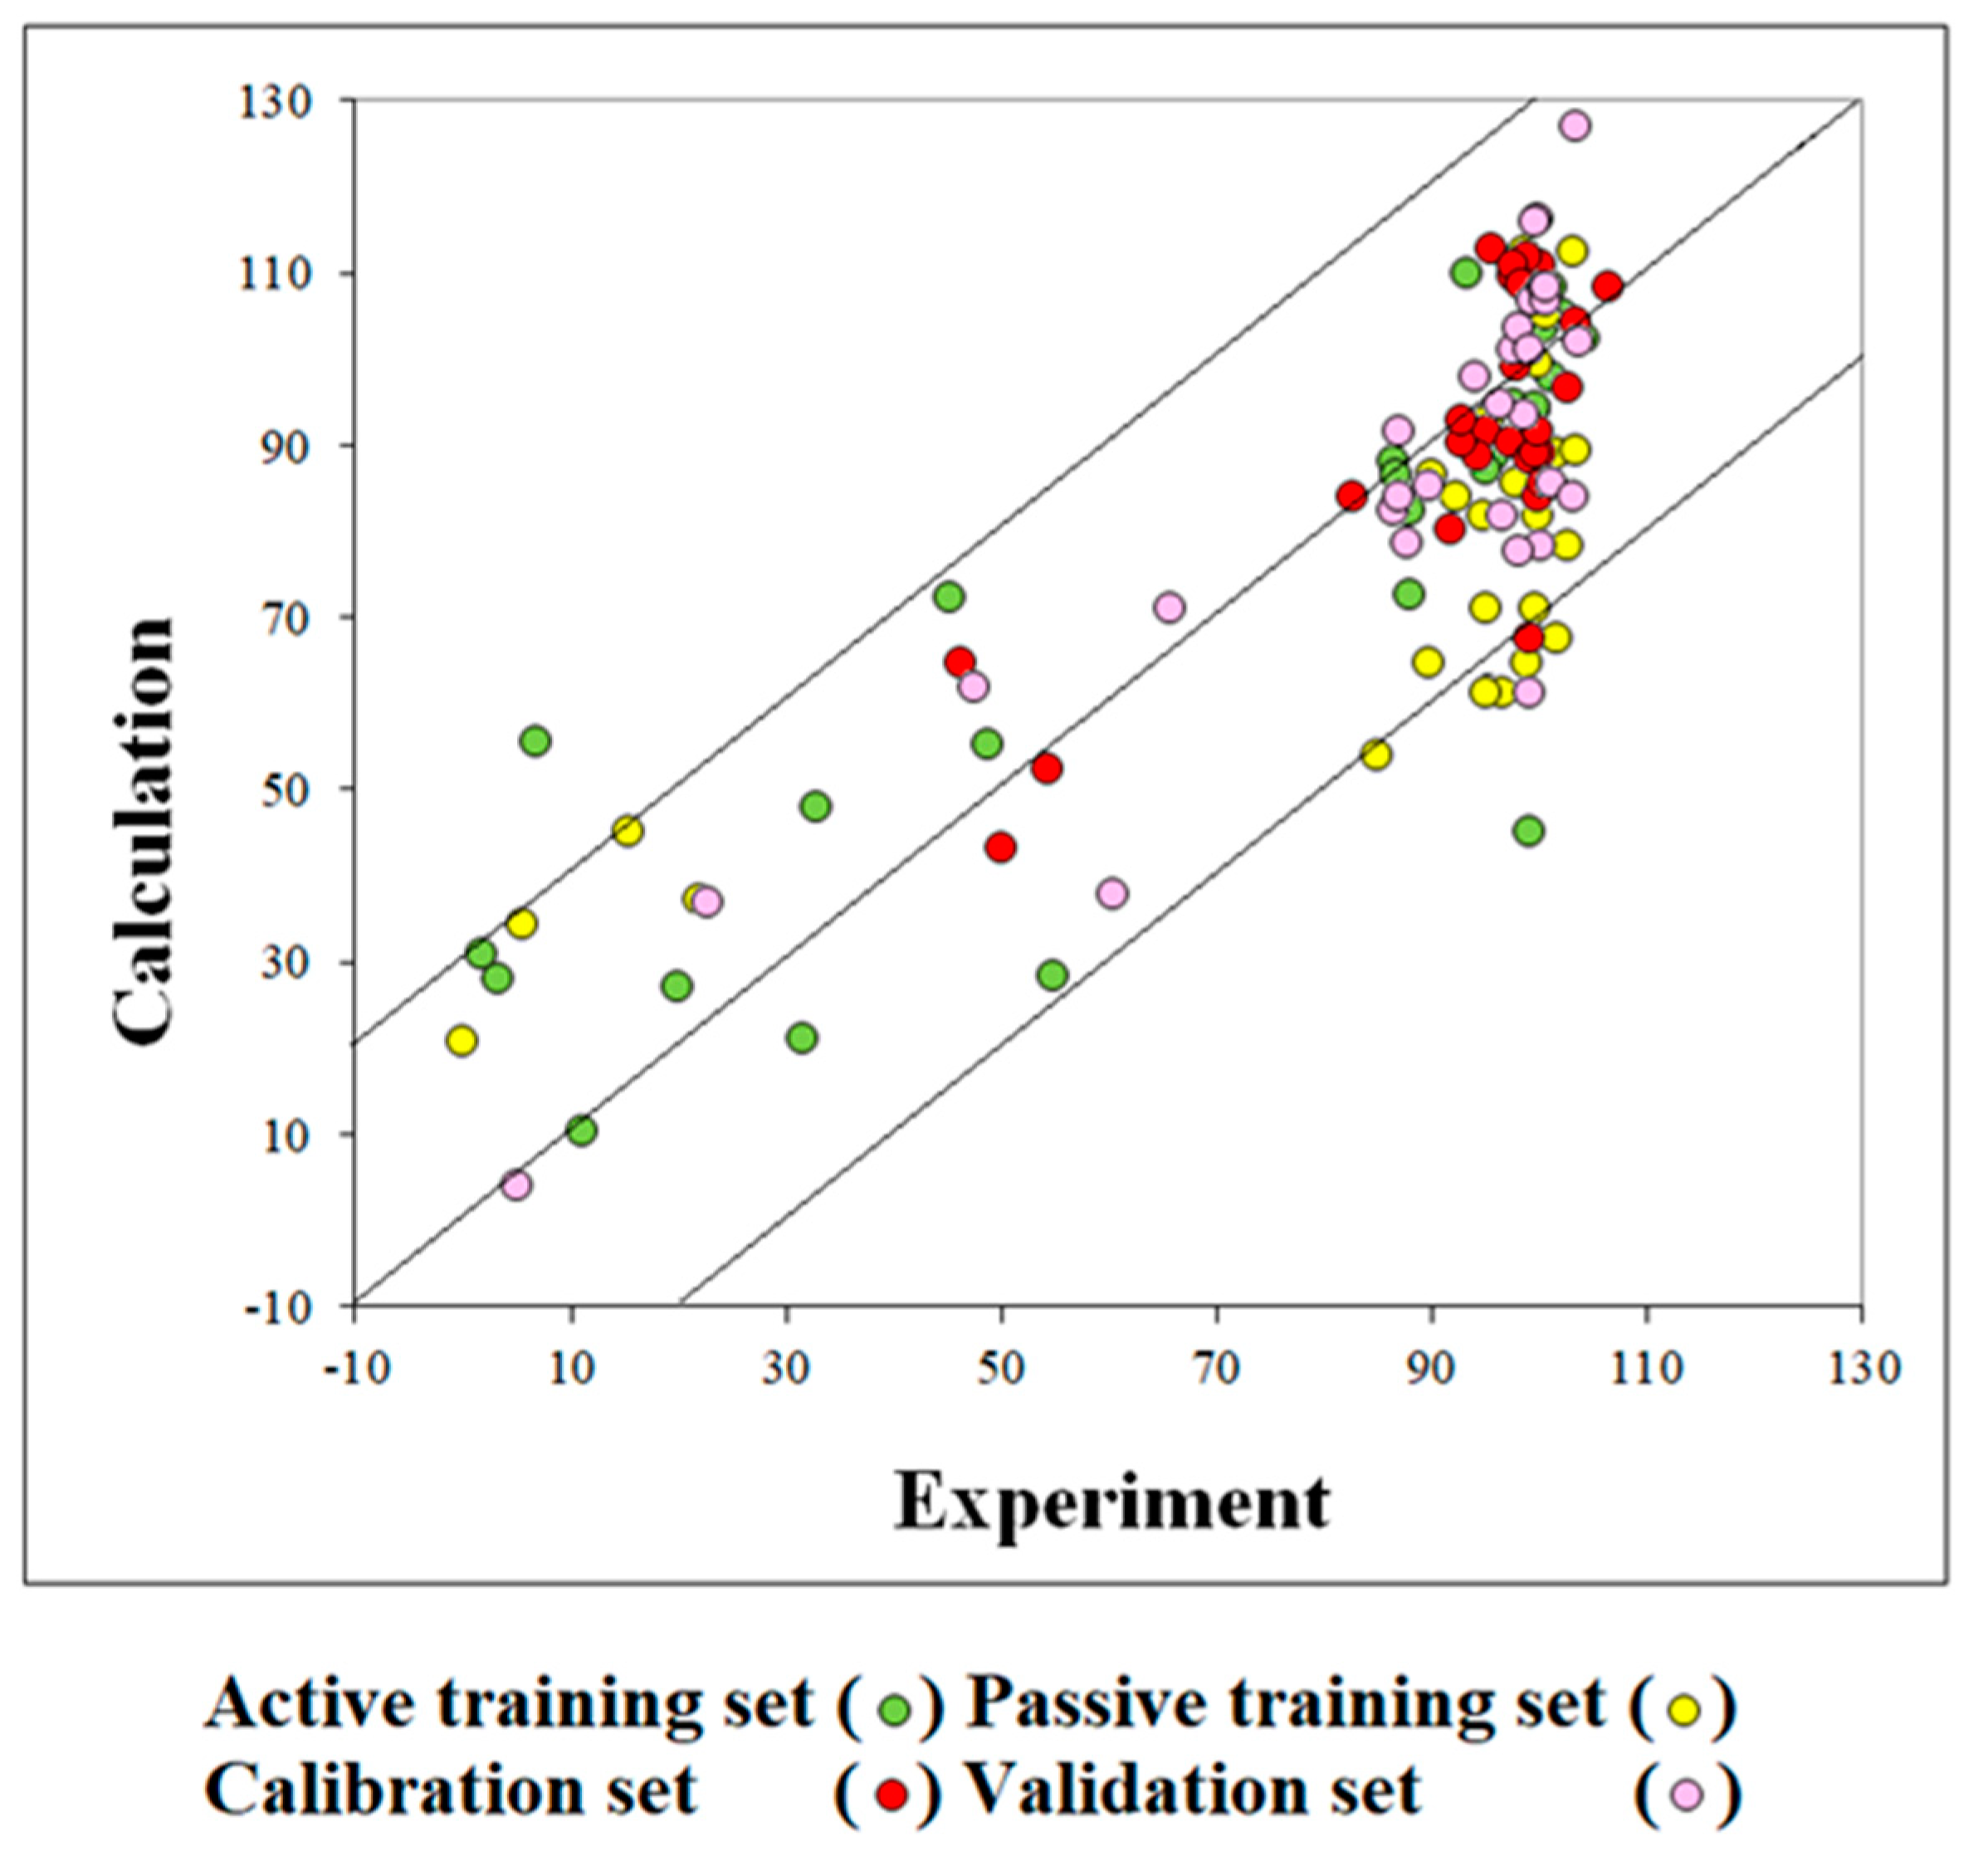
2. Results
2.1. Models
2.2. Mechanistic Interpretation
- I.
- Codes that have a positive value of the correlation weight in all runs. These are promoters of endpoint increase;
- II.
- Codes that have a negative value of the correlation weight in all runs. These are promoters of endpoint decrease;
- III.
- Codes that have both negative and positive values of the correlation weight in different optimization runs. These codes have an unclear role (one cannot classify these features as a promoter of endpoint increase or decrease).
2.3. Applicability Domain
3. Discussion
4. Materials and Methods
4.1. Data
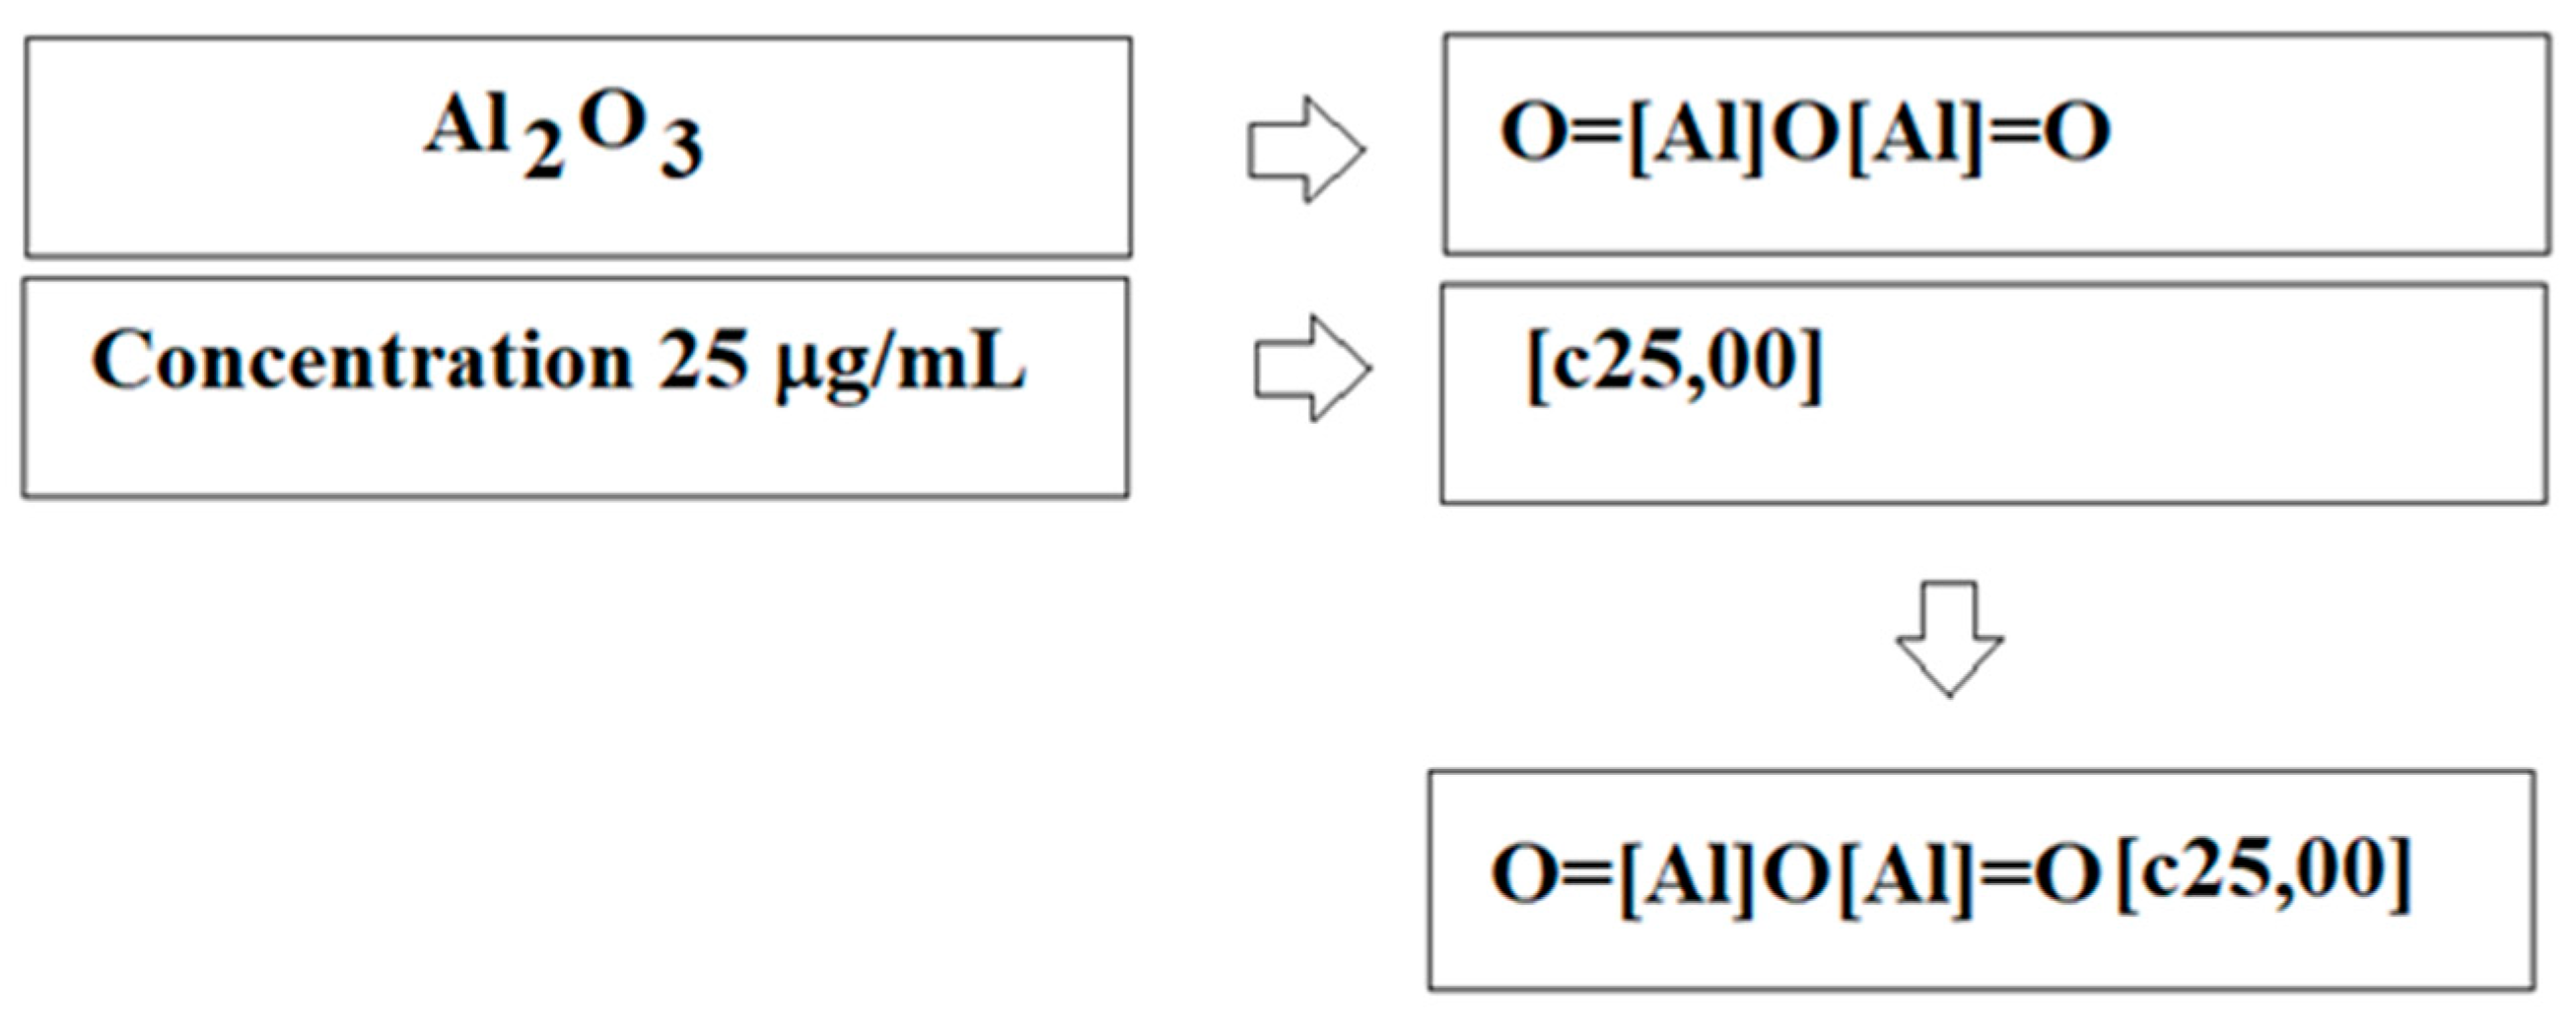
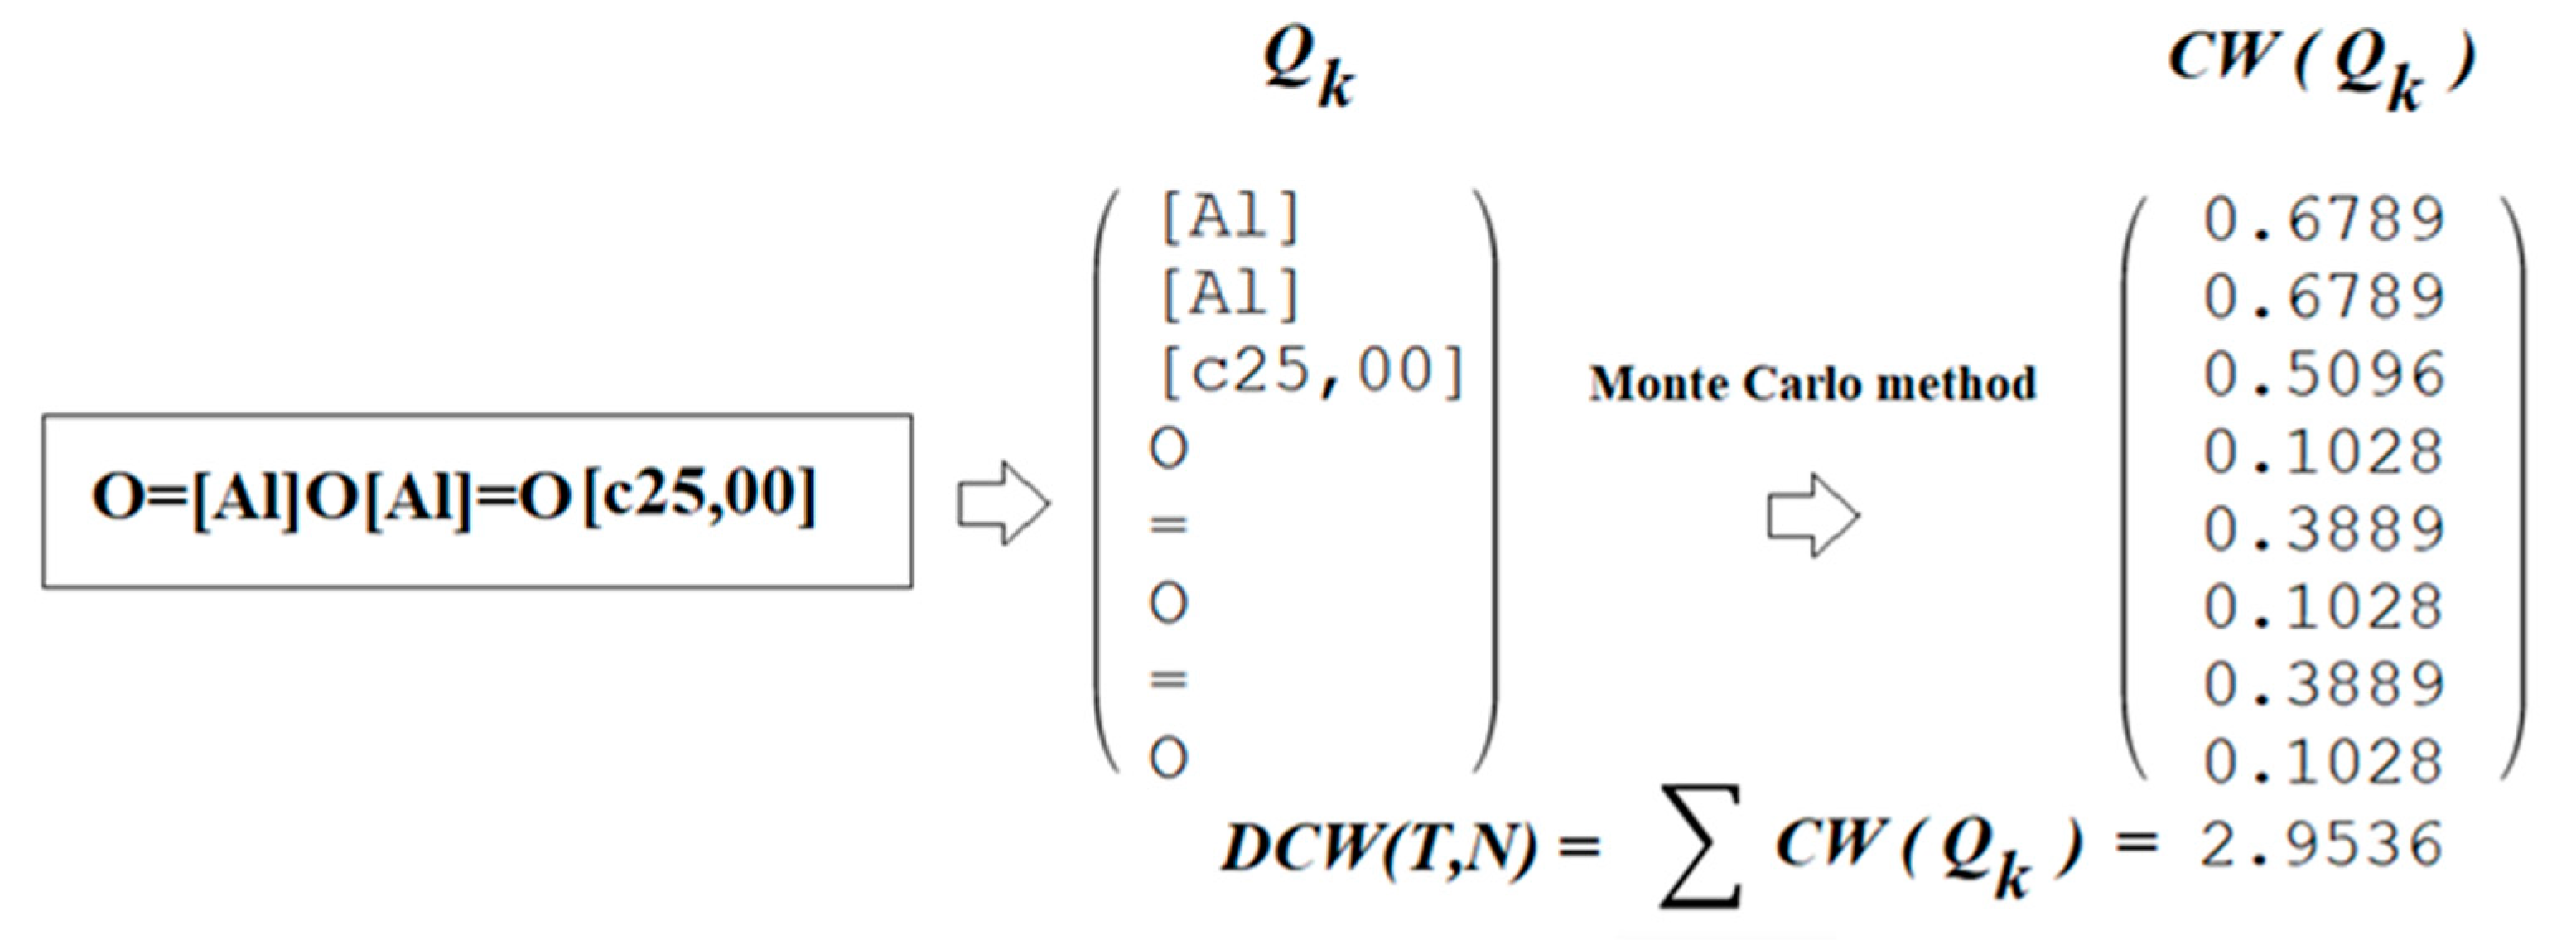
4.2. Optimal Descriptor
4.3. Monte Carlo Method
5. Conclusions
Supplementary Materials
Author Contributions
Funding
Institutional Review Board Statement
Informed Consent Statement
Data Availability Statement
Conflicts of Interest
References
- Toropova, A.P.; Toropov, A.A. Nano-QSAR in cell biology: Model of cell viability as a mathematical function of available eclectic data. J. Theor. Biol. 2017, 416, 113–118. [Google Scholar] [CrossRef]
- Li, J.; Wang, C.; Yue, L.; Chen, F.; Cao, X.; Wang, Z. Nano-QSAR modeling for predicting the cytotoxicity of metallic and metal oxide nanoparticles: A review. Ecotoxicol. Environ. Saf. 2022, 243, 113955. [Google Scholar] [CrossRef]
- Huang, Y.; Li, X.; Cao, J.; Wei, X.; Li, Y.; Wang, Z.; Cai, X.; Li, R.; Chen, J. Use of dissociation degree in lysosomes to predict metal oxide nanoparticle toxicity in immune cells: Machine learning boosts nano-safety assessment. Environ. Int. 2022, 164, 107258. [Google Scholar] [CrossRef] [PubMed]
- Yan, X.; Sedykh, A.; Wang, W.; Yan, B.; Zhu, H. Construction of a web-based nanomaterial database by big data curation and modeling friendly nanostructure annotations. Nat. Commun. 2020, 11, 2519. [Google Scholar] [CrossRef] [PubMed]
- Mills, K.C.; Murry, D.; Guzan, K.A.; Ostraat, M.L. Nanomaterial registry: Database that captures the minimal information about nanomaterial physico-chemical characteristics. J. Nanoparticle Res. 2014, 16, 2219. [Google Scholar] [CrossRef]
- Panneerselvam, S.; Choi, S. Nanoinformatics: Emerging databases and available tools. Int. J. Mol. Sci. 2014, 15, 7158–7182. [Google Scholar] [CrossRef]
- Fourches, D.; Pu, D.; Tassa, C.; Weissleder, R.; Shaw, S.Y.; Mumper, R.J.; Tropsha, A. Quantitative nanostructure-Activity relationship modeling. ACS Nano. 2010, 4, 5703–5712. [Google Scholar] [CrossRef] [PubMed]
- Thomas, D.G.; Gaheen, S.; Harper, S.L.; Fritts, M.; Klaessig, F.; Hahn-Dantona, E.; Paik, D.; Pan, S.; Stafford, G.A.; Freund, E.T.; et al. ISA-TAB-Nano: A Specification for Sharing Nanomaterial Research Data in Spreadsheet-based Format. BMC Biotechnol. 2013, 13, 2. [Google Scholar] [CrossRef]
- Gajewicz, A.; Jagiello, K.; Cronin, M.T.D.; Leszczynski, J.; Puzyn, T. Addressing a bottle neck for regulation of nanomaterials: Quantitative read-across (Nano-QRA) algorithm for cases when only limited data is available. Environ. Sci. Nano 2017, 4, 346–358. [Google Scholar] [CrossRef]
- Krug, H.F. Collection of Controlled Nanosafety Data—The CoCoN-Database, a Tool to Assess Nanomaterial Hazard. Nanomaterials 2022, 12, 441. [Google Scholar] [CrossRef] [PubMed]
- Jimenez-Cruz, C.A.; Kang, S.-g.; Zhou, R. Large scale molecular simulations of nanotoxicity. WIREs Syst. Biol. Med. 2014, 6, 329–343. [Google Scholar] [CrossRef] [PubMed]
- Toropova, A.P.; Toropov, A.A.; Veselinović, A.M.; Veselinović, J.B.; Benfenati, E.; Leszczynska, D.; Leszczynski, J. Nano-QSAR: Model of mutagenicity of fullerene as a mathematical function of different conditions. Ecotoxicol. Environ. Saf. 2016, 124, 32–36. [Google Scholar] [CrossRef] [PubMed]
- Piane, M.D.; Potthoff, S.; Brinker, C.J.; Colombi Ciacchi, L. Molecular Dynamics Simulations of the Silica-Cell Membrane Interaction: Insights on Biomineralization and Nanotoxicity. J. Phys. Chem. C 2018, 122, 21330–21343. [Google Scholar] [CrossRef]
- Buglak, A.A.; Zherdev, A.V.; Dzantiev, B.B. Nano-(Q)SAR for Cytotoxicity Prediction of Engineered Nanomaterials. Molecules 2019, 24, 4537. [Google Scholar] [CrossRef] [PubMed]
- González-Durruthy, M.; Giri, A.K.; Moreira, I.; Concu, R.; Melo, A.; Ruso, J.M.; Cordeiro, M.N.D.S. Computational modeling on mitochondrial channel nanotoxicity. Nano Today 2020, 34, 100913. [Google Scholar] [CrossRef]
- Toropova, A.P.; Toropov, A.A. Fullerenes C60 and C70: A model for solubility by applying the correlation intensity index. Fuller. Nanotub. Carbon Nanostruct. 2020, 28, 900–906. [Google Scholar] [CrossRef]
- Wu, Y.-H.; Ho, S.-Y.; Wang, B.-J.; Wang, Y.-J. The recent progress in nanotoxicology and nanosafety from the point of view of both toxicology and ecotoxicology. Int. J. Mol. Sci. 2020, 21, 4209. [Google Scholar] [CrossRef]
- Mukhopadhyay, T.K.; Ghosh, A.; Datta, A. Molecular Dynamics Simulations Reveal Orientation-Dependent Nanotoxicity of Black Phosphorene toward Dimeric Proteins. ACS Appl. Nano Mater. 2021, 4, 3095–3107. [Google Scholar] [CrossRef]
- Huang, H.-J.; Lee, Y.-H.; Hsu, Y.-H.; Liao, C.-T.; Lin, Y.-F.; Chiu, H.-W. Current strategies in assessment of nanotoxicity: Alternatives to in vivo animal testing. Int. J. Mol. Sci. 2021, 22, 4216. [Google Scholar] [CrossRef]
- Tsukanov, A.A.; Turk, B.; Vasiljeva, O.; Psakhie, S.G. Computational Indicator Approach for Assessment of Nanotoxicity of Two-Dimensional Nanomaterials. Nanomaterials 2022, 12, 650. [Google Scholar] [CrossRef]
- Thwala, M.M.; Afantitis, A.; Papadiamantis, A.G.; Tsoumanis, A.; Melagraki, G.; Dlamini, L.N.; Ouma, C.N.M.; Ramasami, P.; Harris, R.; Puzyn, T.; et al. Using the Isalos platform to develop a (Q)SAR model that predicts metal oxide toxicity utilizing facet-based electronic, image analysis-based, and periodic table derived properties as descriptors. Struct. Chem. 2022, 33, 527–538. [Google Scholar] [CrossRef]
- Fjodorova, N.; Novič, M.; Venko, K.; Drgan, V.; Rasulev, B.; Türker Saçan, M.; Sağ Erdem, S.; Tugcu, G.; Toropova, A.P.; Toropov, A.A. How fullerene derivatives (FDs) act on therapeutically important targets associated with diabetic diseases. Comput. Struct. Biotechnol. J. 2022, 20, 913–924. [Google Scholar] [CrossRef] [PubMed]
- Ahmadi, S.; Aghabeygi, S.; Farahmandjou, M.; Azimi, N. The predictive model for band gap prediction of metal oxide nanoparticles based on quasi-SMILES. Struct. Chem. 2021, 32, 1893–1905. [Google Scholar] [CrossRef]
- Ahmadi, S. Mathematical modeling of cytotoxicity of metal oxide nanoparticles using the index of ideality correlation criteria. Chemosphere 2020, 242, 125192. [Google Scholar] [CrossRef] [PubMed]
- Trinh, T.X.; Choi, J.-S.; Jeon, H.; Byun, H.-G.; Yoon, T.-H.; Kim, J. Quasi-SMILES-Based Nano-Quantitative Structure-Activity Relationship Model to Predict the Cytotoxicity of Multiwalled Carbon Nanotubes to Human Lung Cells. Chem. Res. Toxicol. 2018, 31, 183–190. [Google Scholar] [CrossRef] [PubMed]
- Choi, J.-S.; Ha, M.K.; Trinh, T.X.; Yoon, T.-H.; Byun, H.-G. Towards a generalized toxicity prediction model for oxide nanomaterials using integrated data from different sources. Sci. Rep. 2018, 8, 6110. [Google Scholar] [CrossRef]
- Choi, J.-S.; Trinh, T.X.; Yoon, T.-H.; Kim, J.; Byun, H.-G. Quasi-QSAR for predicting the cell viability of human lung and skin cells exposed to different metal oxide nanomaterials. Chemosphere 2019, 217, 243–249. [Google Scholar] [CrossRef]
- Toropova, A.P.; Toropov, A.A. Optimal descriptor as a translator of eclectic information into the prediction of membrane damage by means of various TiO2 nanoparticles. Chemosphere 2013, 93, 2650–2655. [Google Scholar] [CrossRef]
- Toropov, A.A.; Toropova, A.P. Optimal descriptor as a translator of eclectic data into endpoint prediction: Mutagenicity of fullerene as a mathematical function of conditions. Chemosphere 2014, 104, 262–264. [Google Scholar] [CrossRef]
- Jafari, K.; Fatemi, M.H. A new approach to model isobaric heat capacity and density of some nitride-based nanofluids using Monte Carlo method. Adv. Powder Technol. 2020, 31, 3018–3027. [Google Scholar] [CrossRef]
- Jafari, K.; Fatemi, M.H. Application of nano-quantitative structure–property relationship paradigm to develop predictive models for thermal conductivity of metal oxide-based ethylene glycol nanofluids. J. Therm. Anal. Calorim. 2020, 142, 1335–1344. [Google Scholar] [CrossRef]
- Manganelli, S.; Benfenati, E. Nano-QSAR model for predicting cell viability of human embryonic kidney cells. In Cell Viability Assays. Methods in Molecular Biology; Gilbert, D., Friedrich, O., Eds.; Humana Press: New York, NY, USA, 2017; Volume 1601, pp. 275–290. [Google Scholar] [CrossRef]
- Toropova, A.P.; Toropov, A.A. Does the Index of Ideality of Correlation Detect the Better Model Correctly? Mol. Inform. 2019, 38, 1800157. [Google Scholar] [CrossRef] [PubMed]
- Toropova, A.P.; Toropov, A.A. QSPR and nano-QSPR: What is the difference? J. Mol. Struct. 2019, 1182, 141–149. [Google Scholar] [CrossRef]
- Toropova, A.P.; Toropov, A.A.; Benfenati, E. QSPR as a random event: Solubility of fullerenes C [60] and C [70]. Fuller. Nanotub. Carbon Nanostruct. 2019, 27, 816–821. [Google Scholar] [CrossRef]
- Toropov, A.A.; Kjeldsen, F.; Toropova, A.P. Use of quasi-SMILES to build models based on quantitative results from experiments with nanomaterials. Chemosphere 2022, 303, 135086. [Google Scholar] [CrossRef]
- Toropova, A.P.; Toropov, A.A.; Fjodorova, N. Quasi-SMILES for predicting toxicity of Nano-mixtures to Daphnia Magna. NanoImpact 2022, 28, 100427. [Google Scholar] [CrossRef]
- Toropov, A.A.; Toropova, A.P. Correlation intensity index: Building up models for mutagenicity of silver nanoparticles. Sci. Total Environ. 2020, 737, 139720. [Google Scholar] [CrossRef]
- Selvestrel, G.; Lavado, G.J.; Toropova, A.P.; Toropov, A.A.; Gadaleta, D.; Marzo, M.; Baderna, D.; Benfenati, E. Monte Carlo Models for Sub-Chronic Repeated-Dose Toxicity: Systemic and Organ-Specific Toxicity. Int. J. Mol. Sci. 2022, 23, 6615. [Google Scholar] [CrossRef]


| Set * | n | R2 | CCC | IIC | CII | Q2 | RMSE | F | |
|---|---|---|---|---|---|---|---|---|---|
| Split1 | A | 29 | 0.7094 | 0.8300 | 0.6843 | 0.8115 | 0.6683 | 19.6 | 66 |
| NCW = 25 | P | 31 | 0.6104 | 0.6880 | 0.7323 | 0.7830 | 0.5186 | 21.5 | 45 |
| C | 29 | 0.5656 | 0.7312 | 0.7500 | 0.7744 | 0.4437 | 12.9 | 35 | |
| V | 31 | 0.7226 | - | - | - | - | 13.7 | ||
| Split2 | A | 32 | 0.7602 | 0.8638 | 0.6782 | 0.8582 | 0.7179 | 17.6 | 95 |
| NCW = 28 | P | 30 | 0.6793 | 0.7287 | 0.4444 | 0.8133 | 0.4913 | 16.2 | 59 |
| C | 29 | 0.5281 | 0.6999 | 0.7261 | 0.8126 | 0.4225 | 14.5 | 30 | |
| V | 29 | 0.8541 | - | - | - | - | 14.3 | ||
| Split3 | A | 29 | 0.7751 | 0.8733 | 0.7153 | 0.8868 | 0.7434 | 18.1 | 93 |
| NCW = 27 | P | 31 | 0.6325 | 0.6949 | 0.6134 | 0.7897 | 0.5575 | 23.2 | 50 |
| C | 29 | 0.5639 | 0.5557 | 0.7509 | 0.8253 | 0.3264 | 13.5 | 35 | |
| V | 31 | 0.7790 | - | - | - | - | 10.9 | ||
| Split4 | A | 31 | 0.7035 | 0.8260 | 0.6907 | 0.8278 | 0.6678 | 21.5 | 69 |
| NCW = 27 | P | 28 | 0.7345 | 0.1563 | 0.0408 | 0.8449 | 0.6879 | 31.8 | 72 |
| C | 31 | 0.6849 | 0.8205 | 0.8275 | 0.8654 | 0.6012 | 12.6 | 63 | |
| V | 30 | 0.7801 | - | - | - | - | 15.5 | ||
| Split5 | A | 29 | 0.7065 | 0.8280 | 0.6829 | 0.8274 | 0.6571 | 18.9 | 65 |
| NCW = 28 | P | 29 | 0.8444 | 0.7829 | 0.6637 | 0.9040 | 0.8239 | 20.9 | 146 |
| C | 31 | 0.6057 | 0.6661 | 0.7779 | 0.8176 | 0.2765 | 11.8 | 45 | |
| V | 31 | 0.8964 | - | - | - | - | 7.0 |
| Split1 | Split2 | Split3 | Split4 | Split5 | |
|---|---|---|---|---|---|
| [Mn] | |||||
| [Co] | |||||
| [Cu] | - | - | - | ||
| [Zn] | - | - | - | - | |
| [c200,00] | - | - | - |
| Set | ID | Quasi-SMILES | Experiment (%) | Calculation (%) |
|---|---|---|---|---|
| C | 1 | O=[Al]O[Al]=O[c25,00] | 102.7800 | 134.3224 |
| V | 2 | O=[Al]O[Al]=O[c50,00] | 103.4400 | 126.9137 |
| V | 3 | O=[Al]O[Al]=O[c100,00] | 99.8800 | 116.2402 |
| A | 4 | O=[Al]O[Al]=O[c200,00] | 93.2600 | 109.9123 |
| P | 5 | O=[Bi]O[Bi]=O[c25,00] | 98.6300 | 112.2648 |
| A | 6 | O=[Bi]O[Bi]=O[c50,00] | 100.7300 | 104.8562 |
| A | 7 | O=[Bi]O[Bi]=O[c100,00] | 99.6300 | 94.1827 |
| A | 8 | O=[Bi]O[Bi]=O[c200,00] | 100.2600 | 87.8548 |
| P | 9 | O=[Ge]=O[c25,00] | 97.8300 | 85.6033 |
| P | 10 | O=[Ge]=O[c50,00] | 100.1900 | 78.1946 |
| P | 11 | O=[Ge]=O[c100,00] | 99.5000 | 67.5211 |
| P | 12 | O=[Ge]=O[c200,00] | 96.7000 | 61.1932 |
| C | 13 | [Co]=O[c25,00] | 54.4100 | 52.4457 |
| P | 14 | [Co]=O[c50,00] | 15.5500 | 45.0370 |
| P | 15 | [Co]=O[c100,00] | 5.6600 | 34.3635 |
| A | 16 | [Co]=O[c200,00] | 3.2600 | 28.0356 |
| A | 17 | [Co]=O.O=[Co]O[Co]=O[c25,00] | 95.4400 | 61.3872 |
| P | 18 | [Co]=O.O=[Co]O[Co]=O[c50,00] | 84.9300 | 53.9786 |
| C | 19 | [Co]=O.O=[Co]O[Co]=O[c100,00] | 49.9600 | 43.3051 |
| V | 20 | [Co]=O.O=[Co]O[Co]=O[c200,00] | 22.6500 | 36.9772 |
| P | 21 | O=[Cr]O[Cr]=O[c25,00] | 101.7700 | 89.0326 |
| P | 22 | O=[Cr]O[Cr]=O[c50,00] | 94.8500 | 81.6240 |
| V | 23 | O=[Cr]O[Cr]=O[c100,00] | 65.8100 | 70.9505 |
| C | 24 | O=[Cr]O[Cr]=O[c200,00] | 46.3600 | 64.6226 |
| A | 25 | [Cu]=O[c25,00] | 99.1700 | 45.0965 |
| V | 26 | [Cu]=O[c50,00] | 60.4100 | 37.6879 |
| A | 27 | [Cu]=O[c100,00] | 19.8700 | 27.0144 |
| P | 28 | [Cu]=O[c200,00] | 0.1000 | 20.6865 |
| C | 29 | O=[Dy]O[Dy]=O[c25,00] | 97.6000 | 109.6235 |
| A | 30 | O=[Dy]O[Dy]=O[c50,00] | 104.1500 | 102.2148 |
| C | 31 | O=[Dy]O[Dy]=O[c100,00] | 95.0600 | 91.5413 |
| V | 32 | O=[Dy]O[Dy]=O[c200,00] | 89.7000 | 85.2134 |
| C | 33 | O=[Er]O[Er]=O[c25,00] | 100.1600 | 89.0326 |
| V | 34 | O=[Er]O[Er]=O[c50,00] | 96.5800 | 81.6240 |
| P | 35 | O=[Er]O[Er]=O[c100,00] | 95.1000 | 70.9505 |
| P | 36 | O=[Er]O[Er]=O[c200,00] | 89.7400 | 64.6226 |
| V | 37 | O=[Eu]O[Eu]=O[c25,00] | 99.4800 | 106.8651 |
| P | 38 | O=[Eu]O[Eu]=O[c50,00] | 99.9800 | 99.4564 |
| A | 39 | O=[Eu]O[Eu]=O[c100,00] | 95.7800 | 88.7829 |
| V | 40 | O=[Eu]O[Eu]=O[c200,00] | 86.5300 | 82.4550 |
| C | 41 | [Fe+3].[Fe+3].[O-2].[O-2].[O-2][c25,00] | 99.9200 | 108.3871 |
| C | 42 | [Fe+3].[Fe+3].[O-2].[O-2].[O-2][c50,00] | 98.8800 | 100.9784 |
| C | 43 | [Fe+3].[Fe+3].[O-2].[O-2].[O-2][c100,00] | 97.3700 | 90.3049 |
| C | 44 | [Fe+3].[Fe+3].[O-2].[O-2].[O-2][c200,00] | 99.9200 | 83.9770 |
| C | 45 | [Fe]=O.O=[Fe]O[Fe]=O[c25,00] | 95.6700 | 112.7077 |
| P | 46 | [Fe]=O.O=[Fe]O[Fe]=O[c50,00] | 100.6200 | 105.2991 |
| A | 47 | [Fe]=O.O=[Fe]O[Fe]=O[c100,00] | 97.5800 | 94.6256 |
| C | 48 | [Fe]=O.O=[Fe]O[Fe]=O[c200,00] | 99.0300 | 88.2977 |
| V | 49 | [Gd+3].[Gd+3].[O-2].[O-2].[O-2][c25,00] | 100.3700 | 108.3871 |
| V | 50 | [Gd+3].[Gd+3].[O-2].[O-2].[O-2][c50,00] | 98.1200 | 100.9784 |
| P | 51 | [Gd+3].[Gd+3].[O-2].[O-2].[O-2][c100,00] | 94.3400 | 90.3049 |
| V | 52 | [Gd+3].[Gd+3].[O-2].[O-2].[O-2][c200,00] | 86.9100 | 83.9770 |
| C | 53 | O=[Hf]=O[c25,00] | 100.2900 | 85.6033 |
| P | 54 | O=[Hf]=O[c50,00] | 102.6100 | 78.1946 |
| P | 55 | O=[Hf]=O[c100,00] | 101.7900 | 67.5211 |
| P | 56 | O=[Hf]=O[c200,00] | 95.0000 | 61.1932 |
| V | 57 | [In+3].[In+3].[O-2].[O-2].[O-2][c25,00] | 100.6200 | 106.6455 |
| C | 58 | [In+3].[In+3].[O-2].[O-2].[O-2][c50,00] | 97.9200 | 99.2368 |
| C | 59 | [In+3].[In+3].[O-2].[O-2].[O-2][c100,00] | 94.2200 | 88.5633 |
| A | 60 | [In+3].[In+3].[O-2].[O-2].[O-2][c200,00] | 87.9600 | 82.2354 |
| V | 61 | [La+3].[La+3].[O-2].[O-2].[O-2][c25,00] | 100.7500 | 108.3871 |
| V | 62 | [La+3].[La+3].[O-2].[O-2].[O-2][c50,00] | 97.5400 | 100.9784 |
| C | 63 | [La+3].[La+3].[O-2].[O-2].[O-2][c100,00] | 92.7000 | 90.3049 |
| C | 64 | [La+3].[La+3].[O-2].[O-2].[O-2][c200,00] | 82.8000 | 83.9770 |
| A | 65 | O=[Mn]=O[c25,00] | 48.8900 | 55.2509 |
| A | 66 | O=[Mn]=O[c50,00] | 32.7700 | 47.8423 |
| P | 67 | O=[Mn]=O[c100,00] | 22.0400 | 37.1688 |
| A | 68 | O=[Mn]=O[c200,00] | 1.7500 | 30.8409 |
| A | 69 | O=[Mn]O[Mn]=O[c25,00] | 54.9500 | 28.3280 |
| A | 70 | O=[Mn]O[Mn]=O[c50,00] | 31.5800 | 20.9193 |
| A | 71 | O=[Mn]O[Mn]=O[c100,00] | 11.1200 | 10.2458 |
| V | 72 | O=[Mn]O[Mn]=O[c200,00] | 5.1400 | 3.9179 |
| C | 73 | O=[Nd]O[Nd]=O[c25,00] | 100.2400 | 110.9428 |
| A | 74 | O=[Nd]O[Nd]=O[c50,00] | 100.3200 | 103.5342 |
| P | 75 | O=[Nd]O[Nd]=O[c100,00] | 95.3200 | 92.8607 |
| P | 76 | O=[Nd]O[Nd]=O[c200,00] | 89.9300 | 86.5328 |
| P | 77 | [O-2].[Ni+2][c25,00] | 103.3200 | 112.4964 |
| A | 78 | [O-2].[Ni+2][c50,00] | 102.3000 | 105.0877 |
| A | 79 | [O-2].[Ni+2][c100,00] | 99.7700 | 94.4142 |
| A | 80 | [O-2].[Ni+2][c200,00] | 86.6000 | 88.0863 |
| C | 81 | [Ni+3].[Ni+3].[O-2].[O-2].[O-2][c25,00] | 102.7800 | 96.5984 |
| P | 82 | [Ni+3].[Ni+3].[O-2].[O-2].[O-2][c50,00] | 103.4400 | 89.1897 |
| V | 83 | [Ni+3].[Ni+3].[O-2].[O-2].[O-2][c100,00] | 87.7500 | 78.5162 |
| A | 84 | [Ni+3].[Ni+3].[O-2].[O-2].[O-2][c200,00] | 45.3300 | 72.1883 |
| C | 85 | O=[Sb]O[Sb]=O[c25,00] | 99.7200 | 89.0326 |
| P | 86 | O=[Sb]O[Sb]=O[c50,00] | 99.9100 | 81.6240 |
| P | 87 | O=[Sb]O[Sb]=O[c100,00] | 99.6800 | 70.9505 |
| P | 88 | O=[Sb]O[Sb]=O[c200,00] | 98.8300 | 64.6226 |
| V | 89 | O=[Sm]O[Sm]=O[c25,00] | 99.6700 | 115.8481 |
| A | 90 | O=[Sm]O[Sm]=O[c50,00] | 101.1200 | 108.4395 |
| V | 91 | O=[Sm]O[Sm]=O[c100,00] | 94.0300 | 97.7660 |
| V | 92 | O=[Sm]O[Sm]=O[c200,00] | 86.9700 | 91.4381 |
| C | 93 | O=[Sn]=O[c25,00] | 98.8000 | 111.6224 |
| C | 94 | O=[Sn]=O[c50,00] | 103.5400 | 104.2137 |
| V | 95 | O=[Sn]=O[c100,00] | 98.7200 | 93.5402 |
| A | 96 | O=[Sn]=O[c200,00] | 95.1500 | 87.2123 |
| V | 97 | O=[Ti]=O[c25,00] | 101.2200 | 85.6033 |
| V | 98 | O=[Ti]=O[c50,00] | 100.2700 | 78.1946 |
| C | 99 | O=[Ti]=O[c100,00] | 99.2700 | 67.5211 |
| V | 100 | O=[Ti]=O[c200,00] | 99.2300 | 61.1932 |
| V | 101 | O=[W](=O)=O[c25,00] | 103.8200 | 102.0069 |
| V | 102 | O=[W](=O)=O[c50,00] | 96.3200 | 94.5982 |
| V | 103 | O=[W](=O)=O[c100,00] | 103.3000 | 83.9248 |
| V | 104 | O=[W](=O)=O[c200,00] | 98.2600 | 77.5969 |
| C | 105 | O=[Y]O[Y]=O[c25,00] | 97.7000 | 110.9296 |
| V | 106 | O=[Y]O[Y]=O[c50,00] | 98.1200 | 103.5209 |
| C | 107 | O=[Y]O[Y]=O[c100,00] | 92.8300 | 92.8474 |
| A | 108 | O=[Y]O[Y]=O[c200,00] | 86.7300 | 86.5195 |
| C | 109 | [O-2].[O-2].[O-2].[Yb+3].[Yb+3][c25,00] | 106.5900 | 108.3871 |
| V | 110 | [O-2].[O-2].[O-2].[Yb+3].[Yb+3][c50,00] | 99.1900 | 100.9784 |
| P | 111 | [O-2].[O-2].[O-2].[Yb+3].[Yb+3][c100,00] | 99.4400 | 90.3049 |
| P | 112 | [O-2].[O-2].[O-2].[Yb+3].[Yb+3][c200,00] | 92.3800 | 83.9770 |
| P | 113 | [Zn]=O[c25,00] | 91.8300 | 80.0461 |
| A | 114 | [Zn]=O[c50,00] | 87.9600 | 72.6374 |
| V | 115 | [Zn]=O[c100,00] | 47.6400 | 61.9639 |
| A | 116 | [Zn]=O[c200,00] | 6.7600 | 55.6360 |
| C | 117 | O=[Zr]=O[c25,00] | 99.6500 | 115.9612 |
| C | 118 | O=[Zr]=O[c50,00] | 98.4900 | 108.5525 |
| A | 119 | O=[Zr]=O[c100,00] | 101.0700 | 97.8790 |
| P | 120 | O=[Zr]=O[c200,00] | 100.0200 | 91.5511 |
Disclaimer/Publisher’s Note: The statements, opinions and data contained in all publications are solely those of the individual author(s) and contributor(s) and not of MDPI and/or the editor(s). MDPI and/or the editor(s) disclaim responsibility for any injury to people or property resulting from any ideas, methods, instructions or products referred to in the content. |
© 2023 by the authors. Licensee MDPI, Basel, Switzerland. This article is an open access article distributed under the terms and conditions of the Creative Commons Attribution (CC BY) license (https://creativecommons.org/licenses/by/4.0/).
Share and Cite
Toropova, A.P.; Toropov, A.A.; Fjodorova, N. In Silico Simulation of Impacts of Metal Nano-Oxides on Cell Viability in THP-1 Cells Based on the Correlation Weights of the Fragments of Molecular Structures and Codes of Experimental Conditions Represented by Means of Quasi-SMILES. Int. J. Mol. Sci. 2023, 24, 2058. https://doi.org/10.3390/ijms24032058
Toropova AP, Toropov AA, Fjodorova N. In Silico Simulation of Impacts of Metal Nano-Oxides on Cell Viability in THP-1 Cells Based on the Correlation Weights of the Fragments of Molecular Structures and Codes of Experimental Conditions Represented by Means of Quasi-SMILES. International Journal of Molecular Sciences. 2023; 24(3):2058. https://doi.org/10.3390/ijms24032058
Chicago/Turabian StyleToropova, Alla P., Andrey A. Toropov, and Natalja Fjodorova. 2023. "In Silico Simulation of Impacts of Metal Nano-Oxides on Cell Viability in THP-1 Cells Based on the Correlation Weights of the Fragments of Molecular Structures and Codes of Experimental Conditions Represented by Means of Quasi-SMILES" International Journal of Molecular Sciences 24, no. 3: 2058. https://doi.org/10.3390/ijms24032058
APA StyleToropova, A. P., Toropov, A. A., & Fjodorova, N. (2023). In Silico Simulation of Impacts of Metal Nano-Oxides on Cell Viability in THP-1 Cells Based on the Correlation Weights of the Fragments of Molecular Structures and Codes of Experimental Conditions Represented by Means of Quasi-SMILES. International Journal of Molecular Sciences, 24(3), 2058. https://doi.org/10.3390/ijms24032058