
Assessment of the Purity of IMM-H014 and Its Related Substances for the Treatment of Metabolic-Associated Fatty Liver Disease Using Quantitative Nuclear Magnetic Resonance Spectroscopy
 , , , ,
Abstract
: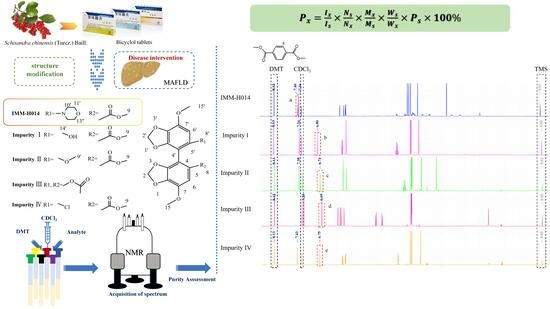
1. Introduction
2. Results and Discussion
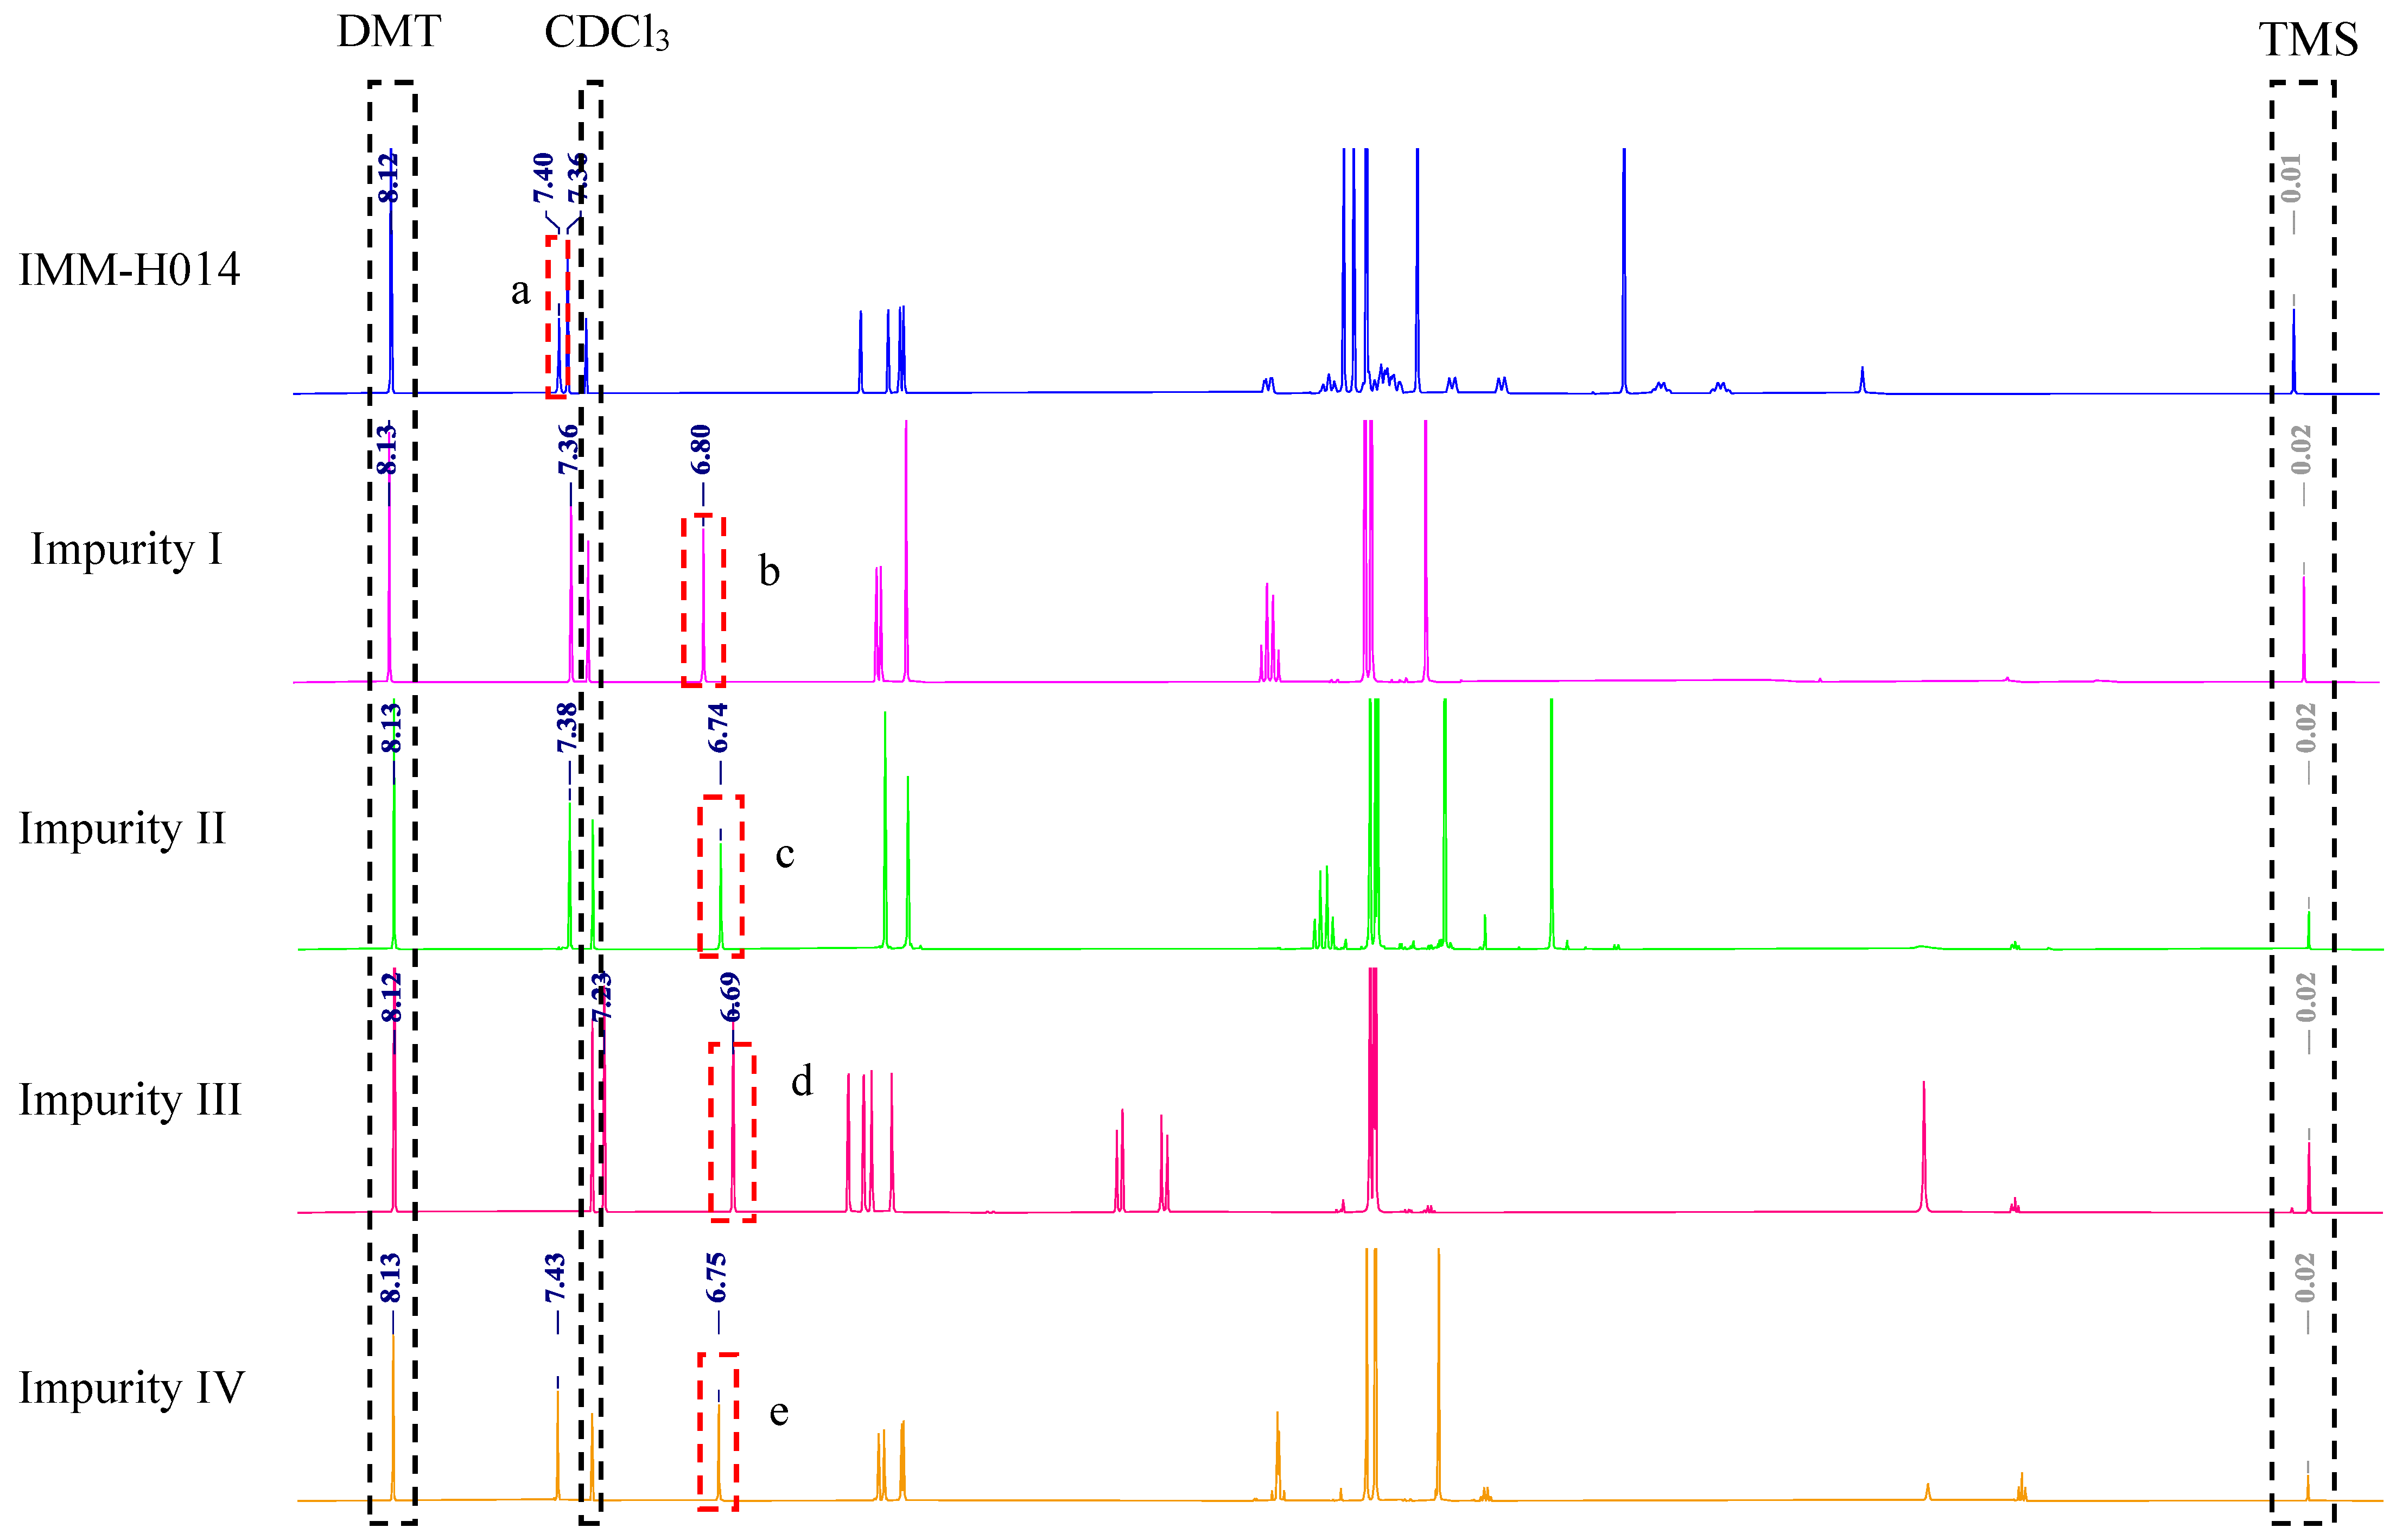
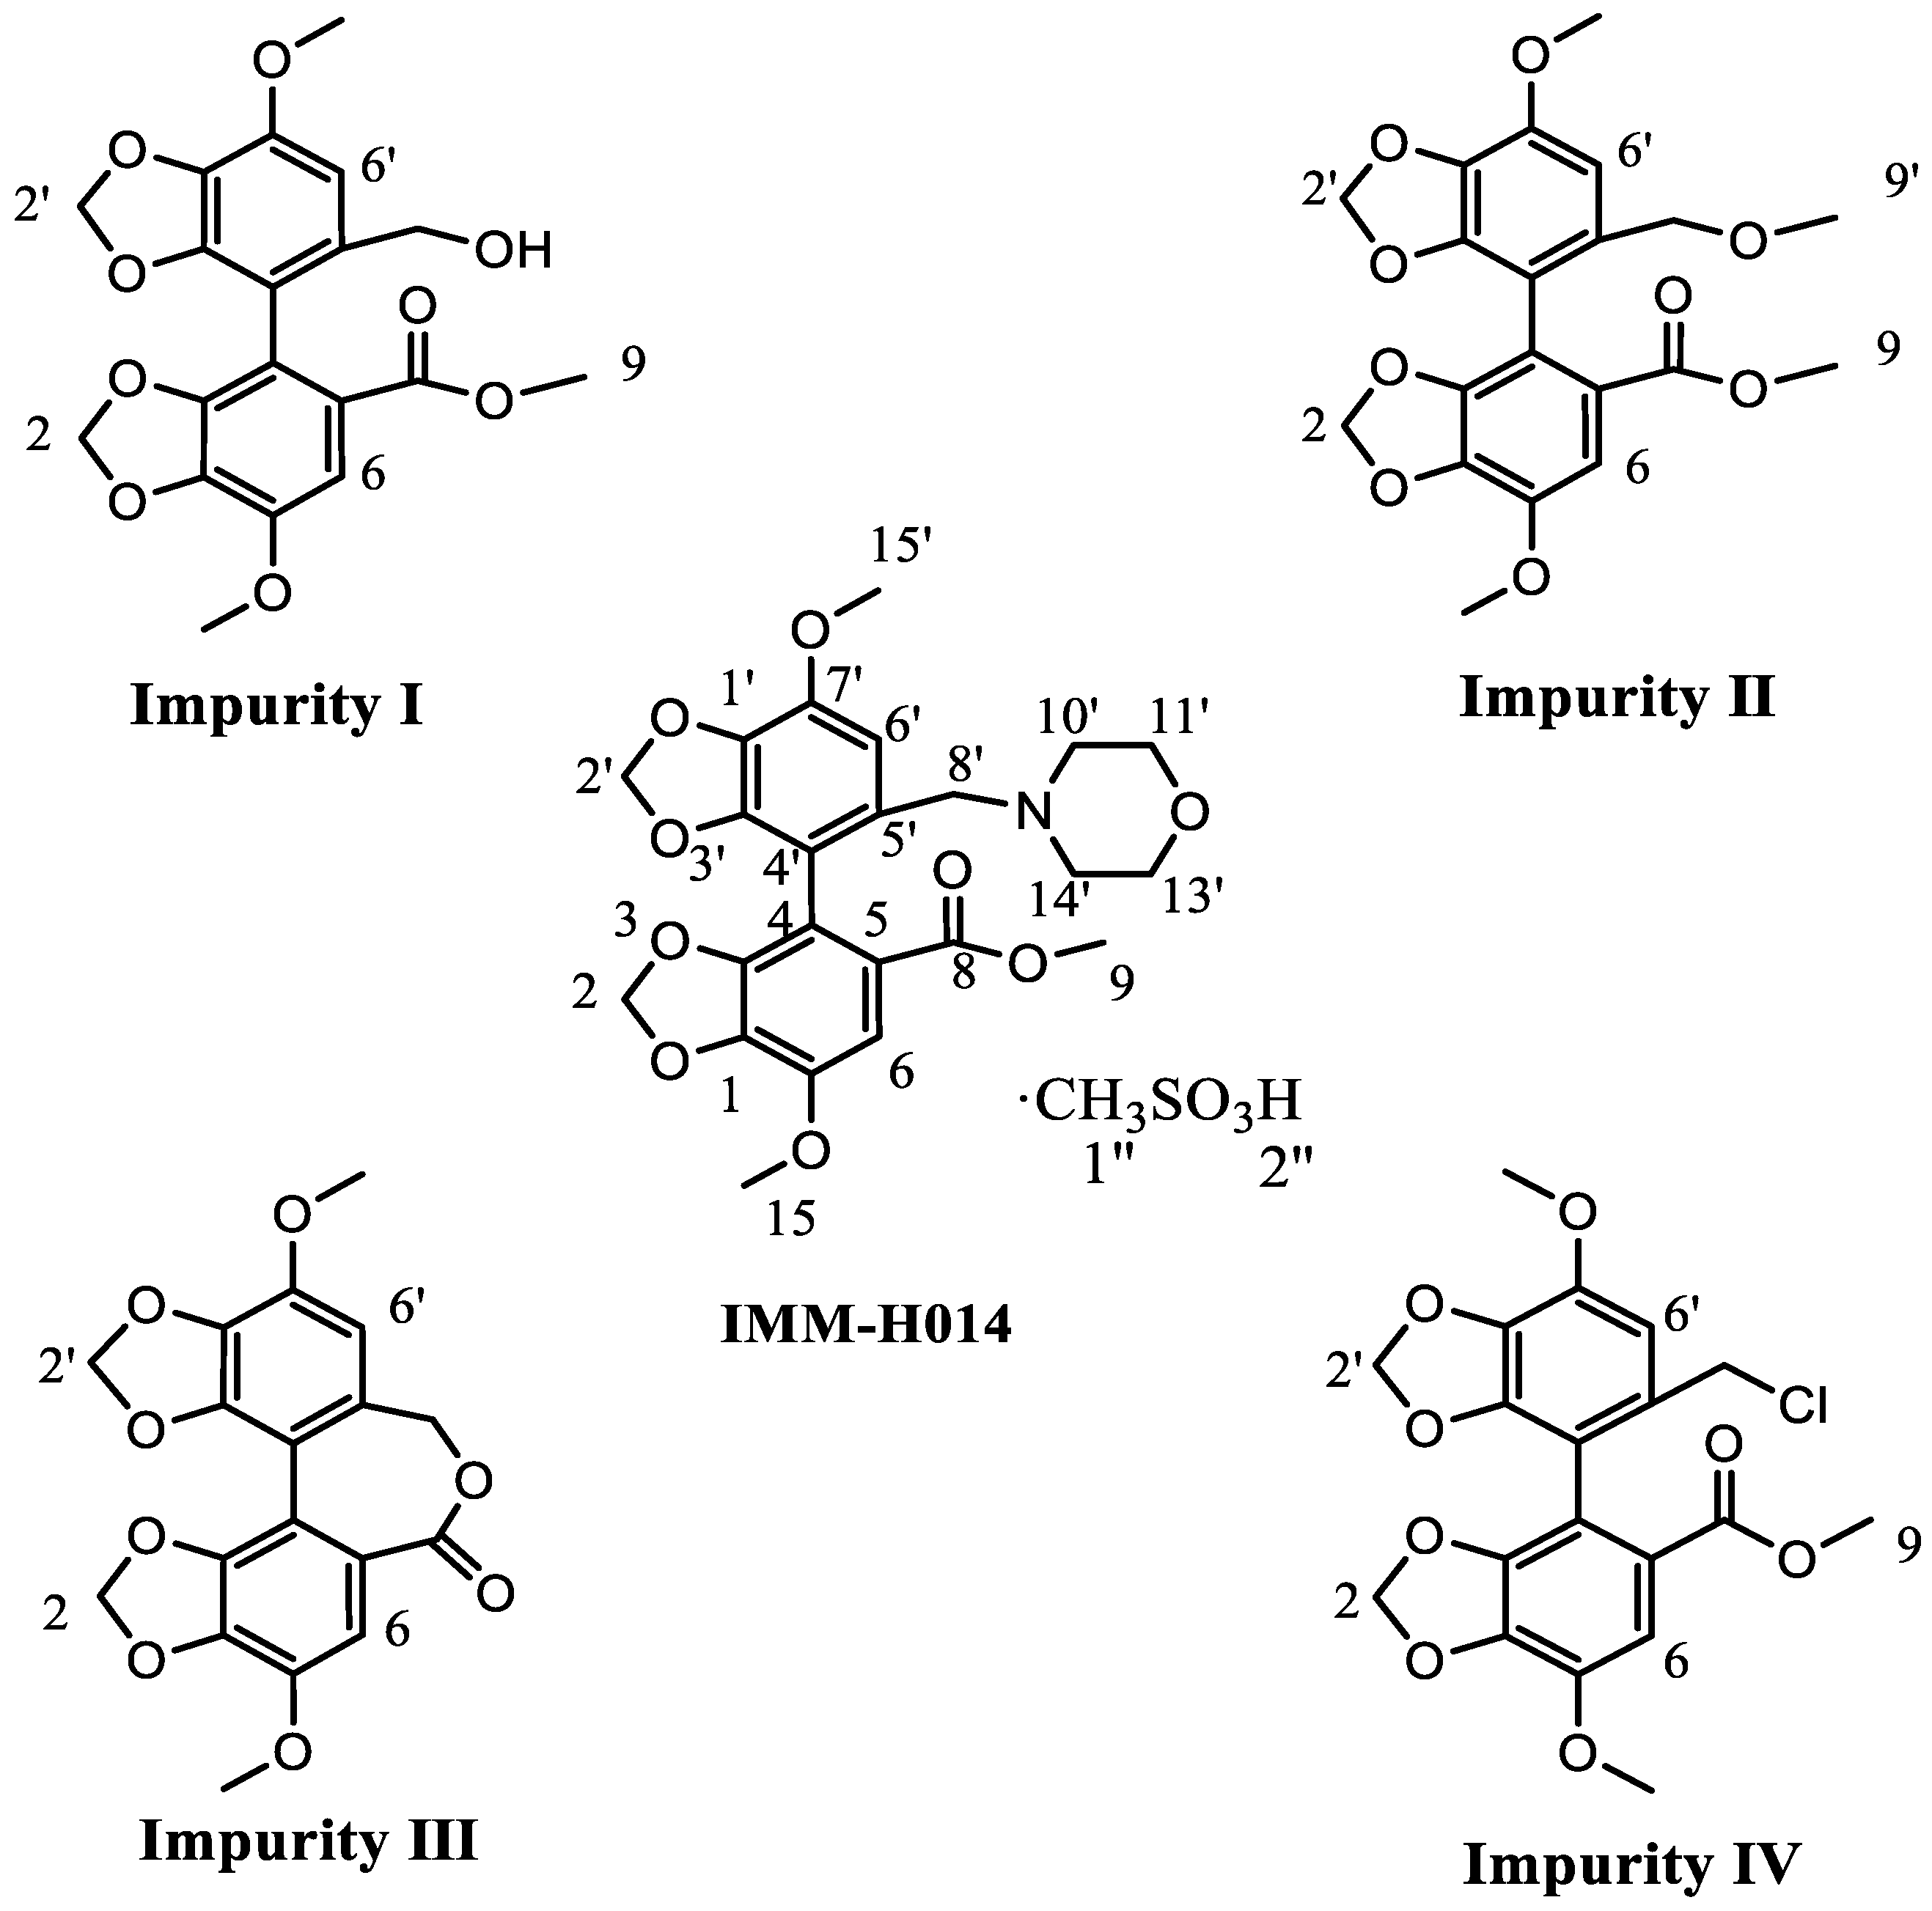
2.1. Proton Signal Assignments
2.2. Selection of Quantitative Signal and Internal Standard
2.3. Selection of Deuterated Solvent
2.4. Optimization of Instrument Parameters
2.5. Method Validation
2.5.1. Specificity
2.5.2. Limit of Quantification (LOQ)
2.5.3. Robustness
2.5.4. Linearity and Range
2.5.5. Precision and Stability
2.5.6. Accuracy
2.6. Quantitative Results
3. Materials and Methods
3.1. Materials
3.2. Instrument
3.3. Sample Preparation
3.4. qNMR Analysis Method
3.5. Method Validation
3.6. HPLC Method
3.7. TG Method
4. Conclusions
Supplementary Materials
Author Contributions
Funding
Institutional Review Board Statement
Informed Consent Statement
Data Availability Statement
Conflicts of Interest
References
- Watt, M.J.; Miotto, P.M.; De Nardo, W.; Montgomery, M.K. The liver as an endocrine organ—Linking NAFLD and insulin resistance. Endocr. Rev. 2019, 40, 1367–1393. [Google Scholar] [CrossRef] [PubMed]
- Clifford, B.L.; Sedgeman, L.R.; Williams, K.J.; Morand, P.; Cheng, A.; Jarrett, K.E.; Chan, A.P.; Brearley-Sholto, M.C.; Wahlström, A.; Ashby, J.W.; et al. FXR activation protects against NAFLD via bile-acid-dependent reductions in lipid absorption. Cell Metab. 2021, 33, 1671–1684.e4. [Google Scholar] [CrossRef] [PubMed]
- Friedman, S.L.; Neuschwander-Tetri, B.A.; Rinella, M.; Sanyal, A.J. Mechanisms of NAFLD development and therapeutic strategies. Nat. Med. 2018, 24, 908–922. [Google Scholar] [CrossRef] [PubMed]
- Zhou, J.; Zhou, F.; Wang, W.; Zhang, X.J.; Ji, Y.X.; Zhang, P.; She, Z.G.; Zhu, L.; Cai, J.; Li, H. Epidemiological features of NAFLD from 1999 to 2018 in China. Hepatology 2020, 71, 1851–1864. [Google Scholar] [CrossRef] [PubMed]
- Mundi, M.S.; Velapati, S.; Patel, J.; Kellogg, T.A.; Abu Dayyeh, B.K.; Hurt, R.T. Evolution of NAFLD and its management. Nutr. Clin. Pract. 2020, 35, 72–84. [Google Scholar] [CrossRef] [PubMed]
- Alves-Bezerra, M.; Cohen, D.E. Triglyceride metabolism in the liver. Compr. Physiol. 2017, 8, 1–8. [Google Scholar] [PubMed]
- Mahady, S.E.; George, J. Exercise and diet in the management of non-alcoholic fatty liver disease. Metabolism 2016, 65, 1172–1182. [Google Scholar] [CrossRef]
- Anderson, R.M.; Weindruch, R. Metabolic reprogramming, caloric restriction and aging. Trends Endocrinol. Metab. 2010, 21, 134–141. [Google Scholar] [CrossRef]
- Chalasani, N.; Younossi, Z.; Lavine, J.E.; Diehl, A.M.; Brunt, E.M.; Cusi, K.; Charlton, M.; Sanyal, A.J. The diagnosis and management of non-alcoholic fatty liver disease: Practice guideline by the American Gastroenterological Association, American Association for the Study of Liver Diseases, and American College of Gastroenterology. Gastroenterology 2012, 142, 1592–1609. [Google Scholar] [CrossRef]
- Sanyal, A.J.; Chalasani, N.; Kowdley, K.V.; McCullough, A.; Diehl, A.M.; Bass, N.M.; Neuschwander-Tetri, B.A.; Lavine, J.E.; Tonascia, J.; Unalp, A.; et al. Pioglitazone, vitamin E, or placebo for nonalcoholic steatohepatitis. N. Engl. J. Med. 2010, 362, 1675–1685. [Google Scholar] [CrossRef]
- Schürks, M.; Glynn, R.J.; Rist, P.M.; Tzourio, C.; Kurth, T. Effects of vitamin E on stroke subtypes: Meta-analysis of randomised controlled trials. BMJ 2010, 341, c5702. [Google Scholar] [CrossRef] [PubMed]
- Klein, E.A.; Thompson, I.M.; Tangen, C.M.; Crowley, J.J.; Lucia, M.S.; Goodman, P.J.; Minasian, L.M.; Ford, L.G.; Parnes, H.L.; Gaziano, J.M.; et al. Vitamin E and the risk of prostate cancer: The Selenium and Vitamin E Cancer Prevention Trial (SELECT). JAMA 2011, 306, 1549–1556. [Google Scholar] [CrossRef] [PubMed]
- Wu, S.; Sun, H.; Zhang, W.; Wang, S.; Wu, L.; Tong, Y.; Liu, N.; Zhang, D. A Class of Dicyclic Alcohols Derivatives and Their Preparartion and Application. China Patent CN107488162B, 19 October 2016. [Google Scholar]
- Zhao, T.; Mao, L.; Yu, Z.; Hui, Y.; Feng, H.; Wang, X.; Lin, L.; Fan, X.; Chen, X.; Wang, B.; et al. Therapeutic potential of bicyclol in liver diseases: Lessons from a synthetic drug based on herbal derivative in traditional Chinese medicine. Int. Immunopharmacol. 2021, 91, 107308. [Google Scholar] [CrossRef] [PubMed]
- Dai, W.; Qin, Q.; Li, Z.; Lin, L.; Li, R.; Fang, Z.; Han, Y.; Mu, W.; Ren, L.; Liu, T.; et al. Curdione and schisandrin C synergistically reverse hepatic fibrosis via modulating the TGF-β pathway and inhibiting oxidative stress. Front. Cell Dev. Biol. 2021, 9, 763864. [Google Scholar] [CrossRef] [PubMed]
- Wu, S.; Sun, H.; Zhang, J.; Zhang, W.; Wang, Z.; Yang, Q.; Jiang, L.; Chen, Z.; Shen, J.; Zhang, J.; et al. Left-Hand Bicyclic Morpholine and Salt Thereof, Preparation Method Therefor, Pharmaceutical Composition and Use. China Patent PCT/CN2020/115410, 19 October 2022. [Google Scholar]
- Zhang, C.; Shao, H.; Han, Z.; Liu, B.; Feng, J.; Zhang, W.; Zhang, K.; Yang, Q.; Wu, S. Development and In Vitro In Vivo Correlation Evaluation of IMM-H014 Extended-Release Tablets for the Treatment of Fatty Liver Disease. Int. J. Mol. Sci. 2023, 24, 12328. [Google Scholar] [CrossRef]
- Shao, H.; Feng, J.; Zhang, H.; Zhang, Y.; Qin, T.; Hu, Y.; Zhang, W.; Wang, T.; Wu, S.; Yang, Q. Identification and Determination of Impurities in a New Therapeutic Agent for Fatty Liver Disease. J. Anal. Methods Chem. 2023, 2023, 3116223. [Google Scholar] [CrossRef] [PubMed]
- Wang, Y.; Feng, J.; Wu, S.; Shao, H.; Zhang, W.; Zhang, K.; Zhang, H.; Yang, Q. Determination of methyl methanesulfonate and ethyl methylsulfonate in new drug for the treatment of fatty liver using derivatization followed by high-performance liquid chromatography with ultraviolet detection. Molecules 2022, 27, 1950. [Google Scholar] [CrossRef]
- Crook, A.A.; Powers, R. Quantitative NMR-based biomedical metabolomics: Current status and applications. Molecules 2020, 25, 5128. [Google Scholar] [CrossRef]
- Diehl, B.; Holzgrabe, U.; Monakhova, Y.; Schönberger, T. Quo vadis qNMR? J. Pharm. Biomed. Anal. 2020, 177, 112847. [Google Scholar] [CrossRef]
- Choi, K.; Myoung, S.; Seo, Y.; Ahn, S. Quantitative NMR as a versatile tool for the reference material preparation. Magnetochemistry 2021, 7, 15. [Google Scholar] [CrossRef]
- Bonhomme, C.; Gervais, C.; Babonneau, F.; Coelho, C.; Pourpoint, F.; Azais, T.; Ashbrook, S.E.; Griffin, J.M.; Yates, J.R.; Mauri, F.; et al. First-principles calculation of NMR parameters using the gauge including projector augmented wave method: A chemist’s point of view. Chem. Rev. 2012, 112, 5733–5779. [Google Scholar] [CrossRef] [PubMed]
- Moura, S.; Carvalho, F.G.; de Oliveira, C.D.R.; Pinto, E.; Yonamine, M. qNMR: An applicable method for the determination of dimethyltryptamine in ayahuasca, a psychoactive plant preparation. Phytochem. Lett. 2010, 3, 79–83. [Google Scholar] [CrossRef]
- National Pharmacopoeia Commission. Chinese Pharmacopoeia (Volume Four); China Medical Science and Technology Press: Beijing, China, 2020; p. 53. [Google Scholar]
- Ich. Q2(R1): Validation of analytical procedures: Text and methodology. In Proceedings of the International Conference on Harmonisation (ICH), Geneva, Switzerland, November 2005.
- Li, Z.; Welbeck, E.; Yang, L.; He, C.; Hu, H.; Song, M.; Bi, K.; Wang, Z. A quantitative 1H nuclear magnetic resonance (qHNMR) method for assessing the purity of iridoids and secoiridoids. Fitoterapia 2015, 100, 187–194. [Google Scholar] [CrossRef] [PubMed]
- Westwood, S.; Yamazaki, T.; Huang, T.; Garrido, B.; Ün, I.; Zhang, W.; Martos, G.; Stoppacher, N.; Saito, T.; Wielgosz, R. Development and validation of a suite of standards for the purity assignment of organic compounds by quantitative NMR spectroscopy. Metrologia 2019, 56, 064001. [Google Scholar] [CrossRef]
- Dalitz, F.; Cudaj, M.; Maiwald, M.; Guthausen, G. Process and reaction monitoring by low-field NMR spectroscopy. Prog. Nucl. Magn. Reson. Spectrosc. 2012, 60, 52–70. [Google Scholar] [CrossRef]
- Ernst, R.R.; Anderson, W.A. Application of Fourier Transform Spectroscopy to Magnetic Resonance. Rev. Sci. Instrum. 1966, 37, 93–102. [Google Scholar] [CrossRef]
- Bharti, S.K.; Sinha, N.; Joshi, B.S.; Mandal, S.K.; Roy, R.; Khetrapal, C.L. Improved quantification from 1H-NMR spectra using reduced repetition times. Metabolomics 2008, 4, 367–376. [Google Scholar] [CrossRef]
- Bharti, S.K.; Roy, R. Quantitative 1H NMR spectroscopy. TrAC Trends Anal. Chem. 2012, 35, 5–26. [Google Scholar] [CrossRef]


| Compound | IMM-H014 | Impurity I | Impurity II | Impurity III | Impurity IV |
|---|---|---|---|---|---|
| H-2 | 2H 6.05 dd | 2H 6.06 dd | 2H 6.05 s | 1H 6.20 d | 2H 6.06 dd |
| 1H 6.10 d | |||||
| H-2′ | 2H 5.94 dd | 2H 5.94 dd | 2H 5.95 dd | 1H 6.14 d | 2H 5.97 dd |
| 1H 6.02 d | |||||
| H-6 | 1H 7.36 s | 1H 7.36 s | 1H 7.38 s | 1H 7.23 s | 1H 7.43 s |
| H-6′ * | 1H 7.40 s | 1H 6.80 s | 1H 6.74 s | 1H 6.69 s | 1H 6.75 s |
| H-8 | - | 2H 4.40 q | 2H 4.22 dd | 1H 5.05 s | 2H 4.38 d |
| 1H 4.86 s | |||||
| H-9 | 3H 3.71 s | 3H 3.74 s | 3H 3.68 s | - | 3H 3.70 s |
| H-9′ | - | - | 3H 3.22 s | - | - |
| H-15 | 3H 4.02 s | 8H 3.98 m | 8H 3.97 m | 8H 3.98 m | 3H 4.01 s |
| H-15′ | 3H 3.98 s | 8H 3.98 m | 8H 3.97 m | 8H 3.98 m | 5H 3.97 m |
| H-8′ | 1H 4.33 dd | 8H 3.98 m | 8H 3.97 m | 8H 3.98 m | 5H 3.97 m |
| 1H 3.79 dd |
| Compound | Chemical Shift/ppm | T1/s |
|---|---|---|
| IMM-H014 | 7.42 | 0.48 |
| Impurity I | 6.80 | 1.65 |
| Impurity II | 6.74 | 1.51 |
| Impurity III | 6.69 | 1.20 |
| Impurity IV | 6.75 | 1.61 |
| DMT | 8.13 | 3.26 |
| Parameters | Value | Px/% | Diff% |
|---|---|---|---|
| Relaxation Delay (D1) | 10 s | 99.76% | 0.002 |
| 15 s | 99.72% | 0.045 | |
| 20 s # | 99.76% | / | |
| 25 s | 100.29% | 0.533% | |
| 30 s | 99.76% | 0.002% | |
| Number of Scans (NS) | 16 | 99.93% | 0.169% |
| 32 # | 99.76% | / | |
| 64 | 99.22% | 0.537% | |
| Pulse Length (P1) | 7.90 μs | 99.61% | 0.151% |
| 7.95 μs | 99.88% | 0.117% | |
| 8.00 μs # | 99.76% | / | |
| 8.05 μs | 99.61% | 0.151% | |
| 8.10 μs | 98.79% | 0.968% | |
| Time Domain (TD) | 32 k | 99.66% | 0.105% |
| 64 k # | 99.76% | / |
| No. | IMM-H014 | Impurity I | Impurity II | Impurity III | Impurity IV | |||||
|---|---|---|---|---|---|---|---|---|---|---|
| mx/mstd | Ax/Astd | mx/mstd | Ax/Astd | mx/mstd | Ax/Astd | mx/mstd | Ax/Astd | mx/mstd | Ax/Astd | |
| 1 | 0.4247 | 0.0360 | 0.4999 | 0.0625 | 0.5074 | 0.0607 | 0.4754 | 0.0637 | 0.5538 | 0.0650 |
| 2 | 1.0336 | 0.0901 | 0.9601 | 0.1201 | 0.8251 | 0.0987 | 1.5862 | 0.2134 | 1.1027 | 0.1286 |
| 3 | 2.1934 | 0.1914 | 2.0247 | 0.2519 | 1.7319 | 0.2076 | 1.9346 | 0.2607 | 1.6546 | 0.1944 |
| 4 | 2.9762 | 0.2598 | 3.3830 | 0.4241 | 3.0961 | 0.3719 | 3.2555 | 0.4379 | 3.7443 | 0.4436 |
| 5 | 7.3463 | 0.6399 | 6.5211 | 0.8005 | 5.0897 | 0.6146 | 5.6846 | 0.7644 | 5.9357 | 0.6965 |
| 6 | 14.6494 | 1.2693 | 16.0871 | 1.9684 | 12.4175 | 1.4975 | 14.0762 | 1.8927 | 15.1153 | 1.8020 |
| 7 | 31.7979 | 2.7083 | 21.5391 | 2.7018 | 31.2684 | 3.6506 | 18.3831 | 2.5560 | 25.8372 | 2.9900 |
| Calibration | y = 0.0852x + 0.0066 | y = 0.1244x − 0.0028 | y = 0.1168x + 0.012 | y = 0.1379x − 0.0102 | y = 0.1163x + 0.0067 | |||||
| r | 0.9999 | 0.9999 | 0.9999 | 0.9997 | 0.9998 | |||||
| IMM-H014 | Impurity I | Impurity II | Impurity III | Impurity IV | ||||||||||||
|---|---|---|---|---|---|---|---|---|---|---|---|---|---|---|---|---|
| No. | mx/ mstd | Ax/ Astd | % | mx/ mstd | Ax/ Astd | % | mx/ mstd | Ax/ Astd | % | mx/ mstd | Ax/ Astd | % | mx/ mstd | Ax/ Astd | % | |
| Precision (n = 6) | 1 | 7.346 | 0.637 | 99.27 | 6.521 | 0.805 | 99.20 | 5.090 | 0.613 | 100.27 | 5.677 | 0.769 | 100.57 | 5.936 | 0.694 | 98.49 |
| 2 | 0.641 | 99.80 | 0.797 | 98.27 | 0.618 | 101.22 | 0.767 | 99.70 | 0.699 | 99.12 | ||||||
| 3 | 0.639 | 99.61 | 0.797 | 98.27 | 0.613 | 100.27 | 0.765 | 99.68 | 0.697 | 98.81 | ||||||
| 4 | 0.639 | 99.61 | 0.799 | 98.46 | 0.607 | 99.33 | 0.767 | 99.88 | 0.694 | 98.49 | ||||||
| 5 | 0.637 | 99.27 | 0.799 | 98.46 | 0.601 | 98.38 | 0.763 | 100.42 | 0.697 | 98.90 | ||||||
| 6 | 0.640 | 99.76 | 0.805 | 99.20 | 0.601 | 98.38 | 0.759 | 98.98 | 0.692 | 98.21 | ||||||
| Average | / | / | 99.55 | / | / | 98.64 | / | / | 99.64 | / | / | 99.87 | / | / | 98.67 | |
| RSD% | / | / | 0.23 | / | / | 0.44 | / | / | 1.15 | / | / | 0.57 | / | / | 0.33 | |
| Repeatability (n = 6) | 1 | 7.346 | 0.640 | 99.67 | 6.521 | 0.800 | 98.58 | 5.090 | 0.615 | 100.59 | 5.685 | 0.769 | 99.57 | 5.936 | 0.697 | 98.81 |
| 2 | 5.851 | 0.511 | 99.90 | 4.846 | 0.599 | 99.33 | 4.846 | 0.579 | 99.49 | 3.809 | 0.512 | 99.13 | 7.768 | 0.919 | 99.58 | |
| 3 | 7.957 | 0.694 | 99.85 | 3.884 | 0.480 | 99.46 | 7.310 | 0.894 | 101.82 | 5.168 | 0.695 | 99.15 | 8.395 | 0.990 | 99.27 | |
| 4 | 5.889 | 0.513 | 99.60 | 7.772 | 0.965 | 99.86 | 7.772 | 0.929 | 99.52 | 3.809 | 0.513 | 99.30 | 5.064 | 0.601 | 99.97 | |
| 5 | 8.091 | 0.707 | 100.00 | 6.736 | 0.841 | 100.35 | 6.736 | 0.806 | 99.58 | 5.241 | 0.703 | 99.56 | 7.607 | 0.894 | 98.95 | |
| 6 | 4.884 | 0.426 | 99.82 | 6.030 | 0.751 | 100.17 | 6.03 | 0.728 | 100.51 | 4.399 | 0.591 | 99.31 | 8.242 | 0.969 | 98.99 | |
| Average | / | / | 99.81 | / | / | 99.63 | / | / | 100.25 | / | / | 99.34 | / | / | 99.26 | |
| RSD% | / | / | 0.38 | / | / | 0.70 | / | / | 0.91 | / | / | 0.33 | / | / | 0.67 | |
| Stability | 0 * | 7.346 | 0.637 | 99.27 | 6.521 | 0.805 | 99.20 | 5.090 | 0.613 | 100.27 | 5.677 | 0.769 | 99.93 | 5.936 | 0.694 | 98.49 |
| 1 | 0.641 | 99.80 | 0.797 | 98.27 | 0.618 | 101.22 | 0.767 | 99.70 | 0.699 | 99.12 | ||||||
| 2 | 0.639 | 99.61 | 0.797 | 98.27 | 0.613 | 100.27 | 0.765 | 99.48 | 0.697 | 98.81 | ||||||
| 4 | 0.639 | 99.61 | 0.799 | 98.46 | 0.607 | 99.33 | 0.767 | 99.70 | 0.694 | 98.49 | ||||||
| 8 | 0.637 | 99.27 | 0.799 | 98.46 | 0.601 | 98.38 | 0.763 | 99.19 | 0.697 | 98.90 | ||||||
| 12 | 0.640 | 99.76 | 0.805 | 99.20 | 0.601 | 98.38 | 0.759 | 98.73 | 0.692 | 98.21 | ||||||
| 24 | 0.641 | 99.80 | 0.791 | 97.54 | 0.601 | 98.38 | 0.766 | 99.64 | 0.7 | 99.25 | ||||||
| 36 | 0.639 | 99.61 | 0.797 | 98.27 | 0.606 | 99.13 | 0.764 | 99.26 | 0.702 | 99.60 | ||||||
| 48 | 0.639 | 99.61 | 0.805 | 99.20 | 0.605 | 98.95 | 0.763 | 99.19 | 0.702 | 99.59 | ||||||
| Average | / | / | 99.59 | / | / | 98.54 | / | / | 99.37 | / | / | 99.43 | / | / | 98.94 | |
| RSD% | / | / | 0.20 | / | / | 0.57 | / | / | 1.02 | / | / | 0.37 | / | / | 0.50 | |
| IMM-H014 | Impurity Ⅰ | Impurity Ⅱ | Impurity Ⅲ | Impurity Ⅳ | ||||||||||||
|---|---|---|---|---|---|---|---|---|---|---|---|---|---|---|---|---|
| No. | mx/ mstd | Ax/ Astd | % | mx/ mstd | Ax/ Astd | % | mx/ mstd | Ax/ Astd | % | mx/ mstd | Ax/ Astd | % | mx/ mstd | Ax/ Astd | % | |
| Accuracy at low level (n = 3) | ||||||||||||||||
| 1 | 4.884 | 0.426 | 99.82 | 5.300 | 0.657 | 99.62 | 5.090 | 0.615 | 100.59 | 3.804 | 0.513 | 99.44 | 4.279 | 0.507 | 99.79 | |
| 2 | 0.426 | 99.82 | 0.657 | 99.71 | 0.603 | 98.70 | 0.512 | 99.33 | 0.506 | 99.54 | ||||||
| 3 | 0.426 | 99.82 | 0.657 | 99.69 | 0.604 | 98.82 | 0.511 | 99.24 | 0.503 | 98.97 | ||||||
| Average | / | / | 99.82 | / | / | 99.67 | / | / | 99.37 | / | / | 99.34 | / | / | 99.43 | |
| RSD% | / | / | 0.61 | / | / | 0.59 | / | / | 1.02 | / | / | 0.20 | / | / | 0.56 | |
| Accuracy at medium level (n = 3) | ||||||||||||||||
| 1 | 5.889 | 0.511 | 99.90 | 6.521 | 0.8 | 98.58 | 5.878 | 0.699 | 99.07 | 5.677 | 0.767 | 99.70 | 5.936 | 0.697 | 98.81 | |
| 2 | 0.513 | 99.60 | 0.801 | 98.71 | 0.702 | 99.45 | 0.763 | 99.21 | 0.694 | 98.53 | ||||||
| 3 | 0.426 | 99.82 | 0.798 | 98.34 | 0.702 | 99.48 | 0.764 | 99.36 | 0.701 | 99.48 | ||||||
| Average | / | / | 99.81 | / | / | 98.54 | / | / | 99.33 | / | / | 99.43 | / | / | 98.94 | |
| RSD% | / | / | 0.52 | / | / | 0.57 | / | / | 0.38 | / | / | 0.37 | / | / | 0.50 | |
| Accuracy at high level (n = 3) | ||||||||||||||||
| 1 | 7.957 | 0.640 | 99.67 | 7.895 | 0.987 | 100.53 | 8.046 | 0.958 | 99.14 | 7.508 | 1.017 | 100.01 | 9.842 | 1.160 | 99.31 | |
| 2 | 0.694 | 99.85 | 0.990 | 100.86 | 0.961 | 99.44 | 1.016 | 99.85 | 1.154 | 98.70 | ||||||
| 3 | 0.707 | 100.00 | 0.990 | 100.86 | 0.963 | 99.68 | 1.014 | 99.65 | 1.164 | 99.54 | ||||||
| Average | / | / | 99.81 | / | / | 100.75 | / | / | 99.42 | / | / | 99.84 | / | / | 99.18 | |
| RSD% | / | / | 0.19 | / | / | 0.33 | / | / | 0.92 | / | / | 0.53 | / | / | 0.80 | |
| Compound | qNMR Method (n = 3) | Mass Balance Method | |||
|---|---|---|---|---|---|
| Purity (%) | RSD (%) | HPLC (%) | Loss on Drying (%) | Purity (%) * | |
| IMM-H014 | 99.81 | 0.46 | 99.52 | 0.022 | 99.50 |
| Impurity I | 99.65 | 1.04 | 99.64 | 0.085 | 99.91 |
| Impurity II | 99.37 | 0.79 | 99.18 | 0.032 | 99.15 |
| Impurity III | 99.29 | 0.27 | 99.58 | 0.098 | 99.48 |
| Impurity IV | 99.19 | 0.64 | 99.50 | 0.936 | 99.06 |
| Name | N | M (g/mol) |
|---|---|---|
| DMT(IS) | 4 | 194.18 |
| IMM-H014 | 1 | 555.55 |
| Impurity I | 1 | 390.34 |
| Impurity II | 1 | 404.37 |
| Impurity III | 1 | 358.30 |
| Impurity IV | 1 | 408.79 |
Disclaimer/Publisher’s Note: The statements, opinions and data contained in all publications are solely those of the individual author(s) and contributor(s) and not of MDPI and/or the editor(s). MDPI and/or the editor(s) disclaim responsibility for any injury to people or property resulting from any ideas, methods, instructions or products referred to in the content. |
© 2023 by the authors. Licensee MDPI, Basel, Switzerland. This article is an open access article distributed under the terms and conditions of the Creative Commons Attribution (CC BY) license (https://creativecommons.org/licenses/by/4.0/).
Share and Cite
Zhang, H.; Zhu, H.; Wu, S.; Tang, H.; Zhang, W.; Gong, X.; Wang, T.; Wang, Y.; Yang, Q. Assessment of the Purity of IMM-H014 and Its Related Substances for the Treatment of Metabolic-Associated Fatty Liver Disease Using Quantitative Nuclear Magnetic Resonance Spectroscopy. Int. J. Mol. Sci. 2023, 24, 17508. https://doi.org/10.3390/ijms242417508
Zhang H, Zhu H, Wu S, Tang H, Zhang W, Gong X, Wang T, Wang Y, Yang Q. Assessment of the Purity of IMM-H014 and Its Related Substances for the Treatment of Metabolic-Associated Fatty Liver Disease Using Quantitative Nuclear Magnetic Resonance Spectroscopy. International Journal of Molecular Sciences. 2023; 24(24):17508. https://doi.org/10.3390/ijms242417508
Chicago/Turabian StyleZhang, Hanyilan, Haowen Zhu, Song Wu, Haoyang Tang, Wenxuan Zhang, Xiaoliang Gong, Tiesong Wang, Yinghong Wang, and Qingyun Yang. 2023. "Assessment of the Purity of IMM-H014 and Its Related Substances for the Treatment of Metabolic-Associated Fatty Liver Disease Using Quantitative Nuclear Magnetic Resonance Spectroscopy" International Journal of Molecular Sciences 24, no. 24: 17508. https://doi.org/10.3390/ijms242417508
APA StyleZhang, H., Zhu, H., Wu, S., Tang, H., Zhang, W., Gong, X., Wang, T., Wang, Y., & Yang, Q. (2023). Assessment of the Purity of IMM-H014 and Its Related Substances for the Treatment of Metabolic-Associated Fatty Liver Disease Using Quantitative Nuclear Magnetic Resonance Spectroscopy. International Journal of Molecular Sciences, 24(24), 17508. https://doi.org/10.3390/ijms242417508