Article

Genome-Wide Identification of PEBP Gene Family in Two Dendrobium Species and Expression Patterns in Dendrobium chrysotoxum

1
College of Forestry, Fujian Agriculture and Forestry University, Fuzhou 350002, China
2
Key Laboratory of National Forestry and Grassland Administration for Orchid Conservation and Utilization, College of Landscape Architecture and Art, Fujian Agriculture and Forestry University, Fuzhou 350002, China
*
Authors to whom correspondence should be addressed.
Int. J. Mol. Sci. 2023, 24(24), 17463; https://doi.org/10.3390/ijms242417463
Submission received: 30 October 2023 / Revised: 6 December 2023 / Accepted: 10 December 2023 / Published: 14 December 2023

Abstract

:
The PEBP gene family plays a significant role in regulating flower development and formation. To understand its function in Dendrobium chrysotoxum and D. nobile flowering, we identified 22 PEBP genes (11 DchPEBPs and 11 DnoPEBPs) from both species. We conducted analyses on their conserved domains and motifs, phylogenetic relationships, chromosome distribution, collinear correlation, and cis elements. The classification results showed that the 22 PEBPs were mainly divided into three clades, as follows: FT, MFT, and TFL1. A sequence analysis showed that most PEBP proteins contained five conserved domains, while a gene structure analysis revealed that 77% of the total PEBP genes contained four exons and three introns. The promoter regions of the 22 PEBPs contained several cis elements related to hormone induction and light response. This suggests these PEBPs could play a role in regulating flower development by controlling photoperiod and hormone levels. Additionally, a collinearity analysis revealed three pairs of duplicate genes in the genomes of both D. chrysotoxum and D. nobile. Furthermore, RT-qPCR has found to influence the regulatory effect of DchPEBPs on the development of flower organs (sepals, petals, lip, ovary, and gynostemium) during the flowering process (bud, transparent stage, and initial bloom). The results obtained imply that DchPEBP8 and DchPEBP9 play a role in the initial bloom and that DchPEBP7 may inhibit flowering processes. Moreover, DchPEBP9 may potentially be involved in the development of reproductive functionality. PEBPs have regulatory functions that modulate flowering. FT initiates plant flowering by mediating photoperiod and temperature signals, while TFL1 inhibits flowering processes. These findings provide clues for future studies on flower development in Dendrobium.

1. Introduction

Phosphatidylethanolamine binding protein (PEBP) is from a highly conserved domain [1] that regulates flowering transition and plant architecture [2]. This gene can affect the regulation of photoperiod, vernalization, environmental temperature, plant hormones, and autonomous flowering pathways [3,4,5,6]. Phosphatidylethanolamine binding proteins were initially extracted from bovine brains, due to their high level of attraction towards phospholipids [7,8]. The PEBP gene family is widespread in bacteria [9], yeast [10], plants [11], and animals [1,12]. In higher plants, the PEBP gene family is categorized into three subfamilies: MOTHER OF FT AND TFL1 (MFT) like, FLOWERING LOCUS T (FT) like, and TERMINAL FLOWER 1 (TFL1) like. These subfamilies, namely MFT-like and FT-like, either promote or inhibit flowering processes [13]. There are multiple PEBP family genes in different plants, and although researchers have some understanding of their role in plant development, this understanding is limited. To better understand the mechanism of PEBP family genes in plants, further research is required to study their functions in different plant species.
PEBP proteins play a crucial role in various developmental processes in plants. In previous studies, the flowering site T (FT) [14] was found in Arabidopsis Thaliana to induce flowering in a photocycle-dependent manner, while their homologous terminal flower 1 (TFL1) gene family PEBP amine-binding protein (PEBP) [15] delayed flowering. Homologs of FT and TFL1 (MFT) have been identified in bryophytes lacking other FT and TFL1-like genes [16]. Mixed FT/TFL1 genes, as well as MFT-like genes, can be found in gymnosperm species [13]. It is suggested that MFT-like genes are the ancestors of FT-like genes and TFL1-like genes. Understanding of the separation function of FT and TFL1 evolved after the differentiation of gymnosperms and angiosperms [17]. The gene FT was found to be up-regulated in the reproductive organs of the Dendrobium ‘Chao Praya Smile’ orchid, including inflorescence apices, stems, floral buds, and open flowers. When overexpressed, the DoFT gene promotes flowering, resulting in notable pseudobulb formation, while suppressing the endogenous DoFT transcripts delays flowering in orchids [18]. The TFL-like gene is down-regulated in adult D. catenatum, suggesting a mechanism is present that inhibits flowering during the vegetative growth phase in rattan plants [19].
Orchidaceae is a diverse family of flowering plants with ecological and economic importance. About 27,800 species are widely distributed around the world [20]. Dendrobium is a highly abundant genus within the orchid family, with about 1100 species found worldwide [21]. The PEBP gene family plays important roles in plant growth; for example, flowering, organ development, seed germination, root morphology, and resistance to abiotic stress [18,22]. However, most of the PEBP gene functions in D. chrysotoxum and D. nobile remain unclear. Studying the evolutionary features and expression profiles of PEBPs can enhance our understanding of their functions in two Dendrobium species. The number of PEBP gene families in plants varies significantly. To date, six, seven, and five PEBPs have been identified in dicotyledonous plants such as Arabidopsis [23], apple [14], and grape [24], respectively, and 24 and 19 PEBPs have been identified in monocotyledonous plants such as maize [25] and rice [26]. In addition, DhPEBPs [27] in D. huoshanense have various regulatory functions responsible for modulating flowering. FT orthologs from D. ‘Chao Praya Smile’ [18] correlate with flower development and accelerate flowering.
This study aimed to investigate the characteristics of the PEBP gene family during orchid floral development by performing gene structure analysis, phylogenetic tree construction, collinearity analysis, cis-acting element analysis, and expression pattern analysis in D. chrysotoxum and D. nobile. Understanding the regulatory function of the PEBP gene family in the flower organ development processes of different orchid life forms is crucial for the breeding and development of orchids. The findings of this study will provide a scientific basis for understanding the distinct roles of PEBP family members in the flowering regulation of both Dendrobium species.

2. Results

2.1. Identification and Physicochemical Properties

Using 6 PEBP gene family protein sequences of Arabidopsis, 22 PEBP gene family members were identified in the D. chrysotoxum and D. nobile genome using the BLAST and HMMER techniques. The PEBP proteins are named according to their order of gene distribution on the chromosome, starting at the top and going down (Table S1). The PEBP proteins have varying physicochemical properties, ranging from 82 to 420 amino acids. Molecular weight (Mw) ranges from 9.64 to 48.32 kDa. In addition, 7 of the 22 PEBPs were basic proteins (isoelectric point (pI) above 8.00) and 15 were neutral or weakly acidic proteins (pI range 4.99 to 7.87). The 22 PEBP proteins were all predicted to be hydrophilic, with a negative total mean of hydrophobicity (GRAVY). A total of 22 PEBP genes were named DchPEBP1-11 or DnoPEBP1-11, according to their order of distribution on the chromosome. In addition, the analysis of coding protein sequences showed that there were significant differences in amino acid, molecular weight, pI, GRAVY, AI, and II of the PEBP gene in D. chrysotoxum and D. nobile.

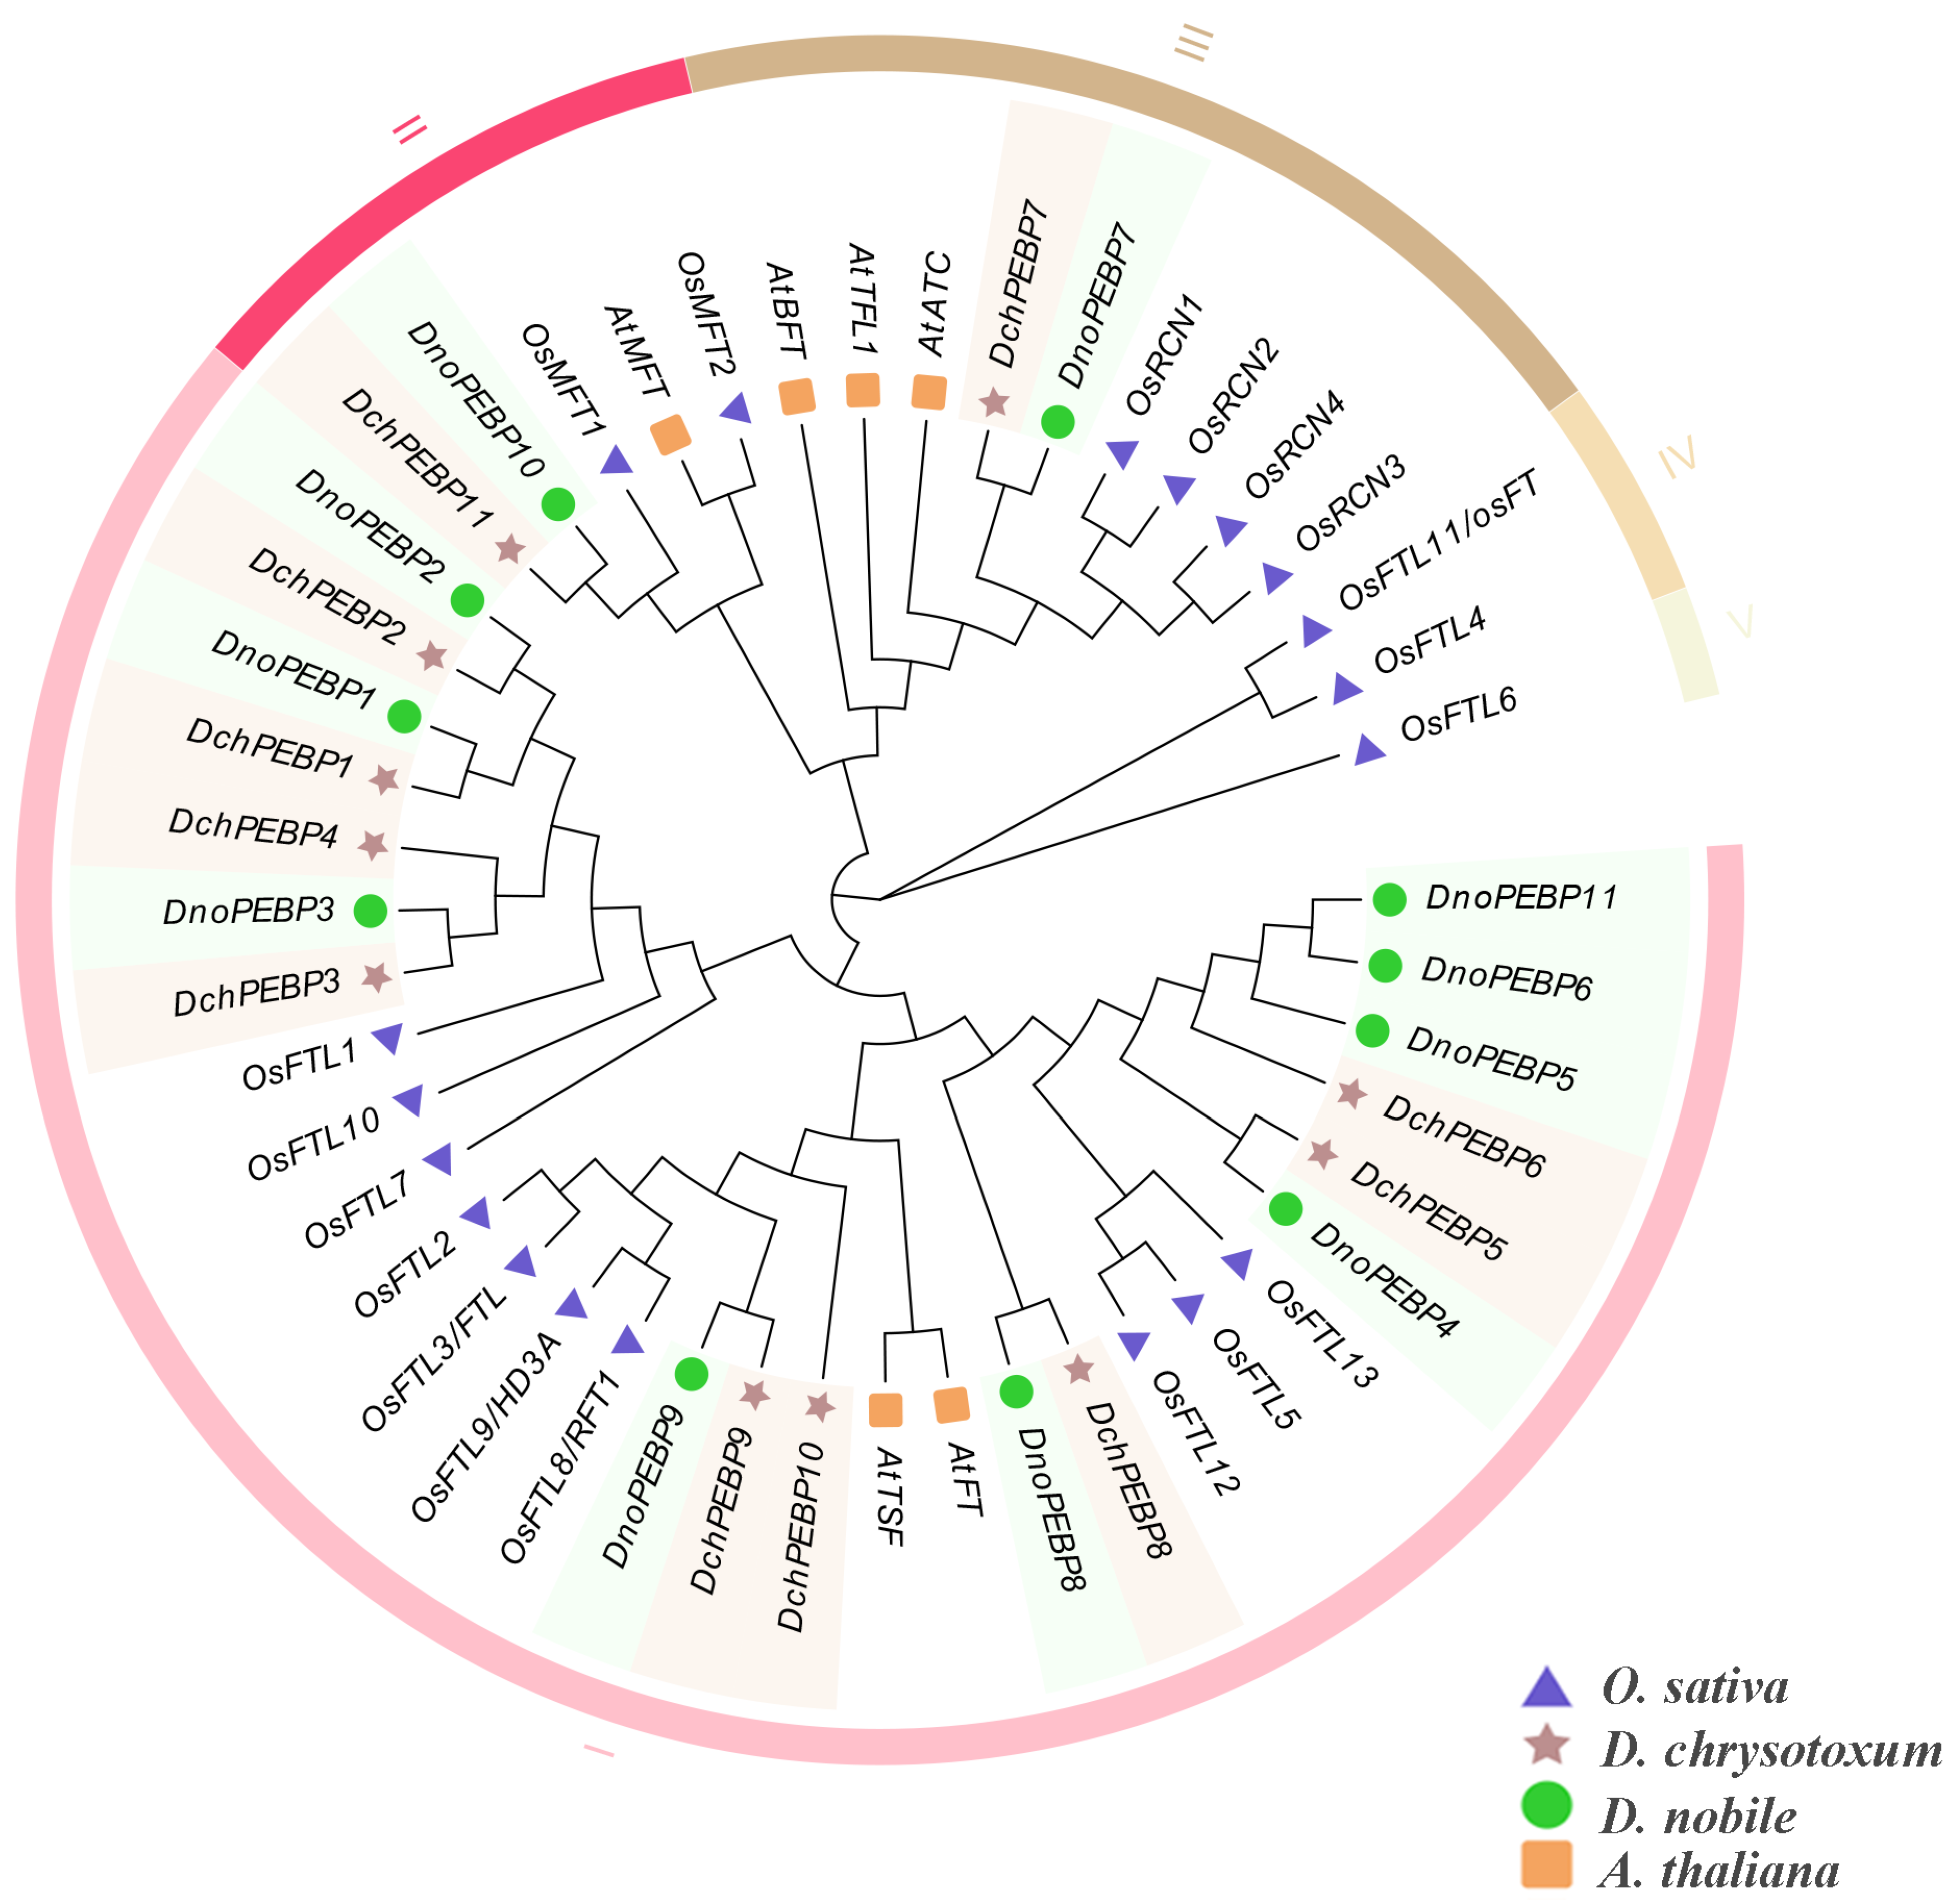
2.2. Phylogenetic and Classification of PEBP Proteins

A phylogenetic tree was constructed to show the relationship between PEBPs in D. chrysotoxum and D. nobile. The tree was based on the protein sequences of 45 members of PEBP from D. chrysotoxum (DchPEBP), D. nobile (DnoPEBP), A. thaliana (AthPEBP), and Oryza sativa (OsPEBP), which were divided into 5 classes (Figure 1). D. chrysotoxum and D. nobile belong to I, II and III, IV and V are rice genes. After analyzing the classification of AthPEBPs, the 22 PEBP genes in the 2 Dendrobium species were categorized into three subfamilies. The resulting phylogenetic tree was also divided into three subfamilies: FT(I), MFT (II), and TFL1 (III, IV, V). There were 18 genes in the FT subfamily, 9 nine DchPEBPs and 9 DnoPEBPs. Additionally, there were two genes in the TFL1 subfamily (DchPEBP7 and DnoPEBP7) and two genes in the MFT subfamily (DchPEBP11 and DnoPEBP10).

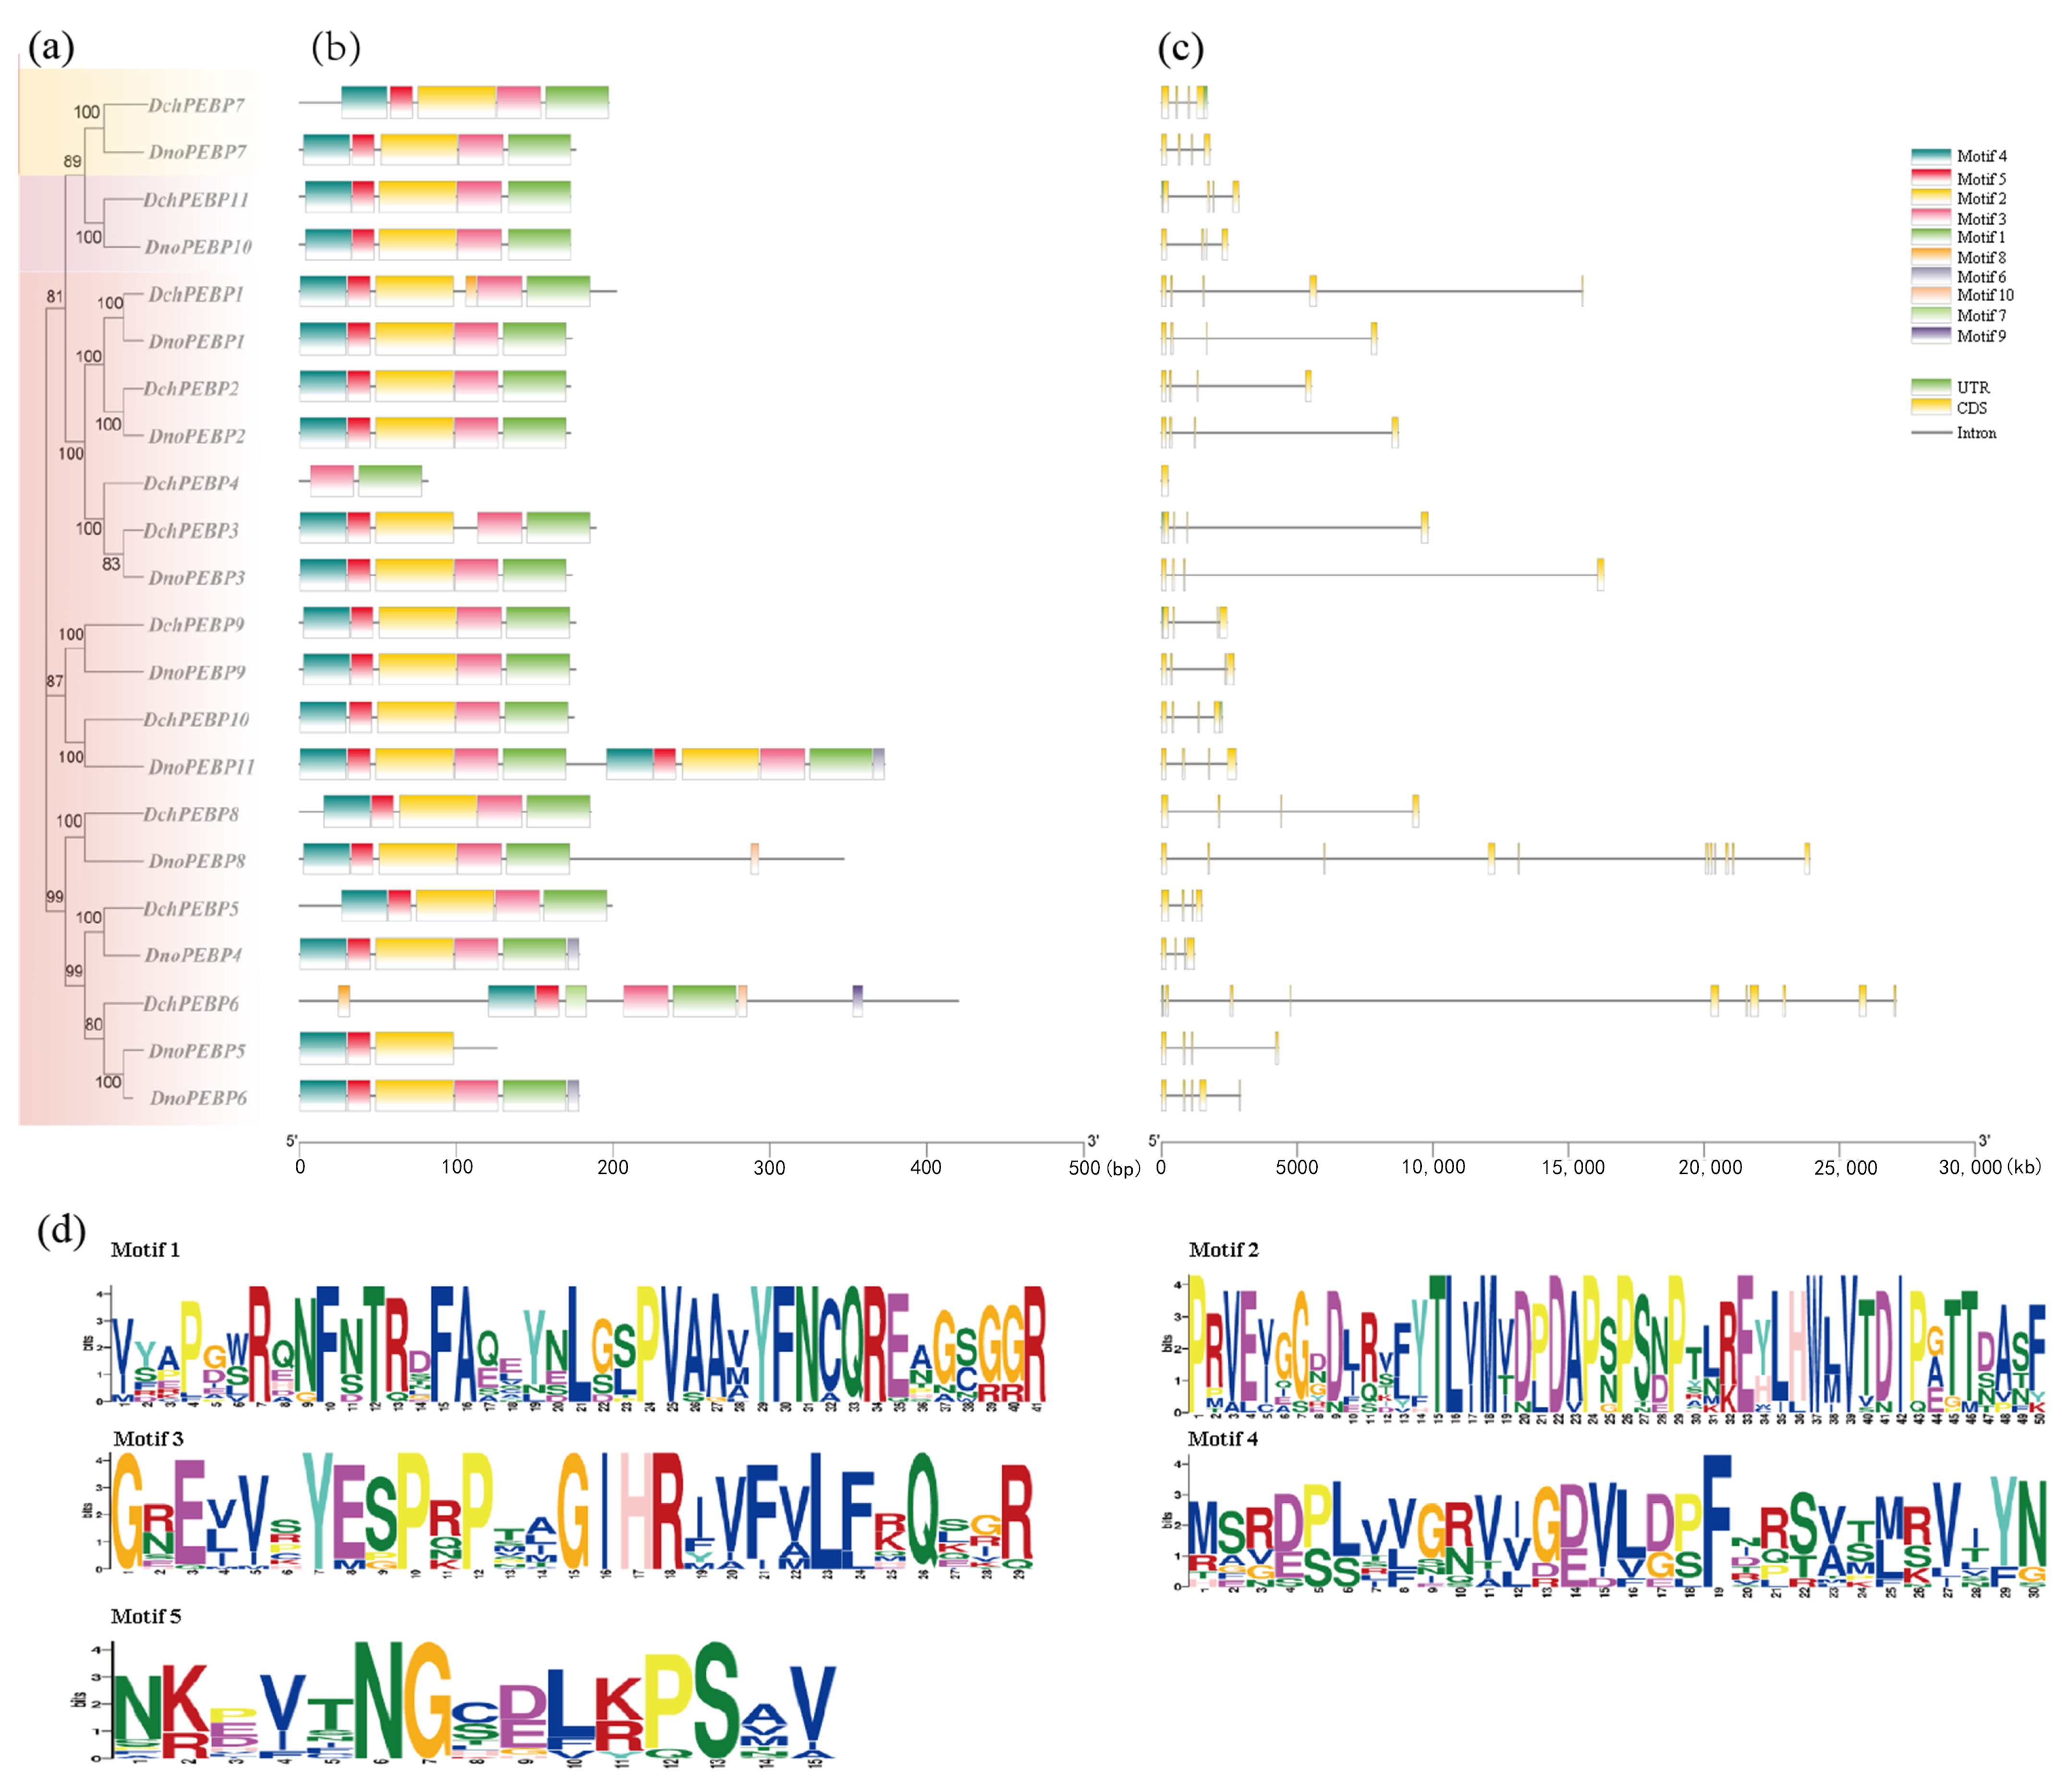
2.3. Phylogenetic Analysis and Conserved Motifs of PEBP Proteins

To study the features of the PEBP proteins, we used the motif-based sequence analysis tools database to analyze the conservative domains of 22 PEBP proteins using Multiple Em for Motif Elicitation (MEME). The conservative domains were set from motif1 to motif10. The sequences of the motifs identified were then characterized (Figure 2b). The distribution of conserved domains among proteins in the same branch was found to be similar. The TFL1 subfamily contains the most complete conserved motif, followed by the MFT subfamily. Motif1 to motif5 are present in the majority of PEBP proteins, suggesting that they may have similar functions. Deletion of motifs varies among subfamilies. DchPEBP4 has only motif1 and motif3, while DnoPEBP5 has motif2, motif4, and motif5. This may result in the loss of some functions (Figure 2d). Moreover, most of the 22 PEBP genes contain 3 introns, although a very limited number have 9 to 10 introns (Figure 2c). The evolutionarily conserved genetic structure of the PEBP gene family showed that 80% of genes have four exons and three introns.

2.4. Genes Expression Analysis of the PEBP Genes

We investigated the regulatory function of PEBPs by searching for cis elements in the promoter region of 22 genes from two Dendrobium species. Throughout the study, we obtained a total of 35 cis elements, for a total of 720 cis elements (Table S2). Ten common elements exist among most PEBPs, with variations providing diverse gene functions. In this study, DchPEBP10 contained 50 cis elements, which is the largest number (Figure 3a). Through analysis of the promoter, it was found that there are typical light response elements AE-box, Box 4, G-box, and TCT-motif on the PEBP promoter. Light responses are photoreactive elements with the largest number (264/720), which indicates that the regulation of PEBP function by light is particularly important. In addition, among the identified elements, hormone response elements related to flowering regulation were found, such as GARE elements. The types and quantities of light response-related elements were the largest, followed by cis elements related to plant hormone regulation and stress-related cis elements (Figure 3b). It is therefore suggested that PEBPs may play a role in resistance to abiotic stress.
According to the characteristics of cis-acting elements, these elements can be divided into three categories: hormone response elements, photoresponse elements, abiotic stress response elements, and others (Figure 3c). The number of photoresponsive elements is significantly higher than that of other regulatory elements. We hypothesized that the PEBPs of D. chrysotoxum and D. nobile play an important role in light response regulation, so we hypothesized that they also play a role in regulating the flowering period.

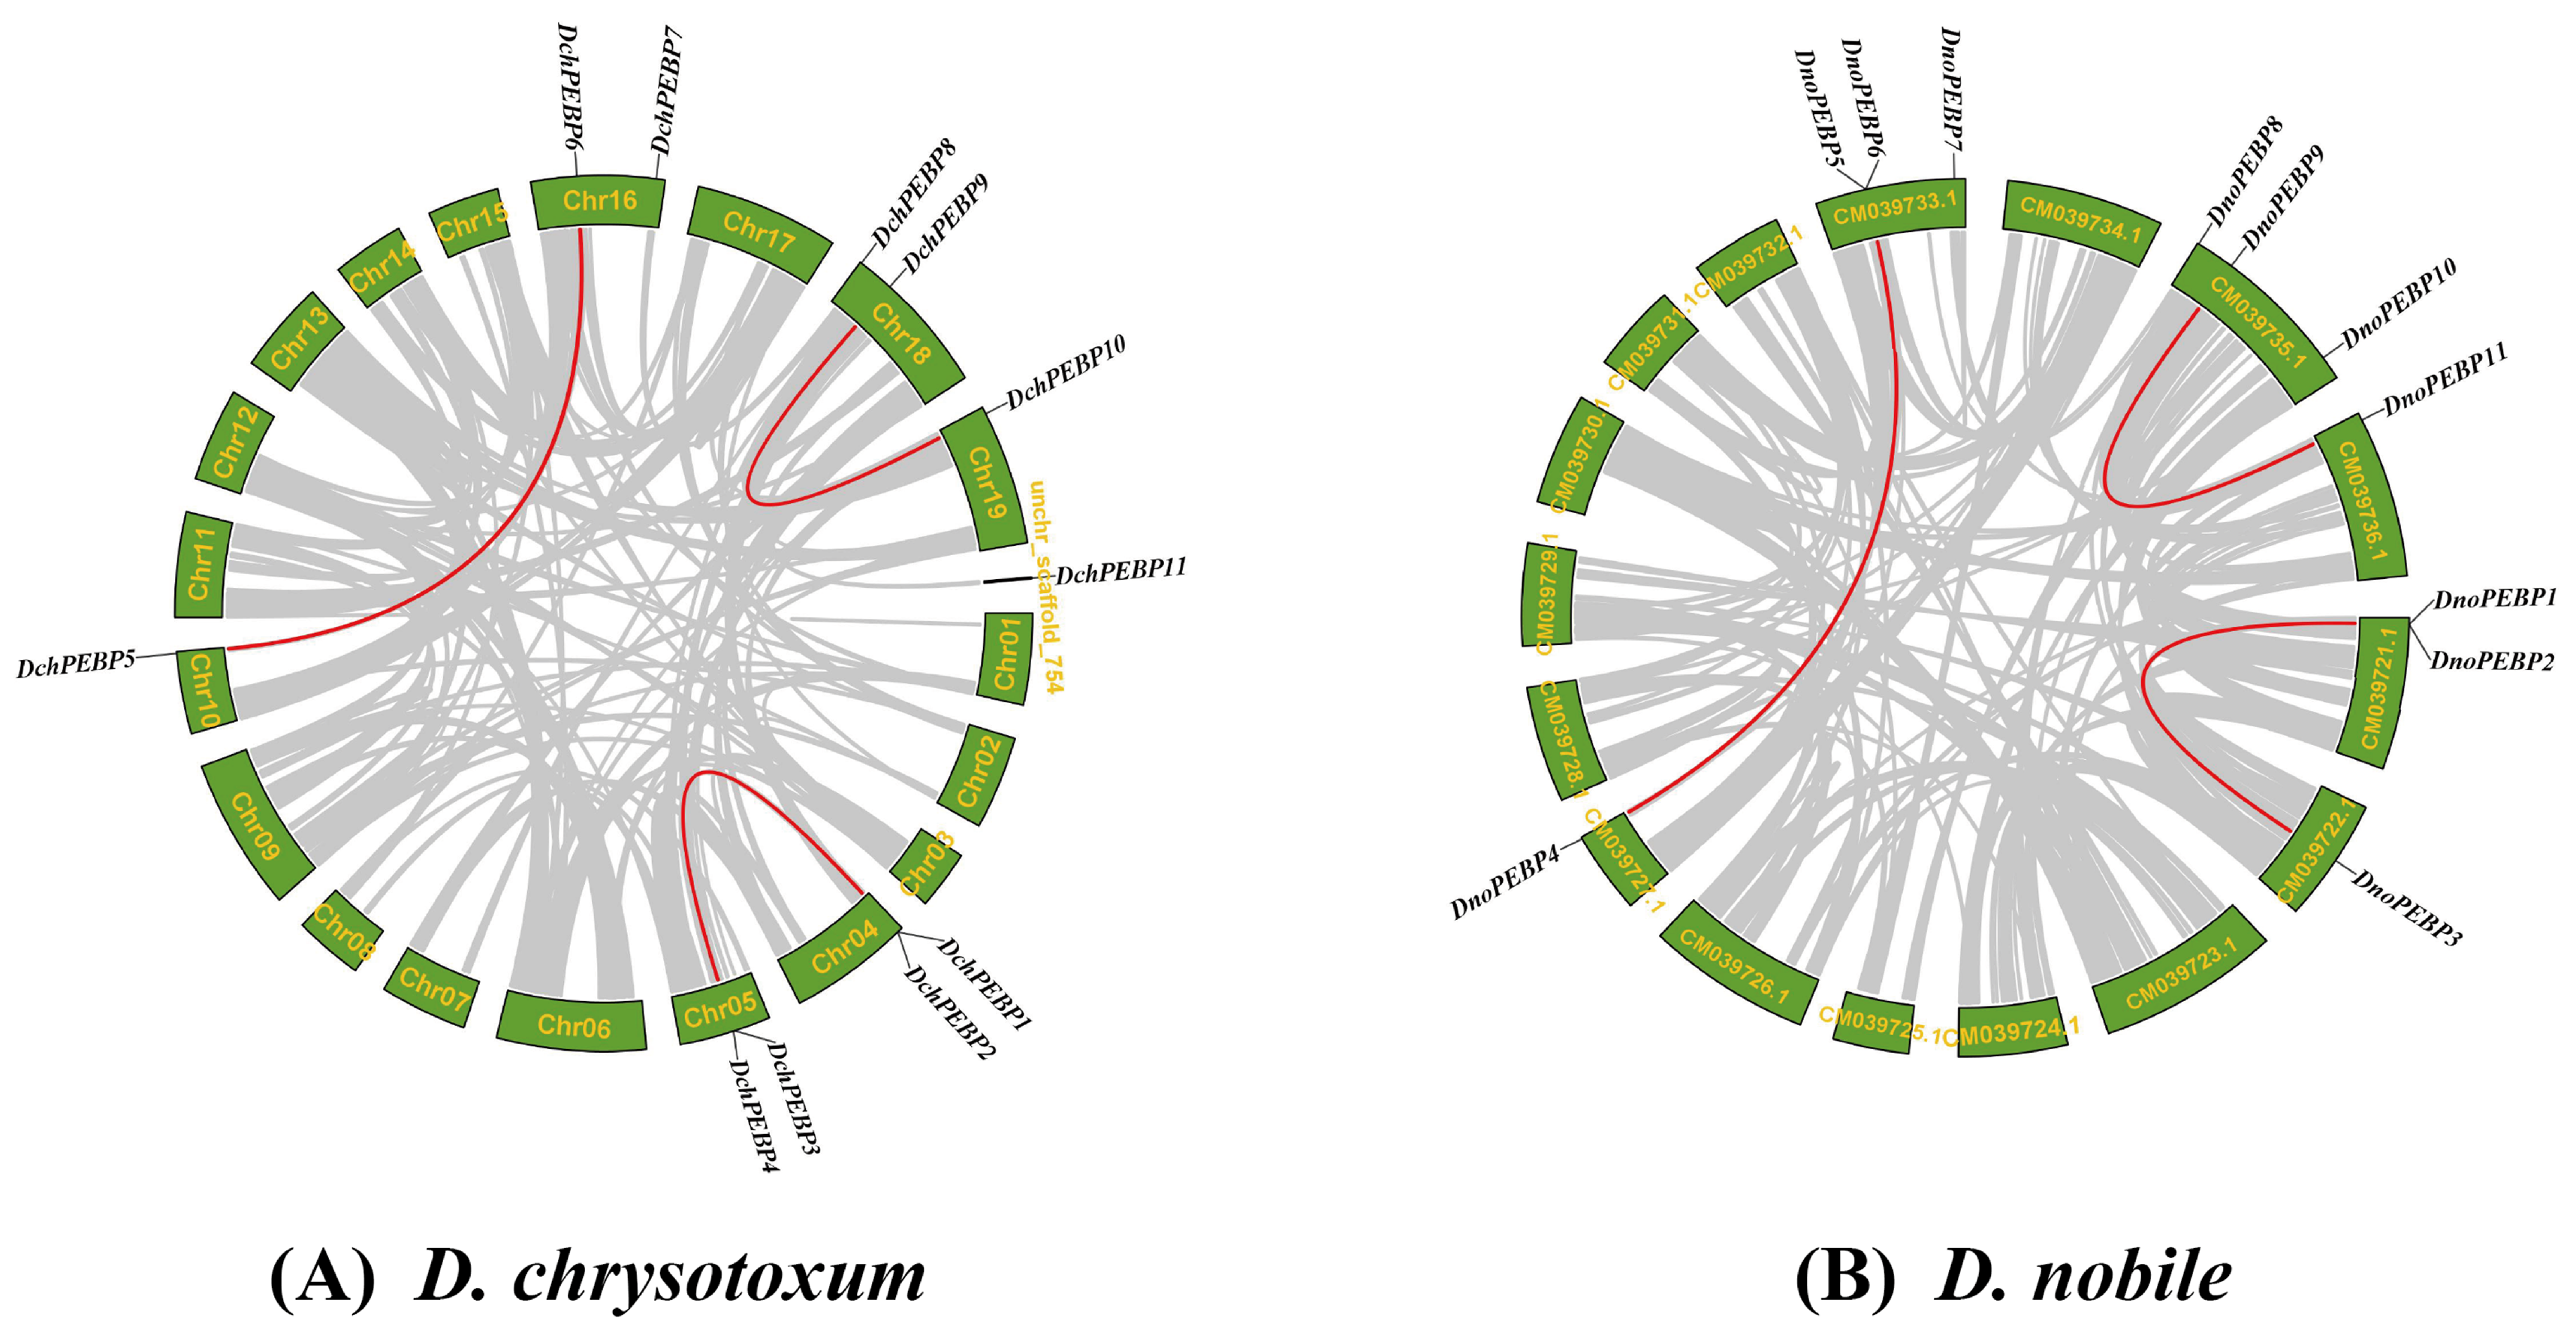
2.5. Chromosomal Localization and Collinearity Analysis of PEBPs

TBtools was used to visualize the distribution of 22 PEBPs on chromosomes. The results showed that the PEBP of the two species of Dendrobium were distributed on different chromosomes (Figure S1). Eleven DchPEBPs were distributed on seven chromosomes, of which DchPEBP11 was distributed on unknown chromosomes. Eleven DnoPEBPs were distributed on six chromosomes. Three pairs of fragment repeat genes were found in D. chrysotoxum (Figure 4A) DchPEBP1 and DchPEBP2, DchPEBP3, and DchPEBP4, among which two pairs were tandem repeats. There were also three pairs of fragment repeats identified in D. nobile (Figure 4B), and interestingly, there were also two pairs of tandem repeats: DnoPEBP1 and DnoPEBP2, DnoPEBP5 and DnoPEBP6. This suggests that a gene replication event occurred during the evolutionary process.

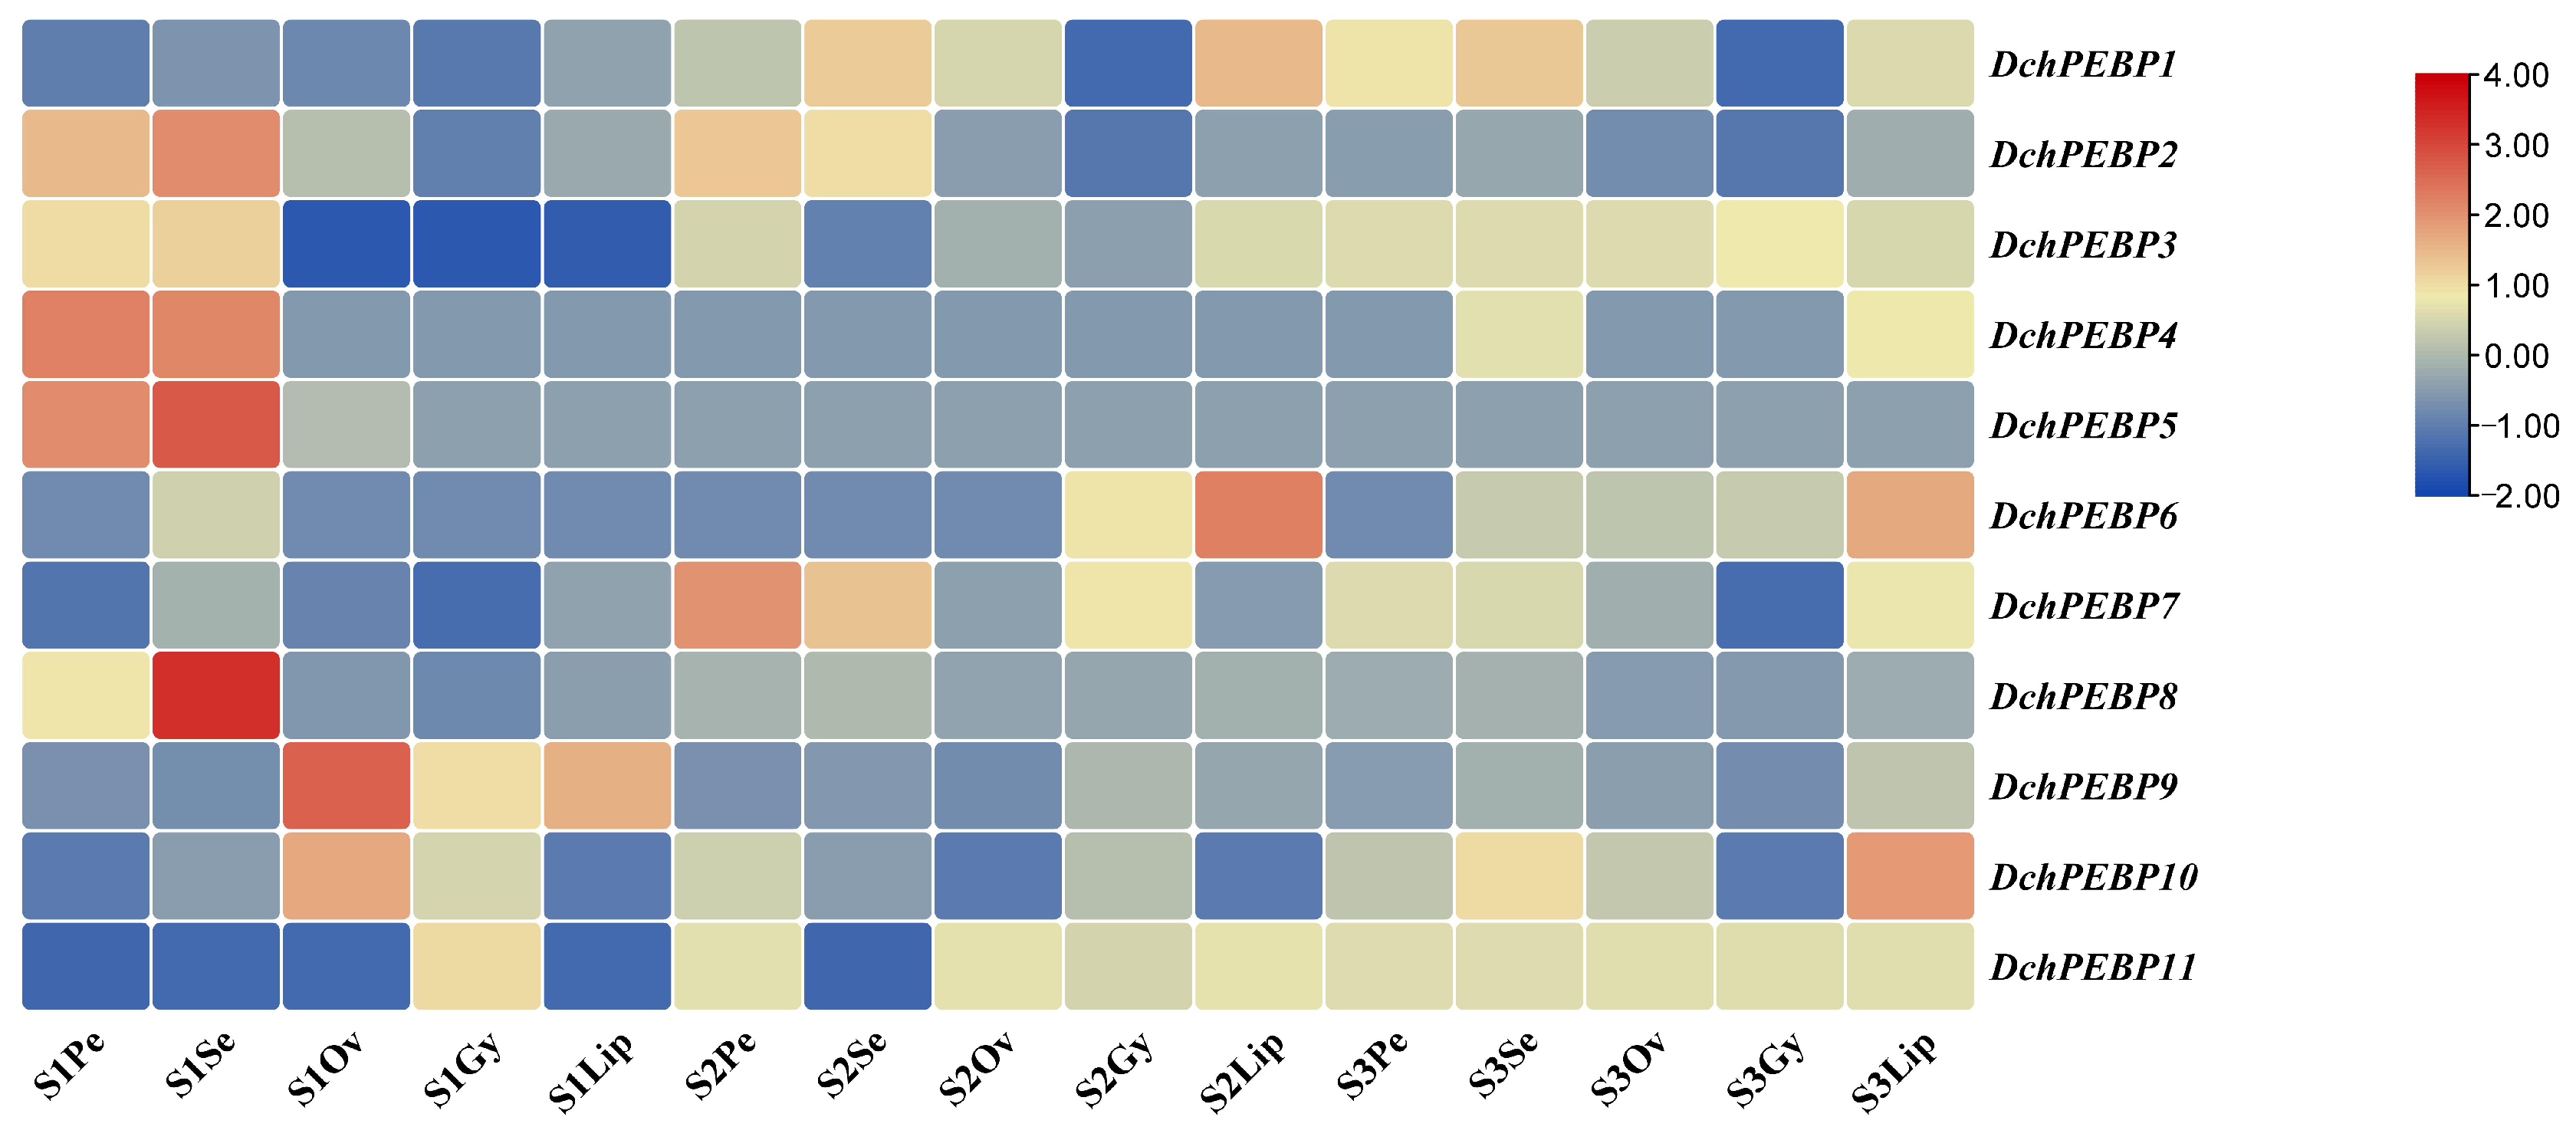
2.6. Expression Patterns of PEBP Genes in D. chrysotoxum

The transcripts are enriched based on their functional gene expression profiles. According to the FPKM value, the expression levels of 11 kinds of DchPEBPs in different parts and development stages (Figure 5) show that DchPEBP7 is highly expressed at the S2 stage compared to the other two stages, DchPEBP8 is highly expressed in the sepal part of the S1 stage, and DchPEBP9 is highly expressed in the ovary part of the S1 stage. DchPEBP3 is highly expressed in the S3 period, and DchPEBP11 is highly expressed in the S1, S2, and S3 periods. DchPEBP7 belongs to the TFL subfamily, and both DchPEBP8 and DchPEBP9 belong to the FTL subfamily and exhibit similar expression patterns during flower development. There were differences in DchPEBP gene expression, which suggested that the DchPEBP gene might have different functions in terms of regulating the flowering of D. chrysotoxum.

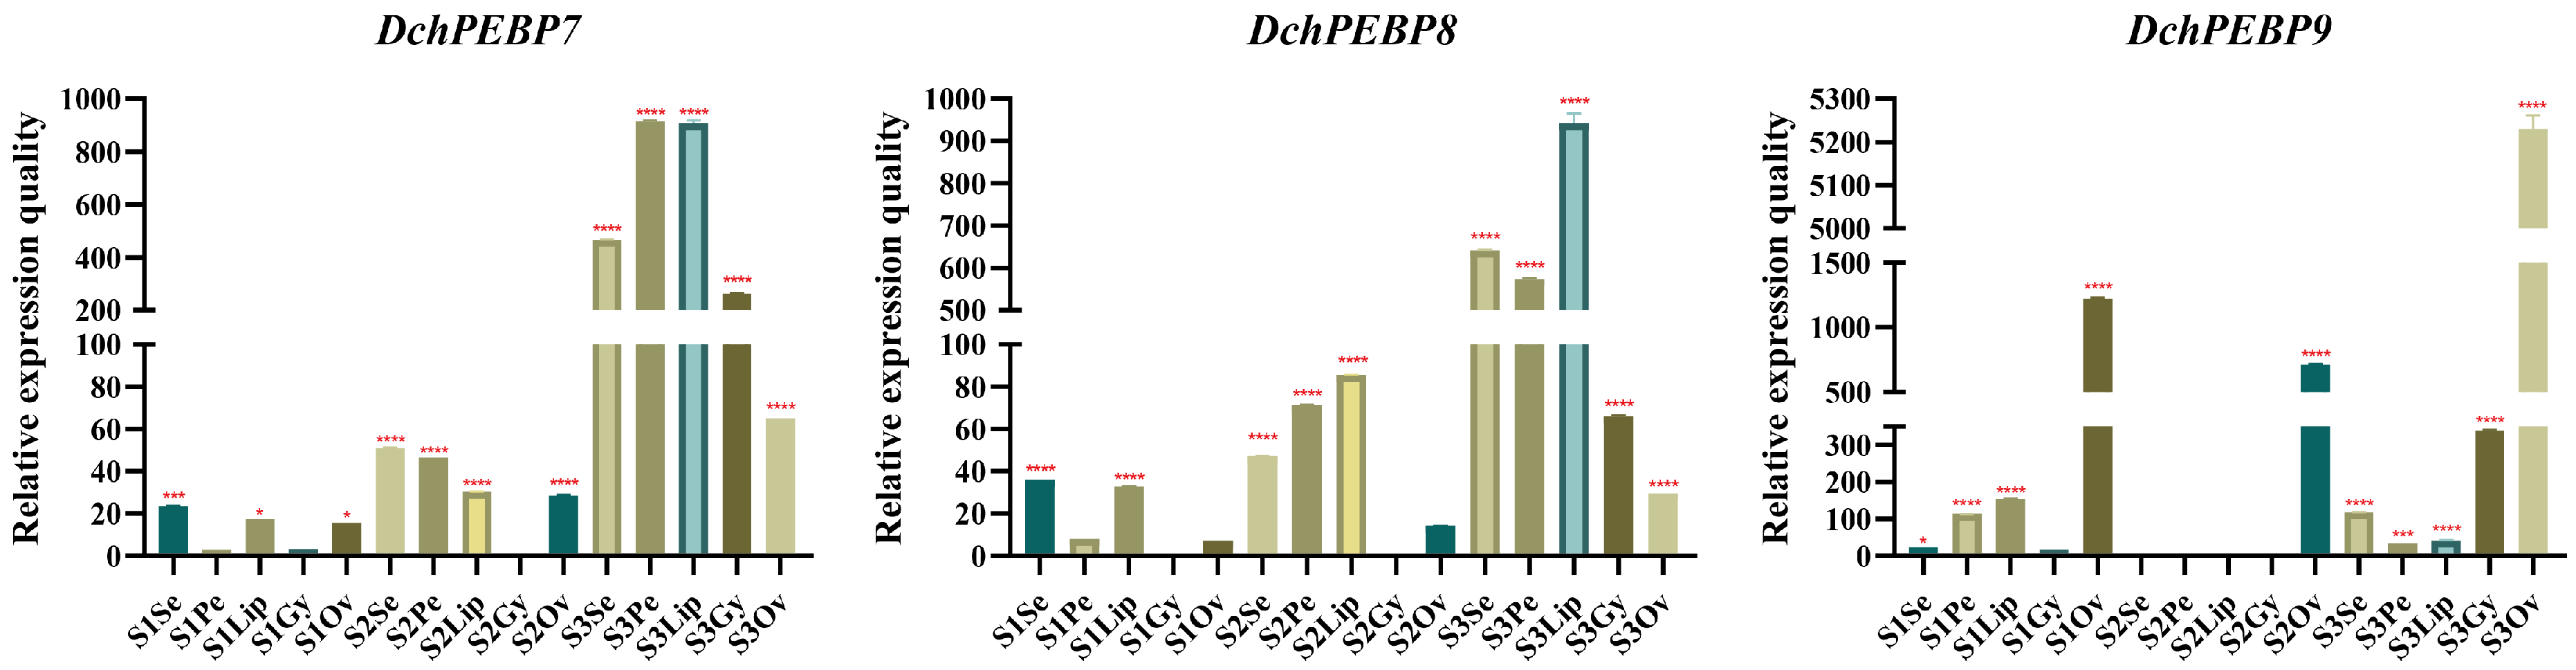
2.7. RT-qPCR Analysis of PEBP Genes in D. chrysotoxum

In order to study the expression patterns of the PEBP gene family in five parts of the D. chrysotoxum during flower development, candidate genes with large expression differences were selected (Figure 6). Two genes from the FT subfamilies DchPEBP8 and DchPEBP9 and TFL subfamily DchPEBP7, which play an important role in flower development, were analyzed quantitatively with real-time PCR (RT-qPCR). The expression of DchPEBP8 and DchPEBP9 genes was up-regulated in petals, ovary, and other parts during S1 and S2, which may be involved in promoting the flowering of D. chrysotoxum. Meanwhile, the expression of DchPEBP7 was up-regulated in various parts of the S3 stage, which may inhibit flowering. The expression of DchPEBP9 was up-regulated in the ovary of S1, S2, and S3, which may be involved in promoting D. chrysotoxum morphogenesis.

3. Discussion

Its members consist of genes that play vital roles in flowering and plant structure [13,28]. The process of gene family formation can be impacted by tandem and fragment duplications [17,29]. Twenty-two chromosomes were found in the D. chrysotoxum and D. nobile and were unevenly distributed across the chromosomes. In these studies, 22 PEBPs were found in the D. chrysotoxum and D. nobile genomes. These PEBP genes were not evenly distributed on these chromosomes, which suggests potential functional similarities and differences between them. By collinear analysis, three collinear pairs of PEBPs were identified in two species of Dendrobium chinensis, respectively, indicating that the PEBP gene had fragment replication. D. chrysotoxum and D. nobile have the same number of genes, the same tandem repeats, similar branches, and similar collinear positions, which indicates that the PEBP protein family has a high degree of similarity in terms of evolutionary relationship and sequence conservation.
Phylogenetic trees were constructed for 45 PEBP domain proteins in D. chrysotoxum, D. nobile, O. sativa, and A. thaliana, revealing subpopulations of genes with similar functions. The number of genes in the PEBP gene family was the same in D. chrysotoxum and D. nobile, and the two species of Dendrobium were more closely related to O. sativa. We also found five conserved motifs of D. chrysotoxum and D. nobile, and the PEBP protein in the same group had similar motifs (Figure 2). These findings suggest that the PEBP gene predates the divergence of monocots and dicots. The MFT and TFL subfamilies all have the same motif1,2,3,4,5. In addition to motif deletion in DchPEBP4, DnoPEBP5, and DchPEBP6, other genes in the FT subfamily contain motif1,2,3,4,5. This may have been caused by evolution. Most of the PEBP genes identified in this study contained four exons and three introns, and all PEBP genes showed a conserved gene structure, supporting close evolutionary relationships. These characteristics may imply functional similarities and differences between PEBP.
Cis-acting regulatory elements in the promoter region regulate gene expression and function, and are common to most PEBPs. These stress, hormone, and photonics-acting elements are common to most PEBPs, and the expression of most PEBPs is induced by ABA, JA, and light. There are typical light response elements AE-box, Box 4, G-box, and TCT-motif, which are analyzed similarly to assessing PbFT expression in pears [30]. The expression of the PbFT gene may be regulated by light and is most abundant in photo-responsive components. Thus, we speculated that the expression of the FT gene in D. chrysotoxum might also be regulated by light. Therefore, these results suggest that PEBPs may be involved in flowering time control, photoresponse, and hormonal response.
On the basis of transcriptome data, and to further analyze the role of the PEBP gene in D. chrysotoxum, we selected three PEBP expressed in D. chrysotoxum for RT-qPCR assay. The expression trend of these genes was similar to that of the transcriptome. The expression of these genes in all the flower organs of D. chrysotoxum S3 was significantly up-regulated. The expression of the PhFT-1 gene in Phalaenopsis ‘V31’ is similar to that found in buds [31]. Furthermore, overexpression of PhFT-1 in transcripts of Arabidopsis causes early flowering. These results suggest that the PhFT-1 transcript may play a role in the flowering process of Phalaenopsis orchids, which supports our hypothesis. Thus, these two genes may play a role in the development of D. chrysotoxum (Figure 6). RT-qPCR results showed that the expression of DchPEBP8 and DchPEBP9 genes was up-regulated in the petals, ovary, and other parts during S1 and S2, which may be involved in promoting the flowering of D. chrysotoxum. Meanwhile, the expression of DchPEBP7 was up-regulated during various parts of the S3 stage, which may inhibit flowering. In apple (Malus domestica Borkh), MdFT1 and MdFT2 are specifically expressed in the terminal bud and flower organs, respectively, and MdFT1 and MdFT2 may play an upstream role in regulating apple flowering [32]. The PEBP gene family has been studied, and the expression of the OnFT gene was found to be highest in axillary bud and bud organs, followed by that in the stem, with the lowest level in the root [33]. The gene known as FT is found in cauliflower’s stem, bud, and silique tissues, while the TFL1 gene is more commonly expressed in the reproductive organs and has the highest level of transcription in the silique and curd tissues, respectively. It is possible that the TFL1 gene’s high expression in the curd may have inhibited the expression of the flowering induction genes such as FT and TSF [34], which is consistent with our conclusion that high expression of DchPEBP7 may inhibit flowering. The high expression of DoFT in the gynandrium of D. ‘Chao Praya Smile’ indicates that DoFT is a necessary gene for orchid reproductive development [18]. This is similar to our hypothesis that the expression of DchPEBP9 was up-regulated in the ovary of S1, S2, and S3, which may be involved in promoting D. chrysotoxum morphogenesis. Studies have shown that FT genes induce flowering in plants. The principal function of TFL1 is to inhibit flower formation and maintain the infinite growth of the inflorescence meristem [35].

4. Materials and Methods

4.1. Plant Materials

The plant material selected for this study was obtained from wild types grown under natural conditions in the greenhouse of the Forest Orchid Garden of Fujian Agriculture and Forestry University. The plants were grown at an altitude of 10 m, and the temperature ranged between 25 °C and 30 °C. Samples of the flower parts (sepal, Se; petal, Pe; lip, Lip; and gynostemium, Gy) for each of the three flower development stages (S1: unpigmented bud stage; S2: pigmented bud stage; S3: initial bloom stage) of D. chrysotoxum and D. nobile (Sequences in Figure S1) were sampled with liquid nitrogen and stored in a refrigerator at −80 °C.

4.2. Identification and Physicochemical Properties of the PEBPs

The genome files for the two Dendrobium species were compared using TBtools v2.008 and Blast Compare Two Seqs, with 6 AthPEBPs (PEBP genes of A. thaliana) as probes (E-value, 1 × 10⁻⁵) [36,37], and the possible sequences obtained were blasted again (https://blast.ncbi.nlm.nih.gov/Blast.cgi?PROGRAM=blastp&PAGE_TYPE=BlastSearch&LINK_LOC=blasthome, accessed on 11 September 2023) in NCBI. To identify the conserved domains of PEBP, we downloaded the relevant data from an online database [3] (http://pfam.xfam.org/, accessed on 11 September 2023) and conducted an HMMER search using default parameters. The genes obtained from this search were then analyzed using NCBI Batch CDD (https://www.ncbi.nlm.nih.gov/Structure/bwrpsb/bwrpsb.cgi, accessed on 11 September 2023). We aimed to identify and retain only the genes with complete PEBP domains, based on the results of the Blast and HMMER searches [38]. The physical and chemical properties of the proteins were analyzed using the online analysis software ExPASy (https://www.expasy.org/, accessed on 11 September 2023). This included examining important metrics, such as protein length, isoelectric point (pI), molecular weight (MW), hydrophilic large average (GRAVY), instability index (II), and fat index (AI) [39].

4.3. Phylogenetic Analysis

This study compared 11 PEBP proteins of D. chrysotoxum (DchPEBP), 11 PEBP proteins of D. nobile (DnoPEBP), 6 PEBP proteins of A. thaliana (AthPEBP), and 19 PEBP proteins of O. sativa (OsPEBP) introduced into the ClustalW program in MEGA 7.0 [10,40]. with Gap Opening and Gap Extend values of 15 and 6.66, respectively, and the DNA Weight Matrix selection was set to IUB. The Phylogeny test was performed using 500 replications of the bootstrap method [41]. The resulting phylogenetic tree was then improved and beautified using the online software Evloview 3.0 (https://www.evolgenius.info/evolview-v2/#mytrees/1/2, accessed on 16 September 2023) [42].

4.4. Protein Conservative Domain and Gene Structure Analysis

The conserved motifs of PEBP proteins from D. chrysotoxum and D. nobile were analyzed using the MEME online software (https://meme-suite.org/meme/tools/meme/, accessed on 11 September 2023)with the prediction number set to ten [43]. Additionally, TBtools v2.008 was utilized to integrate gene structures, conserved protein motifs, and phylogenetic trees for general comparative mapping purposes. The software proved to be a valuable tool in this process.

4.5. Collinearity and Location Analysis on Chromosome

We used TBtools v2.008 software to extract the location information of the PEBP genes from the genome and gene annotation files of D. chrysotoxum and D. nobile. This helped us to construct a physical map of the PEBPs from both Dendrobium species detailing their respective chromosomes. To analyze collinearity, we compared the genome data of both species using the One Step MCScanx program in TBtools v2.008. Finally, we visualized the duplication patterns in both Dendrobium species using the One Step MCScanx program and Advance Circos.

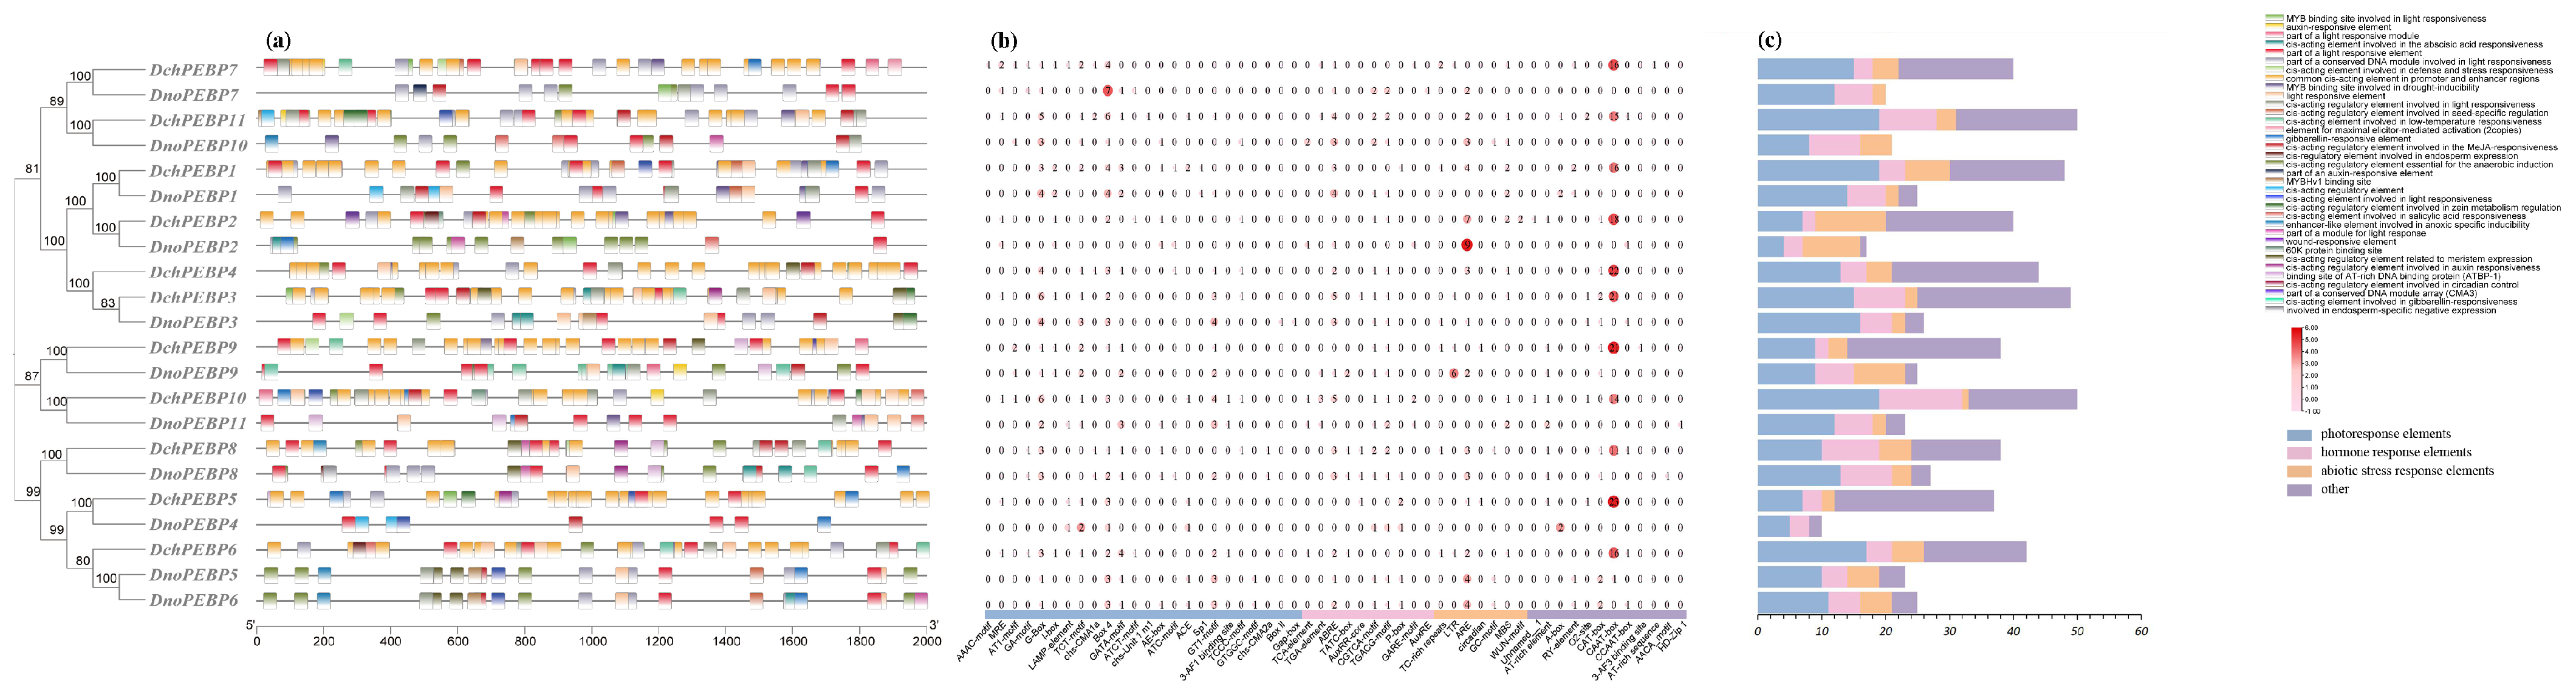
4.6. Promoter Element Analysis of PEBPs

We utilized TBtools to extract a 2000 bp gene sequence located upstream of the promoter codon from the genomes of two Dendrobium species. This was performed in order to identify potential cis-elements present in the promoter [14]. To analyze cis-regulatory elements in the promoter region of PEBPs in the two species of Dendrobium, we employed PlantCARE online software (https://bioinformatics.psb.ugent.be/webtools/plantcare/html/, accessed on 12 September 2023). Finally, we processed and sorted the data using Excel 2020 software before visualizing it with TBtools v2.008.

4.7. Expression Pattern and RT-qPCR Analysis

To investigate the expression pattern of the PEBPs during floral development in D. chrysotoxum, we used RNA-Seq by Expectation Maximization (RSEM) [44] for transcription quantification. We calculated the fragments per kilobase per million mapped reads (FPKM) for each gene and established the transcriptome database of flower parts at different stages (three replicates were set for each sample). Finally, we created a heat map using TBtools based on the FPKM values.
The expression pattern of the PEBPs was analyzed using RT-qPCR. Total RNA was extracted from the flower parts of D. chrysotoxum during three periods of flowering using a FastPure Plant Total RNA Isolation Kit (for polysaccharide- and polyphenol-rich tissues) from Vazyme Biotech Co., Ltd., Nanjing, China. First-strand DNA was synthesized with TransScript® All-in-One First-Strand cDNA Synthesis SuperMix for quantitative PCR (TransGen Biotech, Beijing, China). Primers for candidate and internal reference genes for RT-qPCR were designed using Primer Premier 5.0 software. Primer specificity was confirmed using a primer blast on the NCBI website. RT-qPCR assays were performed using Hieff® qPCR SYBR Green Master Mix (Low Rox Plus) from Yeasen Biotechnology (Shanghai) Co., Ltd., Shanghai, China. The Maker75111 served as the reference gene (Table S4). Finally, the relative expression of the target genes was calculated using the 2−ΔΔCT method (using Gy2 as a reference). The expression data were the mean of the three biological replicates [45].

5. Conclusions

We have identified 11 DchPEBPs and 11 DnoPEBPs in two species of Dendrobium, which have been classified into three subfamilies based on their phylogenetic relationships. The PEBP genes in these two species have been analyzed for their genome-wide identification, phylogeny, functional classification, gene structure, motif composition, and chromosomal localization. Our research highlighted the varying transcription patterns of DchPEBPs in different parts of the flower during its development. We found that DchPEBP8 and DchPEBP9 may regulate downstream genes to promote flowering, while DchPEBP7 may inhibit flowering. Our findings provide crucial insights for further studies on the regulatory mechanisms and functional roles of PEBP genes in different parts of Dendrobium flower development.

Supplementary Materials

The following supporting information can be downloaded at: https://www.mdpi.com/article/10.3390/ijms242417463/s1.

Author Contributions

M.-M.Z. finalized the manuscript and integrated all other author’s comments; X.Z., X.H., Q.Z. and Y.H. provided the data; Y.L. and S.K. analyzed the data; S.L. and Z.-J.L. conceived of the study, coordinated with all the co-authors, and supervised the whole project. All authors have read and agreed to the published version of the manuscript.

Funding

This work was supported by the Forestry Peak Discipline Construction Project of Fujian Agriculture and Forestry University (72202200205).

Institutional Review Board Statement

Not applicable.

Informed Consent Statement

Not applicable.

Data Availability Statement

The sequence data used in the study can be found in Table S1. The AthPEBP sequences were downloaded from PlantTFDB (http://planttfdb.gao-lab.org/, accessed on 11 August 2023) and OsPEBP sequences were downloaded from NCBI (https://www.ncbi.nlm.nih.gov/, accessed on 11 August 2023).

Conflicts of Interest

The authors declare no conflict of interest.

References

  1. Banfield, M.J.; Barker, J.J.; Perry, A.C.; Brady, R.L. Function from structure? The crystal structure of human phosphatidylethanolamine-binding protein suggests a role in membrane signal transduction. Structure 1998, 6, 1245–1254. [Google Scholar] [CrossRef]
  2. Jin, S.; Nasim, Z.; Susila, H.; Ahn, J.H. Evolution and functional diversification of flowering locus t/terminal flower 1 family genes in plants. Semin. Cell Dev. Biol. 2021, 109, 20–30. [Google Scholar] [CrossRef]
  3. Blázquez, M.A.; Ahn, J.H.; Weigel, D. A thermosensory pathway controlling flowering time in Arabidopsis thaliana. Nat. Genet. 2003, 3, 168–171. [Google Scholar] [CrossRef]
  4. Mutasa-Göttgens, E.; Hedden, P. Gibberellin as a factor in floral regulatory networks. J. Exp. Bot. 2009, 60, 1979–1989. [Google Scholar] [CrossRef] [PubMed]
  5. Amasino, R. Seasonal and developmental timing of flowering. Plant J. 2010, 61, 1001–1013. [Google Scholar] [CrossRef] [PubMed]
  6. Andrés, F.; Coupland, G. The genetic basis of flowering responses to seasonal cues. Nat. Rev. Genet. 2012, 13, 627–639. [Google Scholar] [CrossRef] [PubMed]
  7. Bernier, I.; Jollès, P. Purification and characterization of a basic 23 kDa cytosolic protein from bovine brain. Biochim. Biophys. Acta 1984, 790, 174–181. [Google Scholar] [CrossRef] [PubMed]
  8. Bernier, I.; Tresca, J.P.; Jollès, P. Ligand-binding studies with a 23 kDa protein purified from bovine brain cytosol. Biochim. Biophys. Acta 1986, 871, 19–23. [Google Scholar] [CrossRef] [PubMed]
  9. Serre, L.; de Jesus, K.P.; Zelwer, C.; Bureaud, N.; Schoentgen, F.; Bénédetti, H. Crystal structures of YBHB and YBCL from Escherichia coli, two bacterial homologues to a Raf kinase inhibitor protein. J. Mol. Biol. 2001, 310, 617–634. [Google Scholar] [CrossRef] [PubMed]
  10. Chautard, H.; Jacquet, M.; Schoentgen, F.; Bureaud, N.; Benedetti, H. Tfs1p, a member of the PEBP family, inhibits the Ira2p but not the Ira1p Ras GTPase-activating protein in Saccharomyces cerevisiae. Eukaryotic Cell 2004, 3, 459–470. [Google Scholar] [CrossRef] [PubMed]
  11. Banfield, M.J.; Brady, R.L. The structure of Antirrhinum centroradialis protein (CEN) suggests a role as a kinase regulator. J. Mol. Biol. 2000, 297, 1159–1170. [Google Scholar] [CrossRef]
  12. Simister, P.C.; Banfield, M.J.; Brady, R.L. The crystal structure of PEBP-2, a homologue of the PEBP/RKIP family. Acta Crystallogr. D 2002, 58, 1077–1080. [Google Scholar] [CrossRef]
  13. Karlgren, A.; Gyllenstrand, N.; Källman, T.; Sundström, J.F.; Moore, D.; Lascoux, M.; Lagercrantz, U. Evolution of the pebp gene family in plants: Functional diversification in seed plant evolution. Plant Physiol. 2011, 156, 1967–1977. [Google Scholar] [CrossRef]
  14. Corbesier, L.; Vincent, C.; Jang, S.; Fornara, F.; Fan, Q.; Searle, I.; Giakountis, A.; Farrona, S.; Gissot, L.; Turnbull, C.; et al. Ft protein movement contributes to long-distance signaling in floral induction of arabidopsis. Science 2007, 316, 1030–1033. [Google Scholar] [CrossRef]
  15. Kobayashi, Y.; Kaya, H.; Goto, K.; Iwabuchi, M.; Araki, T. A pair of related genes with antagonistic roles in mediating flowering signals. Science 1999, 286, 1960–1962. [Google Scholar] [CrossRef]
  16. Hedman, H.; Källman, T.; Lagercrantz, U. Early evolution of the MFT-like gene family in plants. Plant Mol.Biol. 2009, 70, 359–369. [Google Scholar] [CrossRef]
  17. Wickland, D.P.; Hanzawa, Y. The flowering locus t/terminal flower 1 gene family: Functional evolution and molecular mechanisms. Mol. Plant 2015, 8, 983–997. [Google Scholar] [CrossRef] [PubMed]
  18. Wang, Y.; Liu, L.; Song, S.; Li, Y.; Shen, L.; Yu, H. DOFT and DOFTIP1 affect reproductive development in the orchid Dendrobium chao praya smile. J. Exp. Bot. 2017, 68, 5759–5772. [Google Scholar] [CrossRef] [PubMed]
  19. Zheng, J.; Ma, Y.; Zhang, M.; Lyu, M.; Yuan, Y.; Wu, B. Expression Pattern of FT/TFL1 and miR156-Targeted SPL Genes Associated with Developmental Stages in Dendrobium catenatum. Int. J. Mol. Sci. 2019, 20, 2725. [Google Scholar] [CrossRef] [PubMed]
  20. Givnish, T.J.; Spalink, D.; Ames, M.; Lyon, S.P.; Hunter, S.J.; Zuluaga, A.; Iles, W.J.; Clements, M.A.; Arroyo, M.T.; Leebens-Mack, J.; et al. Orchid phylogenomics and multiple drivers of their extraordinary diversification. Proc. Biol. Sci. 2015, 282, 20151553. [Google Scholar] [CrossRef] [PubMed]
  21. Leitch, I.J.; Kahandawala, I.; Suda, J.; Hanson, L.; Ingrouille, M.J.; Chase, M.W.; Fay, M.F. Genome size diversity in orchids: Consequences and evolution. Ann. Bot. 2009, 104, 469–481. [Google Scholar] [CrossRef]
  22. Kaneko-Suzuki, M.; Kurihara-Ishikawa, R.; Okushita-Terakawa, C.; Kojima, C.; Nagano-Fujiwara, M.; Ohki, I.; Tsuji, H.; Shimamoto, K.; Taoka, K.I. TFL1-Like Proteins in Rice Antagonize Rice FT-Like Protein in Inflorescence Development by Competition for Complex Formation with 14-3-3 and FD. Plant Cell Physiol. 2018, 59, 458–468. [Google Scholar] [CrossRef] [PubMed]
  23. Komiya, R.; Ikegami, A.; Tamaki, S.; Yokoi, S.; Shimamoto, K. Hd3a and RFT1 are essential for flowering in rice. Development 2008, 135, 767–774. [Google Scholar] [CrossRef] [PubMed]
  24. Mimida, N.; Komori, S.; Suzuki, A.; Wada, M. Functions of the apple tfl1/ft orthologs in phase transition. Sci. Hortic. 2013, 156, 106–112. [Google Scholar] [CrossRef]
  25. Carmona, M.J.; Calonje, M.; Martínez-Zapater, J.M. The FT/TFL1 gene family in grapevine. Plant Mol. Biol. 2007, 63, 637–650. [Google Scholar] [CrossRef] [PubMed]
  26. Danilevskaya, O.N.; Meng, X.; Hou, Z.; Ananiev, E.V.; Simmons, C.R. A Genomic and Expression Compendium of the Expanded PEBP Gene Family from Maize. Plant Physiol. 2008, 146, 250–264. [Google Scholar] [CrossRef] [PubMed]
  27. Song, C.; Li, G.; Dai, J.; Deng, H. Genome-Wide Analysis of PEBP Genes in Dendrobium huoshanense: Unveiling the Antagonistic Functions of FT/TFL1 in Flowering Time. Front. Genet. 2021, 12, 687689. [Google Scholar] [CrossRef] [PubMed]
  28. Liu, Y.Y.; Yang, K.Z.; Wei, X.X.; Wang, X.Q. Revisiting the phosphatidylethanolamine-binding protein (PEBP)gene family reveals cryptic FLOWERING LOCUS T gene homologs in gymnosperms and sheds new light on functional evolution. New Phytol. 2016, 212, 730–744. [Google Scholar] [CrossRef]
  29. Cannon, S.B.; Mitra, A.; Baumgarten, A.; Young, N.D.; May, G. The roles of segmental and tandem gene duplication in the evolution of large gene families in Arabidopsis thaliana. BMC Plant Biol. 2004, 4, 10. [Google Scholar] [CrossRef]
  30. Zhao, S.; Wei, Y.; Pang, H.; Xu, J.; Li, Y.; Zhang, H.; Zhang, J.; Zhang, Y. Genome-wide identification of the PEBP genes in pears and the putative role of PbFT in flower bud differentiation. PeerJ 2020, 8, e8928. [Google Scholar] [CrossRef]
  31. Zhou, S.; Jiang, L.; Guan, S.; Gao, Y.; Gao, Q.; Wang, G.; Duan, K. Expression profiles of five FT-like genes and functional analysis of PhFT-1 in a Phalaenopsis hybrid. Electron. J. Biotechnol. 2018, 31, 75–83. [Google Scholar] [CrossRef]
  32. Kotoda, N.; Hayashi, H.; Suzuki, M.; Igarashi, M.; Hatsuyama, Y.; Kidou, S.I.; Igasaki, T.; Nishiguchi, M.; Yano, K.; Shimizu, T.; et al. Molecular characterization of FLOWERING LOCUS T-like genes of apple (Malus × domestica Borkh.). Plant Cell Physiol. 2010, 4, 561–575. [Google Scholar] [CrossRef] [PubMed]
  33. Hou, C.J.; Yang, C.H. Functional analysis of FT and TFL1 orthologs from orchid(Oncidium Gower Ramsey) that regulate the vegetative reproductive transition. Plant Cell Physiol. 2009, 50, 1544–1557. [Google Scholar] [CrossRef] [PubMed]
  34. Sheng, X.; Zhao, Z.; Wang, J.; Yu, H.; Shen, Y.; Gu, H. Identification of Brassica oleracea orthologs of the PEBP family and their expression patterns in curd development and flowering in cauliflower. Biotechnol. Biotechnol. Equip. 2020, 34, 605–613. [Google Scholar] [CrossRef]
  35. Holub, E.B. The arms race is ancient history in Arabidopsis, the wildflower. Nat. Rev. Genet. 2001, 2, 516–527. [Google Scholar] [CrossRef] [PubMed]
  36. Danilevskaya, O.N.; Meng, X.; Ananiev, E.V. Concerted modification of flowering time and inflorescence architecture by ectopic expression of TFL1-like genes in maize. Plant Physiol. 2010, 153, 238–251. [Google Scholar] [CrossRef]
  37. Chen, C.; Chen, H.; He, Y.; Xia, R. TBtools, a toolkit for biologists integrating various biological data handling tools with a user-friendly interface. bioRxiv 2018, bioRxiv:289660. [Google Scholar] [CrossRef]
  38. Chen, C.; Chen, H.; Zhang, Y.; Thomas, H.R.; Frank, M.H.; He, Y.; Xia, R. TBtools: An integrative toolkit developed for interactive analyses of big biological data. Mol. Plant 2020, 13, 1194–1202. [Google Scholar] [CrossRef]
  39. Duvaud, S.; Gabella, C.; Lisacek, F.; Stockinger, H.; Ioannidis, V.; Durinx, C. Expasy, the Swiss bioinformatics resource portal, as designed by its users. Nucleic Acids Res. 2021, 49, W216–W227. [Google Scholar] [CrossRef]
  40. Kumar, S.; Stecher, G.; Tamura, K. MEGA7: Molecular evolutionary genetics analysis version 7.0 for bigger datasets. Mol. Biol. Evol. 2016, 33, 1870–1874. [Google Scholar] [CrossRef]
  41. Chen, J.; Bi, Y.-Y.; Wang, Q.-Q.; Liu, D.-K.; Zhang, D.; Ding, X.; Liu, Z.-J.; Chen, S.-P. Genome-wide identification and analysis of anthocyanin synthesis-related R2R3-MYB genes in Cymbidium goeringii. Front. Plant Sci. 2022, 13, 1002043. [Google Scholar] [CrossRef] [PubMed]
  42. He, Z.; Zhang, H.; Gao, S.; Lercher, M.J.; Chen, W.H.; Hu, S. Evolview v2: An online visualization and management tool for customized and annotated phylogenetic trees. Nucleic Acids Res. 2016, 44, W236–W241. [Google Scholar] [CrossRef] [PubMed]
  43. Bailey, T.L.; Boden, M.; Buske, F.A.; Frith, M.; Grant, C.E.; Clementi, L.; Ren, J.; Li, W.W.; Noble, W.S. MEME suite: Tools for motif discovery and searching. Nucleic Acids Res. 2009, 37, 202–208. [Google Scholar] [CrossRef] [PubMed]
  44. Li, B.; Dewey, C.N. RSEM: Accurate transcript quantification from RNA-seq data with or without a reference genome. BMC Bioinform. 2011, 12, 323. [Google Scholar] [CrossRef]
  45. Livak, K.J.; Schmittgen, T.D. Analysis of relative gene expression data using real-time quantitative PCR and the 2(-Delta Delta C(T)) Method. Methods 2001, 25, 402–408. [Google Scholar] [CrossRef]
Figure 1. Phylogenetic tree of PEBPs in four plants. The PEBP gene family is divided into five subfamilies (I–V), and the IV and V subfamily does not contain the PEBPs of D. chrysotoxum and D. nobile. The PEBP protein sequence of D. chrysotoxum and D. nobile can be obtained in Table S1.
Ijms 24 17463 g001
Figure 2. Phylogenetic relationships, motif, and structure of PEBPs in D. chrysotoxum and D. nobile. (a) MEGA7.0 was used to construct a phylogenetic tree of 22 PEBPs; (b) used the conserved motif of the predicted PEBP proteins on MEME; (c) gene structure of the PEBPs of D. chrysotoxum and D. nobile; (d) conserved domains of D. chrysotoxum and D. nobile species protein sequences.
Ijms 24 17463 g002
Figure 3. Regulatory elements in the promotor region of two Dendrobium species. (a) The cis-acting elements of D. chrysotoxum; (b) the number of cis-acting elements in the promoter region; (c) count the number of photoresponse elements, hormone response elements, abiotic stress response elements, and others for each PEBP gene. The captions are marked on the right, and the types and quantities of cis-acting elements are shown in Table S2.
Ijms 24 17463 g003
Figure 4. Synteny analysis of PEBPs in two Dendrobium species. (A) Synteny analysis of DchPEBPs. (B) Synteny analysis of DnoPEBPs. Red lines represent segmentally duplicated gene pairs.
Ijms 24 17463 g004
Figure 5. The expression pattern of PEBPs in the floral component of D. chrysotoxum. Expression pattern of PEBPs in flower components (Pe: petals; Se: sepals; Ov: ovary, Lip: Lip; Gy: gynostemium) of D. chrysotoxum at three flower development stages (S1: unpigmented bud stage; S2: pigmented bud stage; S3: initial bloom stage). The FPKM values of PEBPs are in Table S3.
Ijms 24 17463 g005
Figure 6. Real-time reverse transcription quantitative PCR (RT-qPCR) verifies the effect of PEBPs on flower organ development. Y-axis represents relative expression values (2−ΔΔCT). Bars represent the mean values of three technical replicates ± SE. The red asterisk indicates the p value in the significance test (* p < 0.05, *** p < 0.001, **** p < 0.0001).
Ijms 24 17463 g006
Disclaimer/Publisher’s Note: The statements, opinions and data contained in all publications are solely those of the individual author(s) and contributor(s) and not of MDPI and/or the editor(s). MDPI and/or the editor(s) disclaim responsibility for any injury to people or property resulting from any ideas, methods, instructions or products referred to in the content.

