
Investigating the Influence of Morphine and Cocaine on the Mesolimbic Pathway Using a Novel Microimaging Platform

 , , ,
, , ,  ,
,  and
and 
Abstract
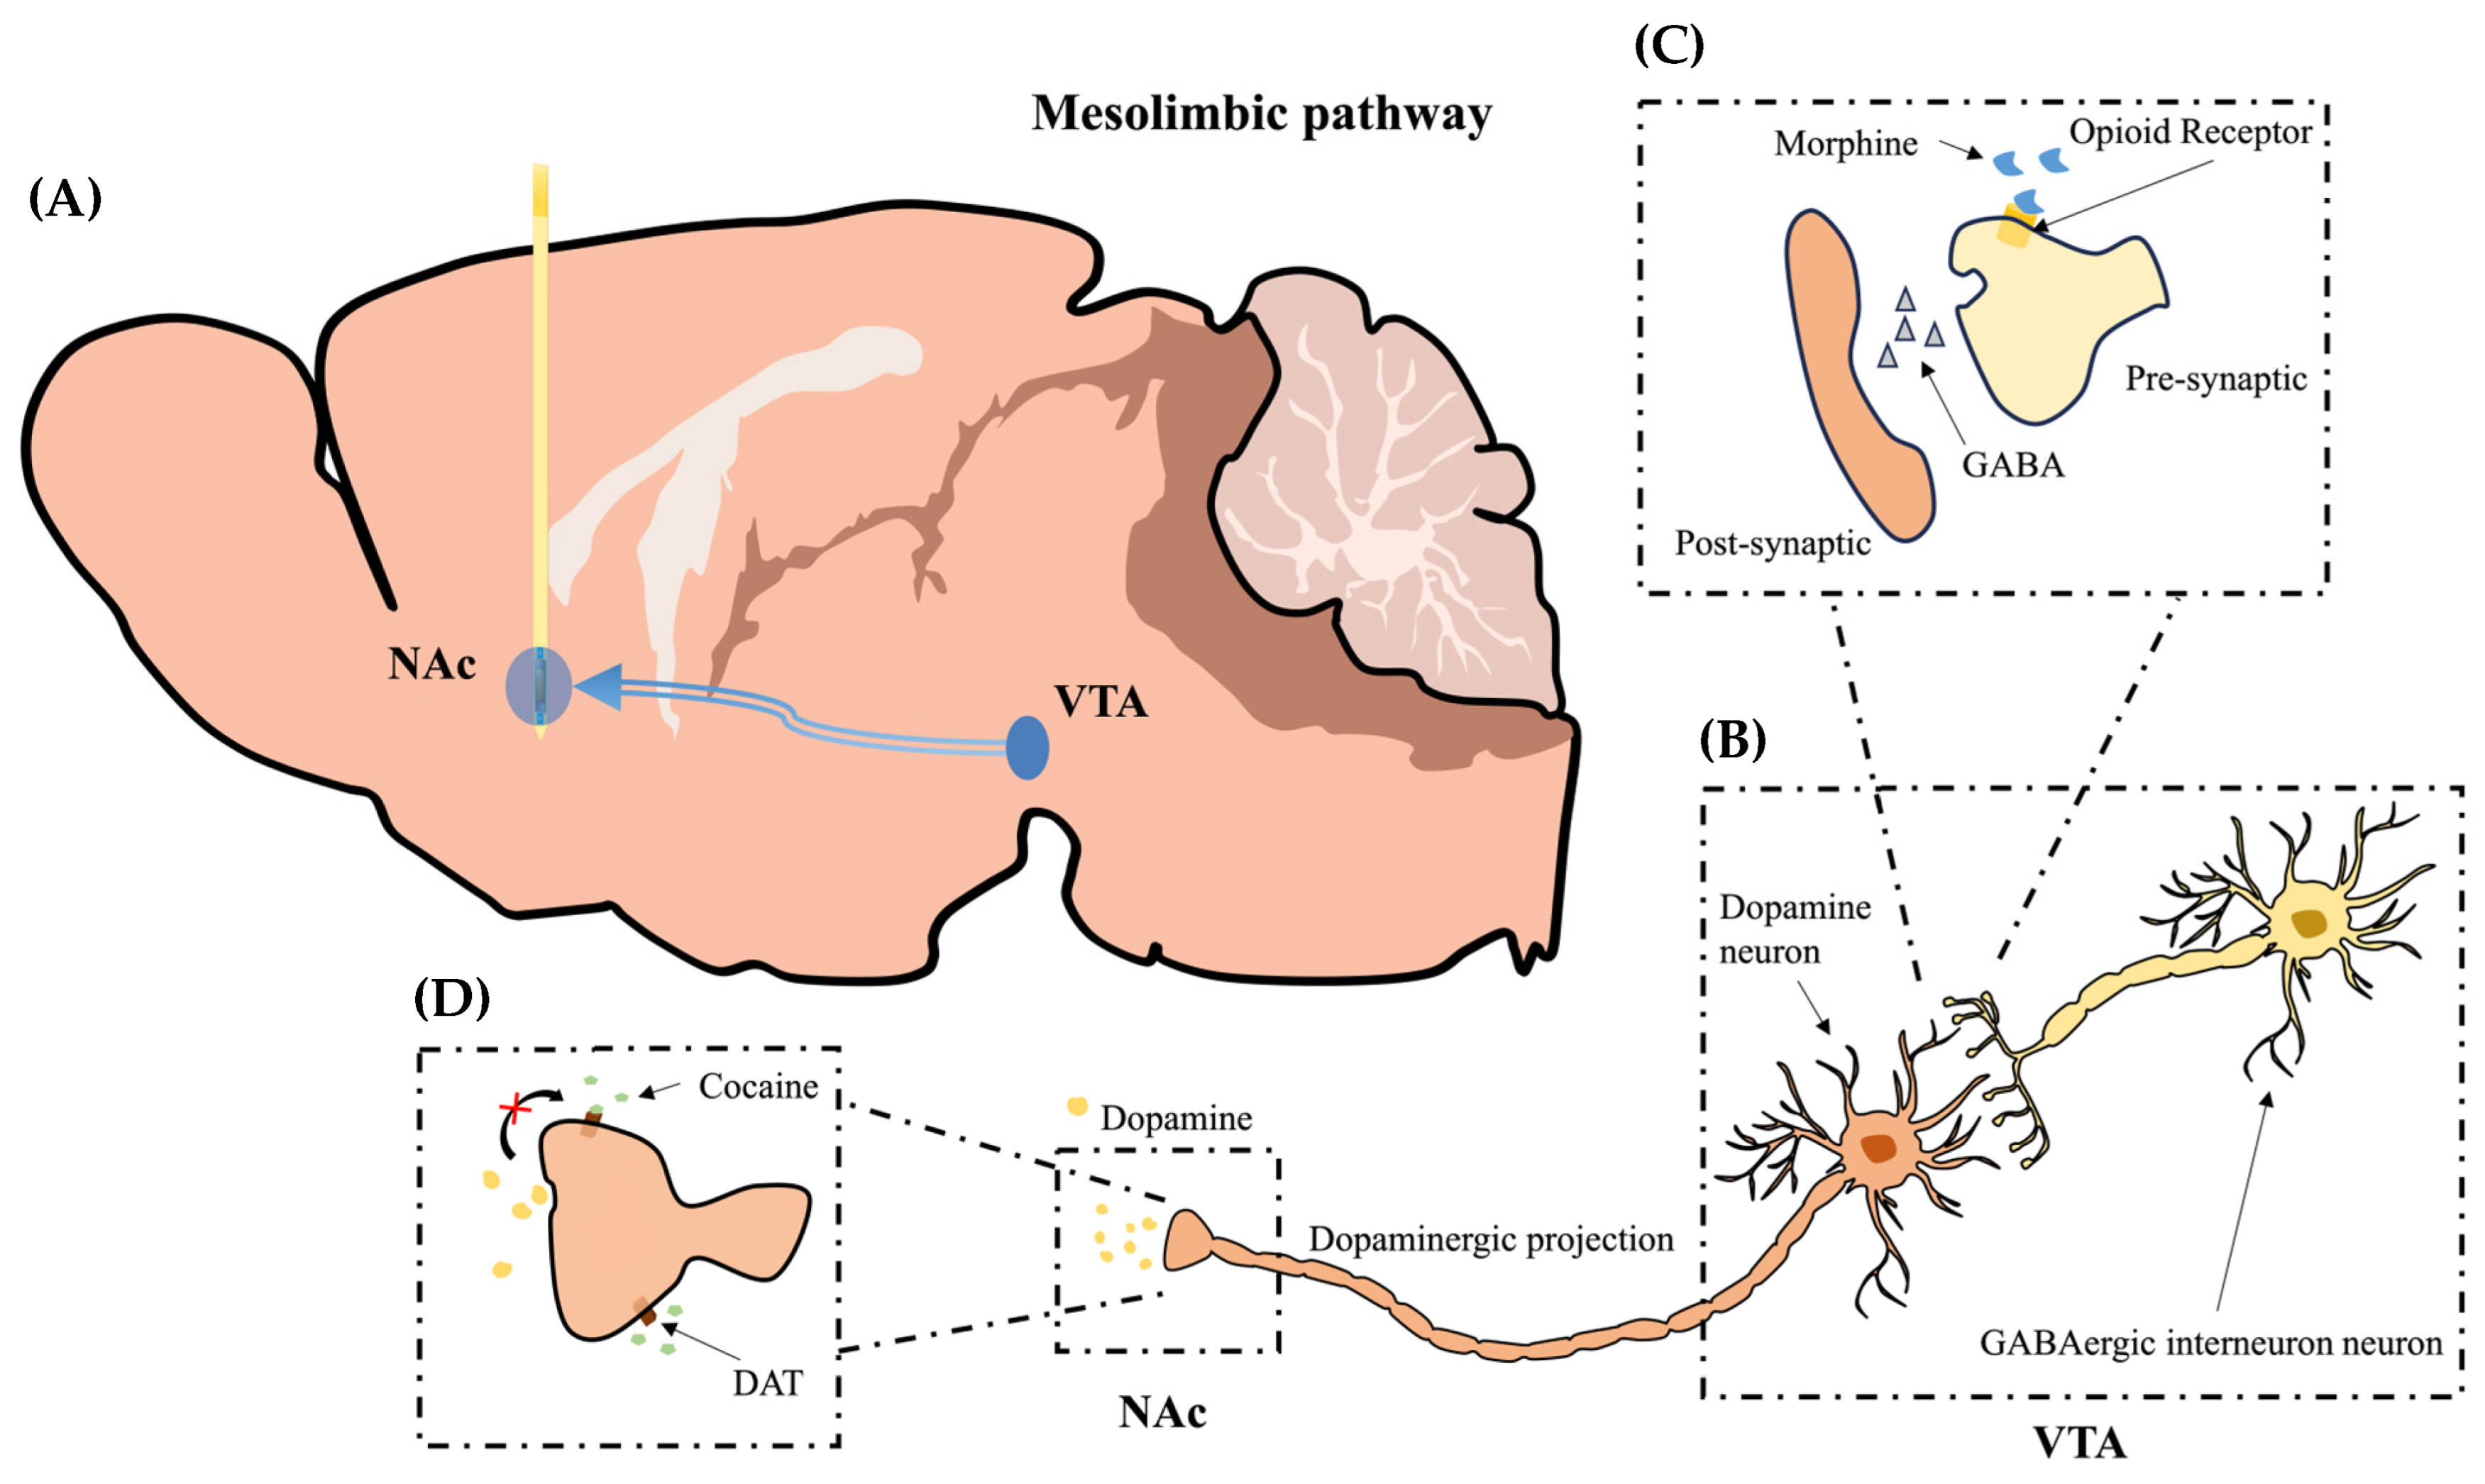
1. Introduction
2. Results
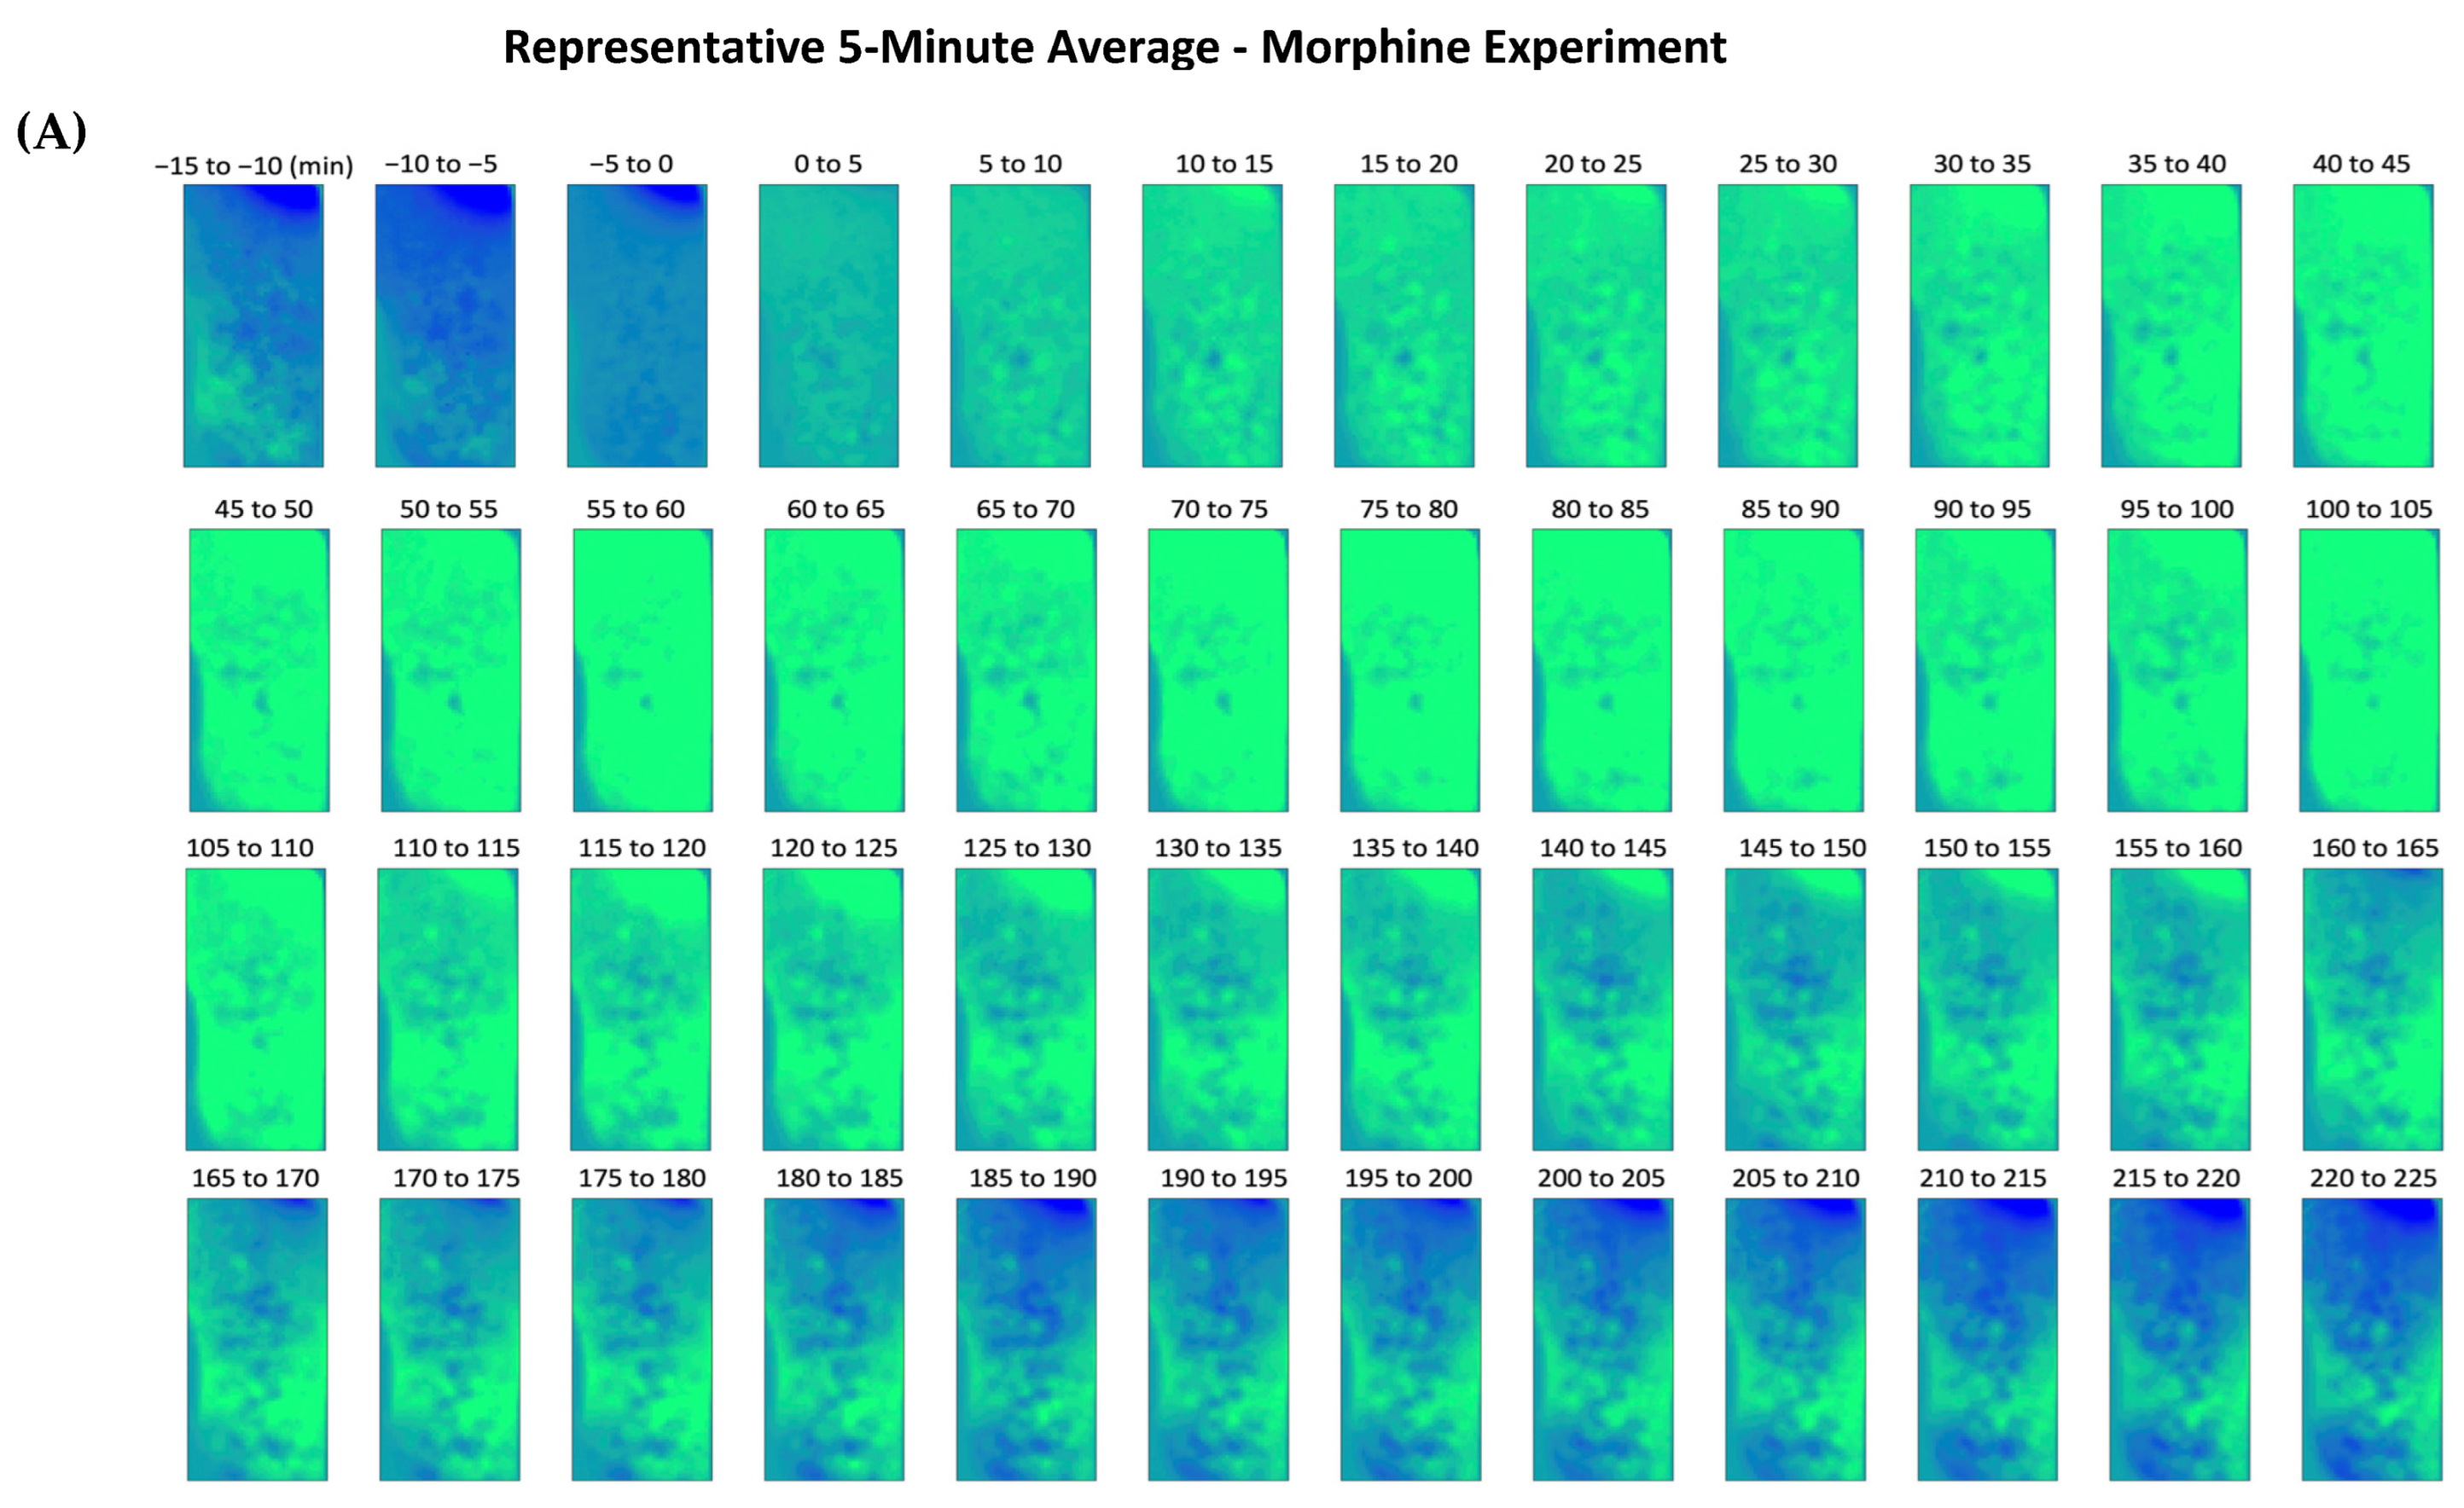
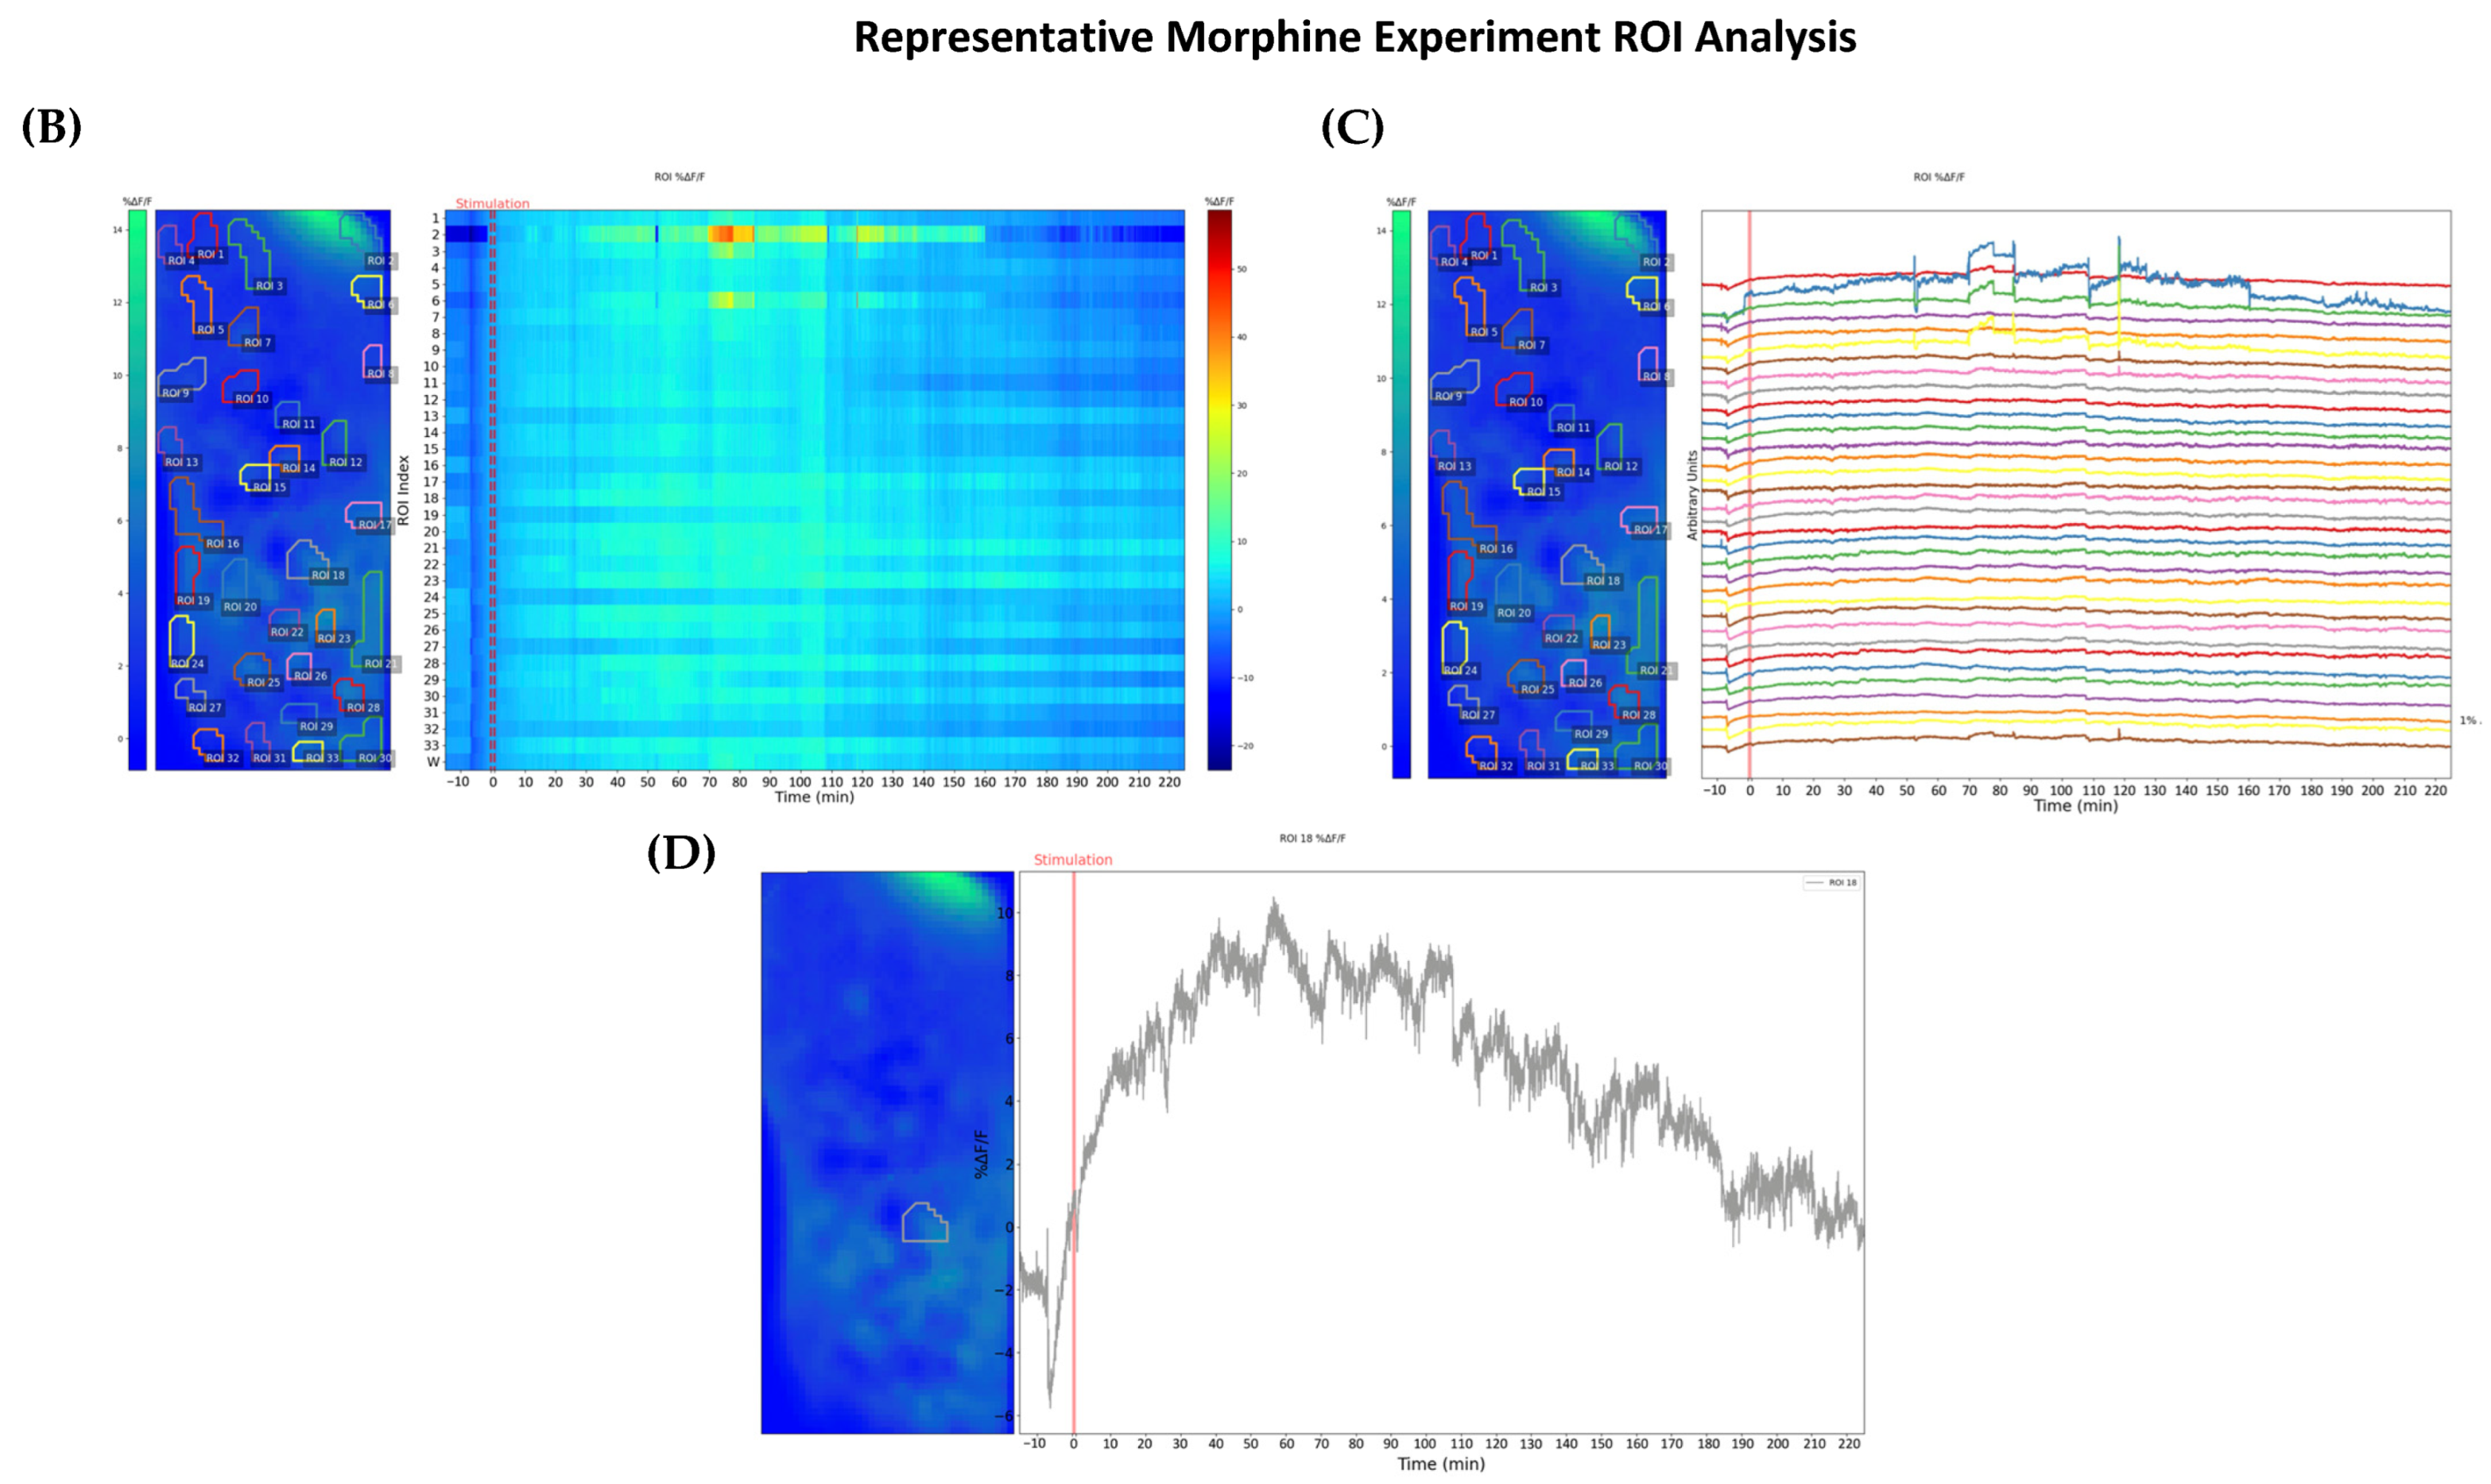
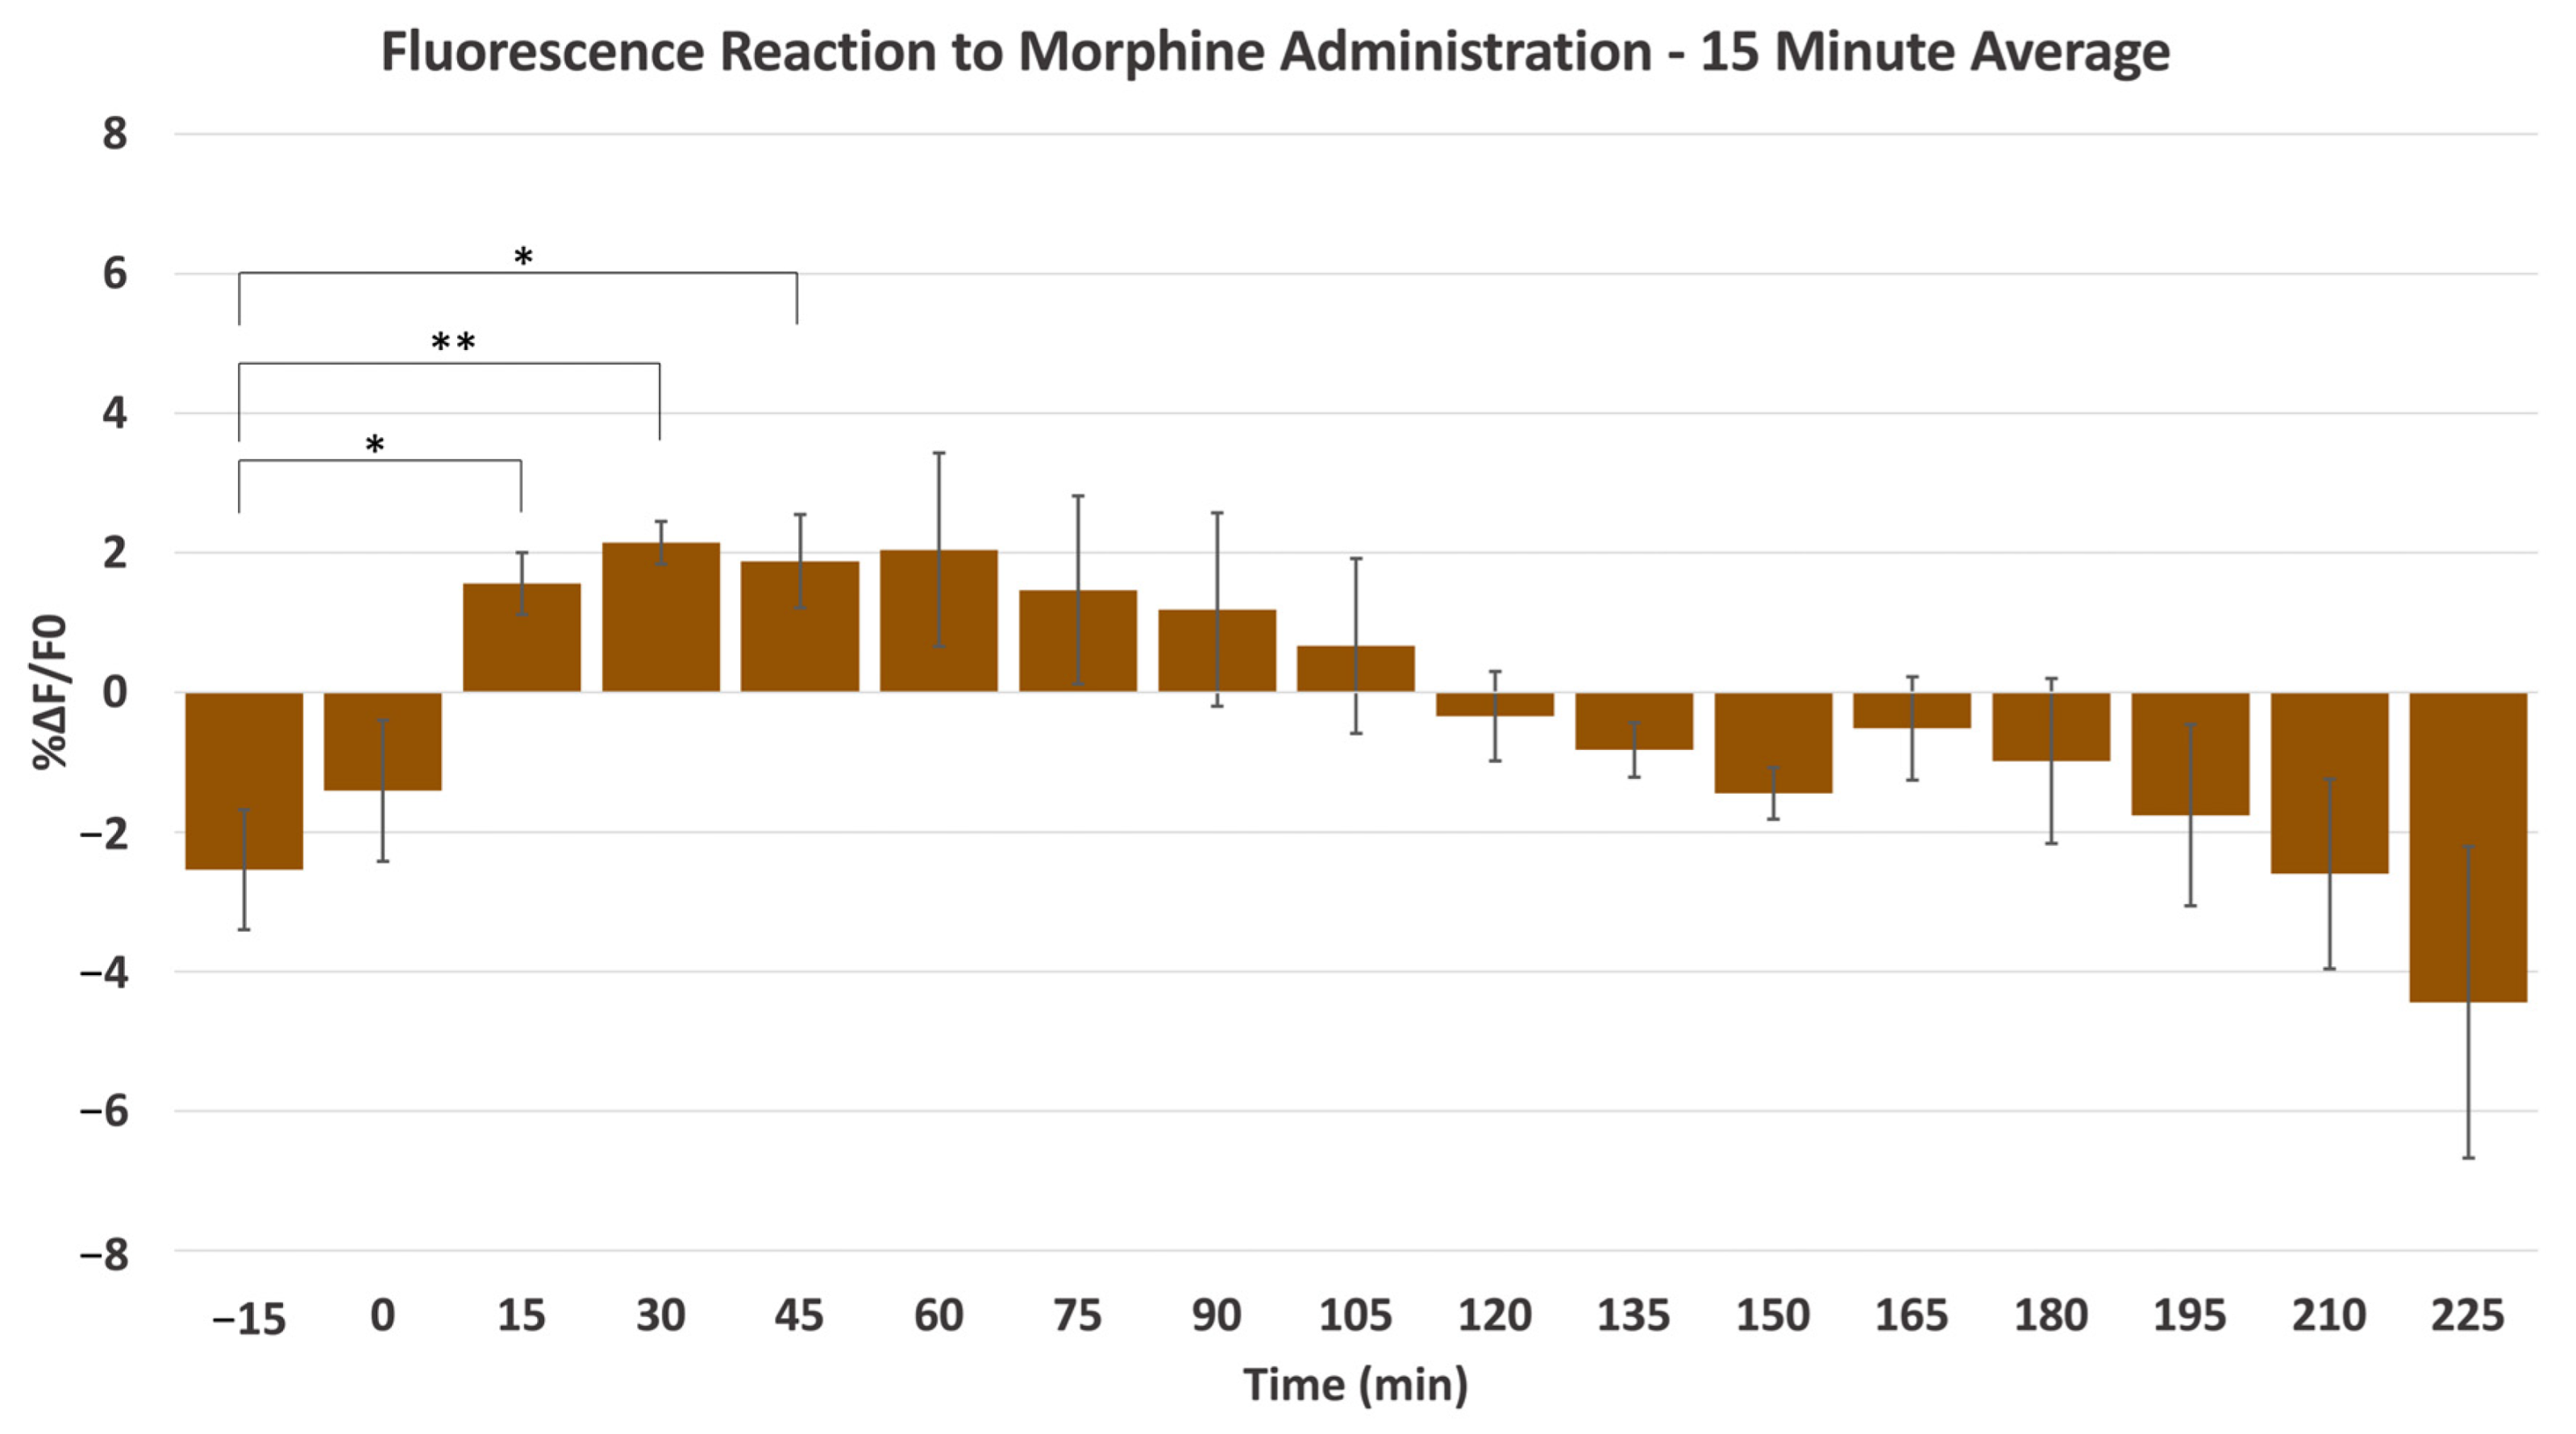
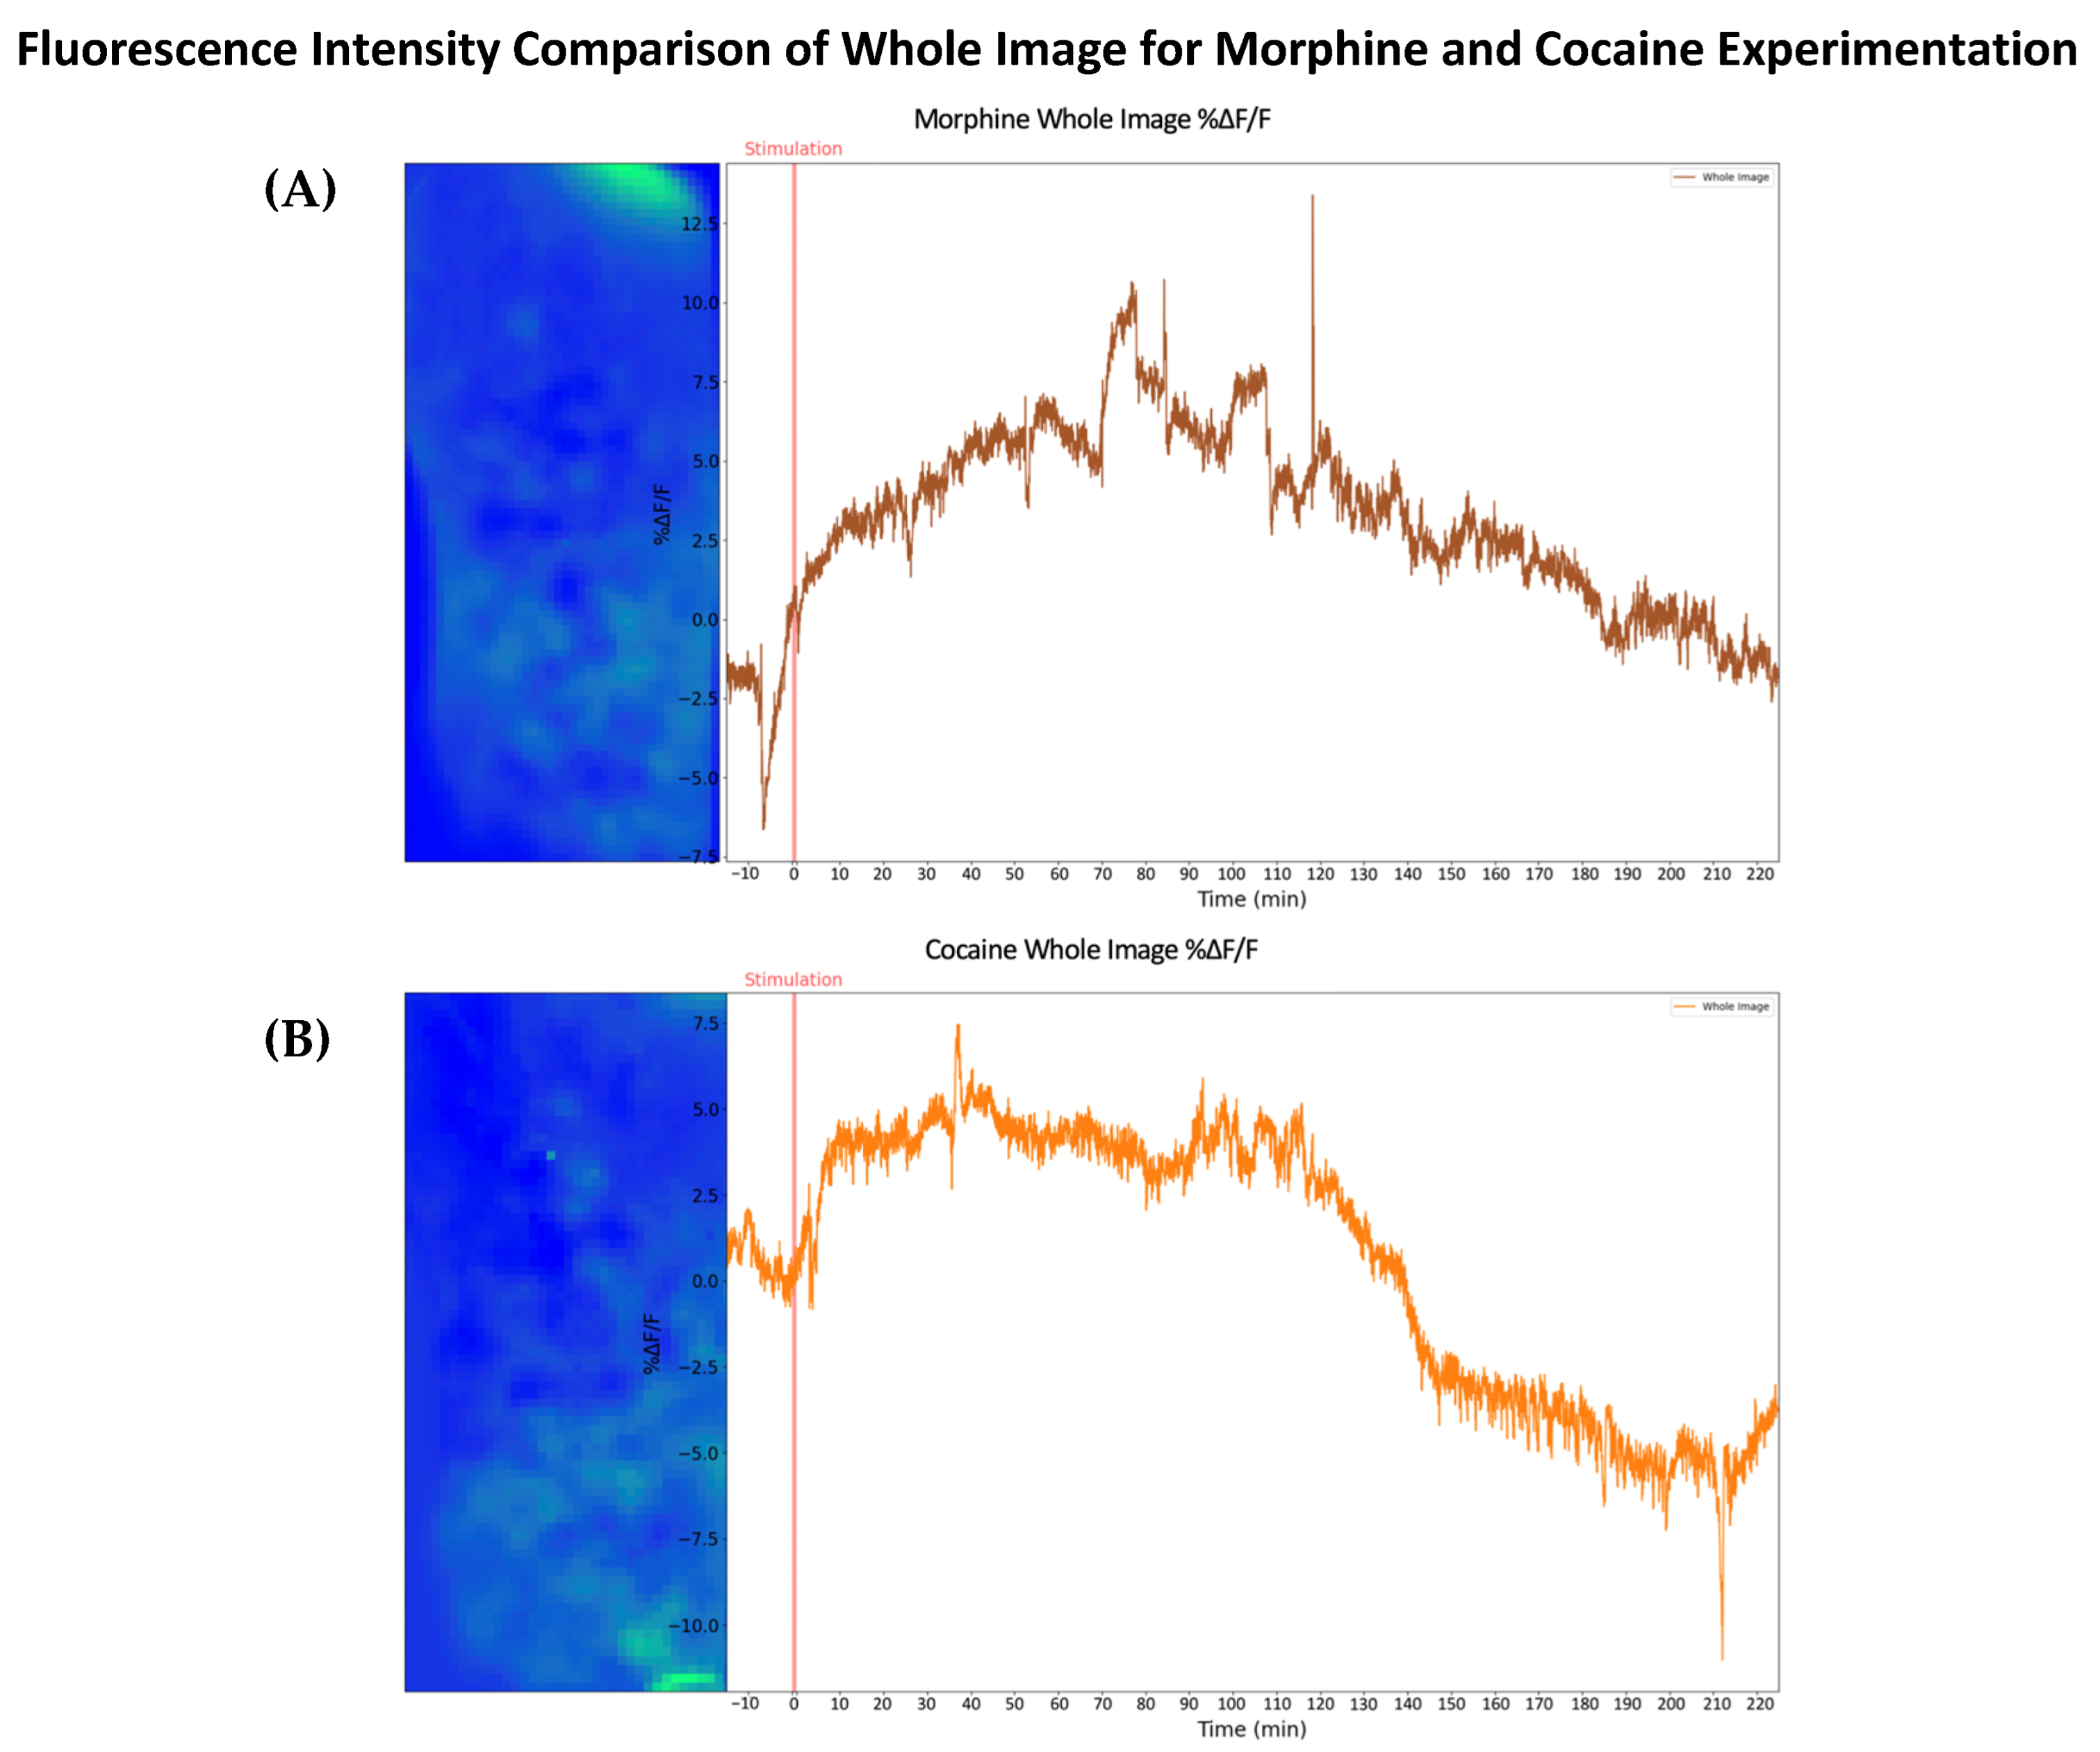
2.1. Morphine-Induced Dopaminergic Stimulation Increased DA Release in NAc
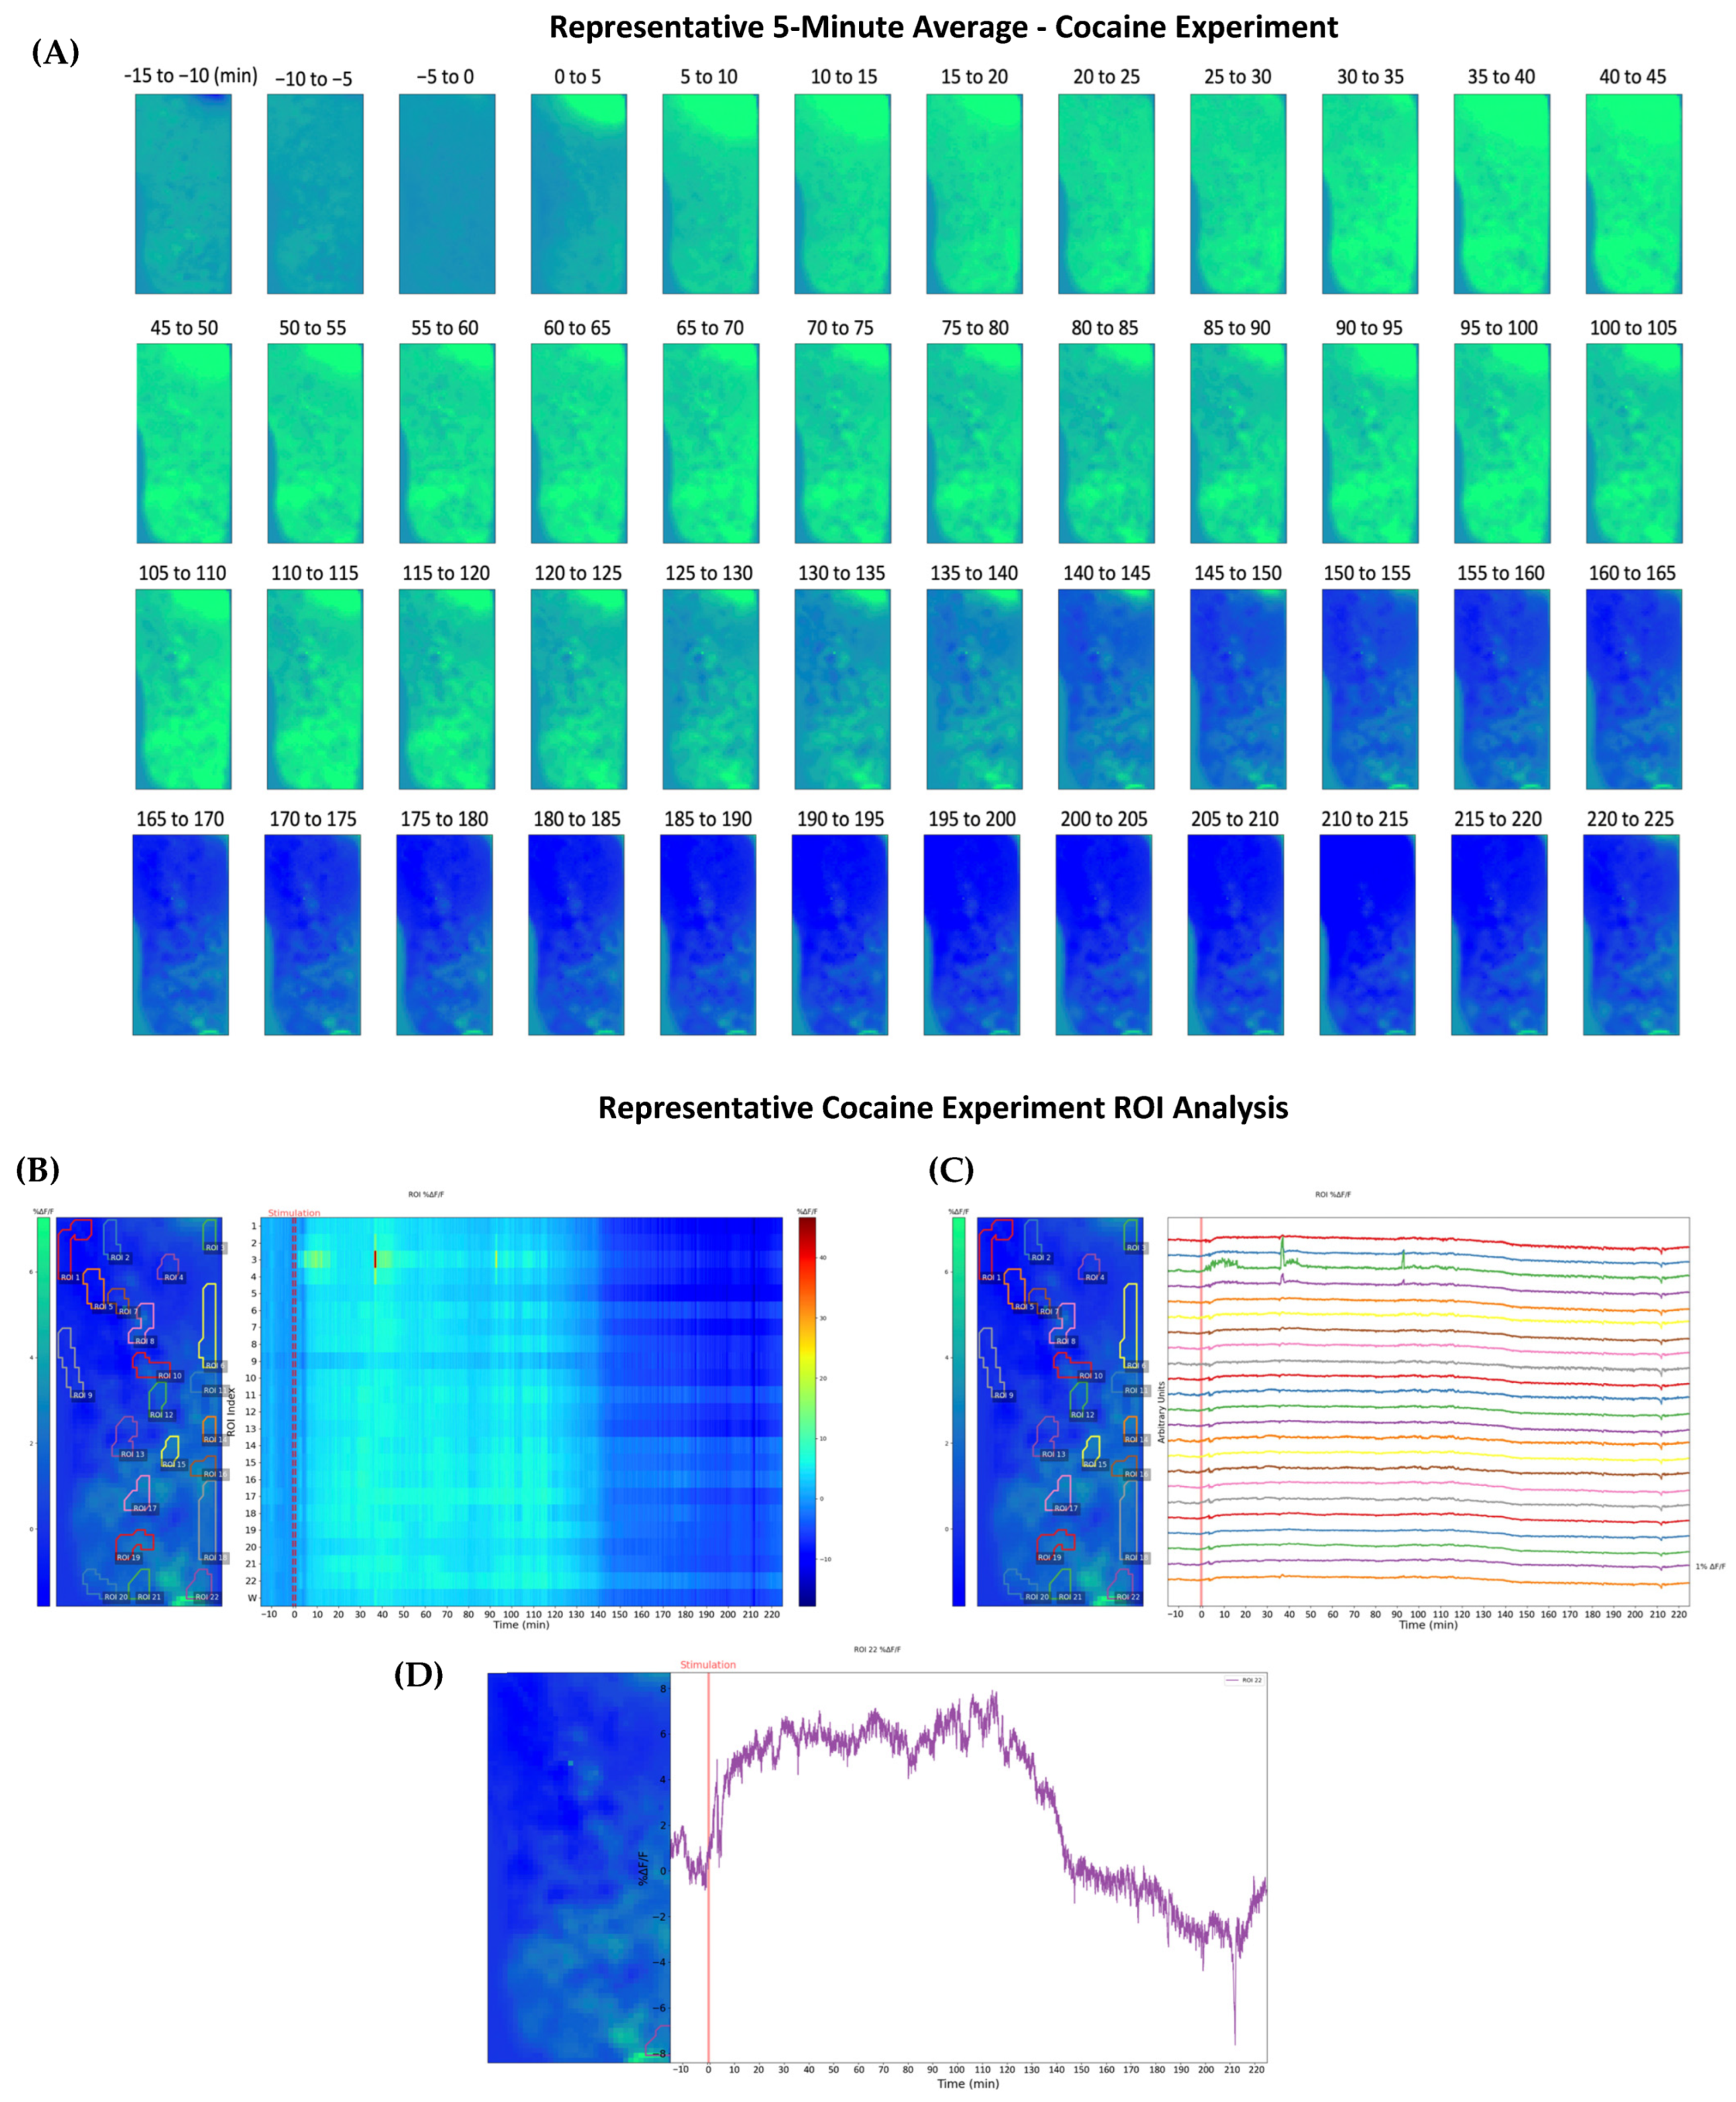
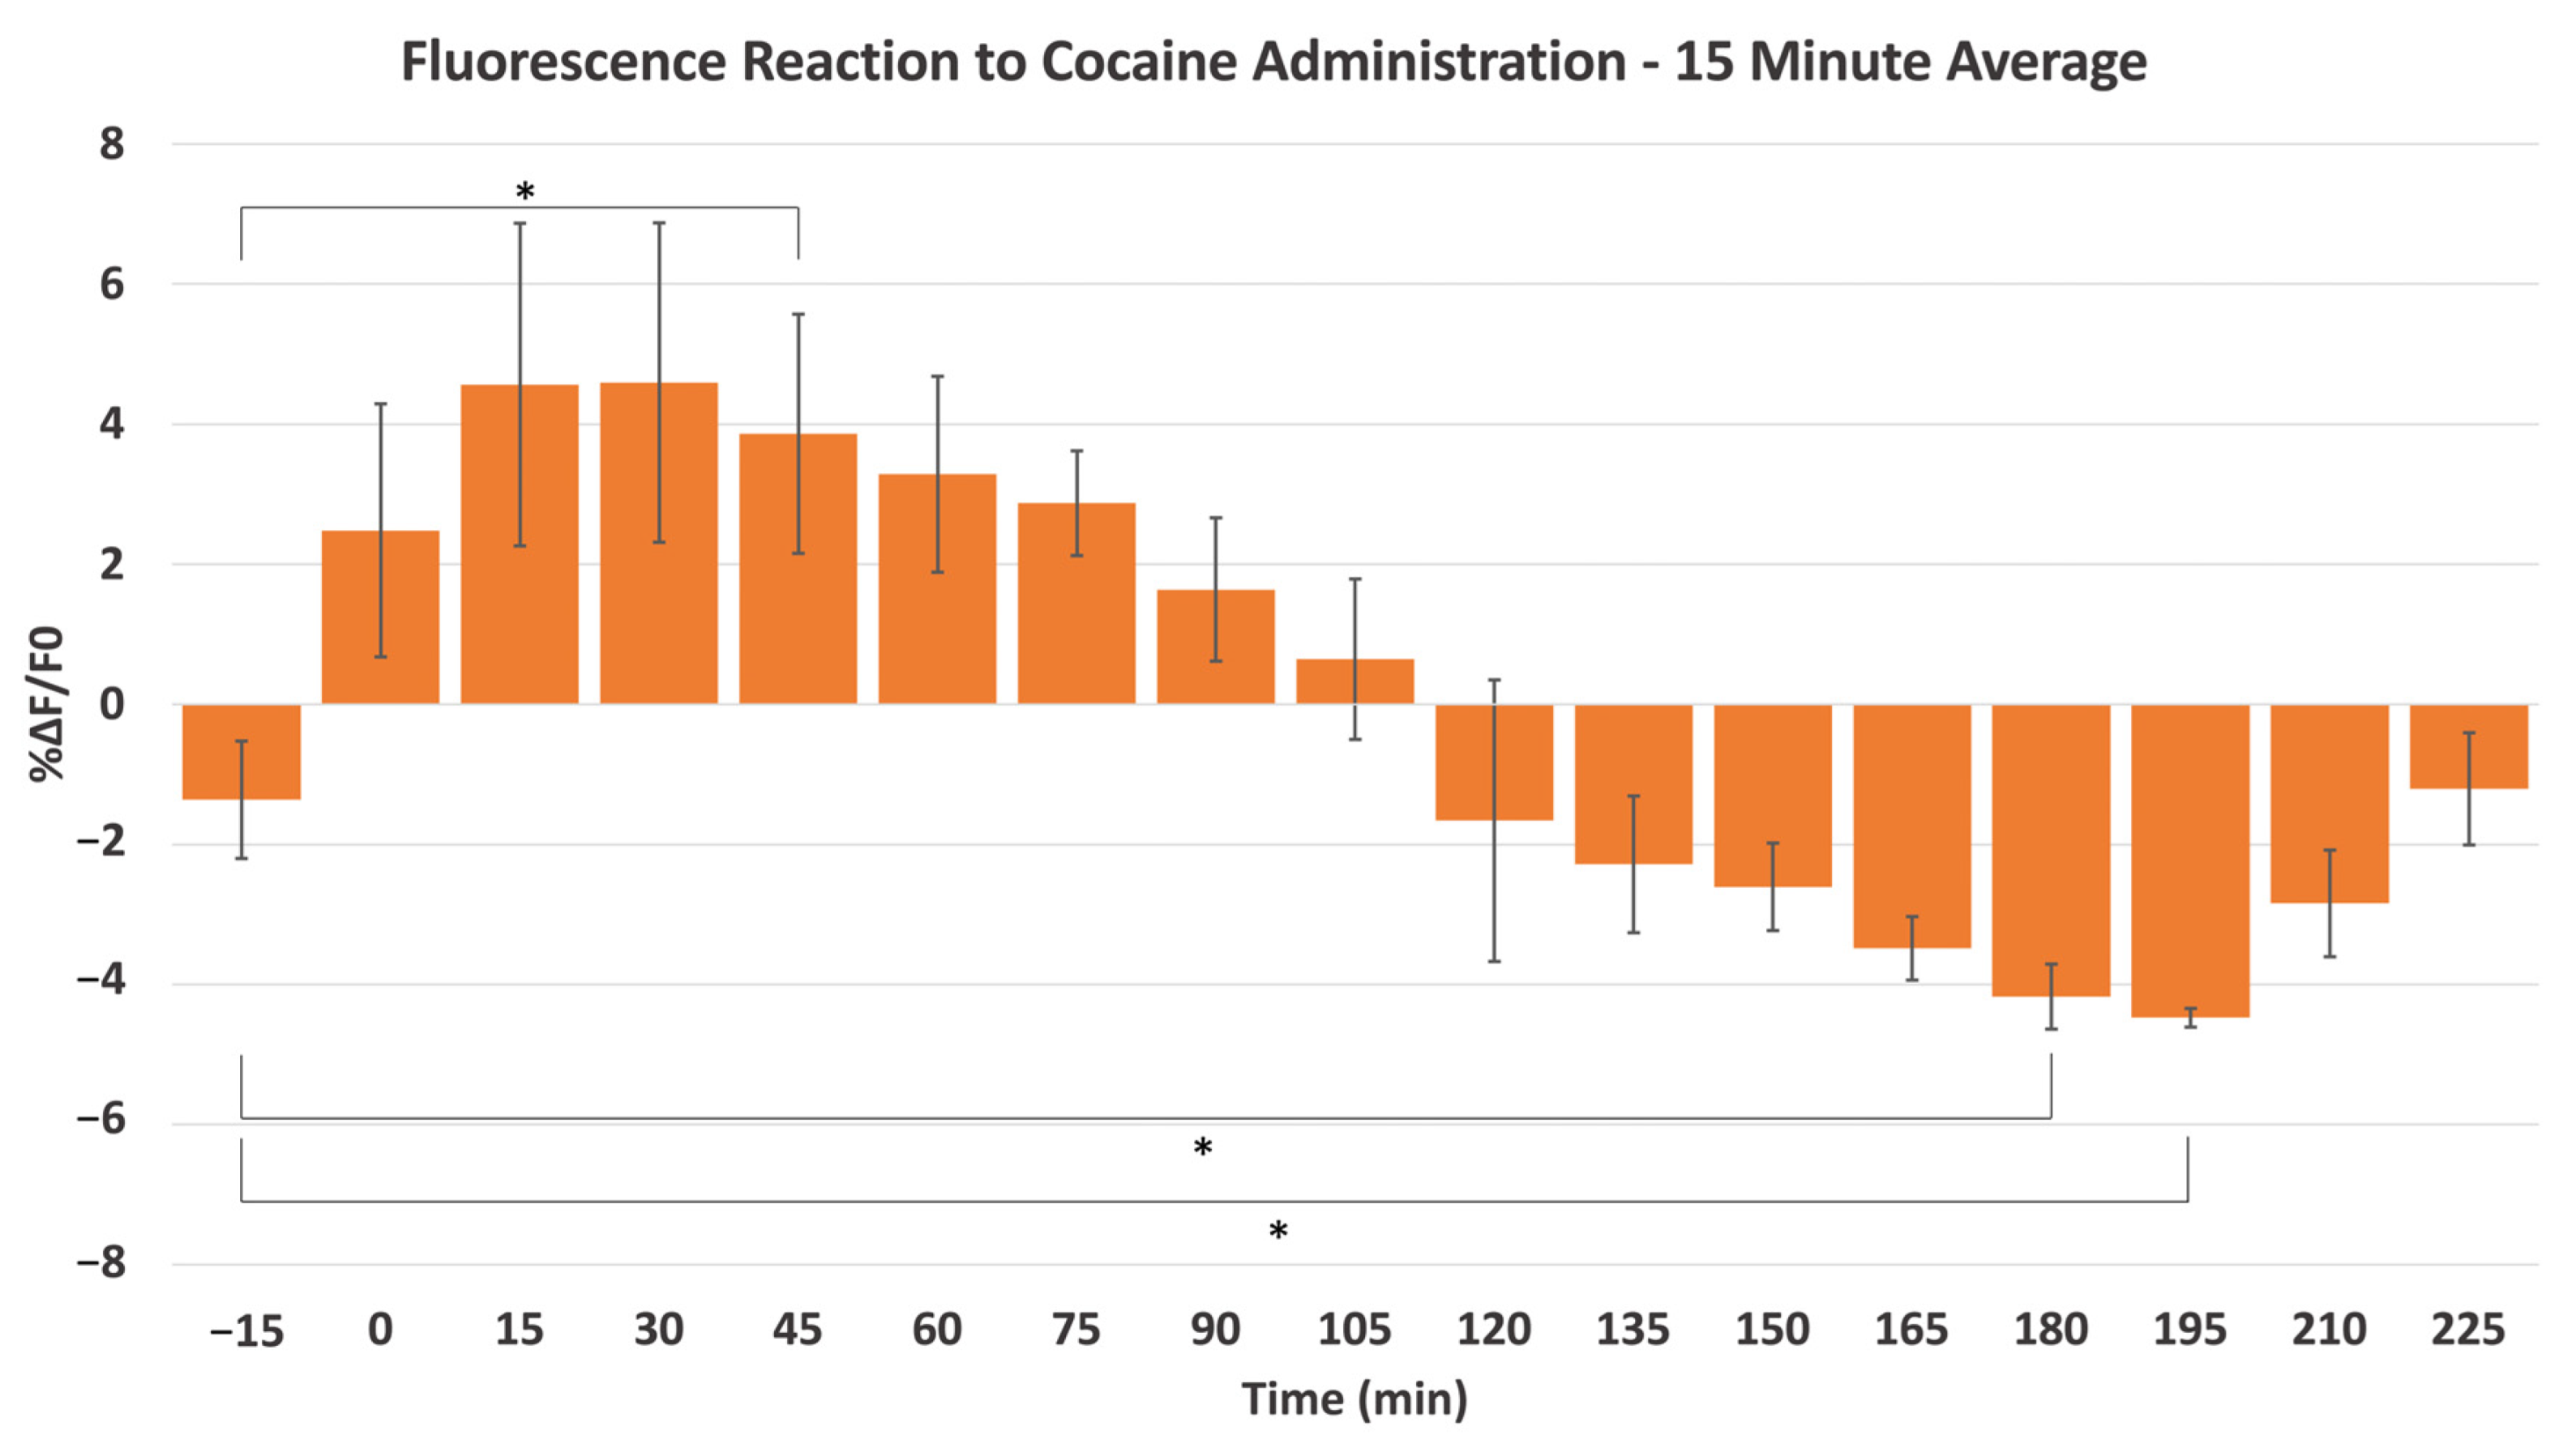
2.2. Cocaine-Induced Dopaminergic Stimulation Modulates DA Levels in NAc
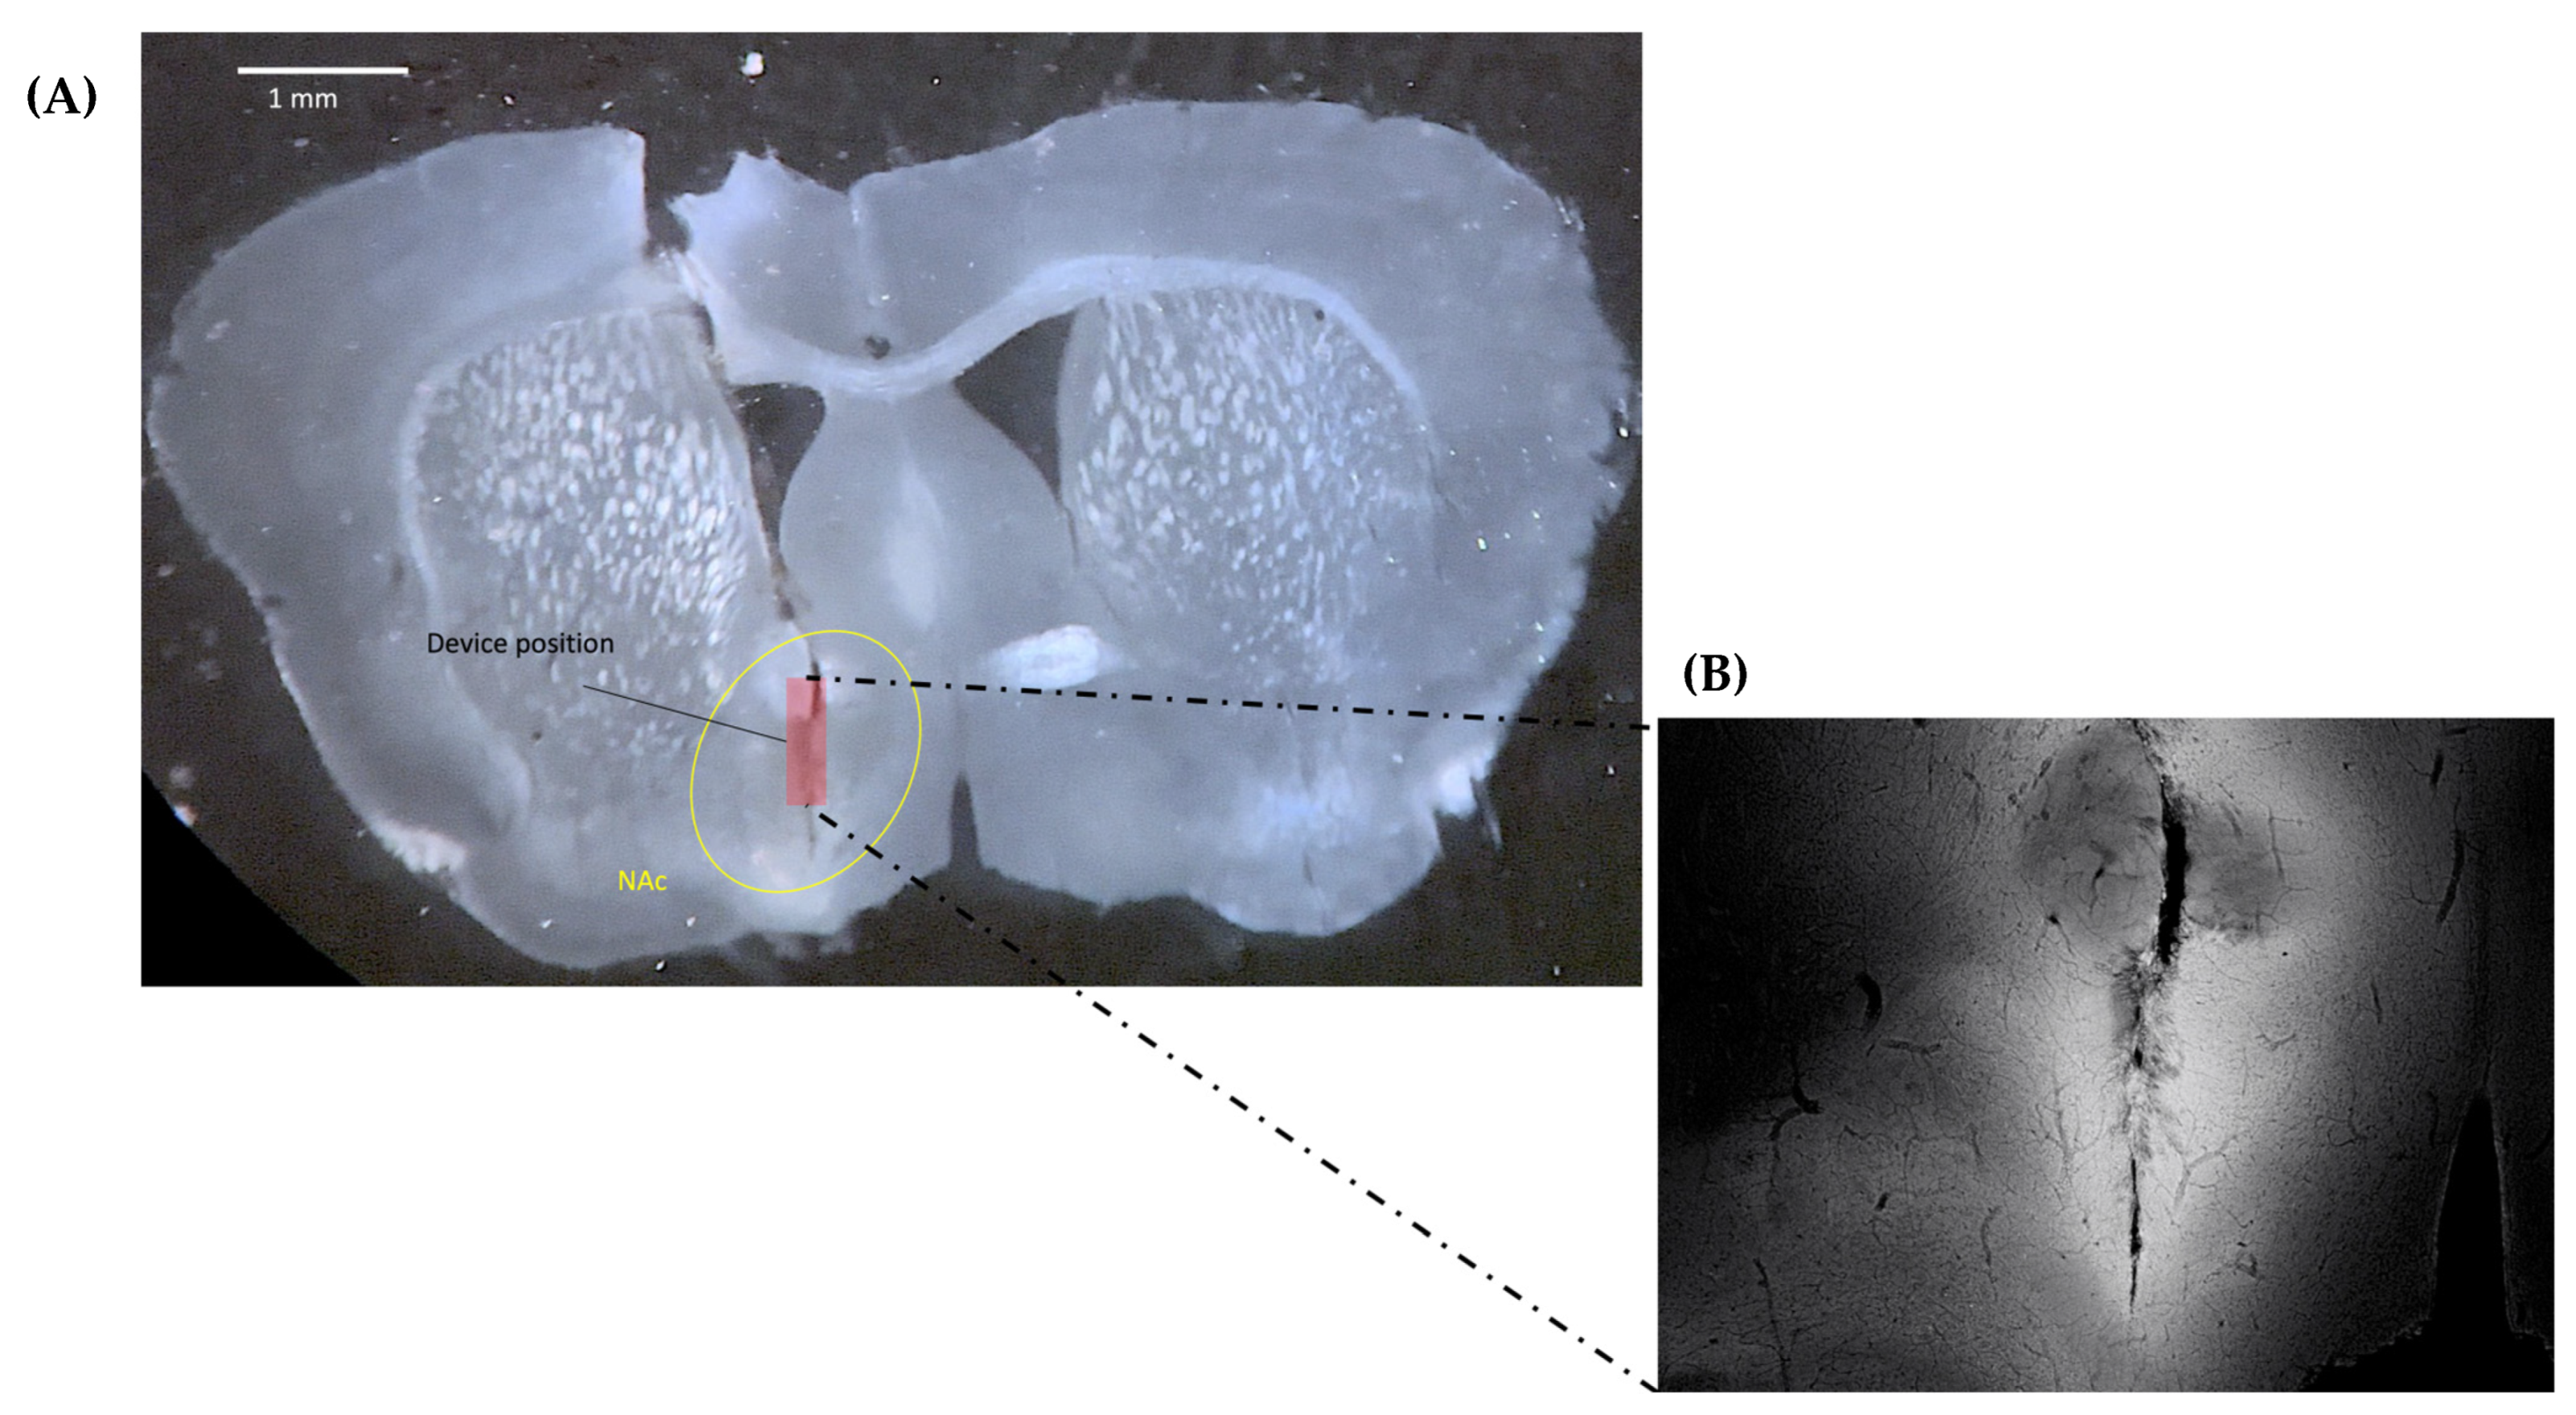
2.3. Confirmation of Virus Expression and Implanted CMOS Imaging Device Position
3. Discussion
3.1. dLight1.2 AAV Advancement with CMOS Imaging Device
3.2. CMOS Imaging Applications
3.3. Visualization and Analysis of Drug Administration
4. Materials and Methods
4.1. Ethics Statement and Animal Care
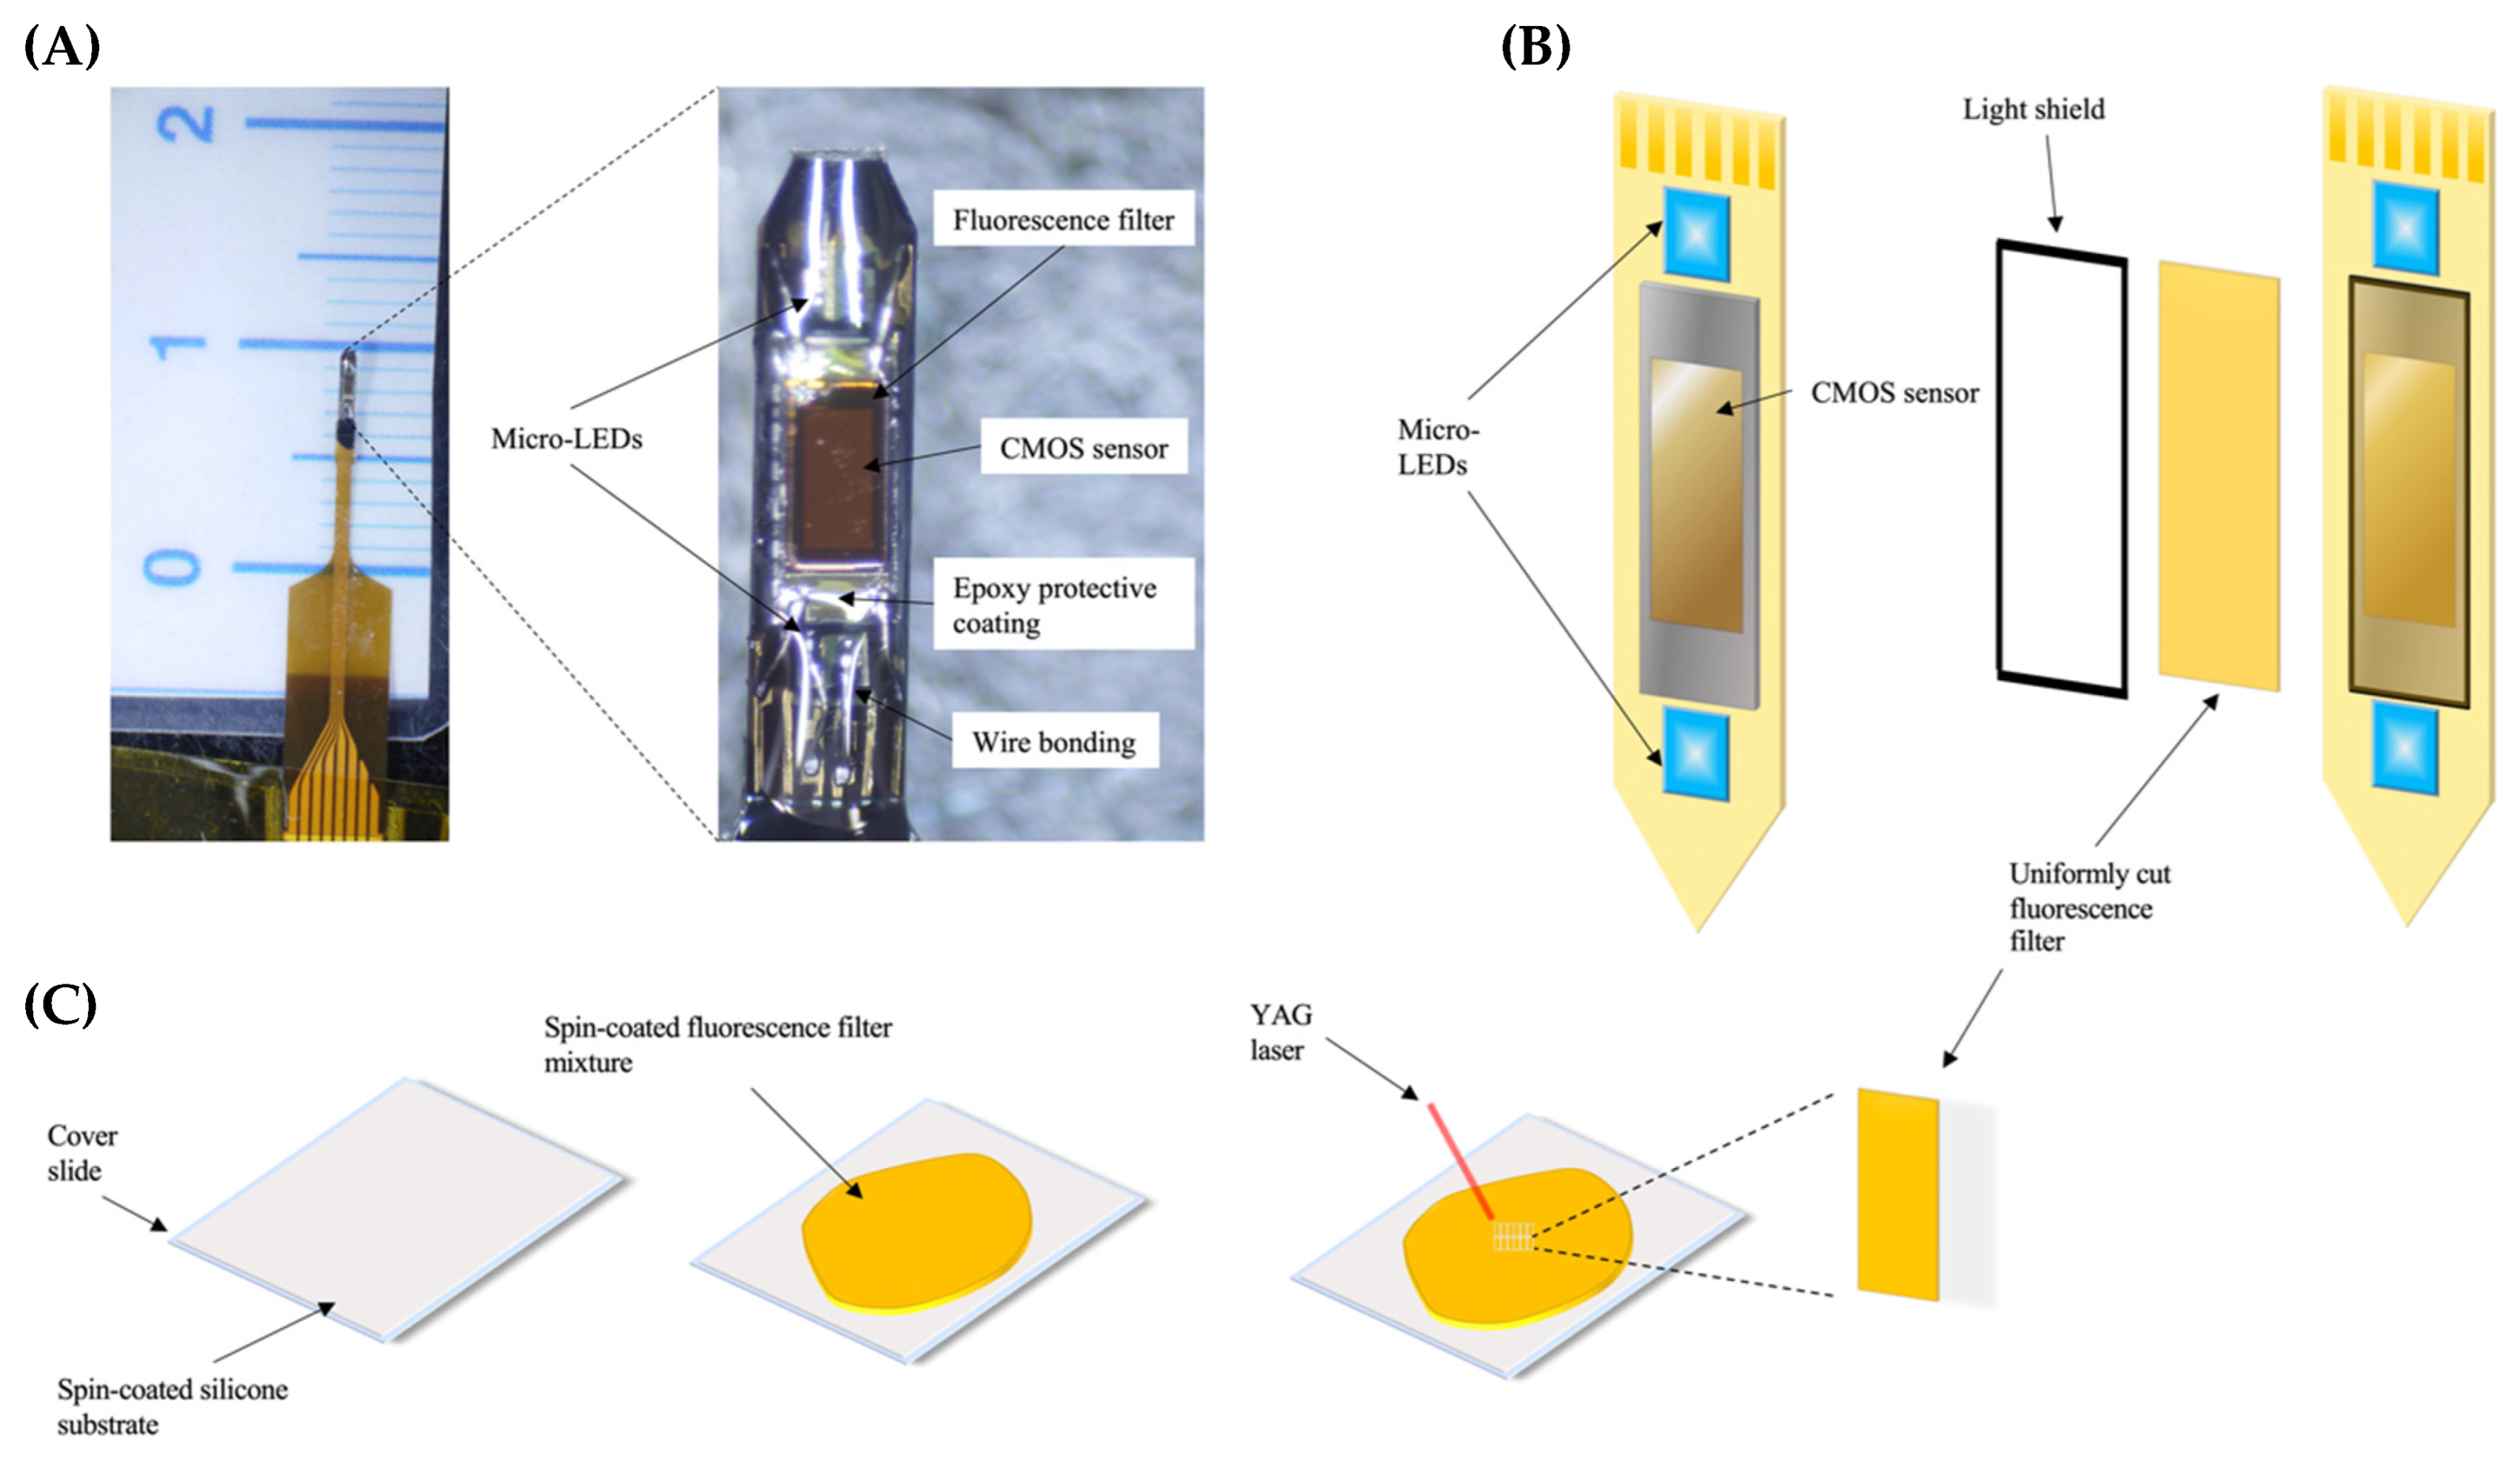
4.2. Implantable Imaging Device and Fabrication
4.3. Stereotaxis Surgery
4.4. dLight1.2 AAV Injection
4.5. CMOS Imaging Device Implantation
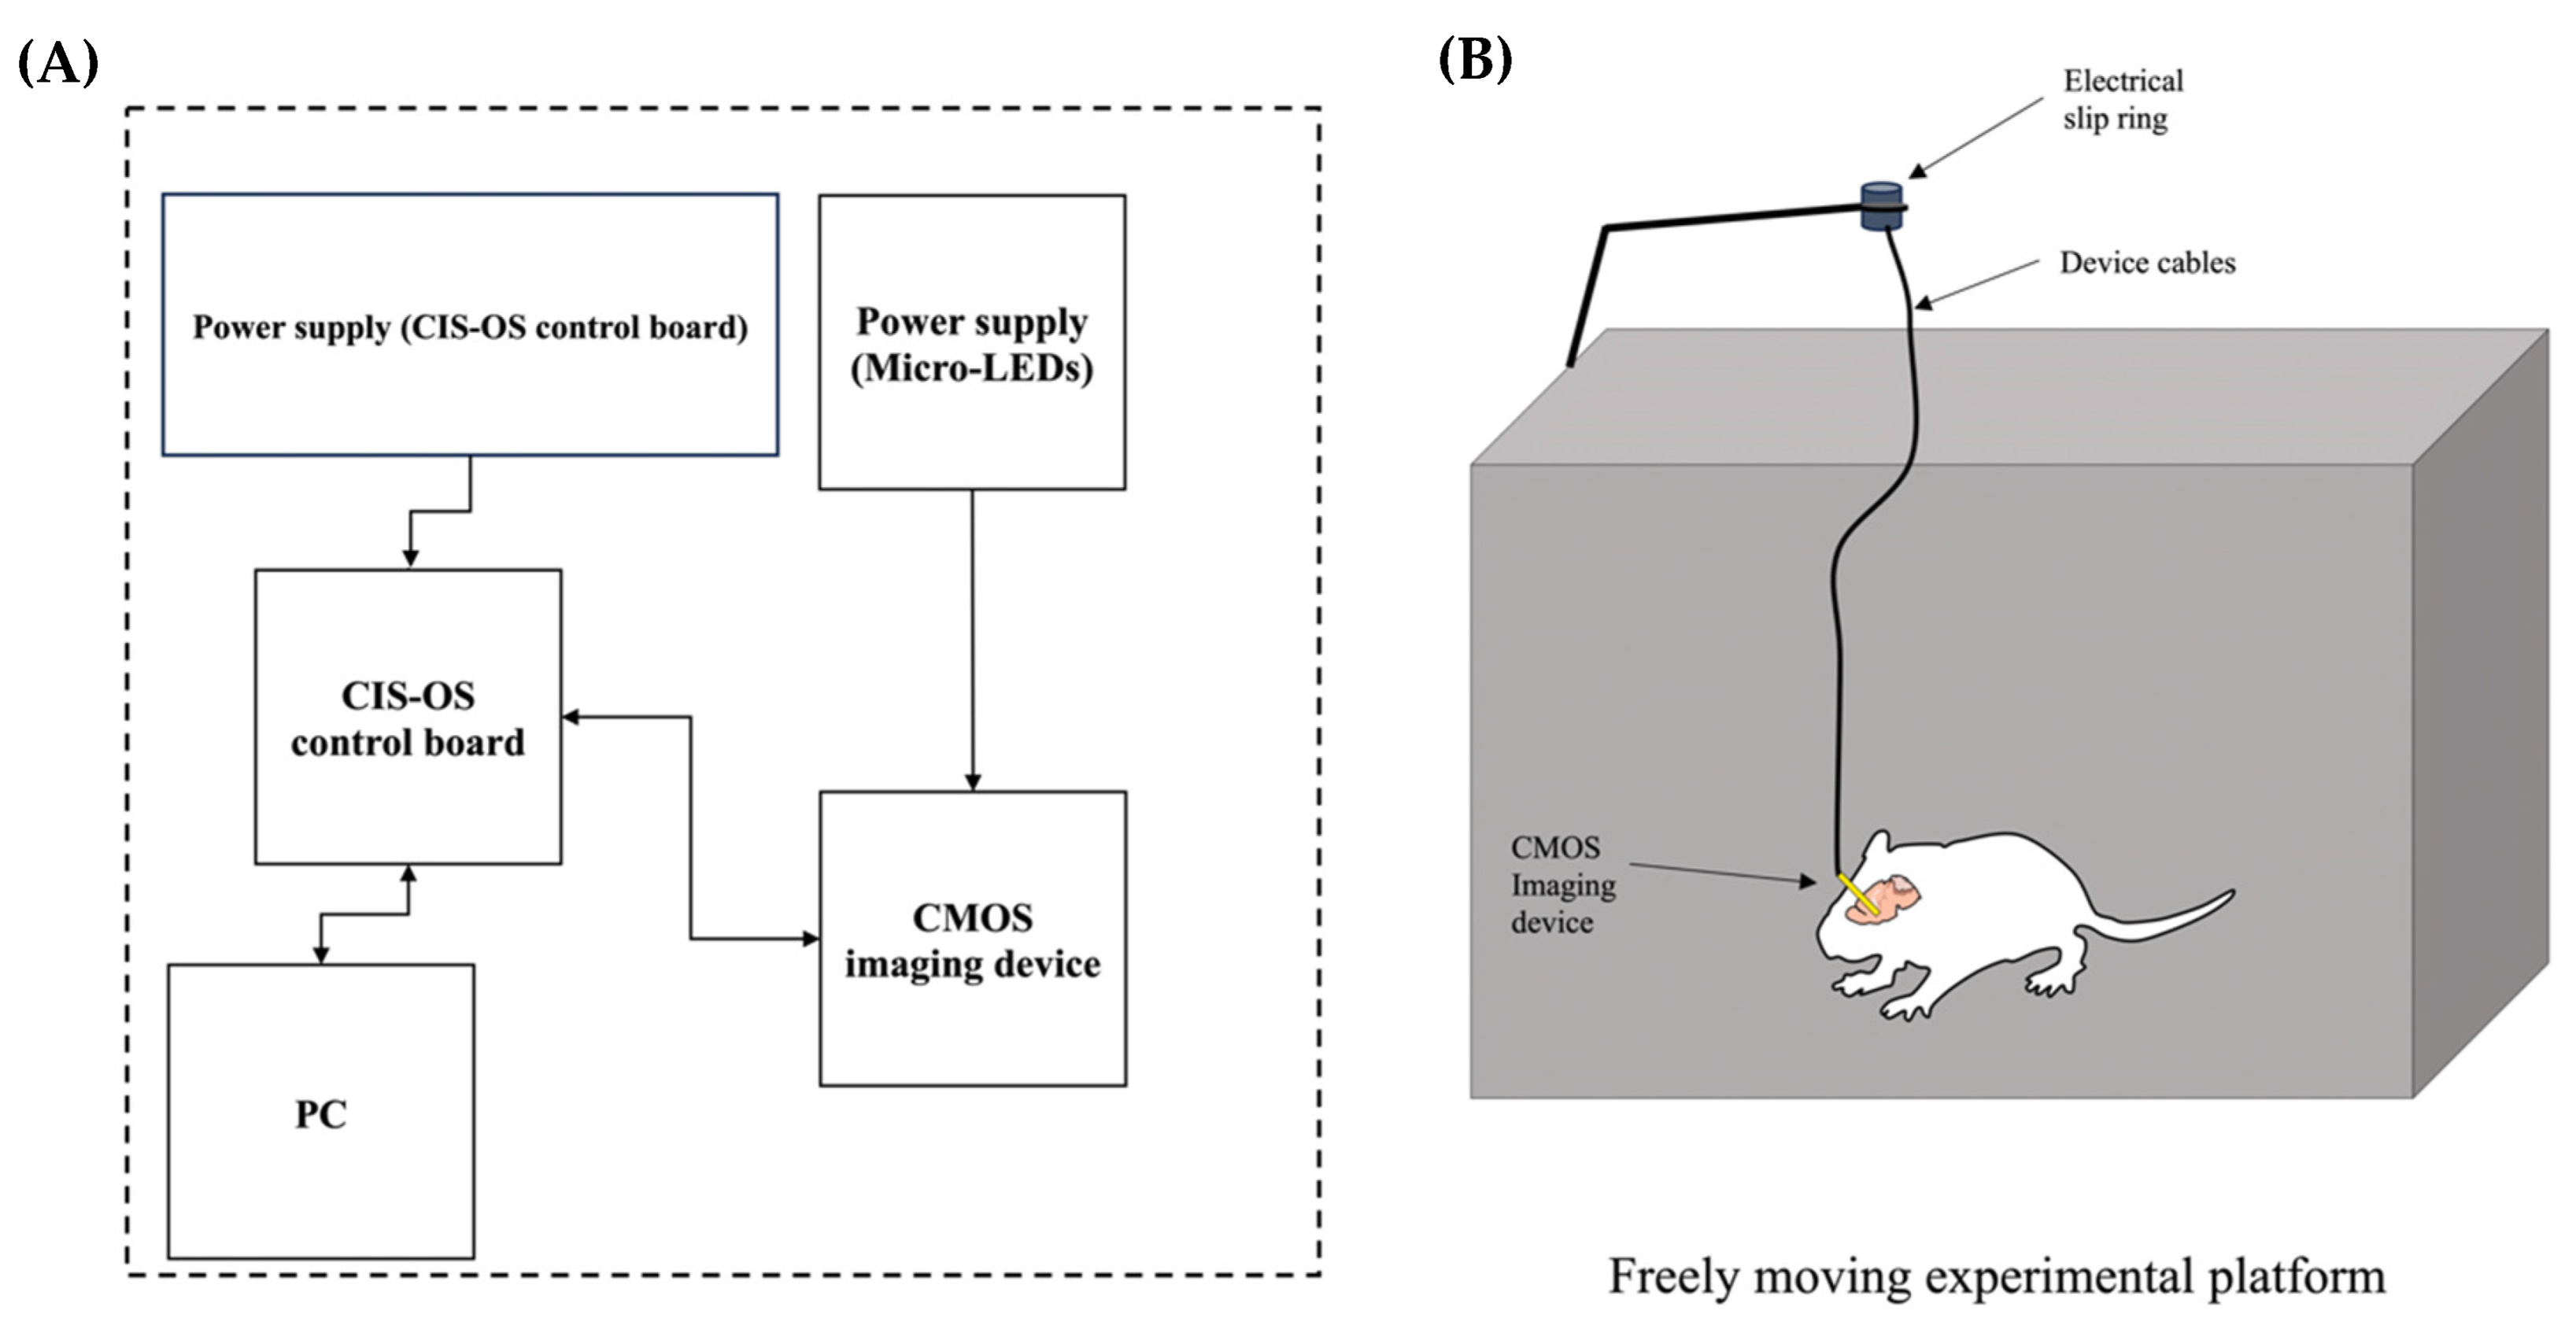
4.6. Experimental Setup and Fluorescence Imaging of the NAc
4.7. Imaging Analysis and ROI Analysis Program
4.8. Implantation Site Confirmation
4.9. Statistical Analysis
5. Conclusions
Author Contributions
Funding
Institutional Review Board Statement
Informed Consent Statement
Data Availability Statement
Conflicts of Interest
Abbreviations
| DA | Dopamine |
| VTA | Ventral tegmental area |
| NAc | Nucleus accumbens |
| GABA | γ-aminobutyric acid |
| DAT | Dopamine transporter |
| PFC | Prefrontal cortex |
| CMOS | Complementary metal-oxide semiconductor |
| FPC | Flexible printed circuit |
| AAV | Adeno-associated virus |
| ROI | Region of interest |
| CNS | Central nervous system |
| GECI | Genetically encoded calcium indicator |
References
- Volkow, N.D.; Fowler, J.S.; Wang, G.-J. Role of dopamine in drug reinforcement and addiction in humans: Results from imaging studies. Behav. Pharmacol. 2002, 13, 355–366. [Google Scholar] [CrossRef]
- Dichiara, G.; Bassareo, V. Reward system and addiction: What dopamine does and doesn’t do. Curr. Opin. Pharmacol. 2007, 7, 69–76. [Google Scholar] [CrossRef]
- Volkow, N.D.; Fowler, J.S.; Wang, G.-J.; Swanson, J.M. Dopamine in Drug Abuse and Addiction Results of Imaging Studies and Treatment Implications. 2007. Available online: https://jamanetwork.com/ (accessed on 25 June 2023).
- Finan, P.H.; Smith, M.T. The comorbidity of insomnia, chronic pain, and depression: Dopamine as a putative mechanism. Sleep Med. Rev. 2013, 17, 173–183. [Google Scholar] [CrossRef] [PubMed]
- Brischoux, F.D.R.; Chakraborty, S.; Brierley, D.I.; Ungless, M.A. Phasic Excitation of Dopamine Neurons in Ventral VTA by Noxious Stimuli. Proc. Natl. Acad. Sci. USA 2009, 106, 4894–4899. [Google Scholar]
- Leknes, S.; Tracey, I. A Common Neurobiology for Pain and Pleasure. 2008. Available online: www.nature.com/reviews/neuro (accessed on 7 July 2023).
- Everitt, B.J.; Robbins, T.W. Neural systems of reinforcement for drug addiction: From actions to habits to compulsion. Nat. Neurosci. 2005, 8, 1481–1489. [Google Scholar] [CrossRef] [PubMed]
- Taylor, A.M.W.; Becker, S.; Schweinhardt, P.; Cahill, C. Mesolimbic dopamine signaling in acute and chronic pain: Implications for motivation, analgesia, and addiction. Pain 2016, 157, 1194–1198. [Google Scholar] [CrossRef] [PubMed]
- Coussens, N.P.; Sittampalam, G.S.; Jonson, S.G.; Hall, M.D.; Gorby, H.E.; Tamiz, A.P.; McManus, O.B.; Felder, C.C.; Rasmussen, K. The opioid crisis and the future of addiction and pain therapeutics. J. Pharmacol. Exp. Ther. 2019, 371, 396–408. [Google Scholar] [CrossRef] [PubMed]
- Seth, P.; Scholl, L.; Rudd, R.A.; Bacon, S. Overdose deaths involving opioids, cocaine, and psychostimulants—United States, 2015–2016. Am. J. Transplant. 2018, 18, 1556–1568. [Google Scholar] [CrossRef]
- Hell, S.W.; Dyba, M.; Jakobs, S. Concepts for nanoscale resolution in fluorescence microscopy. Curr. Opin. Neurobiol. 2004, 14, 599–609. [Google Scholar] [CrossRef]
- Flusberg, B.A.; Cocker, E.D.; Piyawattanametha, W.; Jung, J.C.; Cheung, E.L.M.; Schnitzer, M.J. Fiber-optic fluorescence imaging. Nat. Methods 2005, 2, 941–950. [Google Scholar] [CrossRef]
- Chefer, V.I.; Thompson, A.C.; Zapata, A.; Shippenberg, T.S. Overview of brain microdialysis. Curr. Protoc. Neurosci. 2009, 47, 7.1.1–7.1.28. [Google Scholar] [CrossRef]
- Sunaga, Y.; Ohta, Y.; Murakami, T.E.; Akay, Y.M.; Ohta, J.; Akay, M. Monitoring Neuronal Dynamics in the Ventral Tegmental Area Using an Implantable Microimaging Device with Microdialysis System. IEEE Access 2021, 9, 55871–55878. [Google Scholar] [CrossRef]
- Sunaga, Y.; Ohta, Y.; Akay, Y.M.; Ohta, J.; Akay, M. Monitoring neural activities in the VTA in response to nicotine intake using a novel implantable microimaging device. IEEE Access 2020, 8, 68013–68020. [Google Scholar] [CrossRef]
- Akbar, L.; Castillo, V.C.G.; Olorocisimo, J.P.; Ohta, Y.; Kawahara, M.; Takehara, H.; Haruta, M.; Tashiro, H.; Sasagawa, K.; Ohsawa, M.; et al. Multi-Region Microdialysis Imaging Platform Revealed Dorsal Raphe Nucleus Calcium Signaling and Serotonin Dynamics during Nociceptive Pain. Int. J. Mol. Sci. 2023, 24, 6654. [Google Scholar] [CrossRef] [PubMed]
- Chen, T.-W.; Wardill, T.J.; Sun, Y.; Pulver, S.R.; Renninger, S.L.; Baohan, A.; Schreiter, E.R.; Kerr, R.A.; Orger, M.B.; Jayaraman, V.; et al. Ultrasensitive fluorescent proteins for imaging neuronal activity. Nature 2013, 499, 295–300. [Google Scholar] [CrossRef] [PubMed]
- Patriarchi, T.; Cho, J.R.; Merten, K.; Howe, M.W.; Marley, A.; Xiong, W.-H.; Folk, R.W.; Broussard, G.J.; Liang, R.; Jang, M.J.; et al. Ultrafast neuronal imaging of dopamine dynamics with designed genetically encoded sensors. Science 2018, 360, eaat4422. [Google Scholar] [CrossRef] [PubMed]
- Subramaniyan, M.; Dani, J.A. Dopaminergic and cholinergic learning mechanisms in nicotine addiction. Ann. N. Y. Acad. Sci. 2015, 1349, 46–63. [Google Scholar] [CrossRef]
- Wei, C.; Han, X.; Weng, D.; Feng, Q.; Qi, X.; Li, J.; Luo, M. Response dynamics of midbrain dopamine neurons and serotonin neurons to heroin, nicotine, cocaine, and MDMA. Cell Discov. 2018, 4, 60. [Google Scholar] [CrossRef]
- Ganaway, A.; Sunaga, Y.; Ohta, Y.; Ohta, J.; Akay, M.; Akay, Y.M. Investigating the Modulation of the VTA Neurons in Nicotine-Exposed Pups during Early Maturation Using Optogenetics. Int. J. Mol. Sci. 2023, 24, 2280. [Google Scholar] [CrossRef]
- Paredes, S.; Cantillo, S.; Candido, K.D.; Knezevic, N.N. An association of serotonin with pain disorders and its modulation by estrogens. Int. J. Mol. Sci. 2019, 20, 5729. [Google Scholar] [CrossRef]
- Šimić, G.; Tkalčić, M.; Vukić, V.; Mulc, D.; Španić, E.; Šagud, M.; Olucha-Bordonau, F.E.; Vukšić, M.; Hof, P.R. Understanding emotions: Origins and roles of the amygdala. Biomolecules 2021, 11, 823. [Google Scholar] [CrossRef]
- Neugebauer, V.; Li, W.; Bird, G.C.; Han, J.S. The amygdala and persistent pain. Neuroscientist 2004, 10, 221–234. [Google Scholar] [CrossRef] [PubMed]
- Ressler, K.J. Amygdala Activity, Fear, and Anxiety: Modulation by Stress. Biol. Psychiatry 2010, 67, 1117–1119. [Google Scholar] [CrossRef] [PubMed]
- Ling, W.; Mooney, L.; Hillhouse, M. Prescription opioid abuse, pain and addiction: Clinical issues and implications. Drug Alcohol Rev. 2011, 30, 300–305. [Google Scholar] [CrossRef] [PubMed]
- Stoicea, N.; Costa, A.; Periel, L.; Uribe, A.; Weaver, T.; Bergese, S.D. Current perspectives on the opioid crisis in the US healthcare system A comprehensive literature review. Medicine 2019, 98, e15425. [Google Scholar] [CrossRef]
- Sehgal, N.; Manchikanti, L.; Smith, H.S. Prescription Opioid Abuse in Chronic Pain: A Review of Opioid Abuse Predictors and Strategies to Curb Opioid Abuse. Narrat. Rev. 2012, 15, ES67–ES92. Available online: www.painphysicianjournal.com (accessed on 23 July 2023).
- Hamida, S.B.; Boulos, L.J.; McNicholas, M.; Charbogne, P.; Kieffer, B.L. Mu opioid receptors in GABAergic neurons of the forebrain promote alcohol reward and drinking. Addict. Biol. 2019, 24, 28–39. [Google Scholar] [CrossRef]
- Contet, C.; Kieffer, B.L.; Befort, K. Mu opioid receptor: A gateway to drug addiction. Curr. Opin. Neurobiol. 2004, 14, 370–378. [Google Scholar] [CrossRef]
- Gee, T.A.; Weintraub, N.C.; Lu, D.; Phelps, C.E.; Navratilova, E.; Heien, M.L.; Porreca, F. A pain-induced tonic hypodopaminergic state augments phasic dopamine release in the nucleus accumbens. Pain 2020, 161, 2376–2384. [Google Scholar] [CrossRef]
- Sadegzadeh, F.; Sakhaie, N.; Isazadehfar, K.; Saadati, H. Effects of exposure to enriched environment during adolescence on passive avoidance memory, nociception, and prefrontal BDNF level in adult male and female rats. Neurosci. Lett. 2020, 732, 135133. [Google Scholar] [CrossRef]
- Koo, J.W.; Lobo, M.K.; Chaudhury, D.; Labonté, B.; Friedman, A.; Heller, E.; Peña, C.J.; Han, M.-H.; Nestler, E.J. Loss of BDNF signaling in D1R-expressing NAc neurons enhances morphine reward by reducing GABA inhibition. Neuropsychopharmacology 2014, 39, 2646–2653. [Google Scholar] [CrossRef][Green Version]
- Wei, X.L.; Su, R.B.; Wu, N.; Lu, X.Q.; Zheng, J.Q.; Li, J. Agmatine inhibits morphine-induced locomotion sensitization and morphine-induced changes in striatal dopamine and metabolites in rats. Eur. Neuropsychopharmacol. 2007, 17, 790–799. [Google Scholar] [CrossRef]
- Chen, R.; Tilley, M.R.; Wei, H.; Zhou, F.; Zhou, F.-M.; Ching, S.; Quan, N.; Stephens, R.L.; Hill, E.R.; Nottoli, T.; et al. Abolished Cocaine Reward in Mice with a Cocaine-Insensitive Dopamine Transporter. Proc. Natl. Acad. Sci. USA 2006, 103, 9333–9338. [Google Scholar] [CrossRef]
- Chen, N.; Reith, E.A. Structure and Function of the Dopamine Transporter. Eur. J. Pharmacol. 2000, 405, 329–339. [Google Scholar] [CrossRef]
- Zhang, Y.; Loonam, T.M.; Noailles, P.-A.H.; Angulo, J.A.; Angulo, J. Comparison of Cocaine-and Methamphetamine-Evoked Dopamine and Glutamate Overflow in Somatodendritic and Terminal Field Regions of the Rat Brain during Acute, Chronic, and Early Withdrawal Conditions. Ann. N. Y. Acad. Sci. 2006, 937, 93–120. [Google Scholar] [CrossRef]
- Foltin, R.W.; Fischman, M.W. A Laboratory Model of Cocaine Withdrawal in Humans: Intravenous Cocaine. Exp. Clin. Psychopharmacol. 1997, 5, 404. [Google Scholar] [CrossRef]


Disclaimer/Publisher’s Note: The statements, opinions and data contained in all publications are solely those of the individual author(s) and contributor(s) and not of MDPI and/or the editor(s). MDPI and/or the editor(s) disclaim responsibility for any injury to people or property resulting from any ideas, methods, instructions or products referred to in the content. |
© 2023 by the authors. Licensee MDPI, Basel, Switzerland. This article is an open access article distributed under the terms and conditions of the Creative Commons Attribution (CC BY) license (https://creativecommons.org/licenses/by/4.0/).
Share and Cite
Ganaway, A.; Tatsuta, K.; Castillo, V.C.G.; Okada, R.; Sunaga, Y.; Ohta, Y.; Ohta, J.; Ohsawa, M.; Akay, M.; Akay, Y.M. Investigating the Influence of Morphine and Cocaine on the Mesolimbic Pathway Using a Novel Microimaging Platform. Int. J. Mol. Sci. 2023, 24, 16303. https://doi.org/10.3390/ijms242216303
Ganaway A, Tatsuta K, Castillo VCG, Okada R, Sunaga Y, Ohta Y, Ohta J, Ohsawa M, Akay M, Akay YM. Investigating the Influence of Morphine and Cocaine on the Mesolimbic Pathway Using a Novel Microimaging Platform. International Journal of Molecular Sciences. 2023; 24(22):16303. https://doi.org/10.3390/ijms242216303
Chicago/Turabian StyleGanaway, Austin, Kousuke Tatsuta, Virgil Christian Garcia Castillo, Ryoma Okada, Yoshinori Sunaga, Yasumi Ohta, Jun Ohta, Masahiro Ohsawa, Metin Akay, and Yasemin M. Akay. 2023. "Investigating the Influence of Morphine and Cocaine on the Mesolimbic Pathway Using a Novel Microimaging Platform" International Journal of Molecular Sciences 24, no. 22: 16303. https://doi.org/10.3390/ijms242216303
APA StyleGanaway, A., Tatsuta, K., Castillo, V. C. G., Okada, R., Sunaga, Y., Ohta, Y., Ohta, J., Ohsawa, M., Akay, M., & Akay, Y. M. (2023). Investigating the Influence of Morphine and Cocaine on the Mesolimbic Pathway Using a Novel Microimaging Platform. International Journal of Molecular Sciences, 24(22), 16303. https://doi.org/10.3390/ijms242216303