

Discovery and Visualization of the Hidden Relationships among N-Glycosylation, Disulfide Bonds, and Membrane Topology


Abstract
1. Introduction
2. Results and Discussion
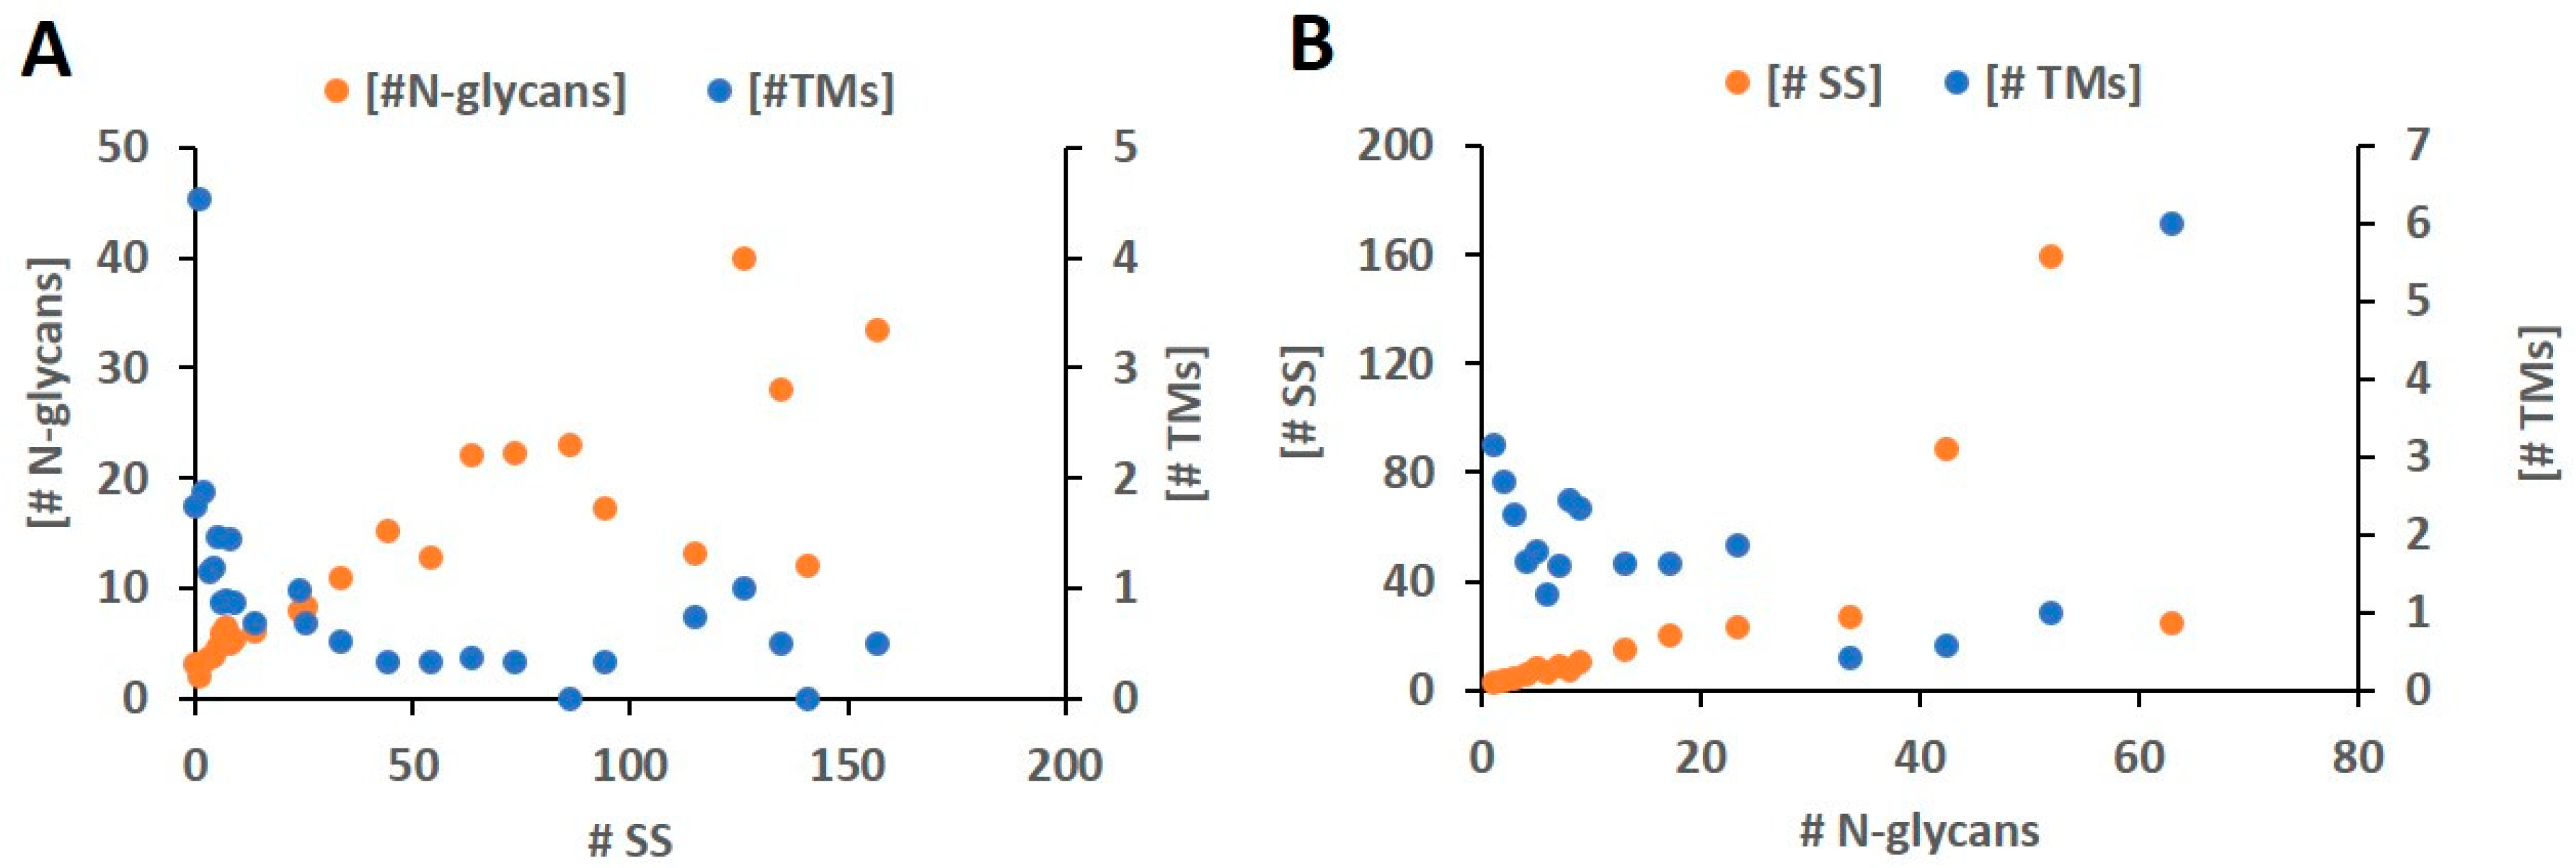
2.1. Length and Count Distribution
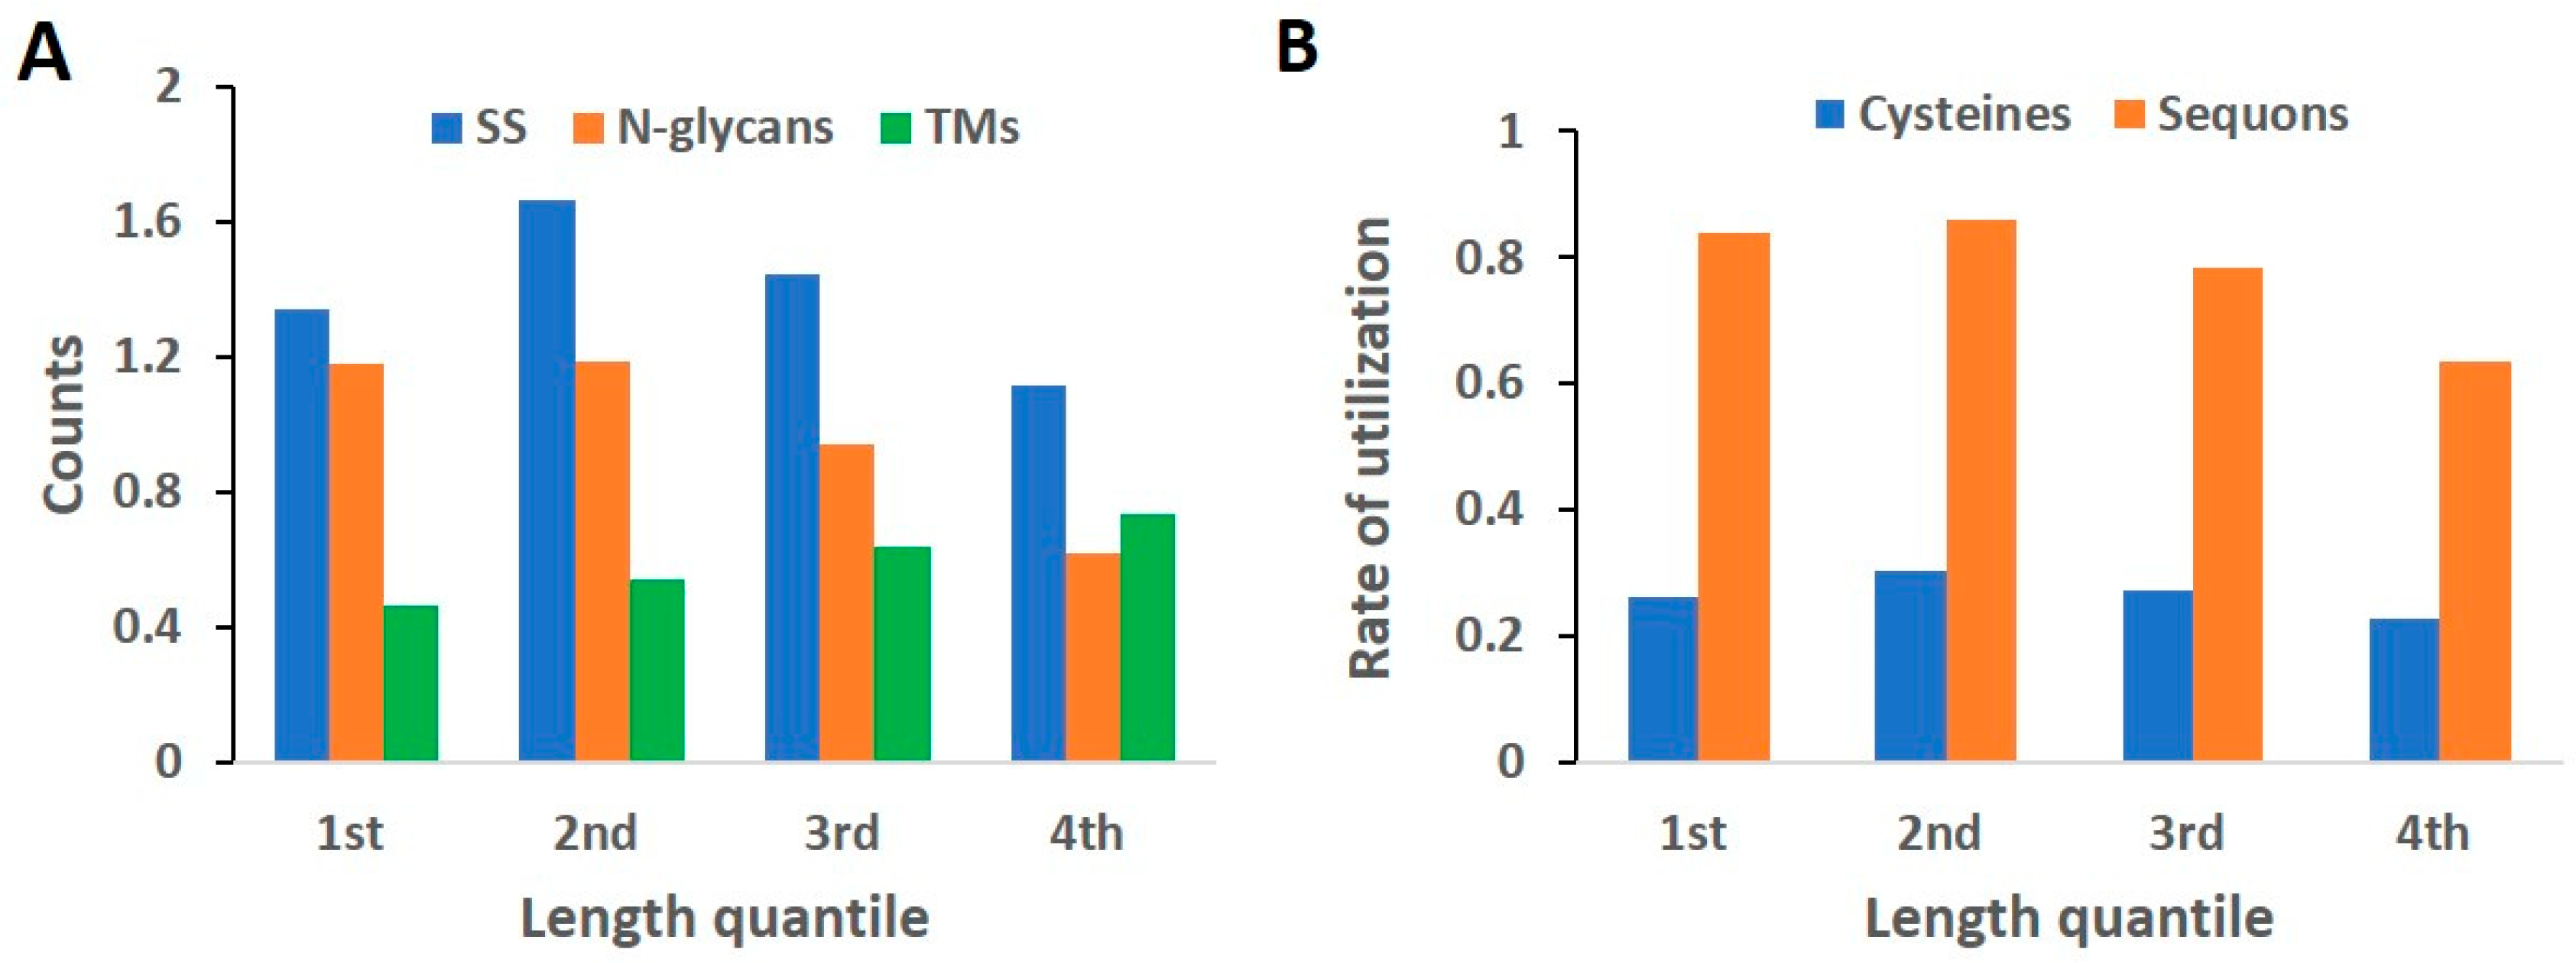
2.2. Rate of Modification
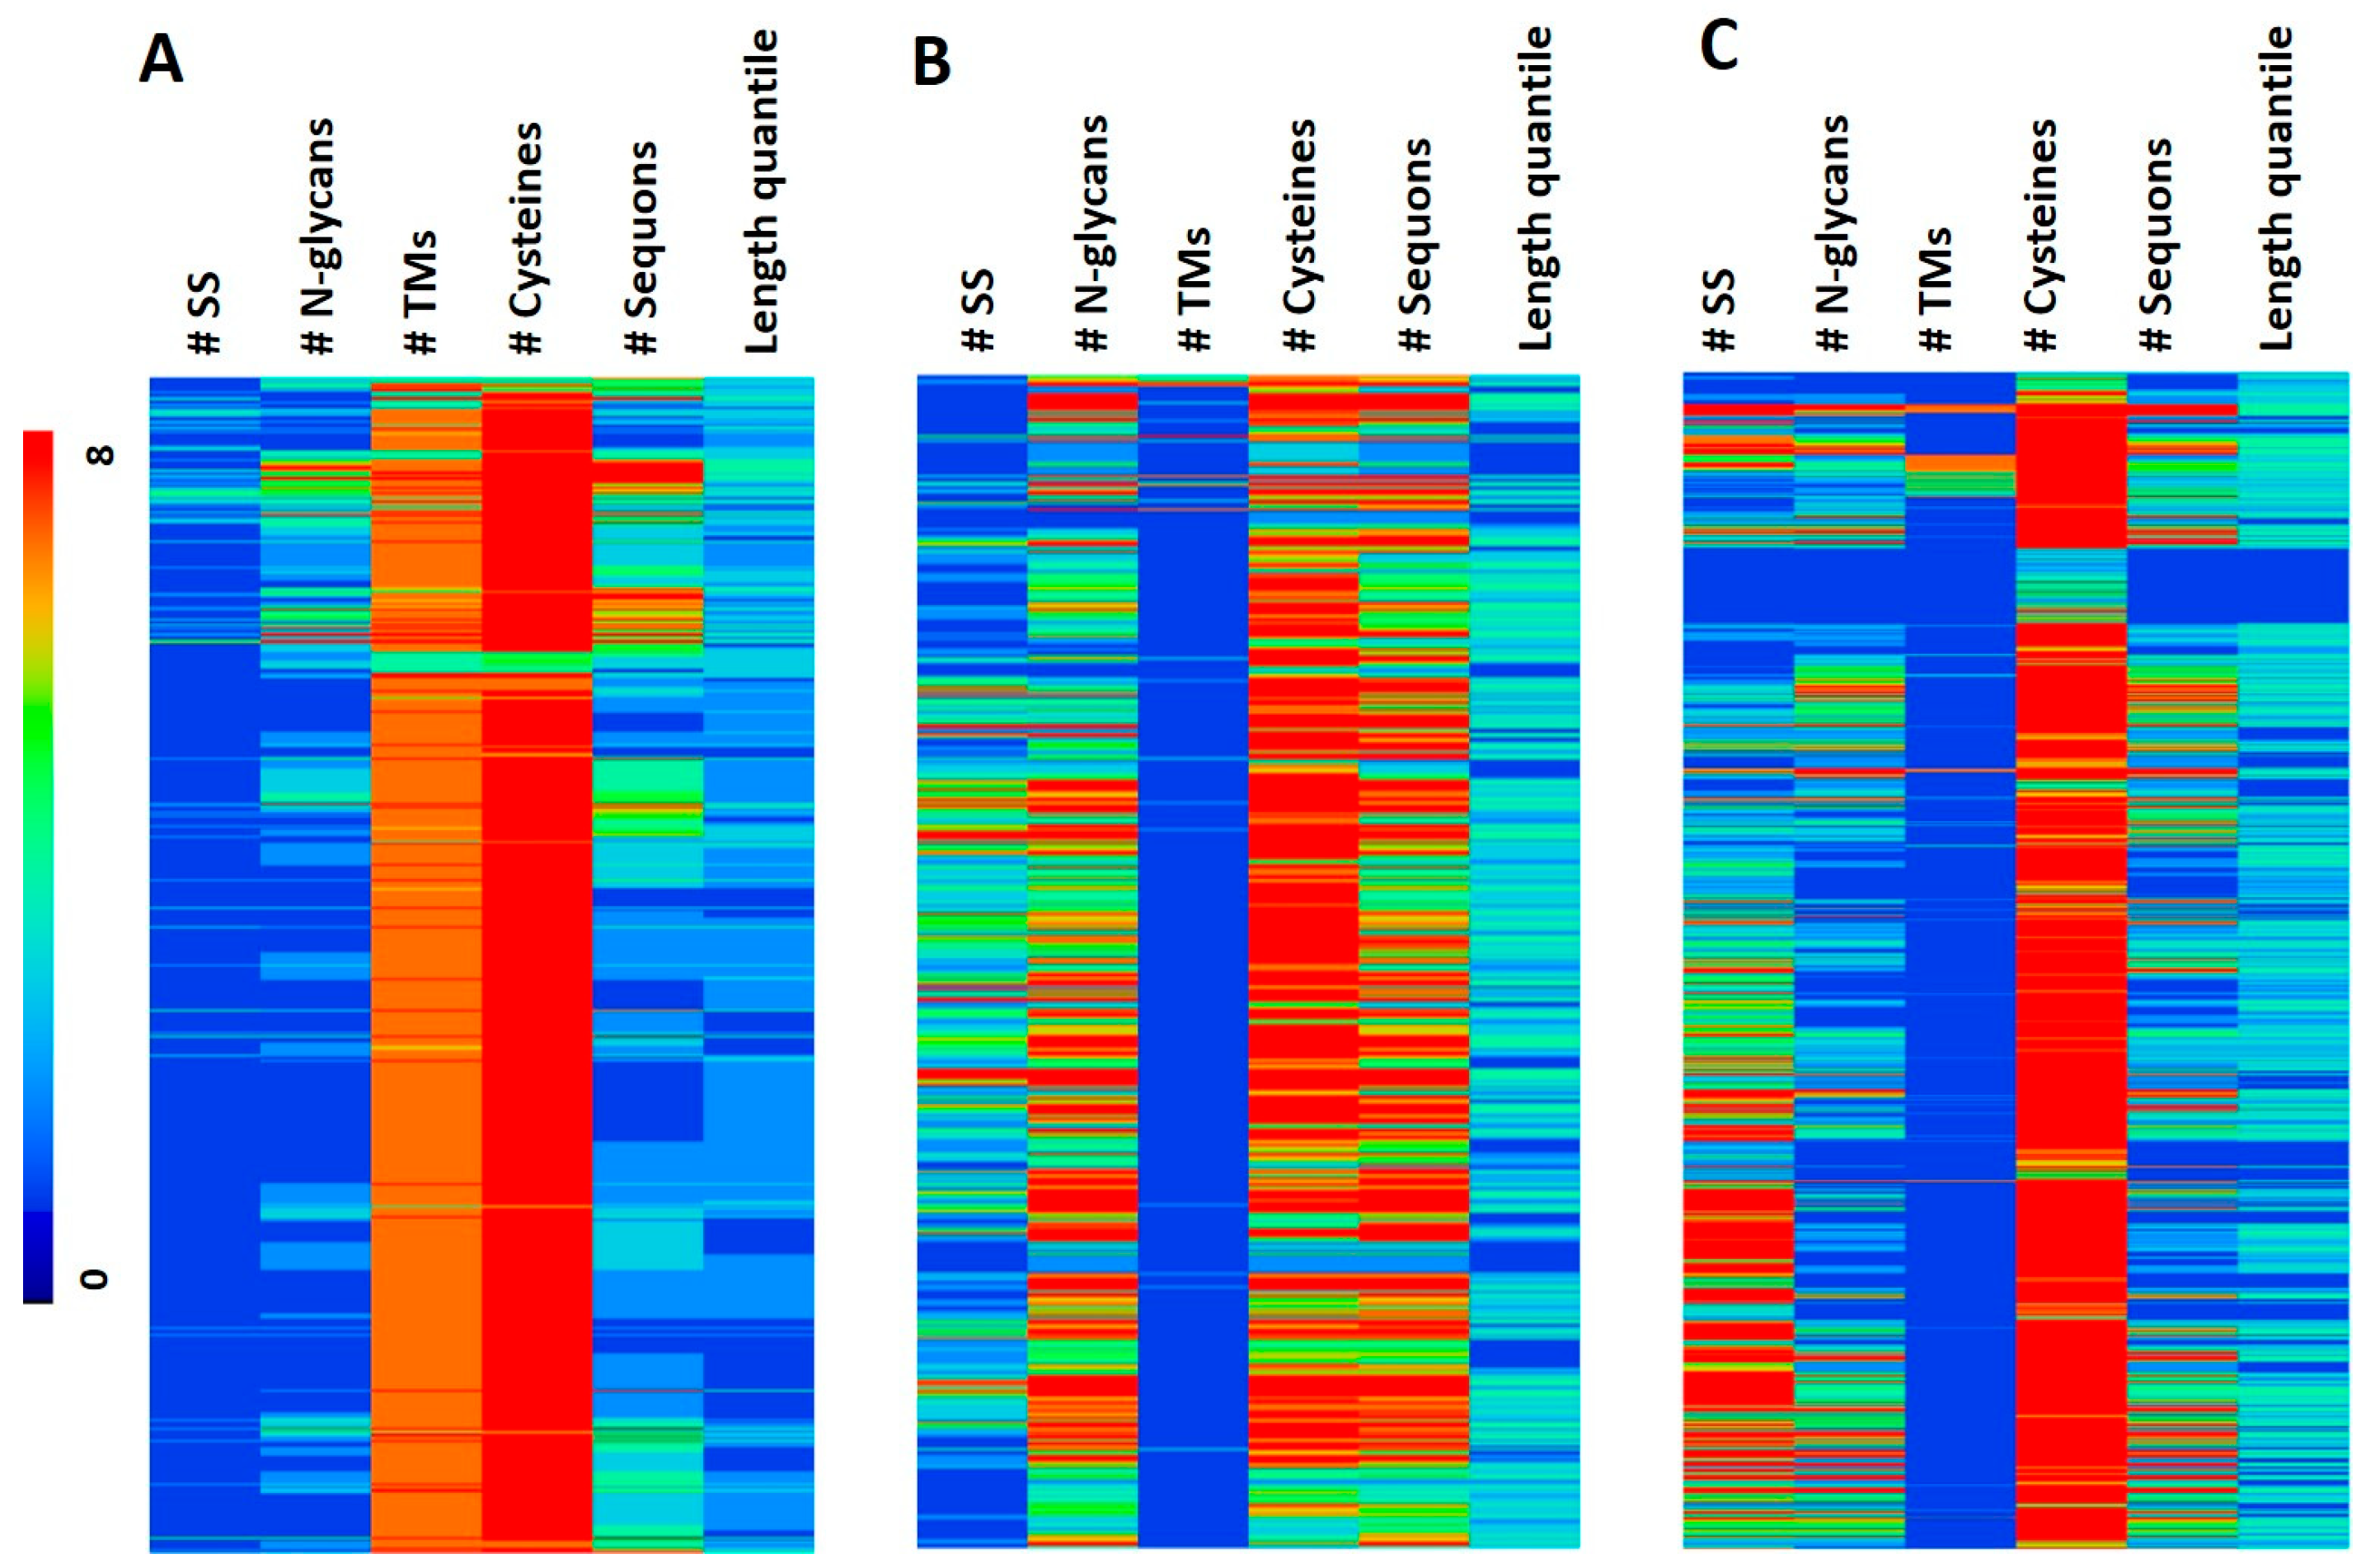
2.3. Hierarchical Clustering
2.4. Functional Analysis
2.5. Length Quantile Distribution of Features
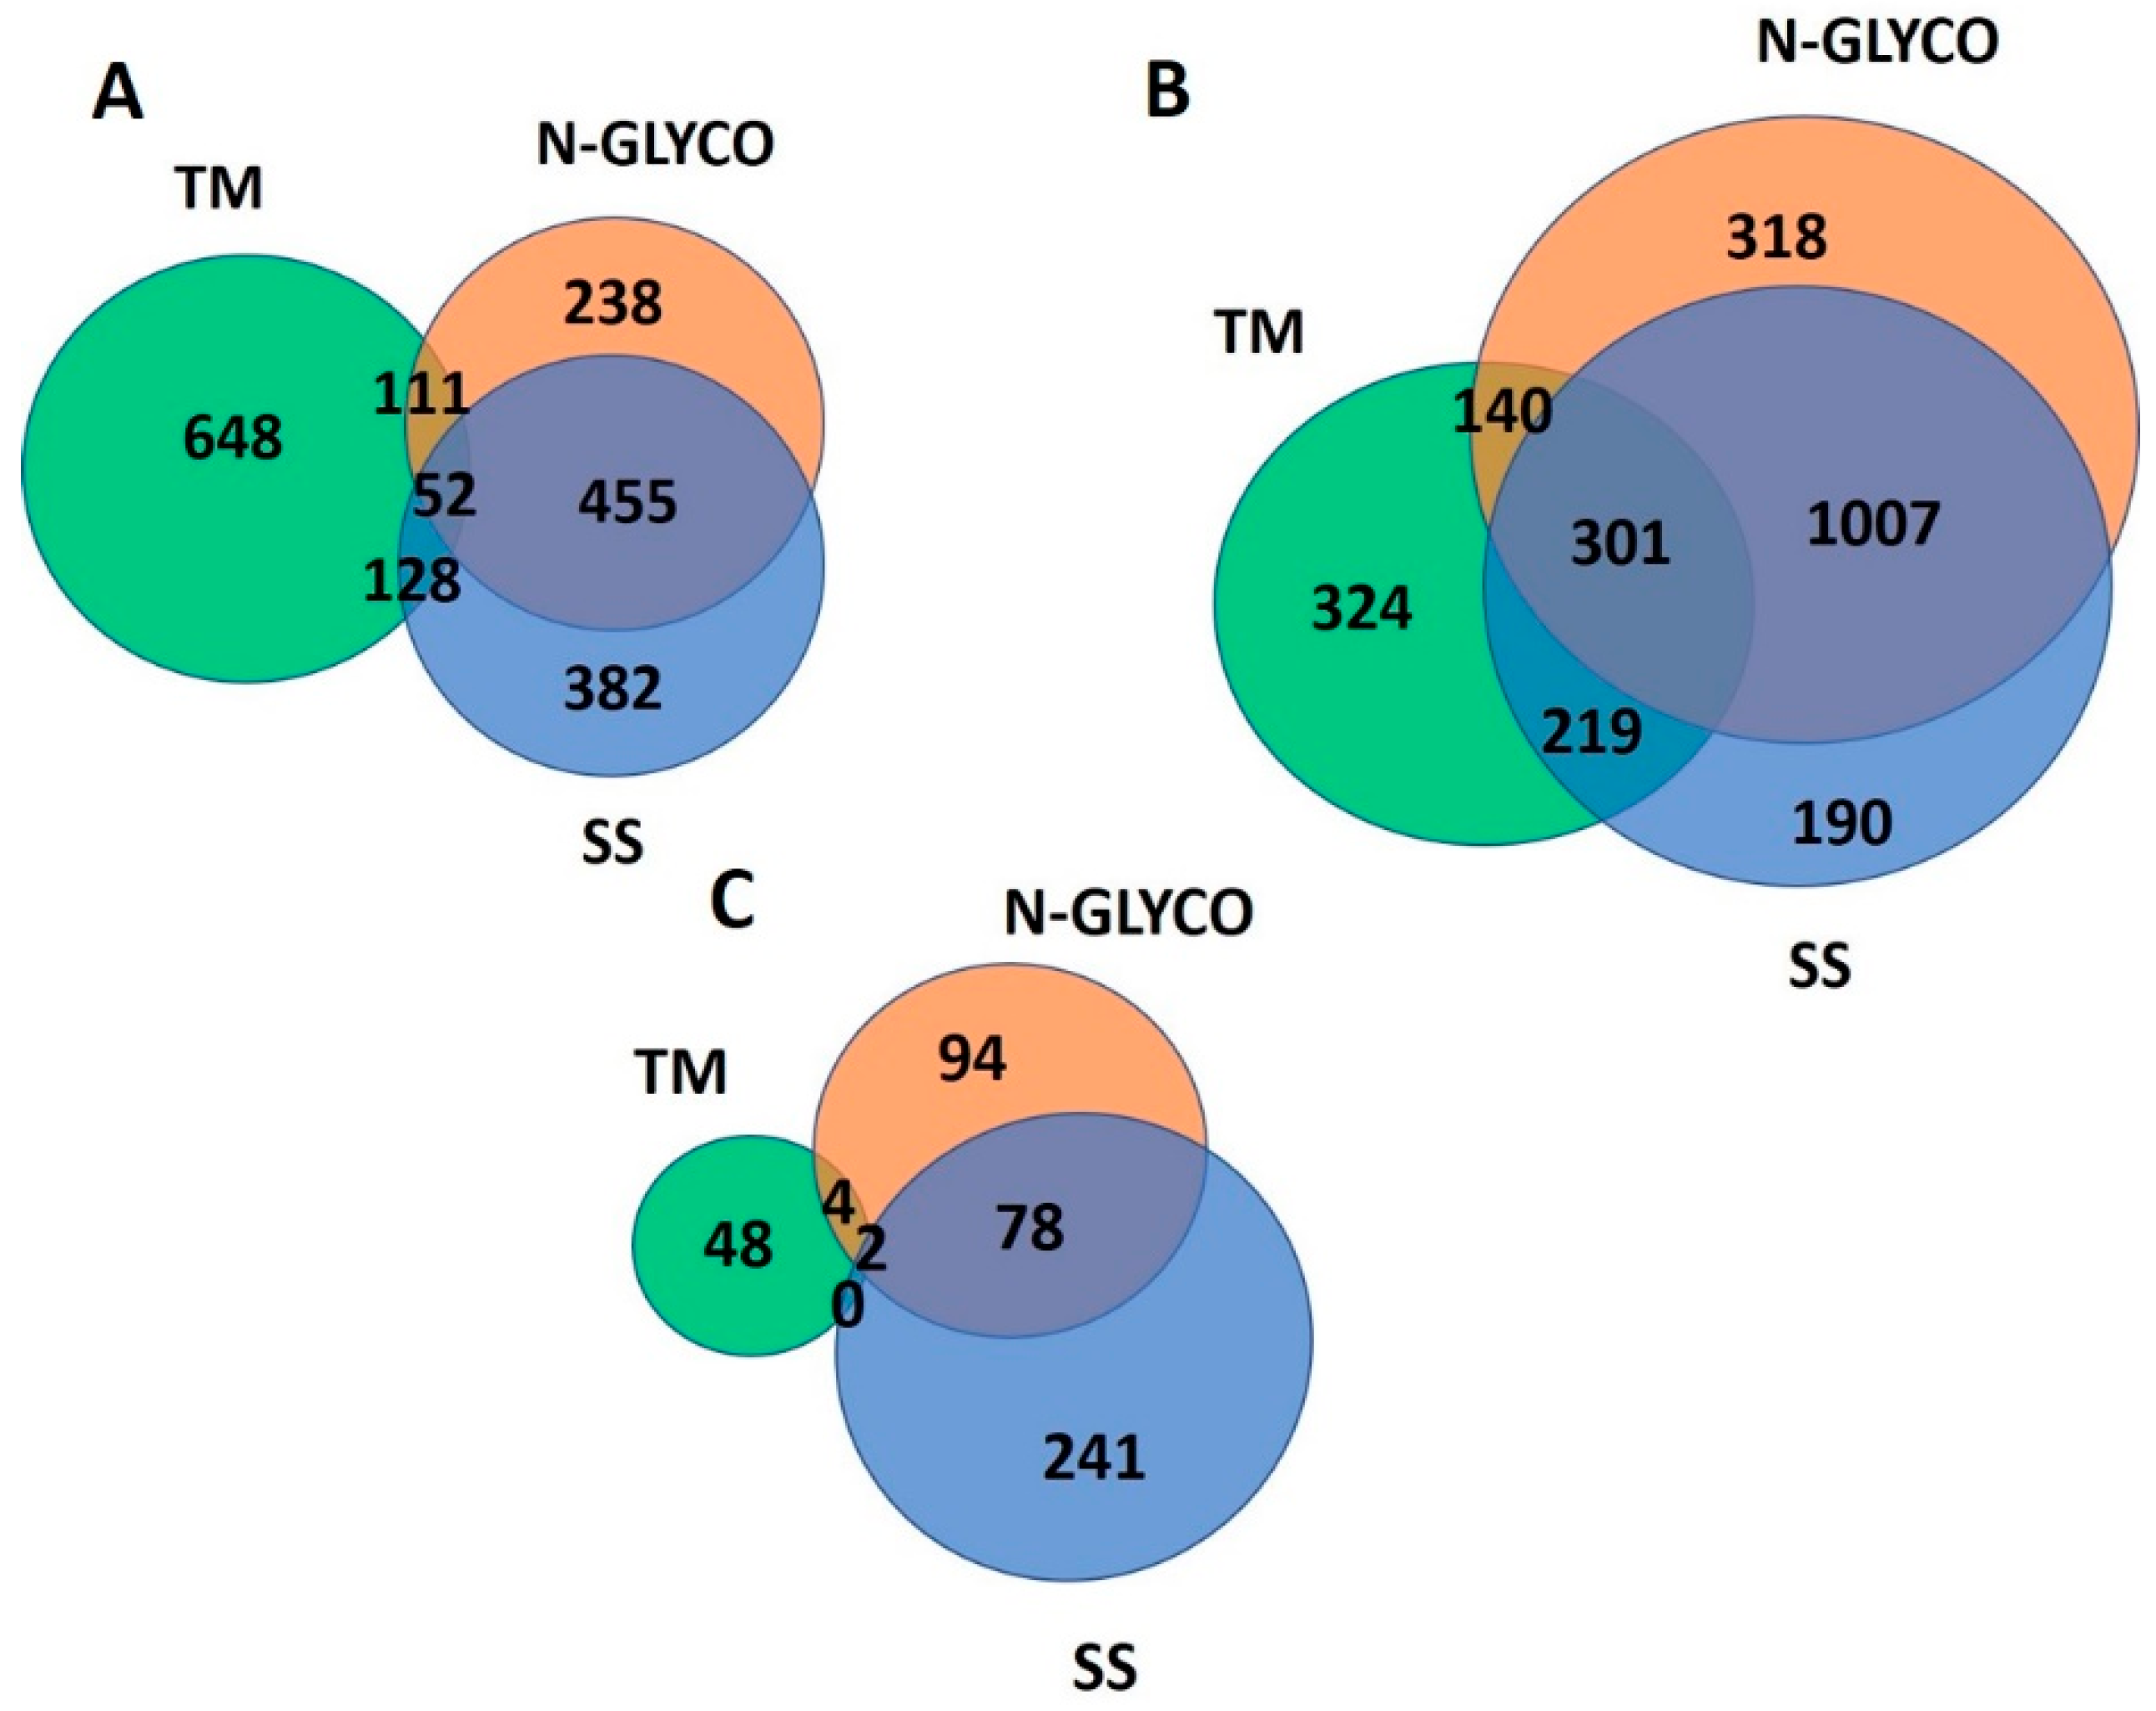
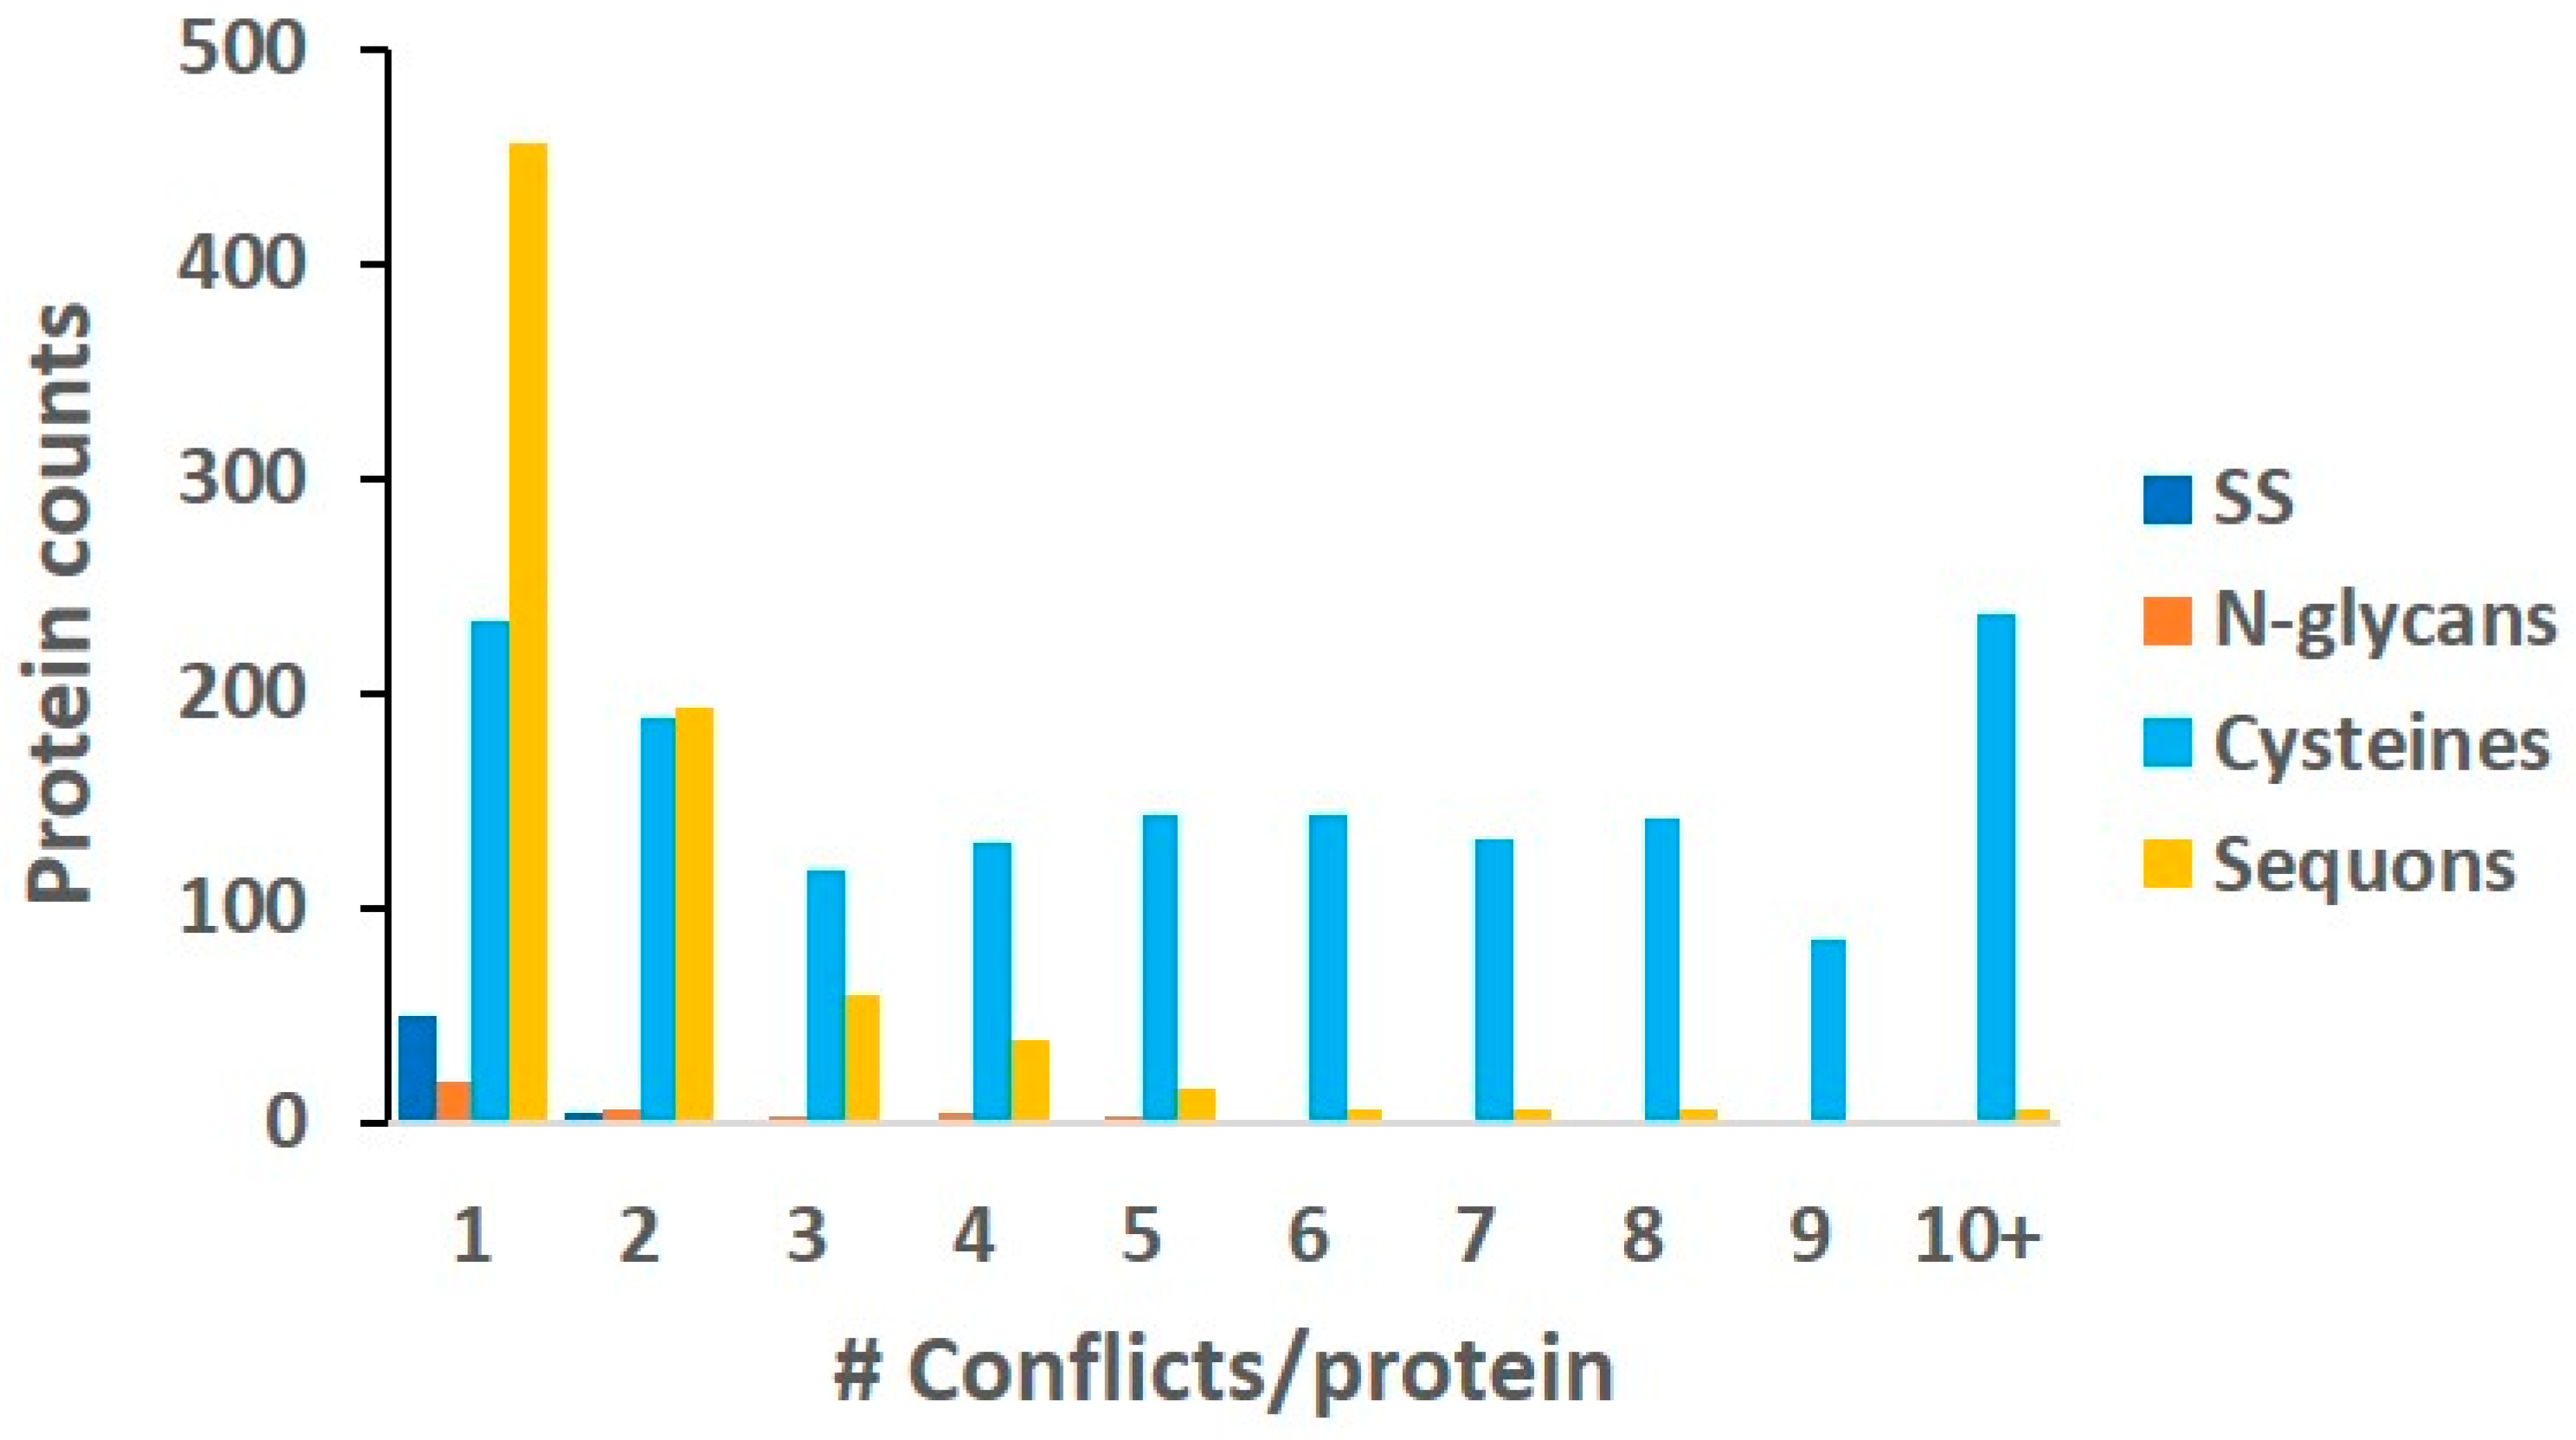
2.6. Conflicts
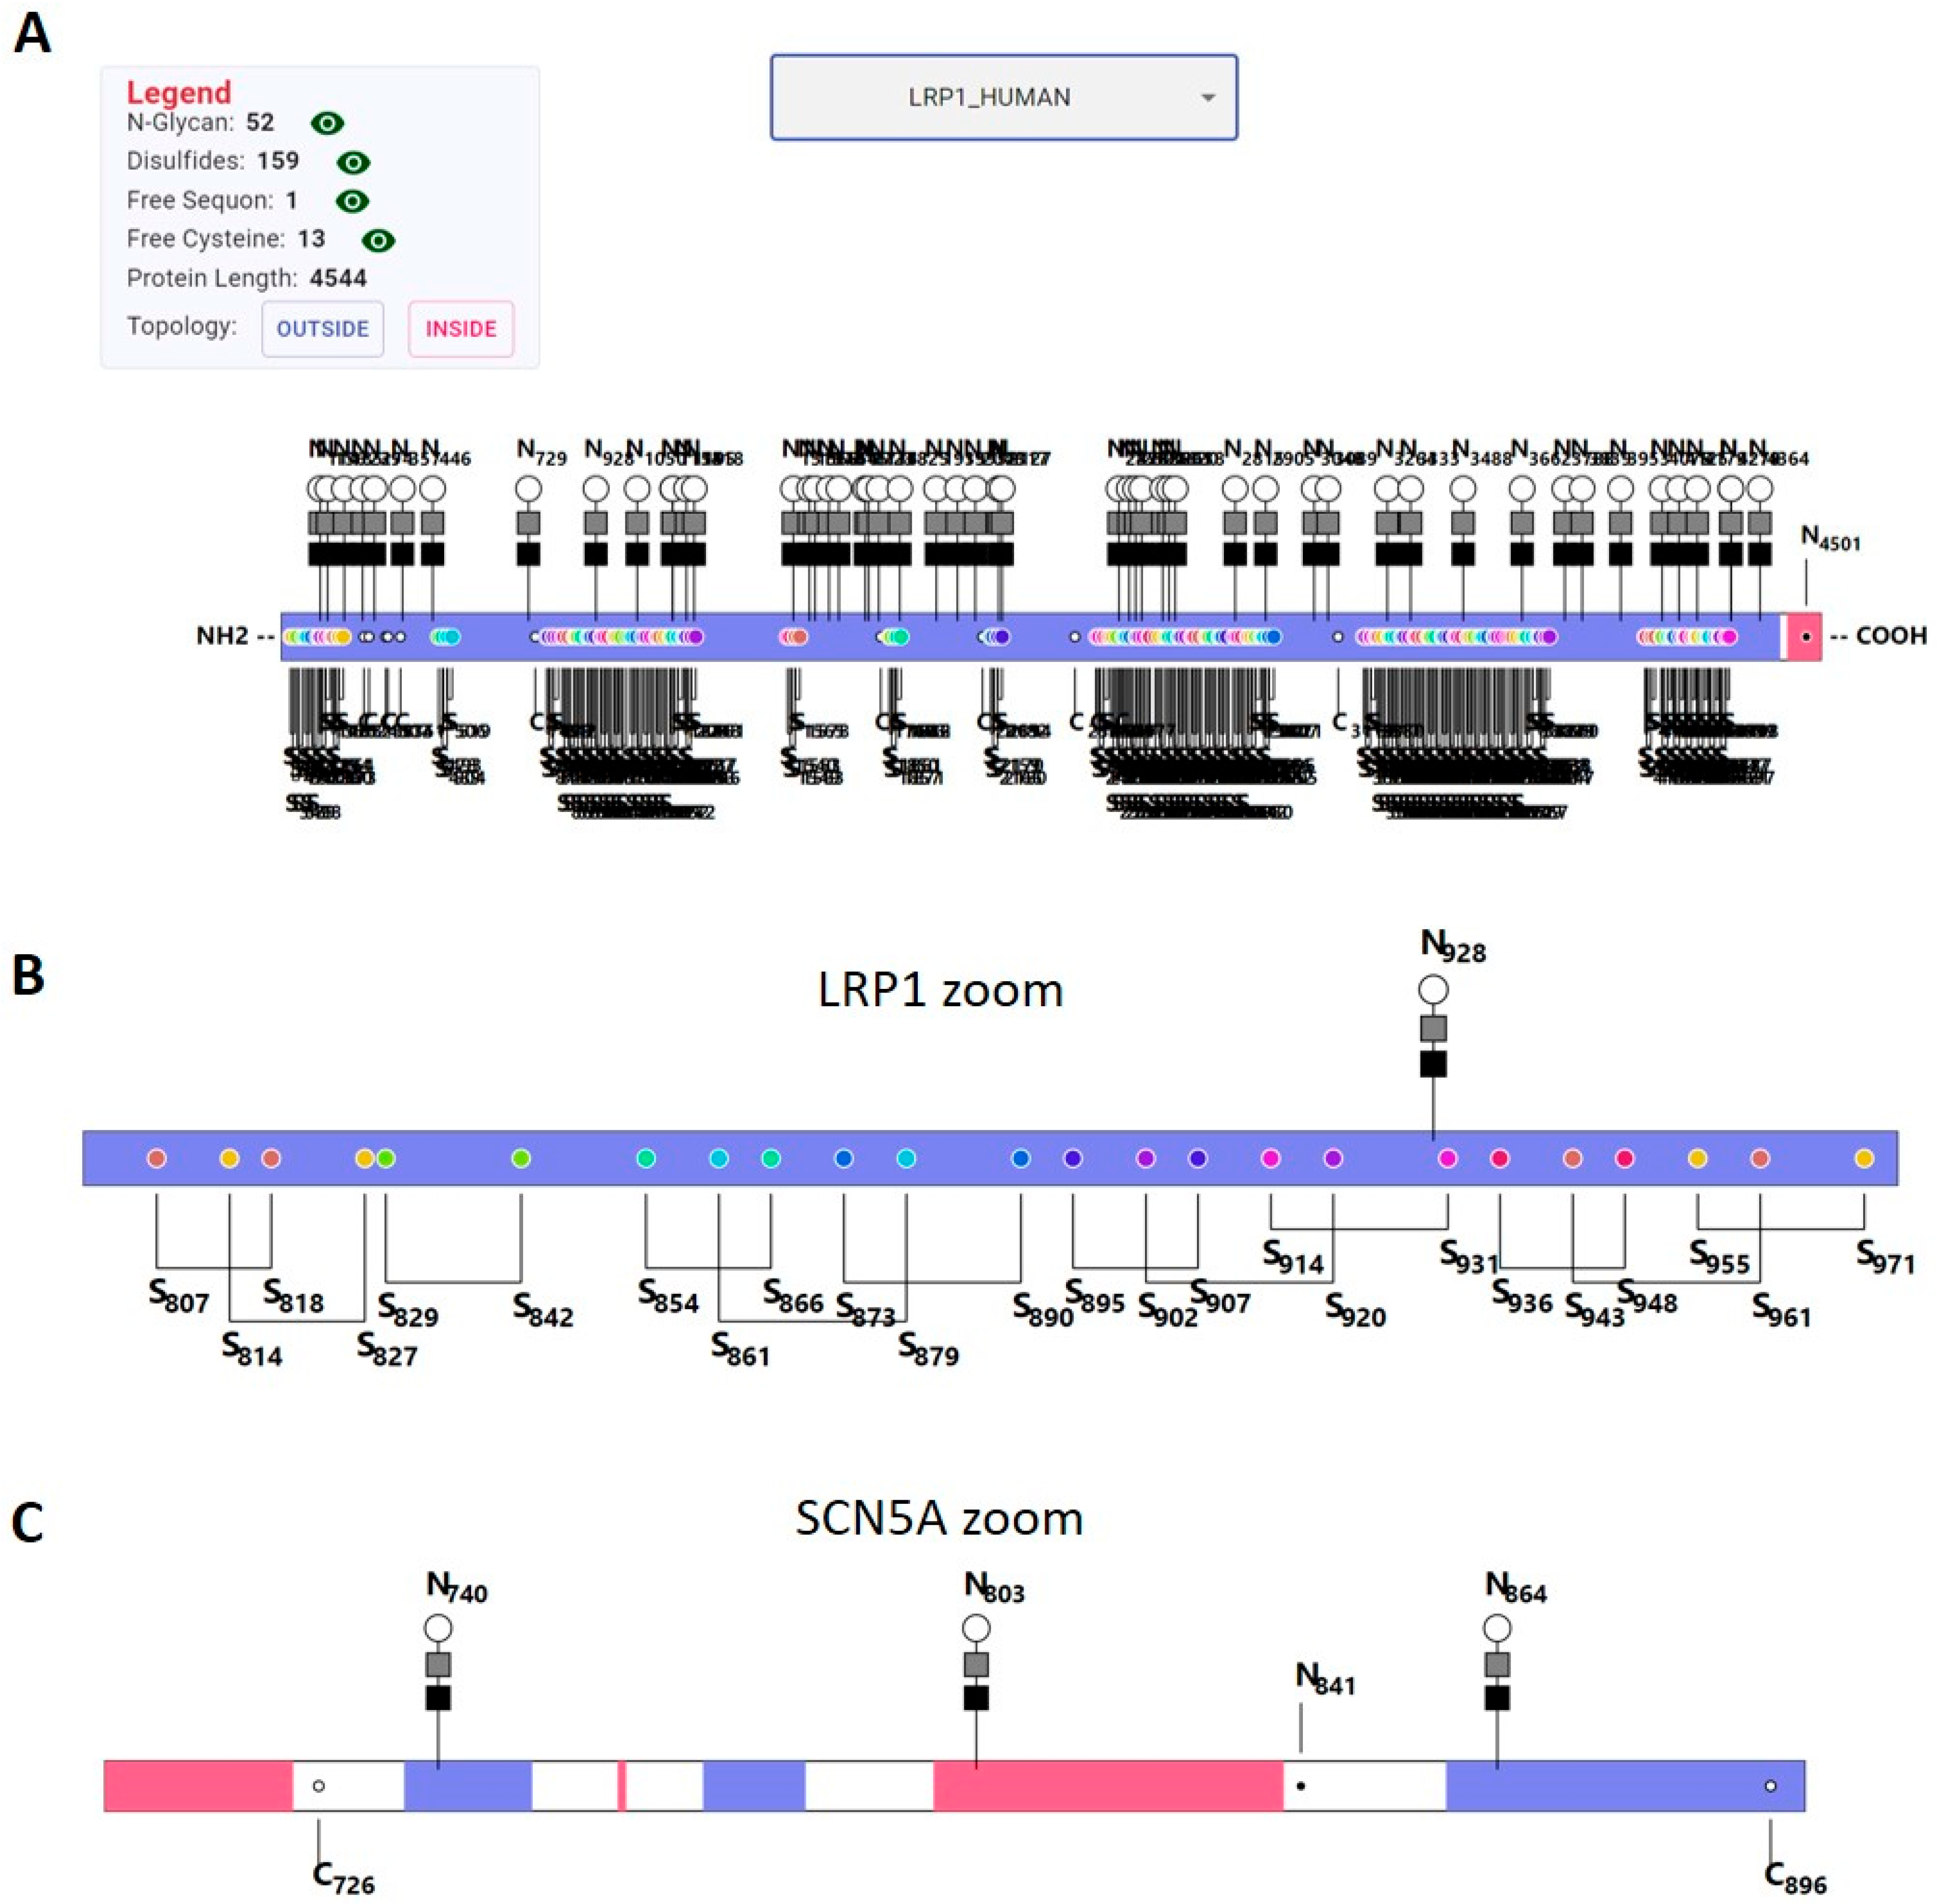
2.7. Visualization
3. Materials and Methods
3.1. Analysis of General Distribution
3.2. Rate of Modification
3.3. Hierarchical Clustering
3.4. Identification and Analysis of Conflicts
3.5. Functional Analysis
3.6. Visualization Tool
4. Conclusions
Supplementary Materials
Author Contributions
Funding
Institutional Review Board Statement
Informed Consent Statement
Data Availability Statement
Conflicts of Interest
References
- Von Heijne, G. The membrane protein universe: What’s out there and why bother? J. Intern. Med. 2007, 261, 543–557. [Google Scholar] [CrossRef] [PubMed]
- Arinaminpathy, Y.; Khurana, E.; Engelman, D.M.; Gerstein, M.B. Computational analysis of membrane proteins: The largest class of drug targets. Drug Discov. Today 2009, 14, 1130–1135. [Google Scholar] [CrossRef] [PubMed]
- Von Heijne, G. Membrane-protein topology. Nat. Rev. Mol. Cell Biol. 2006, 7, 909–918. [Google Scholar] [CrossRef] [PubMed]
- White, S.H.; Wimley, W.C. MEMBRANE PROTEIN FOLDING AND STABILITY: Physical Principles. Annu. Rev. Biophys. Biomol. Struct. 1999, 28, 319–365. [Google Scholar] [CrossRef]
- Feng, X.; Barth, P. A topological and conformational stability alphabet for multipass membrane proteins. Nat. Chem. Biol. 2016, 12, 167–173. [Google Scholar] [CrossRef] [PubMed]
- Bill, R.M.; Henderson, P.J.F.; Iwata, S.; Kunji, E.R.S.; Michel, H.; Neutze, R.; Newstead, S.; Poolman, B.; Tate, C.G.; Vogel, H. Overcoming barriers to membrane protein structure determination. Nat. Biotechnol. 2011, 29, 335–340. [Google Scholar] [CrossRef] [PubMed]
- Danmaliki, G.I.; Hwang, P.M. Solution NMR spectroscopy of membrane proteins. Biochim. Biophys. Acta (BBA)-Biomembr. 2020, 1862, 183356. [Google Scholar] [CrossRef]
- McGilvray, P.T.; Anghel, S.A.; Sundaram, A.; Zhong, F.; Trnka, M.J.; Fuller, J.R.; Hu, H.; Burlingame, A.L.; Keenan, R.J. An ER translocon for multi-pass membrane protein biogenesis. eLife 2020, 9, e56889. [Google Scholar] [CrossRef]
- Moss, K.; Helm, A.; Lu, Y.; Bragin, A.; Skach, W.R. Coupled translocation events generate topological heterogeneity at the endoplasmic reticulum membrane. Mol. Biol. Cell 1998, 9, 2681–2697. [Google Scholar] [CrossRef][Green Version]
- Almeida, J.G.; Preto, A.J.; Koukos, P.I.; Bonvin, A.M.; Moreira, I.S. Membrane proteins structures: A review on computational modeling tools. Biochim. Biophys. Acta (BBA)-Biomembr. 2017, 1859, 2021–2039. [Google Scholar] [CrossRef]
- Kyte, J.; Doolittle, R.F. A simple method for displaying the hydropathic character of a protein. J. Mol. Biol. 1982, 157, 105–132. [Google Scholar] [CrossRef]
- Cserzo, M.; Wallin, E.; Simon, I.; von Heijne, G.; Elofsson, A. Prediction of transmembrane alpha-helices in prokaryotic membrane proteins: The dense alignment surface method. Protein Eng. Des. Sel. 1997, 10, 673–676. [Google Scholar] [CrossRef]
- Yuan, Z.; Mattick, J.S.; Teasdale, R.D. SVMtm: Support vector machines to predict transmembrane segments. J. Comput. Chem. 2004, 25, 632–636. [Google Scholar] [CrossRef] [PubMed]
- Krogh, A.; Larsson, B.; von Heijne, G.; Sonnhammer, E.L. Predicting transmembrane protein topology with a hidden markov model: Application to complete genomes. J. Mol. Biol. 2001, 305, 567–580. [Google Scholar] [CrossRef] [PubMed]
- Rost, B.; Fariselli, P.; Casadio, R. Topology prediction for helical transmembrane proteins at 86% accuracy–Topology prediction at 86% accuracy. Protein Sci. 1996, 5, 1704–1718. [Google Scholar] [CrossRef]
- Krogh, A.; Tsirigos, K.D.; Pedersen, M.D.; Almagro Armenteros, J.J.; Marcatili, P.; Nielsen, H.; Hallgren, J.; Winther, O. Deep TMHMM predicts alpha and beta transmembrane proteins using deep neural networks. Biorxiv 2022, 4, 487609. [Google Scholar] [CrossRef]
- Walsh, C.T.; Garneau-Tsodikova, S.; Gatto, G.J., Jr. Protein Posttranslational Modifications: The Chemistry of Proteome Diversifications. Angew. Chem. Int. Ed. 2005, 44, 7342–7372. [Google Scholar] [CrossRef]
- Dutta, D.; Mandal, C.; Mandal, C. Unusual glycosylation of proteins: Beyond the universal sequon and other amino acids. Biochim. Biophys. Acta (BBA)-Gen. Subj. 2017, 1861, 3096–3108. [Google Scholar] [CrossRef] [PubMed]
- Van Geest, M.; Lolkema, J.S. Membrane topology and insertion of membrane proteins: Search for topogenic signals. Microbiol. Mol. Biol. Rev. 2000, 64, 13–33. [Google Scholar] [CrossRef] [PubMed]
- Braunger, K.; Pfeffer, S.; Shrimal, S.; Gilmore, R.; Berninghausen, O.; Mandon, E.C.; Becker, T.; Förster, F.; Beckmann, R. Structural basis for coupling protein transport and N-glycosylation at the mammalian endoplasmic reticulum. Science 2018, 360, 215–219. [Google Scholar] [CrossRef]
- Mohorko, E.; Glockshuber, R.; Aebi, M. Oligosaccharyltransferase: The central enzyme of N-linked protein glycosylation. J. Inherit. Metab. Dis. 2011, 34, 869–878. [Google Scholar] [CrossRef] [PubMed]
- Bakshi, T.; Pham, D.; Kaur, R.; Sun, B. Hidden Relationships between N-Glycosylation and Disulfide Bonds in Individual Proteins. Int. J. Mol. Sci. 2022, 23, 3742. [Google Scholar] [CrossRef] [PubMed]
- Patel, C.; Saad, H.; Shenkman, M.; Lederkremer, G.Z. Oxidoreductases in Glycoprotein Glycosylation, Folding, and ERAD. Cells 2020, 9, 2138. [Google Scholar] [CrossRef] [PubMed]
- Lluis, M.W.; Godfroy, J.I.; Yin, H. Protein engineering methods applied to membrane protein targets. Protein Eng. Des. Sel. 2013, 26, 91–100. [Google Scholar] [CrossRef] [PubMed]
- Sowlati-Hashjin, S.; Gandhi, A.; Garton, M. Dawn of a new era for membrane protein design. BioDesign Res. 2022, 2022, 9791435. [Google Scholar] [CrossRef]
- Vorobieva, A.A. Principles and Methods in Computational Membrane Protein Design. J. Mol. Biol. 2021, 433, 167154. [Google Scholar] [CrossRef]
- Rosenbaum, D.M.; Rasmussen, S.G.; Kobilka, B.K. The structure and function of G-protein-coupled receptors. Nature 2009, 459, 356–363. [Google Scholar] [CrossRef]
- Sriram, K.; Insel, P.A. G Protein-Coupled Receptors as Targets for Approved Drugs: How Many Targets and How Many Drugs? Mol. Pharmacol. 2018, 93, 251–258. [Google Scholar] [CrossRef]
- Tu, L.; Khanna, P.; Deutsch, C. Transmembrane segments form tertiary hairpins in the folding vestibule of the ribosome. J. Mol. Biol. 2014, 426, 185–198. [Google Scholar] [CrossRef]
- MacKenzie, K.R. Folding and stability of α-helical integral membrane proteins. Chem. Rev. 2006, 106, 1931–1977. [Google Scholar] [CrossRef]
- Yogurtcu, O.N.; Johnson, M.E. Cytosolic proteins can exploit membrane localization to trigger functional assembly. PLOS Comput. Biol. 2018, 14, e1006031. [Google Scholar] [CrossRef]
- Jiang, D.; Shi, H.; Tonggu, L.; El-Din, T.M.G.; Lenaeus, M.J.; Zhao, Y.; Yoshioka, C.; Zheng, N.; Catterall, W.A. Structure of the Cardiac Sodium Channel. Cell 2020, 180, 122–134.e10. [Google Scholar] [CrossRef] [PubMed]
- Mamathambika, B.S.; Bardwell, J.C. Disulfide-linked protein folding pathways. Annu. Rev. Cell Dev. Biol. 2008, 24, 211–235. [Google Scholar] [CrossRef]
- Schwarz, F.; Aebi, M. Mechanisms and principles of N-linked protein glycosylation. Curr. Opin. Struct. Biol. 2011, 21, 576–582. [Google Scholar] [CrossRef]
- Eitner, K.; Koch, U.; Gawęda, T.; Marciniak, J. Statistical distribution of amino acid sequences: A proof of Darwinian evolution. Bioinformatics 2010, 26, 2933–2935. [Google Scholar] [CrossRef]
- Brooks, D.J.; Fresco, J.R.; Lesk, A.M.; Singh, M. Evolution of amino acid frequencies in proteins over deep time: Inferred order of introduction of amino acids into the genetic code. Mol. Biol. Evol. 2002, 19, 1645–1655. [Google Scholar] [CrossRef] [PubMed]
- Cremers, C.M.; Jakob, U. Oxidant sensing by reversible disulfide bond formation. J. Biol. Chem. 2013, 288, 26489–26496. [Google Scholar] [CrossRef] [PubMed]
- Liu-Shin, L.P.-Y.; Fung, A.; Malhotra, A.; Ratnaswamy, G. Evidence of disulfide bond scrambling during production of an antibody-drug conjugate. mAbs 2018, 10, 1190–1199. [Google Scholar] [CrossRef] [PubMed]
- Resemann, A.; Liu-Shin, L.; Tremintin, G.; Malhotra, A.; Fung, A.; Wang, F.; Ratnaswamy, G.; Suckau, D. Rapid, automated characterization of disulfide bond scrambling and IgG2 isoform determination. mAbs 2018, 10, 1200–1213. [Google Scholar] [CrossRef] [PubMed]
- Ilbert, M.; Horst, J.; Ahrens, S.; Winter, J.; Graf, P.C.F.; Lilie, H.; Jakob, U. The redox-switch domain of Hsp33 functions as dual stress sensor. Nat. Struct. Mol. Biol. 2007, 14, 556–563. [Google Scholar] [CrossRef]
- Sun, B.; Ma, L.; Yan, X.; Lee, D.; Alexander, V.; Hohmann, L.J.; Lorang, C.; Chandrasena, L.; Tian, Q.; Hood, L. N-Glycoproteome of E14.Tg2a Mouse Embryonic Stem Cells. PLoS ONE 2013, 8, e55722. [Google Scholar] [CrossRef]
- Sun, B.; Ranish, J.A.; Utleg, A.G.; White, J.T.; Yan, X.; Lin, B.; Hood, L. Shotgun Glycopeptide Capture Approach Coupled with Mass Spectrometry for Comprehensive Glycoproteomics. Mol. Cell. Proteom. 2007, 6, 141–149. [Google Scholar] [CrossRef] [PubMed]
- Sezgin, E.; Levental, I.; Mayor, S.; Eggeling, C. The mystery of membrane organization: Composition, regulation and roles of lipid rafts. Nat. Rev. Mol. Cell Biol. 2017, 18, 361–374. [Google Scholar] [CrossRef]
- Nezhady, M.A.M.; Rivera, J.C.; Chemtob, S. Location Bias as Emerging Paradigm in GPCR Biology and Drug Discovery. iScience 2020, 23, 101643. [Google Scholar] [CrossRef]
- Alberti, S. Phase separation in biology. Curr. Biol. 2017, 27, R1097–R1102. [Google Scholar] [CrossRef]
- Medus, M.L.; Gomez, G.E.; Zacchi, L.F.; Couto, P.M.; Labriola, C.A.; Labanda, M.S.; Bielsa, R.C.; Clérico, E.M.; Schulz, B.L.; Caramelo, J.J. N-glycosylation Triggers a Dual Selection Pressure in Eukaryotic Secretory Proteins. Sci. Rep. 2017, 7, 8788. [Google Scholar] [CrossRef]
- Denic, V.; Dötsch, V.; Sinning, I. Endoplasmic reticulum targeting and insertion of tail-anchored membrane proteins by the get pathway. Cold Spring Harb. Perspect. Biol. 2013, 5, a013334. [Google Scholar] [CrossRef] [PubMed]
- Vogt, G.; Chapgier, A.; Yang, K.; Chuzhanova, N.; Feinberg, J.; Fieschi, C.; Boisson-Dupuis, S.; Alcais, A.; Filipe-Santos, O.; Bustamante, J.; et al. Gains of glycosylation comprise an unexpectedly large group of pathogenic mutations. Nat. Genet. 2005, 37, 692–700. [Google Scholar] [CrossRef]
- Apweiler, R.; Hermjakob, H.; Sharon, N. On the frequency of protein glycosylation, as deduced from analysis of the SWISS-PROT database. Biochim. Biophys. Acta (BBA)-Gen. Subj. 1999, 1473, 4–8. [Google Scholar] [CrossRef]
- Tsai, C.-H.; Chan, C.-H.; Chen, B.-J.; Kao, C.-Y.; Liu, H.-L.; Hsu, J.-P. Bioinformatics approaches for disulfide connectivity prediction. Curr. Protein Pept. Sci. 2007, 8, 243–260. [Google Scholar] [CrossRef]
- Tüdős, E.; Mészáros, B.; Fiser, A.; Simon, I. A word of caution about biological inference—Revisiting cysteine covalent state predictions. FEBS Open Bio 2014, 4, 310–314. [Google Scholar] [CrossRef]
- Omasits, U.; Ahrens, C.H.; Müller, S.; Wollscheid, B. Protter: Interactive protein feature visualization and integration with experimental proteomic data. Bioinformatics 2014, 30, 884–886. [Google Scholar] [CrossRef]
- Sherman, B.T.; Hao, M.; Qiu, J.; Jiao, X.; Baseler, M.W.; Lane, H.C.; Imamichi, T.; Chang, W. DAVID: A web server for functional enrichment analysis and functional annotation of gene lists (2021 update). Nucleic Acids Res. 2022, 50, W216–W221. [Google Scholar] [CrossRef] [PubMed]
- Reily, C.; Stewart, T.J.; Renfrow, M.B.; Novak, J. Glycosylation in health and disease. Nat. Rev. Nephrol. 2019, 15, 346–366. [Google Scholar] [CrossRef] [PubMed]
- Bond, M.R.; Hanover, J.A. A little sugar goes a long way: The cell biology of O-GlcNAc. J. Cell Biol. 2015, 208, 869–880. [Google Scholar] [CrossRef]
- Guinez, C.; Morelle, W.; Michalski, J.-C.; Lefebvre, T. O-GlcNAc glycosylation: A signal for the nuclear transport of cytosolic proteins? Int. J. Biochem. Cell Biol. 2005, 37, 765–774. [Google Scholar] [CrossRef] [PubMed]
- Hart, G.W.; Slawson, C.; Ramirez-Correa, G.; Lagerlof, O. Cross talk between o-glcnacylation and phosphorylation: Roles in signaling, transcription, and chronic disease. Annu. Rev. Biochem. 2011, 80, 825–858. [Google Scholar] [CrossRef]


Disclaimer/Publisher’s Note: The statements, opinions and data contained in all publications are solely those of the individual author(s) and contributor(s) and not of MDPI and/or the editor(s). MDPI and/or the editor(s) disclaim responsibility for any injury to people or property resulting from any ideas, methods, instructions or products referred to in the content. |
© 2023 by the authors. Licensee MDPI, Basel, Switzerland. This article is an open access article distributed under the terms and conditions of the Creative Commons Attribution (CC BY) license (https://creativecommons.org/licenses/by/4.0/).
Share and Cite
Desai, M.; Singh, A.; Pham, D.; Chowdhury, S.R.; Sun, B. Discovery and Visualization of the Hidden Relationships among N-Glycosylation, Disulfide Bonds, and Membrane Topology. Int. J. Mol. Sci. 2023, 24, 16182. https://doi.org/10.3390/ijms242216182
Desai M, Singh A, Pham D, Chowdhury SR, Sun B. Discovery and Visualization of the Hidden Relationships among N-Glycosylation, Disulfide Bonds, and Membrane Topology. International Journal of Molecular Sciences. 2023; 24(22):16182. https://doi.org/10.3390/ijms242216182
Chicago/Turabian StyleDesai, Manthan, Amritpal Singh, David Pham, Syed Rafid Chowdhury, and Bingyun Sun. 2023. "Discovery and Visualization of the Hidden Relationships among N-Glycosylation, Disulfide Bonds, and Membrane Topology" International Journal of Molecular Sciences 24, no. 22: 16182. https://doi.org/10.3390/ijms242216182
APA StyleDesai, M., Singh, A., Pham, D., Chowdhury, S. R., & Sun, B. (2023). Discovery and Visualization of the Hidden Relationships among N-Glycosylation, Disulfide Bonds, and Membrane Topology. International Journal of Molecular Sciences, 24(22), 16182. https://doi.org/10.3390/ijms242216182