Article

Genome-Wide Analysis of bHLH Family Genes and Identification of Members Associated with Cold/Drought-Induced Photoinhibition in Kandelia obovata

1
College of Life and Environmental Science, Wenzhou University, Wenzhou 325035, China
2
College of Landscape Architecture and Forestry, Qingdao Agricultural University, Qingdao 266109, China
3
Forestry College, Inner Mongolia Agricultural University, Hohhot 010018, China
*
Authors to whom correspondence should be addressed.
Int. J. Mol. Sci. 2023, 24(21), 15942; https://doi.org/10.3390/ijms242115942
Submission received: 13 September 2023 / Revised: 20 October 2023 / Accepted: 25 October 2023 / Published: 3 November 2023
(This article belongs to the Special Issue Advances in the Identification and Characterization of Plant Genes)

Abstract

:
Plant basic helix-loop-helix (bHLH) transcription factors play pivotal roles in responding to stress, including cold and drought. However, it remains unclear how bHLH family genes respond to these stresses in Kandelia obovata. In this study, we identified 75 bHLH members in K. obovata, classified into 11 subfamilies and unevenly distributed across its 18 chromosomes. Collineation analysis revealed that segmental duplication primarily drove the expansion of KobHLH genes. The KobHLH promoters were enriched with elements associated with light response. Through RNA-seq, we identified several cold/drought-associated KobHLH genes. This correlated with decreased net photosynthetic rates (Pn) in the leaves of cold/drought-treated plants. Weighted gene co-expression network analysis (WGCNA) confirmed that 11 KobHLH genes were closely linked to photoinhibition in photosystem II (PS II). Among them, four Phytochrome Interacting Factors (PIFs) involved in chlorophyll metabolism were significantly down-regulated. Subcellular localization showed that KobHLH52 and KobHLH30 were located in the nucleus. Overall, we have comprehensively analyzed the KobHLH family and identified several members associated with photoinhibition under cold or drought stress, which may be helpfulfor further cold/drought-tolerance enhancement and molecular breeding through genetic engineering in K. obovata.

1. Introduction

Mangroves function as natural habitats for various organisms and provide ecosystem services such as biodiversity maintenance, coastal erosion prevention, and carbon sequestration [1,2]. Although mangroves play a critical role for the maintenance of the ecological environment, they are also threatened by extreme climate events, including cold and drought [3,4]. It is found that cold stress can lead to the wilting and even death of large numbers of mangrove plants at its latitudinal limit of distribution in China [5]. In 1972 to 2004, prolonged drought due to less rainfall increased the vulnerability of mangroves in response to changing climate conditions in Australia [6]. Recent researches revealed that drought stress restrained mangrove growth and development [7]. As a result, protecting and restoring mangrove forests under extreme climatic conditions remains a major challenge [8].
K. obovata, the most cold-tolerant mangrove in China, faces imminent threats from extreme climate events, notably cold and drought stresses [7]. For instance, drought stress results in suppressed water absorption, closed stomata, and hindered CO2 exchange in K. abovata [9,10]. Meanwhile, under cold stress, the expression levels of genes associated with photosynthesis, specifically photosystem I (PSI) and photosystem II (PSII), are significantly down-regulated in K. obovata [11]. Moreover, transcription factors (TFs) play a crucial role in regulating the expression of target genes during various biological processes [12]. However, it remains uncertain how TFs influence the physiological functions of K. obovata in response to cold and drought stress. The completion of K. obovata genome sequencing has opened avenues to explore these molecular mechanisms using genomic resources [13].
The bHLH TF family stands as the second-largest family of TFs in eukaryotes [12]. Each bHLH protein comprises two functionally distinct regions. The bHLH domain, situated at the N-terminus, is essential for DNA binding and recognizes CANNTG in the E-box [14]. The HLH region at the C-terminus consists of two alpha-helixes separated by a loop of variable length, allowing the formation of homodimers and heterodimers among bHLH proteins [15,16]. To date, bHLH family genes have been identified in various plants, including Arabidopsis thaliana [17], Oryza sativa [18], and Malus domestica [19]. Functional studies have shown the involvement of bHLHs in the regulation of growth, development, and stress responses [20,21]. Notably, bHLH genes are known to regulate photosynthesis [22]. For instance, Arabidopsis PIF1 negatively regulates chlorophyll biosynthesis by binding to a G-box motif (CACGTG) in the promoter of Protochlorophyllide Oxidoreductase (PORC) [23]. Additionally, poplar PebHLH35 positively regulates stomatal density, stomatal aperture, and photosynthesis under drought stress [24]. However, the bHLH family in K. obovata has yet to be characterized.
K. obovata have a remarkable ability to sequester carbon, so many researchers are committed to move them northward to reduce the greenhouse effect. It is found that K. obovata was introduced to Yueqing Bay (28°20′ N), Zhejiang Province, where the propagules can grow into seedlings [25]. However, extreme drought and cold events exert a destructive influence on K. obovata [26]. Fortunately, the achievement of the K. obovata genome sequencing provides a new opportunity to explore the molecular mechanism using the genomic resources [13]. Thus, the goal of this study was to screen candidate KobHLH genes associated with the cold/drought-induced photoinhibition to promote molecular breeding through genetic engineering and increase the resistance to adversity.
In this study, we conducted a comprehensive analysis of bHLH genes in K. obovata, elucidating their gene structure and evolutionary relationships. Using transcriptomic data, we identified several bHLH genes responding to cold and drought stresses. Among these, several KobHLH genes were predicted to induce PSII photoinhibition in K. obovata under cold and drought stresses. Our study thereby contributes to the understanding of the role played by KobHLH genes in regulating the photosynthetic process under abiotic stress in K. obovata.

2. Results

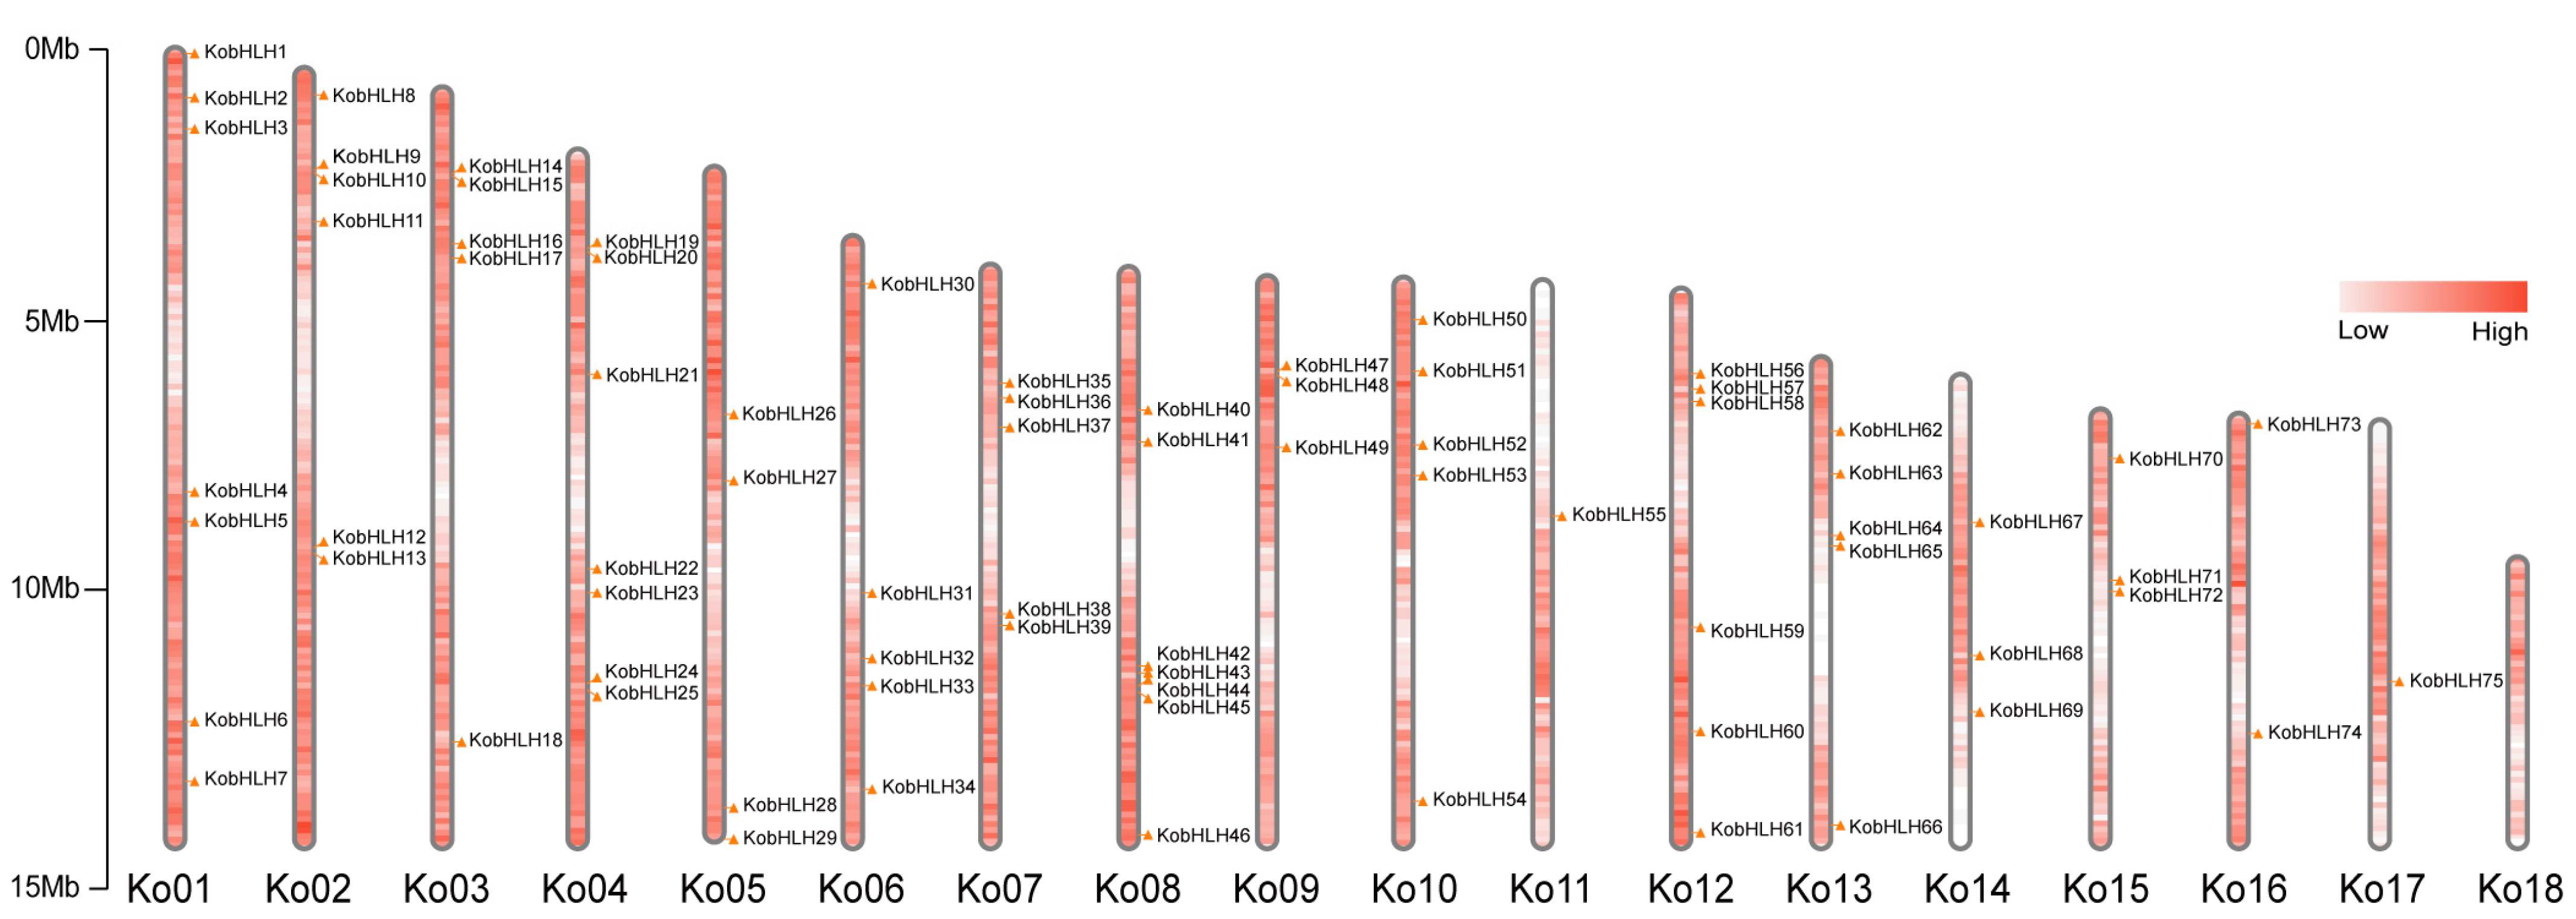
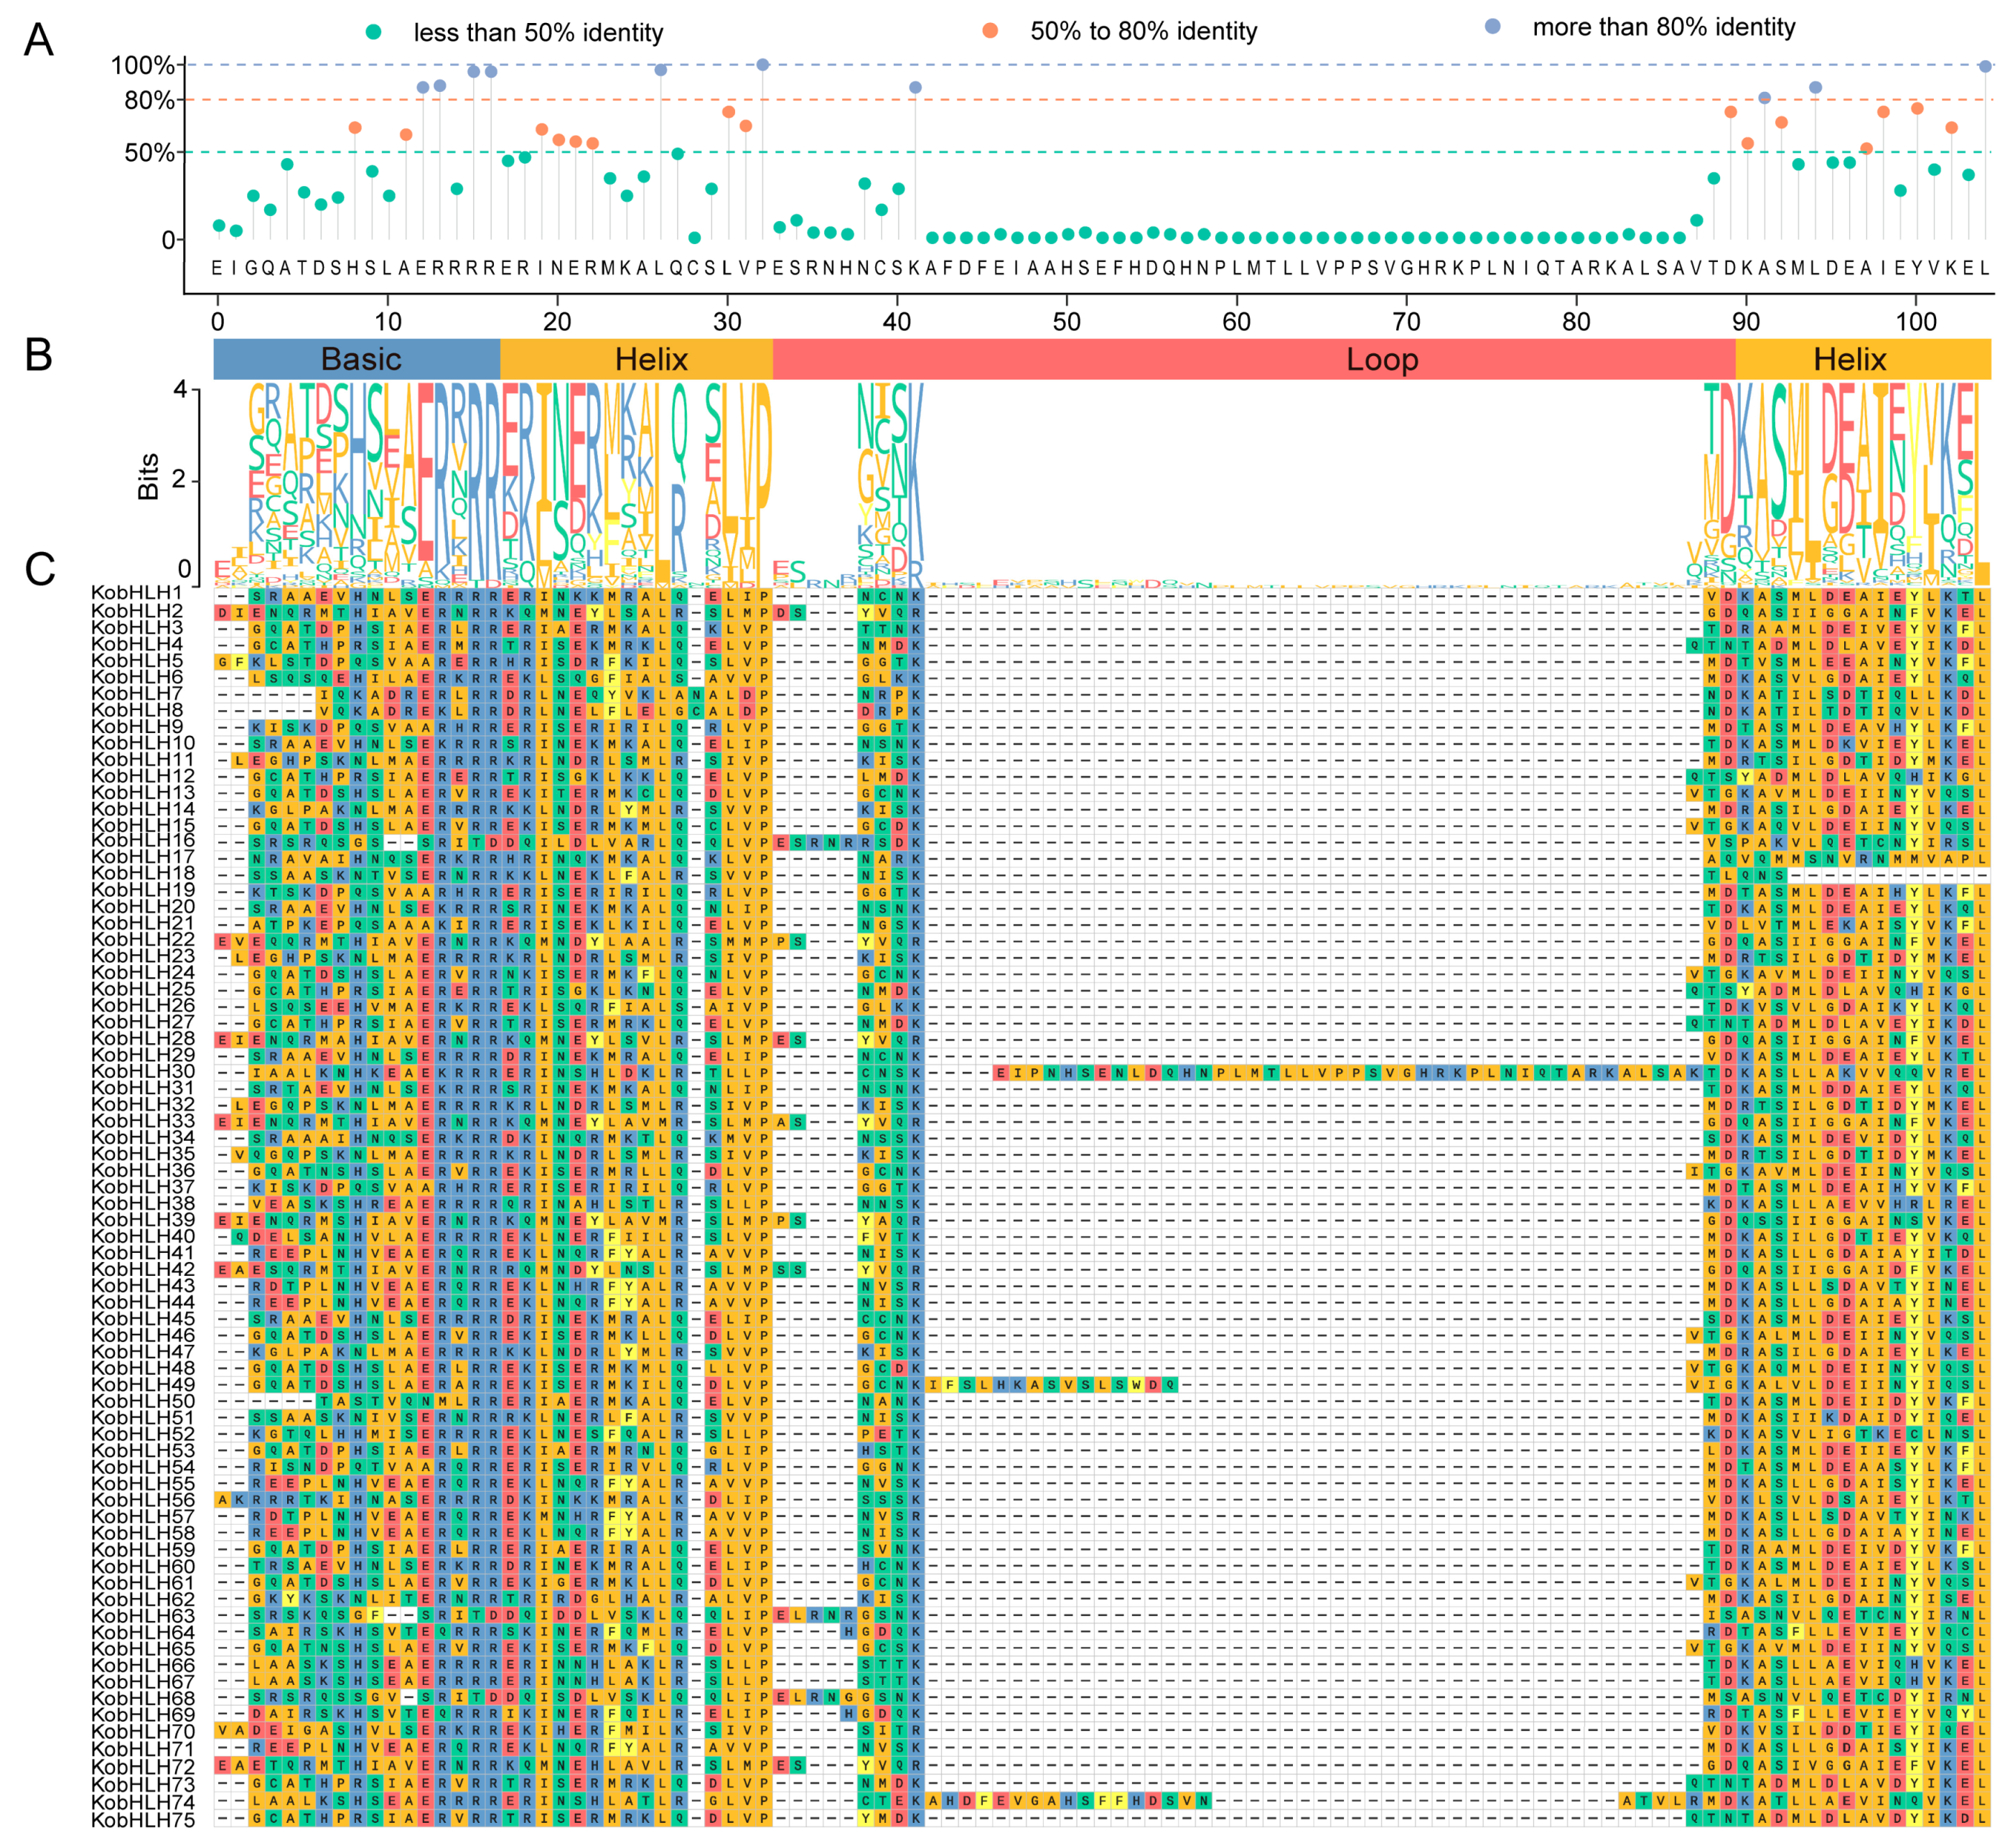
2.1. Identification of KobHLH Genes in K. obovata

The K. obovata genome contained 75 bHLH genes, which were named KobHLH1-KobHLH75 based on their positions on the chromosomes (Table S3). These KobHLH genes exhibited an uneven distribution across 17 out of the 18 chromosomes (Figure 1). Chromosomes 1, 4, and 8 contained the highest number (7, 9.3%) of KobHLH genes, whereas chromosome 17 had only one bHLH gene. No KobHLH genes were found on chromosome 18. Analyzing the properties of the 75 KobHLH proteins revealed variations in sequence structures and biochemical features (Table S3). Subcellular localization prediction indicated that 70 out of the 75 KobHLH proteins were located in the nucleus, whereas 2 were in the chloroplast, 1 in the mitochondrion, 1 in the vacuole, and 1 in the peroxisome.

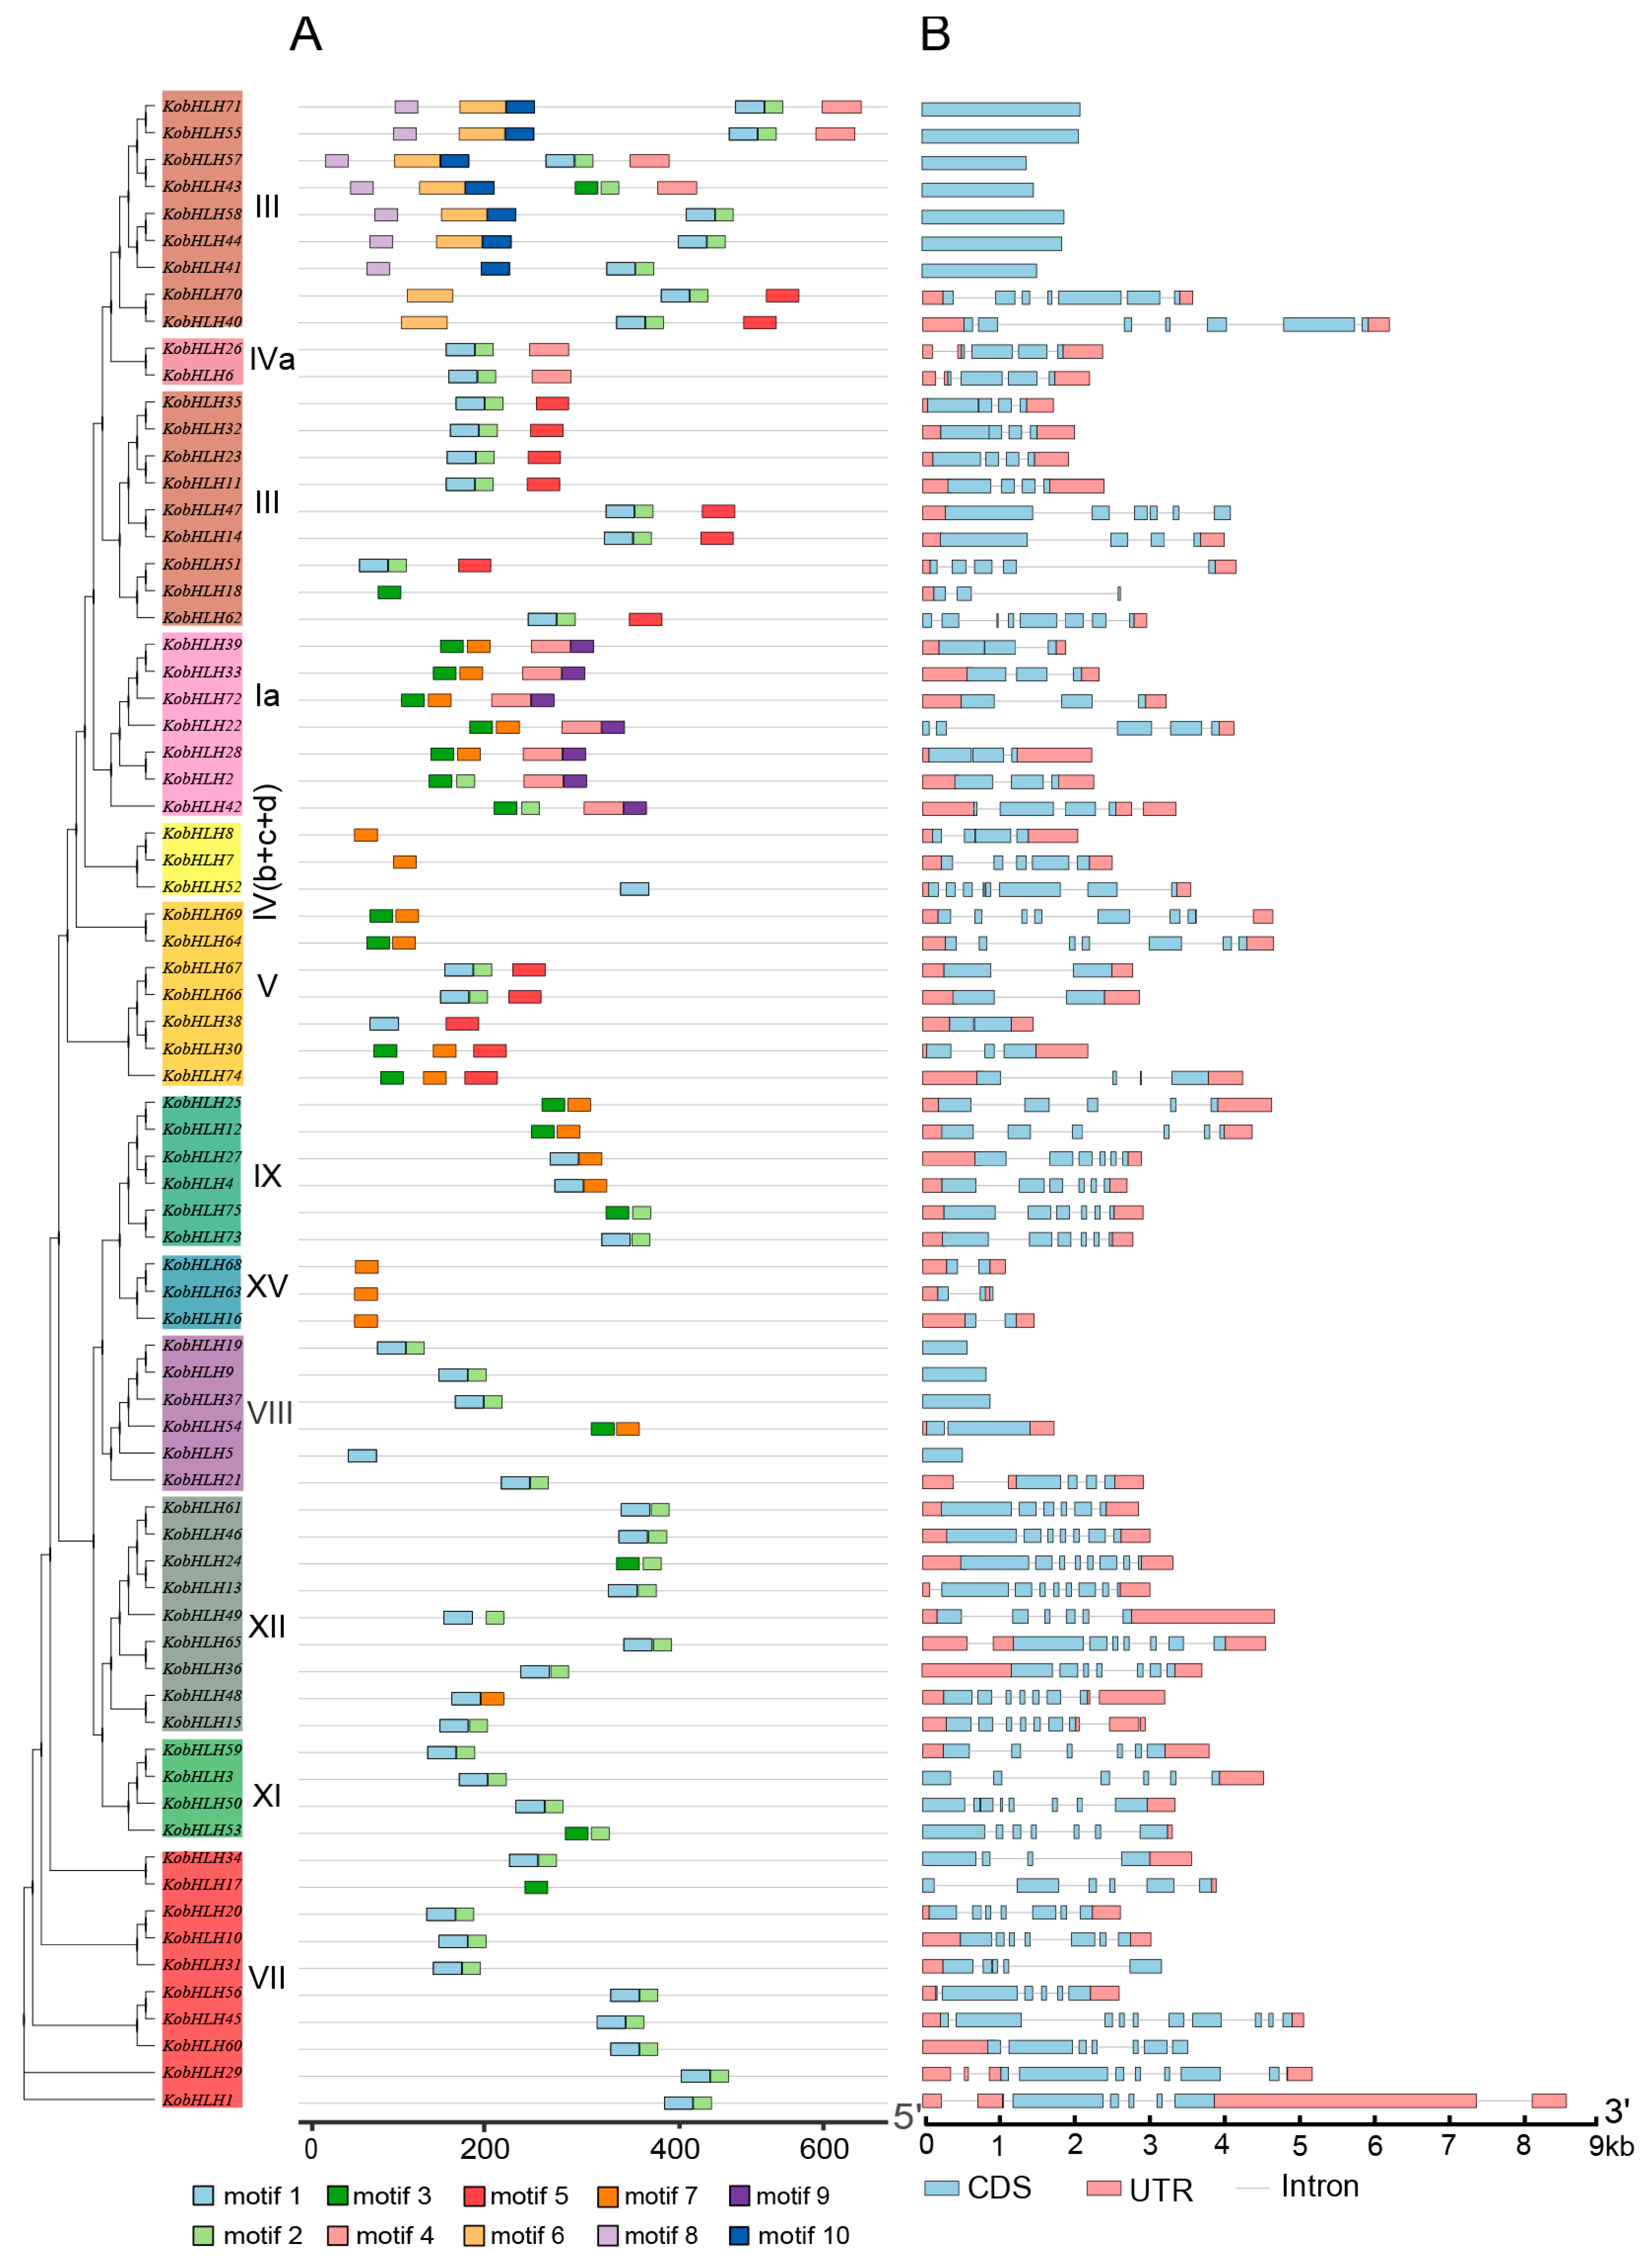
2.2. Conserved Motifs and Gene Structure of KobHLH Proteins

A total of 10 conserved motifs were identified in the 75 KobHLH proteins using the online MEME software (Table S4). These KobHLH proteins contained varying numbers of motifs. For instance, KobHLH71/55/57/43 had the largest number of motifs, whereas KobHLH18/8/7/52/5/17 had only one motif (Figure 2A). Most KobHLH proteins contained motif1, characterized by a basic region and a helix region. KobHLH proteins sharing identical motifs tended to cluster in the same subgroup, indicating potential functional similarities.
Sequence alignment of the bHLH domain in KobHLH proteins showed that 25 amino acids had consensus ratios exceeding 50%, and 10 amino acids exceeded 80% (Figure 3A). In the bHLH domain, Arg-16, Arg-17, Pro-33, and Leu-105 exhibited high sequence identity (>95%) (Figure 3C), implying potential roles in promoting dimerization.
KobHLH genes displayed various gene structures with different exon numbers (Figure 2B). Notably, 11 (14.7%) KobHLH genes were intron-less, 62 (82.7%) genes had more than two exons, and only 2 genes had more than 10 exons. Generally, intron–exon distribution patterns within a subfamily of KobHLHs were similar.

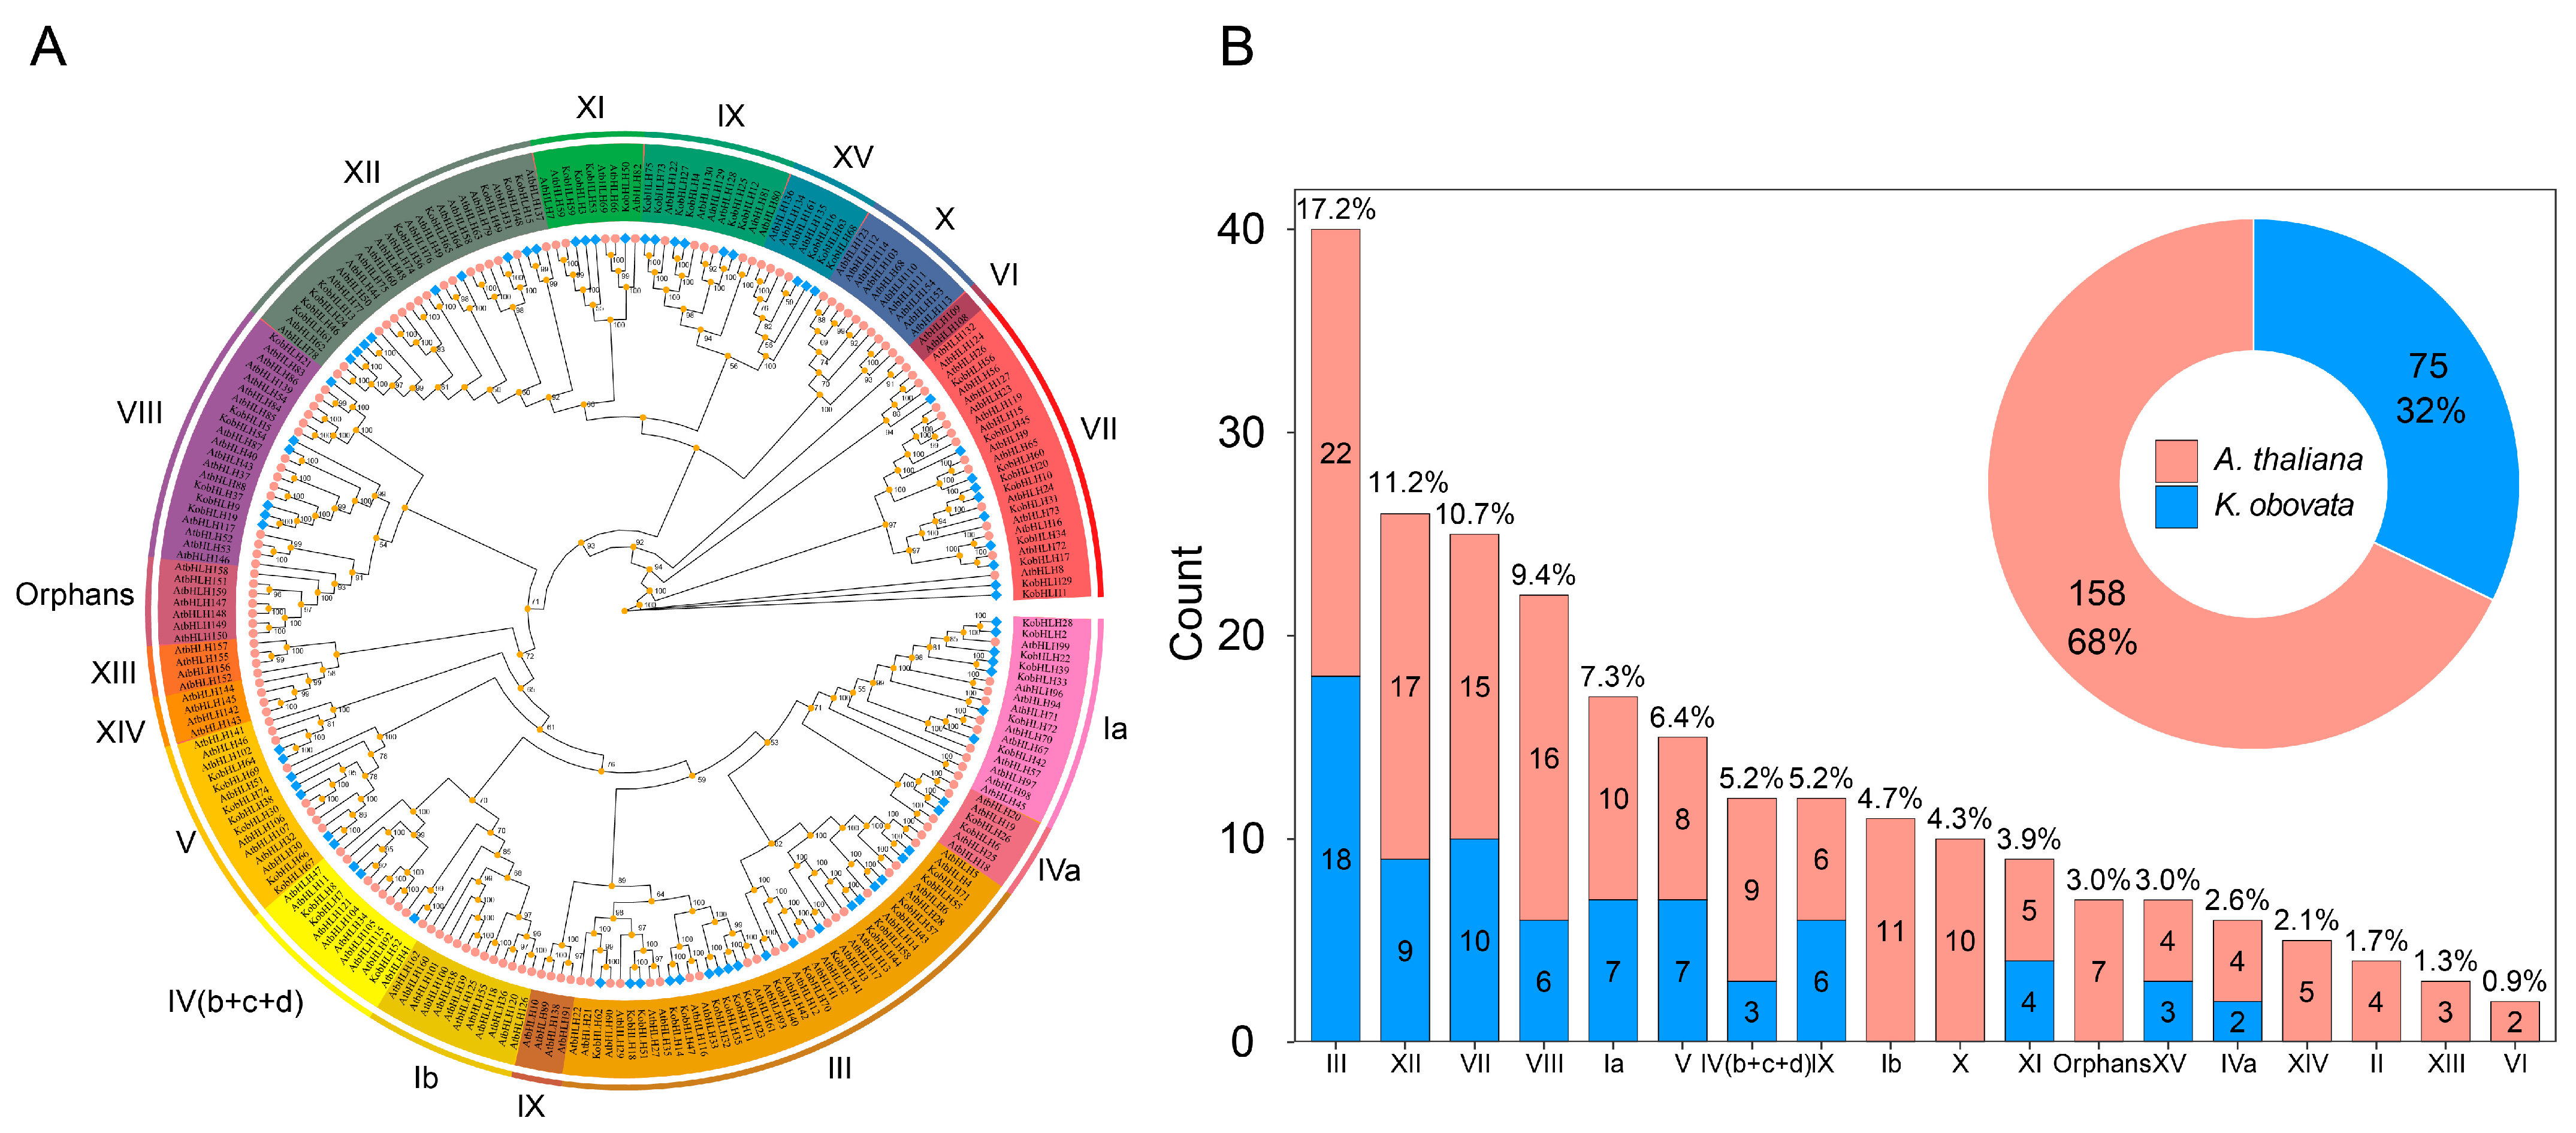
2.3. Phylogenetic Analysis of bHLH Genes in K. obovata and Arabidopsis

The sequences of 75 KobHLH and 158 AtbHLH proteins were used to construct a phylogenetic tree. As shown in Figure 4A, KobHLH proteins were distributed in only 11 of the 18 AtbHLH subfamilies and were absent in subfamilies Ib, X, XIV, II, XII, and VI [27]. Subfamily III contained the most members (18), whereas subfamily IVa had the fewest (2) (Figure 4B). Out of the 75 KobHLH genes, 52 exhibited syntenic relationships. Specifically, 37 gene pairs were linked to segmental duplication, whereas no tandem duplication events were observed among paralogous genes (Figure 5A). The nonsynonymous (Ka) to synonymous (Ks) substitution rate(Ka/Ks) for the 37 gene pairs derived from segmental duplication was calculated to assess selective pressure. Among these pairs, 33 had Ka/Ks ratios <1, indicating purifying selection (Table S5). The divergence time for these gene pairs ranged from 8.93 to 101.5 Mya, with 22 (66.7%) gene duplication events occurring 10–20 Mya (Table S5).
To investigate the evolutionary relationships of bHLH genes in representative plants, 102, 38, and 162 bHLH genes were identified in Arabidopsis, rice, and poplar, respectively (Figure 5B). The results showed that the bHLH genes from K. obovata were evolutionarily closer to those from poplar. A total of 18 collinear KobHLH genes were found in the four species, indicating conserved roles during evolution (Table S6).

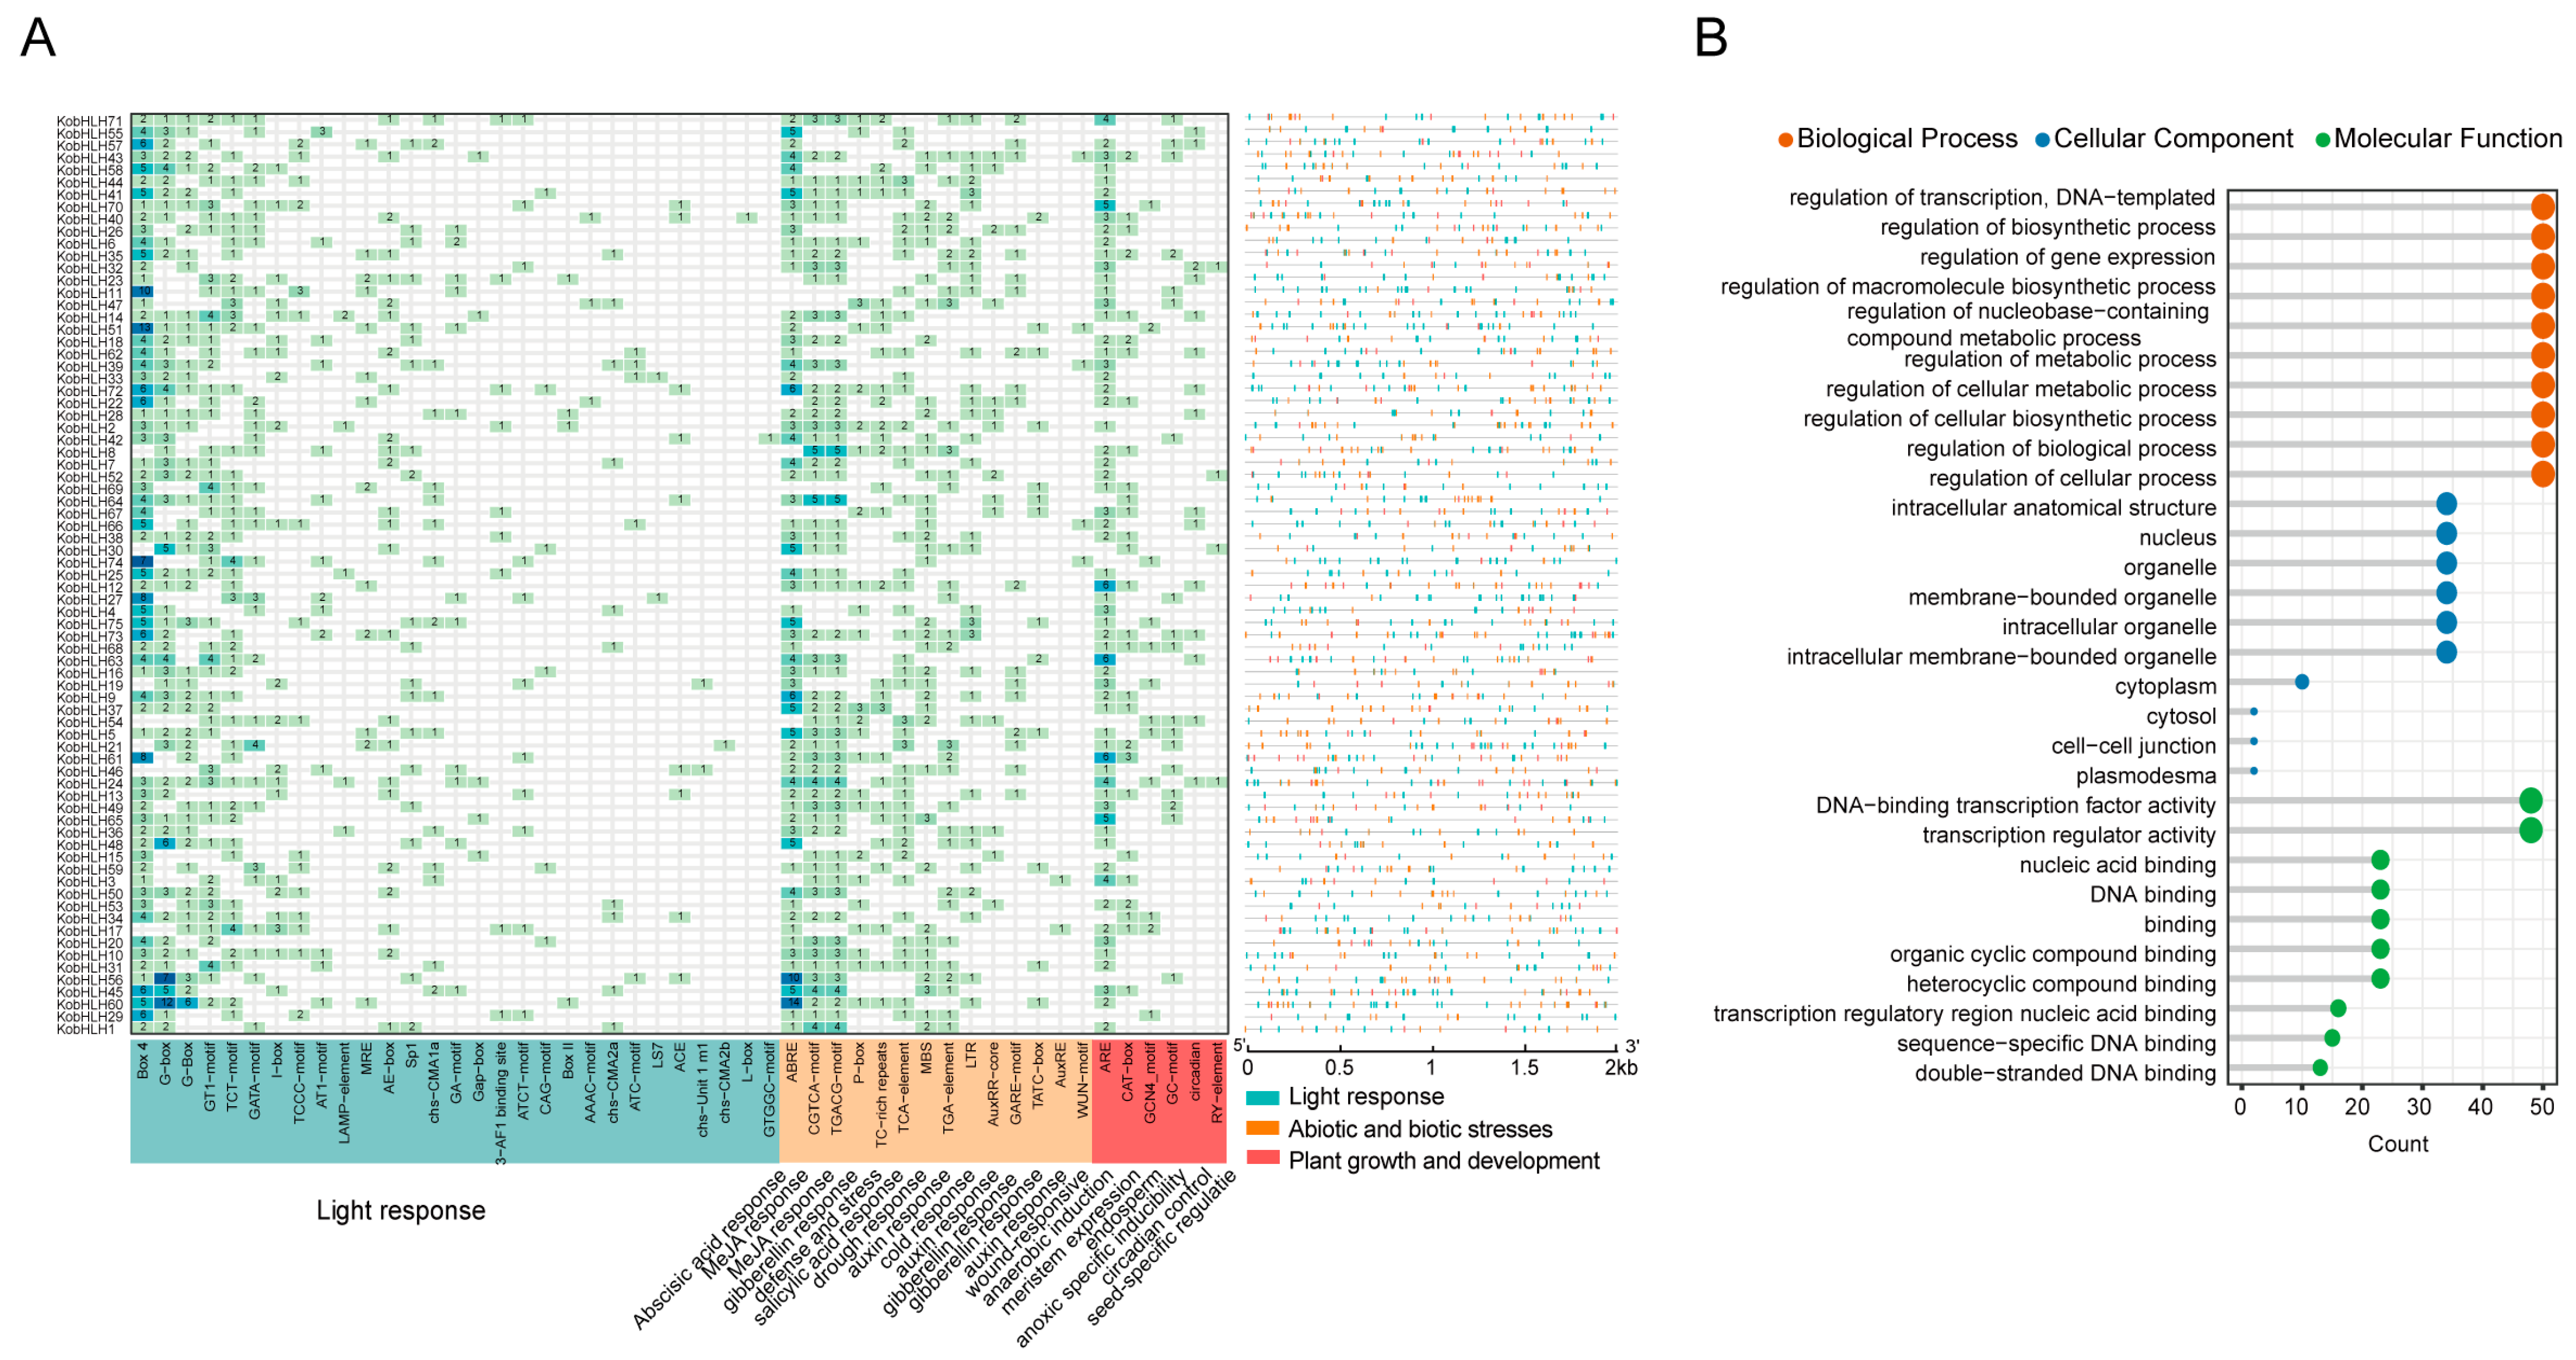
2.4. Cis-Element and GO Analysis of the KobHLHs

To identify the cis-acting elements present in the KobHLH promoters, 2 kb fragments upstream of the translation start sites for all 75 KobHLHs were extracted. These cis-elements were divided into three groups based on their functional roles. The most prevalent were light-responsive elements, including G-box and Box4, implying potential associations between some KobHLH genes and light responses (Figure 6A). Additionally, numerous cis-elements were linked to abscisic acid (ABA), gibberellin (GA), methyl jasmonate (MeJA), drought, cold, and wound responses. The third subgroup comprised elements like GCN4_moitf (associated with endosperm expression), CAT-box (related to meristem expression), and RY-element (involved in seed-specific regulation). Consistent with this, GO annotation revealed that the KobHLH genes were enriched in transcriptional regulation, gene expression, and metabolic biological processes (Figure 6B).

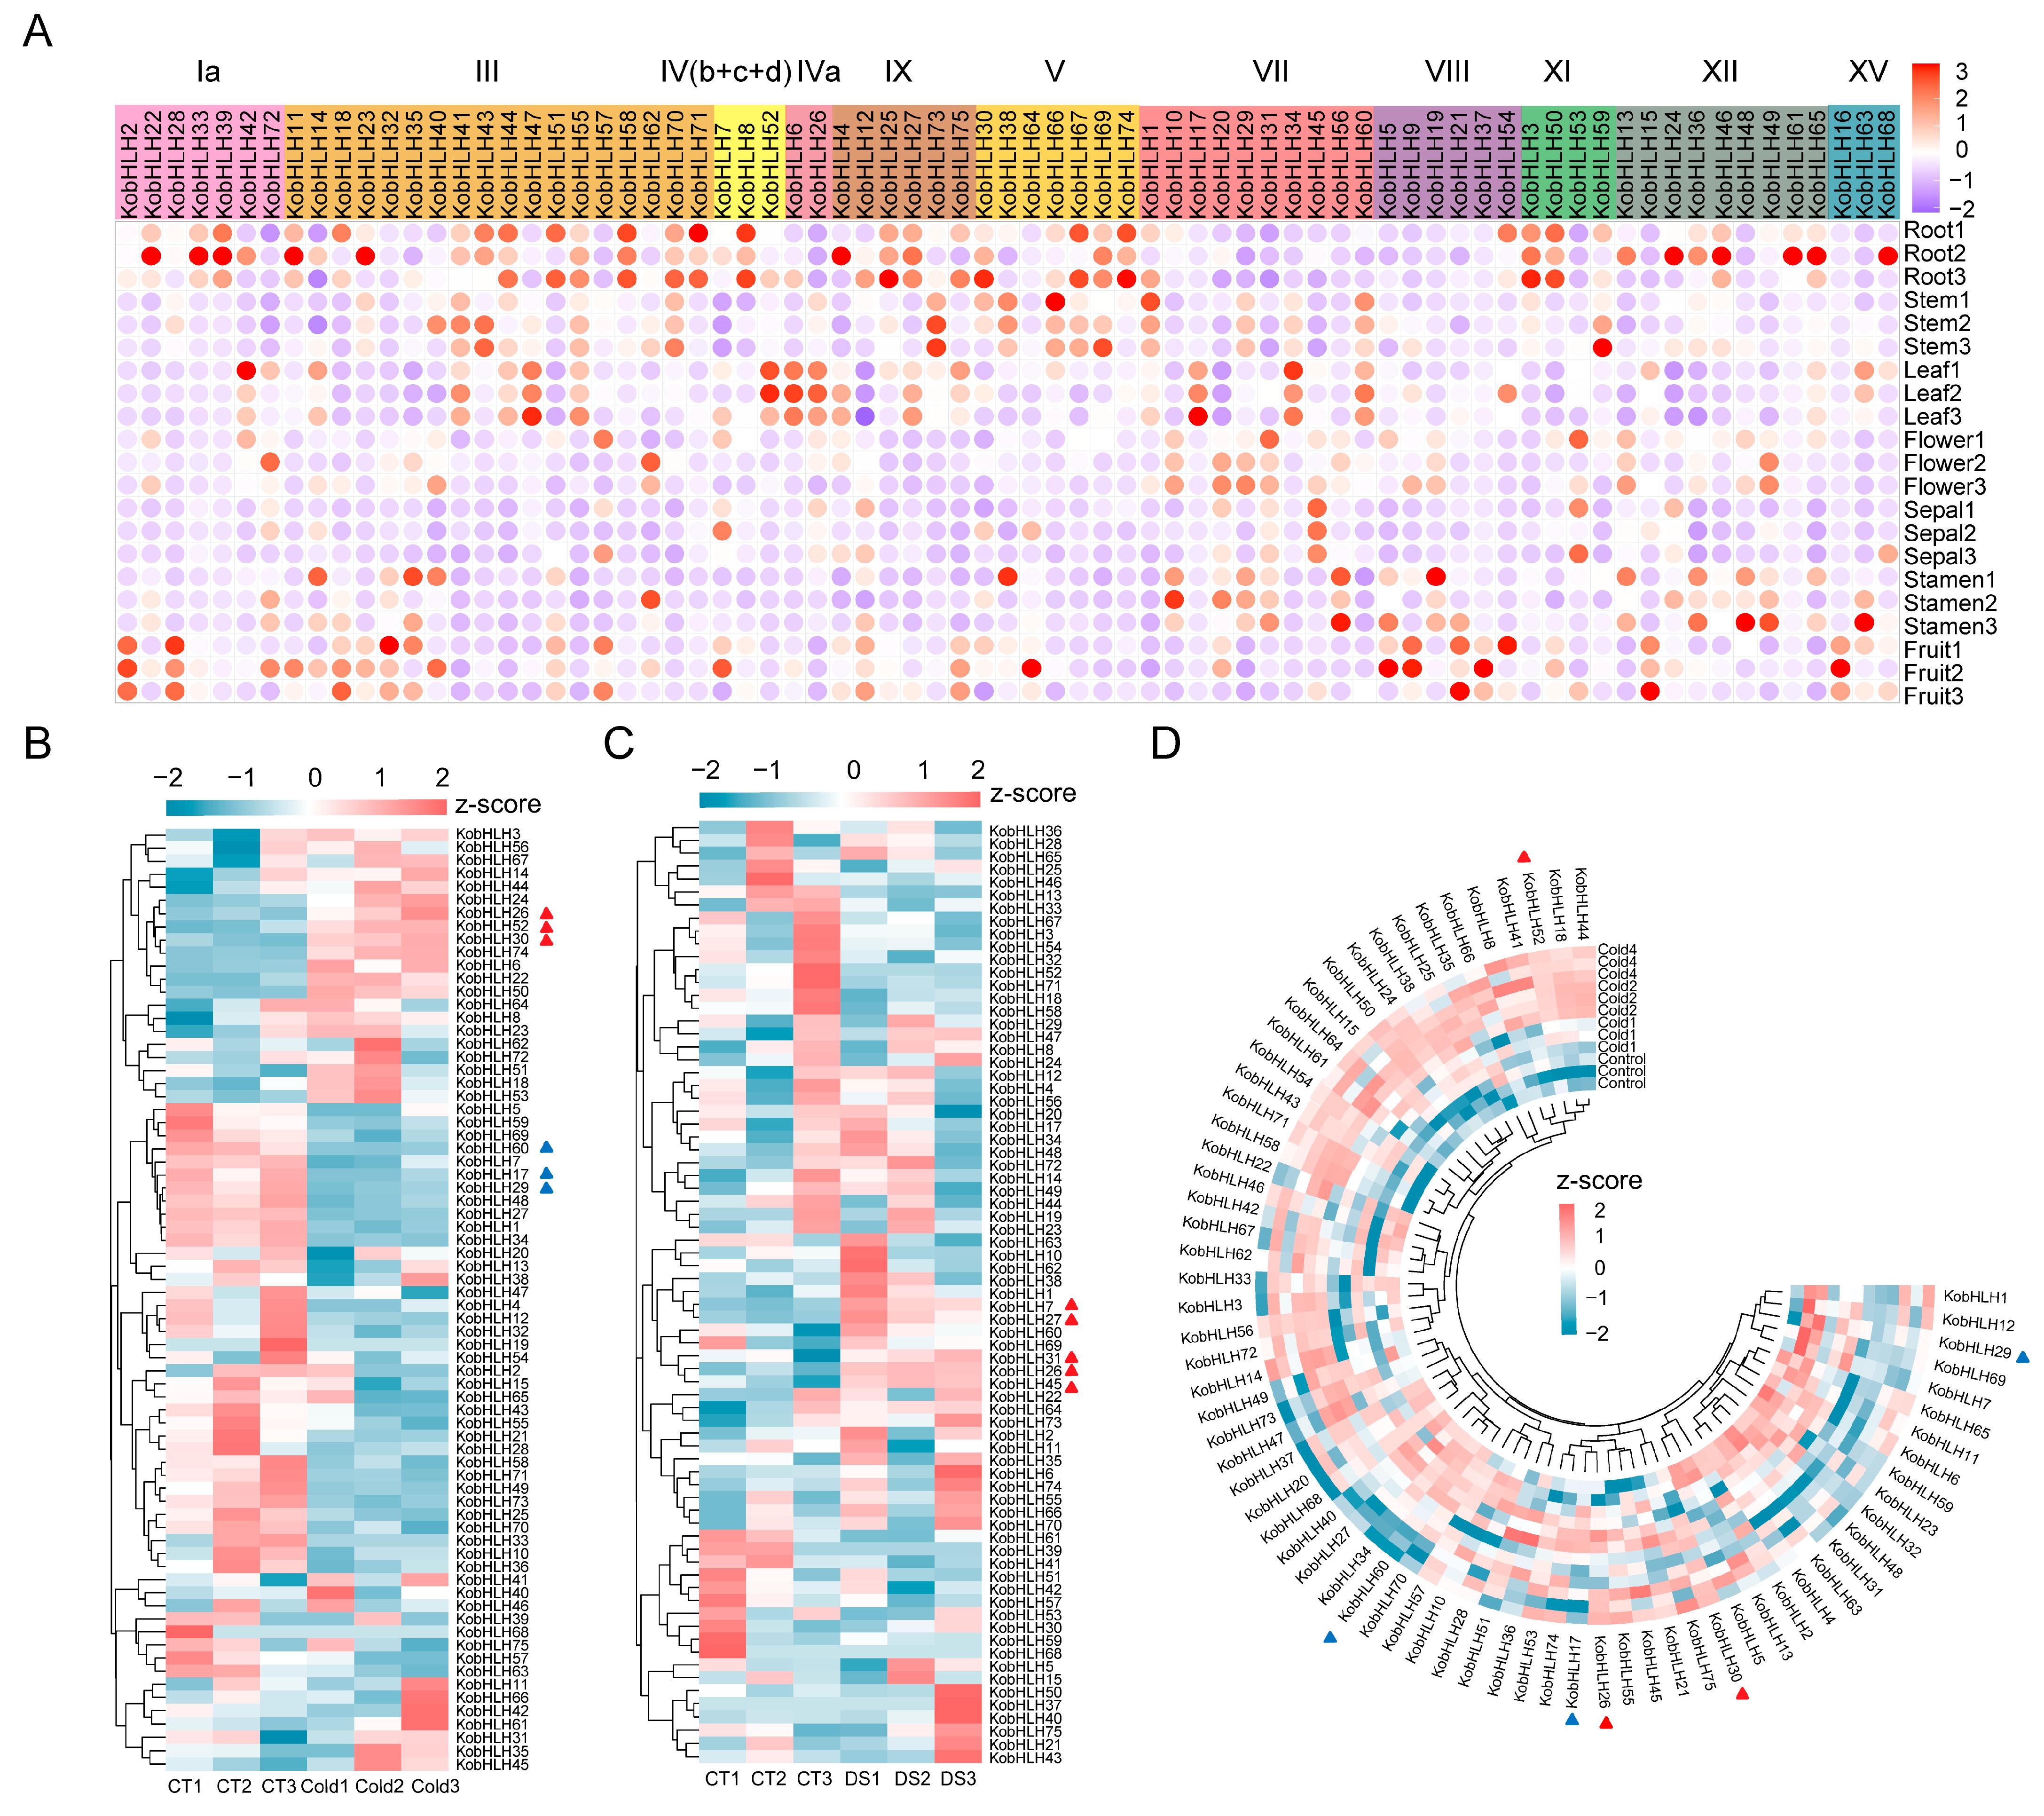
2.5. Expression Profiles of KobHLHs

Tissue expression patterns of the 75 KobHLH genes were analyzed using two transcriptomic data sets [11,28]. Generally, genes within the same subgroup exhibited similar expression patterns across various tissues (Figure 7A). For instance, subgroups III and V showed specific expression in roots and stems, whereas subgroup IVa showed specific expression in leaves. In contrast, most KobHLH genes exhibited negligible expression in flowers and stamens.
We further determined the responses of KobHLH genes to cold and drought stresses. As illustrated in Figure 7B, the expression levels of KobHLH6, 14, 26, 22, 52, 30, 74, 24, 50, and 53 were up-regulated, whereas those of KobHLH29, 59, 69, 60, 7, 17, and 34 were down-regulated after cold treatment. These cold-responsive genes exhibited consistent expression patterns across three time points (Figure 7D). Similarly, the expression levels of KobHLH7, 27, 31, 26 and, 45 were induced, whereas those of KobHLH52, 18, 71, and 58 were repressed following drought treatment (Figure 7C). Six cold-responsive genes (KobHLH52, 30, 26, 29, 17, and 60) and five drought-responsive genes (KobHLH27, 31, 45, 7, and 26) were validated via qRT-PCR (Figure S1), confirming the reliability of public RNA-Seq data.

2.6. KobHLH Genes Involved in Photosynthesis Metabolism

To determine whether cold and drought treatments affect the photosynthesis of K. obovata leaves, several photosynthetic parameters were detected. Net photosynthetic rate (Pn), stomatal conductance (Gs), actual photochemical efficiency of PSII (ΦPSII), maximum photochemical efficiency of PSII (Fv/Fm), and chlorophyll content in the leaves significantly decreased, but minimum fluorescence (Fo) increased after drought or cold treatment compared to the controls (Figure 8A; Figure S2). Moreover, cold stress had a more severe effect on leaf photosynthesis than drought stress.
To explore gene expression patterns associated with photosynthesis, a co-expression network was constructed using weighted gene co-expression network analysis (WGCNA). The expression profiles of 15,538 genes were divided into 18 modules, each containing 14 to 7304 genes (Figure 8B). The blue module exhibited a positive correlation with photosynthesis (p < 0.05). Within this module, 11 KobHLH genes were identified with |GS| > 0.6 and |MM| > 0.8 (Figure 8C), based on their co-expression relationships (Figure 8D). Cold and drought stress suppressed the expression of four PIF genes (KobHLH1/17/29/60) related to chlorophyll metabolism in K. obovata.

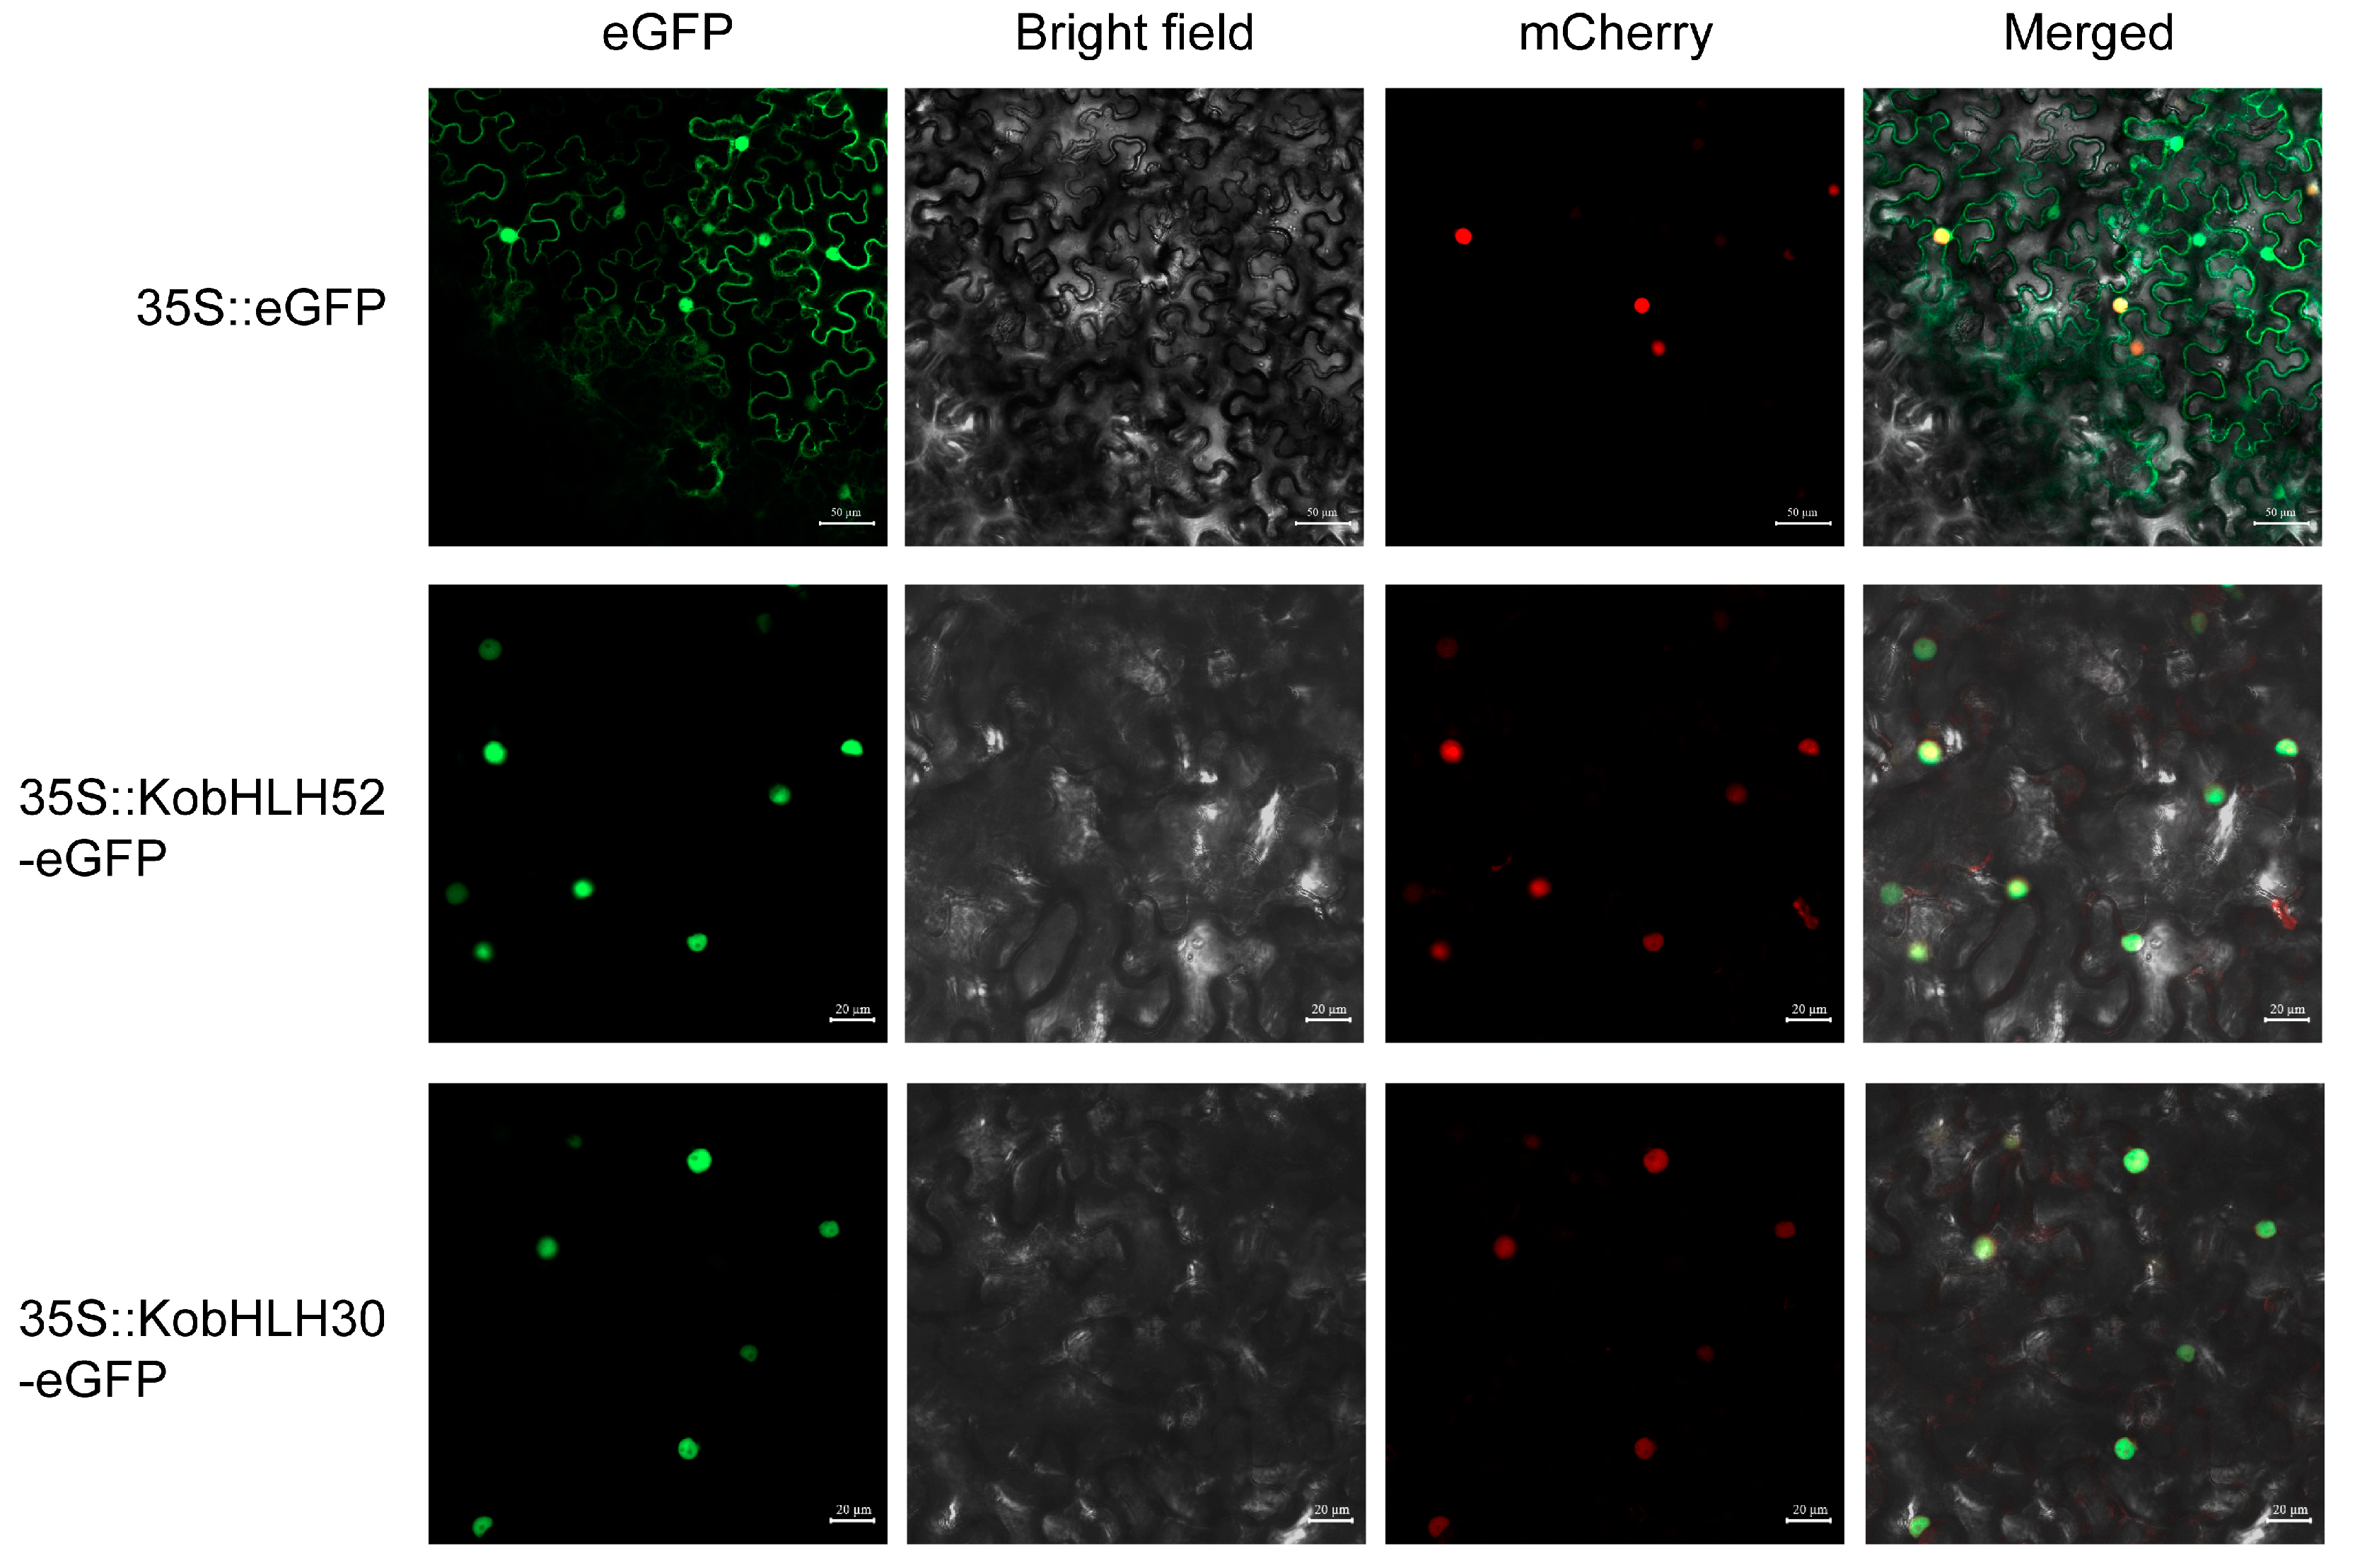
2.7. Subcellular Localization

Two photosynthesis-associated bHLH genes (KobHLH52 and KobHLH30) from the blue module mentioned above were selected for subcellular localization analysis. Fluorescence signals in tobacco leaves transformed with 35S-KobHLH52-eGFP or 35S-KobHLH30-eGFP were observed in the nucleus (Figure 9), consistent with predictions using the WoLF PSORT software [29] (Table S2).

3. Discussion

bHLH gene family members have been extensively characterized in various species, including Arabidopsis [27], pepper [30], cucumber [31], poplar [32], and Prunus mume [15]. However, the study of bHLH gene in K. obovata has been limited. Advances in genome sequencing technologies have enabled a comprehensive analysis of the bHLH gene family in K. obovata [13]. In this study, 75 bHLH gene family members obtained from the K. obovata genome, and the number of bHLH genes in K. obovata was smaller than that in Arabidopsis (162) [17], rice (167) [18], and poplar (185) [32]. Although it has been reported that genome size might influence the number of bHLH genes in different species [33], K. obovata has a larger genome (180M) compared to Arabidopsis (125M). Hence, there might not be a correlation between the number of bHLH genes and genome size across plant species. Differences in genome assembly quality and screening criteria may account for the significant differences in the number of bHLH gene between K. obovata and poplar [15].
Gene duplication is a crucial mechanism governing the expansion and evolution of gene families in plants [34]. In this study, we found that 69% (52/75) of KobHLH genes, including 37 syntenic gene pairs, may have undergone segmental duplication, whereas no tandem duplication event was observed (Table S5), suggesting that the primary driving force behind the expansion of the KobHLH gene family is segmental duplication. Similar results have also been reported in other species, including Raphanus sativus and Prunus mume [15,22]. Furthermore, 89% of gene pairs stemming from segmental duplication exhibited Ka/Ks ratios less than 1 (Table S5), implying that these KobHLHs likely underwent strong purifying selection during their evolution [35,36].
Several KobHLH genes have been shown to participate in the regulation of organ size, flowering time, and stomatal opening [37,38]. In our study, we identified KobHLH genes with high expression in distinct tissues or stress responses. Notably, KobHLH73, KobHLH45, and KobHLH2 displayed elevated expression in the stem, sepal, and fruit, hinting at their potential roles in these tissues (Figure 6). KobHLH50 and KobHLH70 exhibited high expressions in roots, and they are homologous to Arabidopsis LRL1 and GL3, respectively, both of which positively regulate root development in Arabidopsis [39] (Figure 7). Additionally, KobHLH4, KobHLH30, and KobHLH45 were responsive to abiotic stresses, such as cold, drought, and salt. In Arabidopsis, ICE1, a homolog of KobHLH4, improves cold tolerance by binding specifically to MYC sequences in the CBF promoter [40]. SPT, a homolog of KobHLH30, positively regulates the cold response [41]. PIL5, a homolog of KobHLH45, improves drought tolerance by increasing the contents of relative water content and chlorophyll levels [42].
After cold and drought stresses, photoinhibition can damage the photosynthetic electron transport system, resulting in reduced photosynthetic efficiency in plants [43,44]. In our study, we observed significant decreases in Pn, ΦPSII, Fv/Fm, and Chl content in K. obovata leaves under cold and drought conditions, accompanied by an increase in F0 (Figure 8, Figure S2). These results suggest that cold and drought treatments may cause PSII photoinhibition, resulting in a reduction in PSII efficiency in K. obovata. WGCN analysis revealed a blue module, including 11 KobHLH genes, which was associated with both photoinhibition and cold/drought responses (Figure 8). Among them, four PIF genes (KobHLH1/17/29/60) displayed reduced expression levels following cold or drought treatment, suggesting that cold-repressed PIFs may inhibit chlorophyll accumulation and chloroplast development, thereby affecting plant photosynthesis. Arabidopsis bHLH41, a homolog of KobHLH52, is known to regulate photosynthetic capacity by altering circadian rhythm [45]. Further experiments should be performed to explore the regulatory mechanisms of these bHLH genes in photosynthesis under cold or drought stress.

4. Materials and Methods

4.1. Identification of KobHLH Genes

The K. obovata genome sequence and annotation data were obtained from the Genome Sequence Archive database (https://ngdc.cncb.ac.cn/gsa/browse/CRA002395, accessed on 11 October 2022) [13]. The Hidden Markov Model (HMM) profile for the basic Helix-Loop-Helix (bHLH) domain (PF00010) was retrieved from the Pfam database (http://pfam.xfam.org/, accessed on 11 October 2022) [15]. Subsequently, the bHLH genes of K. obovata were searched in the protein database using HMM files (e-value ≤ 1 × 10⁻⁵). To obtain the bHLH protein sequences of K. obovata, bHLH protein sequences of A. thaliana were downloaded from the TAIR database (http://www.arabidopsis.org, accessed on 12 October 2022) and used to perform a BLASTP search with a cut-off e-value ≤ 1 × 10⁻⁵. After removing redundant genes, the conserved bHLH domain was searched using the National Center for Biotechnology Information (NCBI) Conserved Domain Search (https://www.ncbi.nlm.nih.gov/Structure/cdd/wrpsb.cgi, accessed on 13 October 2022), SMART (http://smart.embl-heidelberg.de, accessed on 13 October 2022), and Pfam. The properties of KobHLH proteins were predicted using ExPASy ProtParam (https://web.expasy.org/protparam/, accessed on 15 October 2022) [46]. Subcellular localization of KobHLHs was determined by the WoLF PSORT program (https://psort.hgc.jp/, accessed on 15 October 2022) [29]. The KobHLH genes were named according to their chromosomal location in the K. obovata genome.

4.2. Phylogenetic Analysis of KobHLHs

Multiple sequence alignments were performed using MAFFT 7.508 and then visualized using the R package ggmsa 1.8.0 [47,48]. The phylogenetic tree of bHLH genes from K. obovata and A. thaliana was constructed using the maximum-likelihood (ML) method generated by IQ-TREE 2.25 [49] with 1000 bootstrap replicates. KobHLH genes were classified into different subgroups following the classification of AtbHLH proteins [15,27].

4.3. Conserved Motif and Gene Structure of the KobHLHs

The identification of conserved motifs in KobHLH proteins was accomplished using the MEME Suite (http://meme.sdsc.edu/meme/itro.html, accessed on 20 October 2022). The maximum number (10) of motifs and an optimal width ranging from 6 to 200 residues were set [50]. Analysis of the exon/intron structures of the KobHLH genes was performed using the Gene Structure Display Server (GSDS, http://gsds.cbi.pku.edu.cn/, accessed on 20 October 2022) [51].

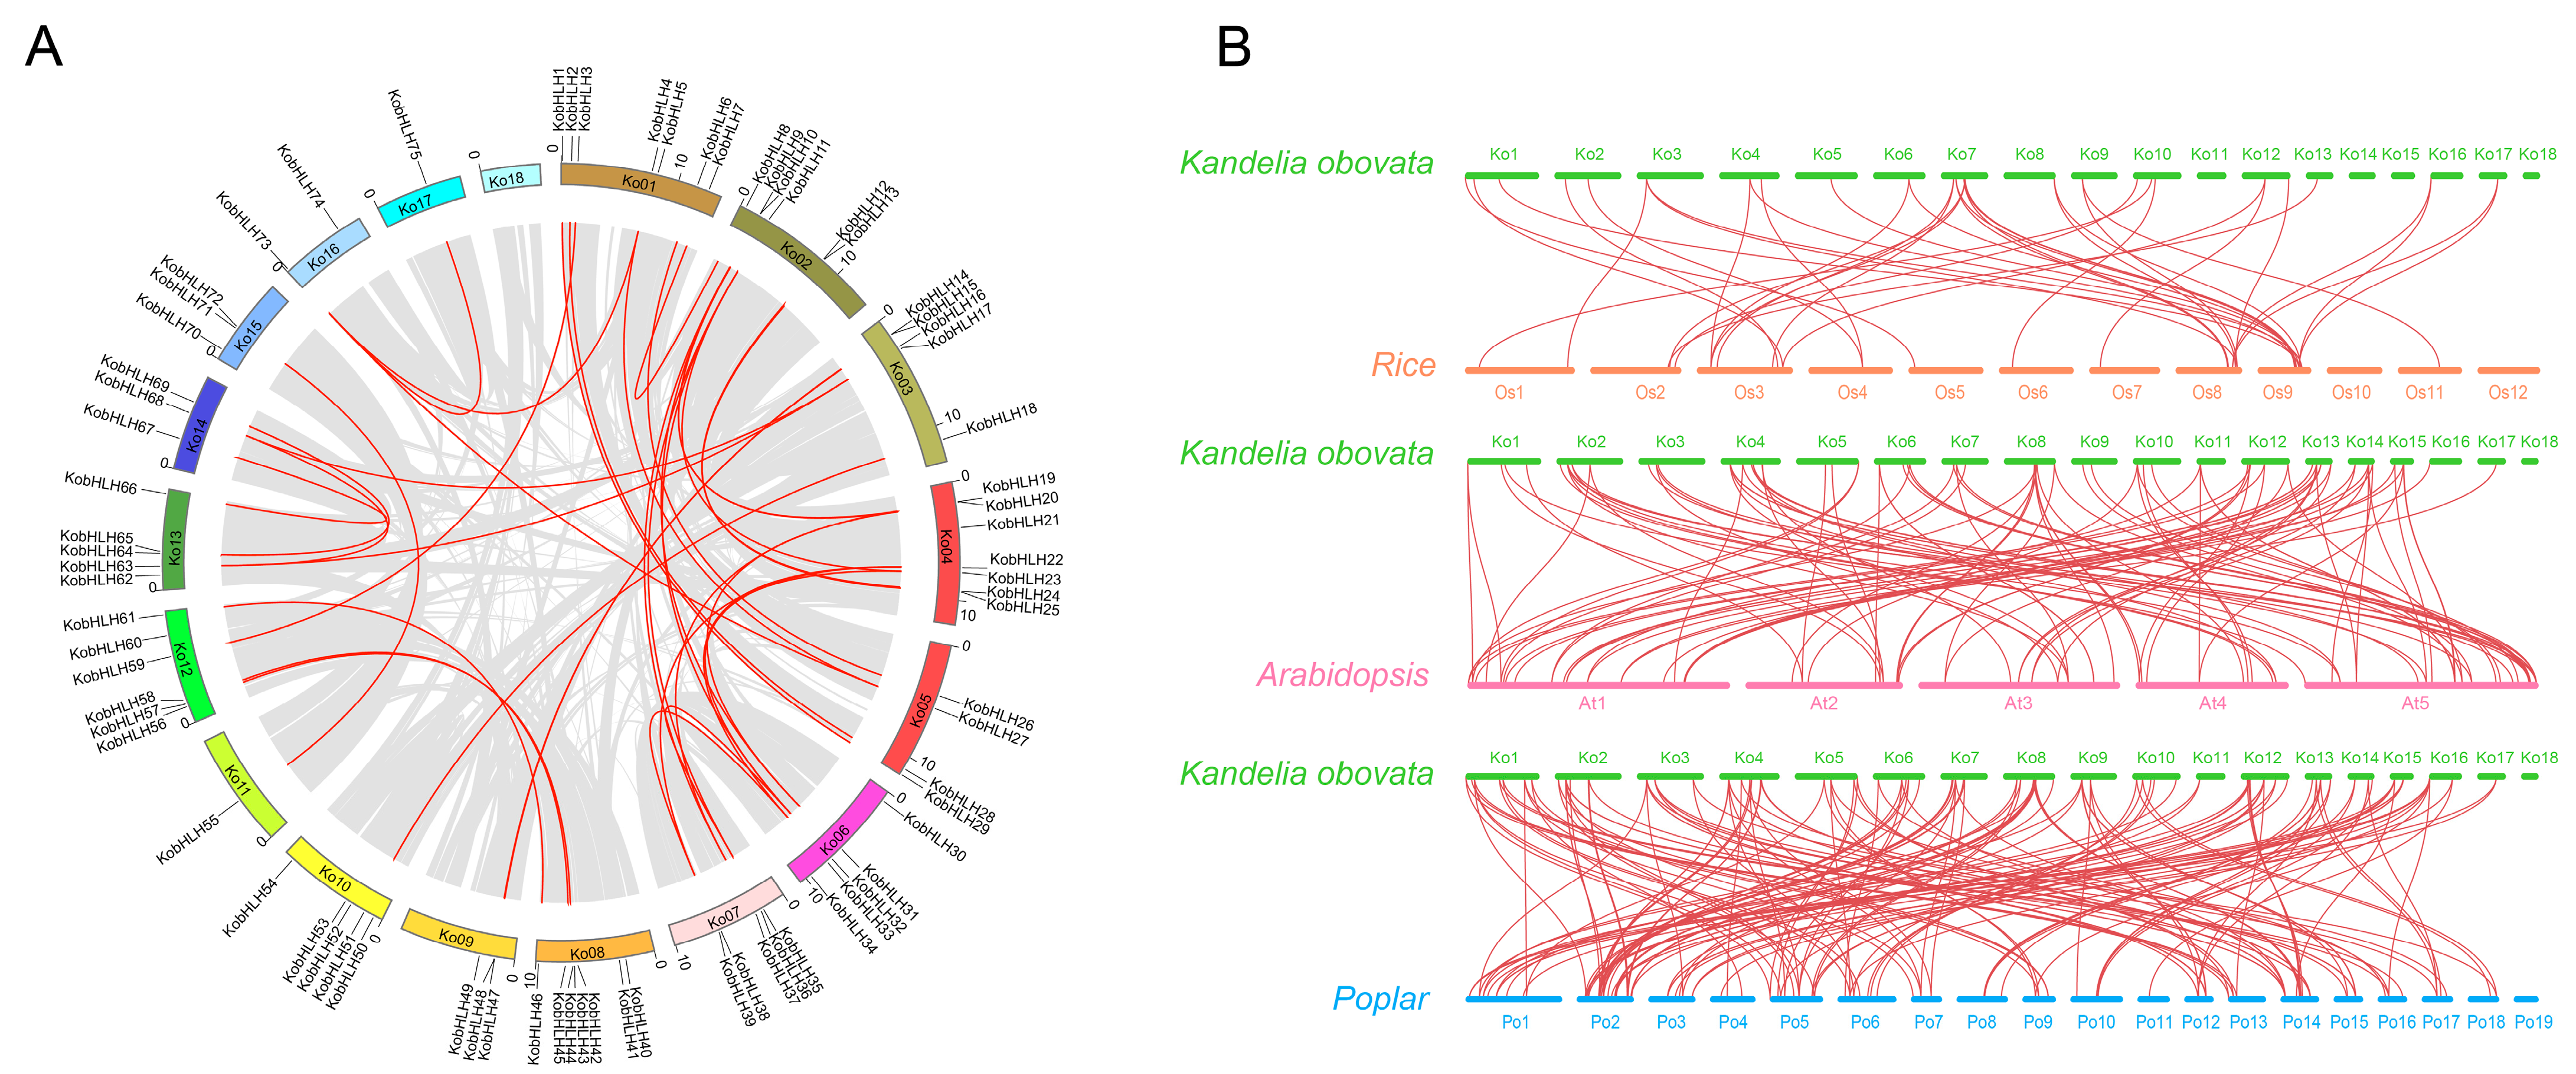
4.4. Chromosomal Distribution, Gene Duplication, and Syntenic Analysis of KobHLHs

The KobHLH genes were mapped onto chromosomes for visualization using the R package RIdeogram 1.78 [52]. Gene duplication of KobHLH genes was analyzed using the Multiple Collinearity Scan toolkit X version (MCScanX) with default parameters [53]. The Ka/Ks rates of homologous KobHLH genes were calculated using KaKs_Calculator 3.0 [36]. The Ks values were used to determine the dates of gene duplication events (T) based on the formula: T = Ks/2λ, where λ = 1.5 × 10⁻⁸ s [54]. Genome sequence and annotation information for Arabidopsis, rice, and poplar were downloaded from TAIR, RGAP (http://rice.uga.edu/, accessed on 10 October 2022), and Ensembl (http://plants.ensembl.org/index.html, accessed on 10 October 2022). Their syntenic relationships were analyzed and plotted using MCScanX.

4.5. Cis-Regulatory Elements in the KobHLH Promoters

The 2 kb promoter fragments of the KobHLH genes were extracted for analysis of cis-elements using PlantCARE (http://bioinformatics.psb.ugent.be/webtools/plantcare/html/, accessed on 10 November 2022) [55]. The KobHLH protein sequences were annotated using EGGNOG (http://eggnog-mapper.embl.de/, accessed on 10 November 2022) and GO (http://geneontology.org/, accessed on 10 November 2022). Enrichment analysis was conducted using the R package clusterProfiler 4.2.2 [56,57].

4.6. Plant Material and Treatments

The K. obovata seedlings were collected from the Quanzhou Bay Mangrove Nature Reserve (Fujian, China; 24°47′21″~24°59′50″ N). Propagules were potted in sand and watered with Hogland’s solution. The experiment followed a completely randomized block design, with three replicates for each treatment. Plants were grown at 20/25 °C (day/night), 75% humidity, and a 12/12 h (day/night) photoperiod, with a 400 μmol·m−2·s−1 photosynthetic photon flux density (PPFD).
One-year-old seedlings were exposed to drought stress at 60% or cold stress at −2/10 °C (day/night) for 4 days. The second pair of leaves was collected for RNA-Seq, qRT-PCR, and physiological assays. Seedlings at the eight-leaf stage were subjected to cold stress at 4 °C for 0, 1, 3, and 12 h in a climatic chamber at 20/25 °C (day/night), 75% humidity, and a 12/12 h (day/night) photoperiod, with 400 μmol·m−2·s−1 PPFD. The second pair of leaves was immediately collected and stored at −80 °C for qRT-PCR analysis. All treatments were performed with three biological replicates.

4.7. Measurement of Gas Exchange, Chlorophyll Fluorescence, and Chlorophyll Contents

The second fully expanded leaf was used for measurement of gas exchange parameters using a 400 μmol m−2 s−1 photosynthetic photon flux density (PPFD), net photosynthetic rate (Pn), and stomatal conductance (Gs) using a portable photosynthesis system (LI-6400, LI-COR Inc., Lincoln, NE, USA). Chlorophyll fluorescence parameters of K. obovata were measured with a pulse modulated fluorometer, recording initial fluorescence (Fo) and the maximal fluorescence (Fm). The maximal quantum efficiency of PSII (Fv/Fm) and actual efficiency of PSII (ΦPSII) were calculated as per the established methods [58]. Chlorophyll contents in the leaves were determined by spectrophotometry after 95% ethanol extraction [59].

4.8. RNA-Seq

Total RNA was extracted from one-year-old K. obovata leaves using the mirVana miRNA Isolation Kit (Ambion, Austin, TX, USA). Subsequently, libraries were prepared using the TruSeq Stranded mRNA LTSample Prep Kit (Illumina, San Diego, CA, USA) and sequenced on the Illumina sequencing platform (Illumina HiSeq X Ten). Paired-end reads were aligned to the K. obovata genome using HISAT2 (V. 2.1.0) [60]. The reads were quantified using featureCounts 2.0.6 [61], and gene expression levels were normalized using the transcripts per million (TPM) method.
Raw transcriptomic data from various K. obovata tissues (root, stem, leaf, and fruit) were obtained from the NCBI database (accession number: PRJNA416402). Additionally, RNA-Seq data for K. obovata leaves subjected to multiple episodes of cold stress were retrieved from the NCBI database (accession number: PRJNA678025) [11]. Expression levels of KobHLHs in transcripts per million mapped reads (TPMs) were collected for comprehensive transcriptomic data analysis [62].

4.9. Quantitative Real-Time PCR (qRT-PCR)

Total RNA was extracted from frozen leaves using Trizol reagent (Thermo Fisher Scientific, Waltham, MA, USA) following the manufacturer’s instructions. First-strand cDNA was obtained using a PrimeScriptTM 1st Strand cDNA Synthesis Kit. qRT-PCR was performed on a MA-6000 real-time PCR system using AceQ qPCR SYBR Green Master Mix (Vazyme Biotech, Nanjing, China). The primers are listed in Table S1. All experiments were performed in triplicate, and relative expression levels were calculated using the 2−ΔΔCT method, normalized to 18S rRNA [63,64]. Statistical significance was assessed by one-way ANOVA tests with a significance level of p-value < 0.05.

4.10. Co-Expression Network Analysis (WGCNA)

Differentially expressed genes among the samples were selected for the weighted gene co-expression network analysis (WGCNA) [65]. The soft threshold β = 10 was chosen to construct the network based on the adjacency matrix. The adjacency matrix was transformed into a topological overlap matrix. Hierarchical clustering was used to identify modules containing at least 30 genes. The correlation between co-expression modules and photosynthetic traits was calculated to obtain vital modules. The absolute value of Pearson’s correlation between module membership (MM) and gene significance (GS) was used to select hub genes. Hub genes in vital modules were identified with |MM| > 0.8 and |GS| > 0.6 and visualized with Cytoscape 3.9.1 [66].

4.11. Subcellular Localization

Full-length cDNA of the KobHLH genes were amplified using the primer pairs (Table S2). Each fragment was inserted into the Nco Ⅰ site of pCAMBIA2301 and fused in-frame with enhanced green fluorescent protein (eGFP). The recombinant vector was transformed into Agrobaeterium tumefaciena strain GV3101 through heat shock. The abaxial surfaces of Nicotiana benthamiana leaves were injected with the suspension. Fluorescence was detected using a confocal laser-scanning microscope (Zeiss LSM980, Oberkochen, Germany).

5. Conclusions

This comprehensive study provides valuable insights into the bHLH gene family in K. obovata. A total of 75 bHLH genes were identified in K. obovata and classified into 11 subgroups. Within each subgroup, conserved motifs and gene structures displayed a general similarity. Our findings suggest that the expansion of the KobHLH gene family is likely attributed to segmental duplication events. Expression pattern analyses revealed six KobHLH genes associated with cold stress and five associated with drought stress. Notably, through WGCNA analysis, a regulatory network of 11 KobHLH genes was predicted to regulate photosynthesis metabolism. This study lays the groundwork for a deeper understanding of photosynthesis responses to cold and drought stress in K. obovata.

Supplementary Materials

The following supporting information can be downloaded at: https://www.mdpi.com/article/10.3390/ijms242115942/s1.

Author Contributions

J.L., C.Z. and Y.C. conceived and drafted the manuscript; J.L. and S.C. designed and performed the experiments; J.L., Y.Y. and Q.S. analyzed data; J.L., C.Z. and Y.C. revised the manuscript. All authors have read and agreed to the published version of the manuscript.

Funding

The work was supported by the National Natural Science Foundation of China (32071503) and the Science and Technology Project of Wenzhou (2022S0029).

Institutional Review Board Statement

Not applicable.

Informed Consent Statement

Not applicable.

Data Availability Statement

Raw transcriptomic data had been deposited to the Genome Sequence Archive (GSA) in the National Genomics Data Center (NGDC) (CRA010510).

Conflicts of Interest

The authors declare no conflict of interest.

References

  1. Tregarot, E.; Caillaud, A.; Cornet, C.C.; Taureau, F.; Catry, T.; Cragg, S.M.; Failler, P. Mangrove ecological services at the forefront of coastal change in the French overseas territories. Sci. Total Environ. 2021, 763, 143004. [Google Scholar] [CrossRef] [PubMed]
  2. Fu, C.; Li, Y.; Zeng, L.; Zhang, H.; Tu, C.; Zhou, Q.; Xiong, K.; Wu, J.; Duarte, C.M.; Christie, P.; et al. Stocks and losses of soil organic carbon from Chinese vegetated coastal habitats. Glob. Chang. Biol. 2021, 27, 202–214. [Google Scholar] [CrossRef] [PubMed]
  3. Stott, P.A.; Christidis, N.; Otto, F.E.; Sun, Y.; Vanderlinden, J.P.; van Oldenborgh, G.J.; Vautard, R.; von Storch, H.; Walton, P.; Yiou, P.; et al. Attribution of extreme weather and climate-related events. Wiley Interdiscip. Rev. Clim. Chang. 2016, 7, 23–41. [Google Scholar] [CrossRef] [PubMed]
  4. Rosenzweig, C.; Parry, M.L. Potential impact of climate change on world food supply. Nature 1994, 367, 133–138. [Google Scholar] [CrossRef]
  5. Chen, L.; Wang, W.; Li, Q.Q.; Zhang, Y.; Yang, S.; Osland, M.J.; Huang, J.; Peng, C. Mangrove Species’ Responses to winter Air Temperature Extremes in China. Ecosphere 2017, 8, e01865. [Google Scholar] [CrossRef]
  6. Eslami-Andargoli, L.; Dale, P.E.R.; Sipe, N.; Chaseling, J. Local and landscape effects on spatial patterns of mangrove forest during wetter and drier periods: Moreton Bay, Southeast Queensland, Australia. Estuar. Coast. Shelf Sci. 2010, 89, 53–61. [Google Scholar] [CrossRef]
  7. Agraz-Hernández, C.M.; Chan-Keb, C.A.; Muñiz-Salazar, R.; Pérez-Balan, R.A.; Vanegas, G.P.; Manzanilla, H.G.; Osti-Sáenz, J.; del Río Rodríguez, R. Pore Water Chemical Variability and Its Effect on Phenological Production in Three Mangrove Species under Drought Conditions in Southeastern Mexico. Diversity 2022, 14, 668. [Google Scholar] [CrossRef]
  8. Alongi, D.M. Present state and future of the world’s mangrove forests. Environ. Conserv. 2002, 29, 331–349. [Google Scholar] [CrossRef]
  9. Liu, Y.L.; Shen, Z.J.; Simon, M.; Li, H.; Ma, D.N.; Zhu, X.Y.; Zheng, H.L. Comparative Proteomic Analysis Reveals the Regulatory Effects of H(2)S on Salt Tolerance of Mangrove Plant Kandelia obovata. Int. J. Mol. Sci. 2019, 21, 118. [Google Scholar] [CrossRef]
  10. Sobrado, M.A. Drought effects on photosynthesis of the mangrove, Avicennia germinans, under contrasting salinities. Trees 1999, 13, 125–130. [Google Scholar] [CrossRef]
  11. He, S.; Wang, X.; Du, Z.; Liang, P.; Zhong, Y.; Wang, L.; Zhang, Y.Y.; Shen, Y. Physiological and transcriptomic responses to cold waves of the most cold-tolerant mangrove, Kandelia obovata. Front. Plant Sci. 2023, 14, 1069055. [Google Scholar] [CrossRef] [PubMed]
  12. Sun, X.; Wang, Y.; Sui, N. Transcriptional regulation of bHLH during plant response to stress. Biochem. Biophys. Res. Commun. 2018, 503, 397–401. [Google Scholar] [CrossRef] [PubMed]
  13. Hu, M.J.; Sun, W.H.; Tsai, W.C.; Xiang, S.; Lai, X.K.; Chen, D.Q.; Liu, X.D.; Wang, Y.F.; Le, Y.X.; Chen, S.M.; et al. Chromosome-scale assembly of the Kandelia obovata genome. Hortic. Res. 2020, 7, 75. [Google Scholar] [CrossRef] [PubMed]
  14. Mao, T.Y.; Liu, Y.Y.; Zhu, H.H.; Zhang, J.; Yang, J.X.; Fu, Q.; Wang, N.; Wang, Z. Genome-wide analyses of the bHLH gene family reveals structural and functional characteristics in the aquatic plant Nelumbo nucifera. PeerJ 2019, 7, e7153. [Google Scholar] [CrossRef]
  15. Wu, Y.; Wu, S.; Wang, X.; Mao, T.; Bao, M.; Zhang, J.; Zhang, J. Genome-wide identification and characterization of the bHLH gene family in an ornamental woody plant Prunus mume. Hortic. Plant J. 2022, 8, 531–544. [Google Scholar] [CrossRef]
  16. Wang, N.; Shu, X.; Zhang, F.; Wang, Z. Transcriptome-wide characterization of bHLH transcription factor genes in Lycoris radiata and functional analysis of their response to MeJA. Front. Plant Sci. 2022, 13, 975530. [Google Scholar] [CrossRef]
  17. Heim, M.A.; Jakoby, M.; Werber, M.; Martin, C.; Weisshaar, B.; Bailey, P.C. The basic helix-loop-helix transcription factor family in plants: A genome-wide study of protein structure and functional diversity. Mol. Biol. Evol. 2003, 20, 735–747. [Google Scholar] [CrossRef]
  18. Li, X.; Duan, X.; Jiang, H.; Sun, Y.; Tang, Y.; Yuan, Z.; Guo, J.; Liang, W.; Chen, L.; Yin, J.; et al. Genome-wide analysis of basic/helix-loop-helix transcription factor family in rice and Arabidopsis. Plant Physiol. 2006, 141, 1167–1184. [Google Scholar] [CrossRef]
  19. Yang, J.; Gao, M.; Huang, L.; Wang, Y.; van Nocker, S.; Wan, R.; Guo, C.; Wang, X.; Gao, H. Identification and expression analysis of the apple (Malus × domestica) basic helix-loop-helix transcription factor family. Sci. Rep. 2017, 7, 28. [Google Scholar] [CrossRef]
  20. Kanaoka, M.M.; Pillitteri, L.J.; Fujii, H.; Yoshida, Y.; Bogenschutz, N.L.; Takabayashi, J.; Zhu, J.K.; Torii, K.U. SCREAM/ICE1 and SCREAM2 specify three cell-state transitional steps leading to arabidopsis stomatal differentiation. Plant Cell 2008, 20, 1775–1785. [Google Scholar] [CrossRef]
  21. Ito, S.; Song, Y.H.; Josephson-Day, A.R.; Miller, R.J.; Breton, G.; Olmstead, R.G.; Imaizumi, T. FLOWERING BHLH transcriptional activators control expression of the photoperiodic flowering regulator CONSTANS in Arabidopsis. Proc. Natl. Acad. Sci. USA 2012, 109, 3582–3587. [Google Scholar] [CrossRef] [PubMed]
  22. Wang, R.; Li, Y.; Gao, M.; Han, M.; Liu, H. Genome-wide identification and characterization of the bHLH gene family and analysis of their potential relevance to chlorophyll metabolism in Raphanus sativus L. BMC Genom. 2022, 23, 548. [Google Scholar] [CrossRef] [PubMed]
  23. Moon, J.; Zhu, L.; Shen, H.; Huq, E. PIF1 directly and indirectly regulates chlorophyll biosynthesis to optimize the greening process in Arabidopsis. Proc. Natl. Acad. Sci. USA 2008, 105, 9433–9438. [Google Scholar] [CrossRef] [PubMed]
  24. Zhao, H.; Abulaizi, A.; Wang, C.; Lan, H. Overexpression of CgbHLH001, a Positive Regulator to Adversity, Enhances the Photosynthetic Capacity of Maize Seedlings under Drought Stress. Agronomy 2022, 12, 1149. [Google Scholar] [CrossRef]
  25. Osland, M.J.; Enwright, N.; Day, R.H.; Doyle, T.W. Winter climate change and coastal wetland foundation species: Salt marshes vs. mangrove forests in the southeastern United States. Glob. Chang. Biol. 2013, 19, 1482–1494. [Google Scholar] [CrossRef]
  26. Du, Z.; You, S.; Yang, D.; Tao, Y.; Zhu, Y.; Sun, W.; Chen, Z.; Li, J. Comprehensive analysis of the NAC transcription factor gene family in Kandelia obovata reveals potential members related to chilling tolerance. Front. Plant Sci. 2022, 13, 1048822. [Google Scholar] [CrossRef]
  27. Toledo-Ortiz, G.; Huq, E.; Quail, P.H. The Arabidopsis basic/helix-loop-helix transcription factor family. Plant Cell 2003, 15, 1749–1770. [Google Scholar] [CrossRef]
  28. Su, W.; Ye, C.; Zhang, Y.; Hao, S.; Li, Q.Q. Identification of putative key genes for coastal environments and cold adaptation in mangrove Kandelia obovata through transcriptome analysis. Sci. Total Environ. 2019, 681, 191–201. [Google Scholar] [CrossRef]
  29. Horton, P.; Park, K.J.; Obayashi, T.; Fujita, N.; Harada, H.; Adams-Collier, C.J.; Nakai, K. WoLF PSORT: Protein localization predictor. Nucleic Acids Res. 2007, 35, W585–W587. [Google Scholar] [CrossRef]
  30. Zhang, Z.; Chen, J.; Liang, C.; Liu, F.; Hou, X.; Zou, X. Genome-Wide Identification and Characterization of the bHLH Transcription Factor Family in Pepper (Capsicum annuum L.). Front. Genet. 2020, 11, 570156. [Google Scholar] [CrossRef]
  31. Li, J.; Wang, T.; Han, J.; Ren, Z. Genome-wide identification and characterization of cucumber bHLH family genes and the functional characterization of CsbHLH041 in NaCl and ABA tolerance in Arabidopsis and cucumber. BMC Plant Biol. 2020, 20, 272. [Google Scholar] [CrossRef] [PubMed]
  32. Wang, X.J.; Peng, X.Q.; Shu, X.C.; Li, Y.H.; Wang, Z.; Zhuang, W.B. Genome-wide identification and characterization of PdbHLH transcription factors related to anthocyanin biosynthesis in colored-leaf poplar (Populus deltoids). BMC Genom. 2022, 23, 244. [Google Scholar] [CrossRef] [PubMed]
  33. Flagel, L.E.; Wendel, J.F. Gene duplication and evolutionary novelty in plants. New Phytol. 2009, 183, 557–564. [Google Scholar] [CrossRef] [PubMed]
  34. Cannon, S.B.; Mitra, A.; Baumgarten, A.; Young, N.D.; May, G. The roles of segmental and tandem gene duplication in the evolution of large gene families in Arabidopsis thaliana. BMC Plant Biol. 2004, 4, 10. [Google Scholar] [CrossRef]
  35. Yang, Z.; Bielawski, J.P. Statistical methods for detecting molecular adaptation. Trends Ecol. Evol. 2000, 15, 496–503. [Google Scholar] [CrossRef]
  36. Zhang, Z. KaKs_Calculator 3.0: Calculating Selective Pressure on Coding and Non-coding Sequences. Genom. Proteom. Bioinform. 2022, 20, 536–540. [Google Scholar] [CrossRef]
  37. Shen, T.; Wen, X.; Wen, Z.; Qiu, Z.; Hou, Q.; Li, Z.; Mei, L.; Yu, H.; Qiao, G. Genome-wide identification and expression analysis of bHLH transcription factor family in response to cold stress in sweet cherry (Prunus avium L.). Sci. Hortic. 2021, 279, 109905. [Google Scholar] [CrossRef]
  38. Fan, Y.; Lai, D.; Yang, H.; Xue, G.; He, A.; Chen, L.; Feng, L.; Ruan, J.; Xiang, D.; Yan, J.; et al. Genome-wide identification and expression analysis of the bHLH transcription factor family and its response to abiotic stress in foxtail millet (Setaria italica L.). BMC Genom. 2021, 22, 778. [Google Scholar] [CrossRef]
  39. Zhao, M.; Morohashi, K.; Hatlestad, G.; Grotewold, E.; Lloyd, A. The TTG1-bHLH-MYB complex controls trichome cell fate and patterning through direct targeting of regulatory loci. Development 2008, 135, 1991–1999. [Google Scholar] [CrossRef]
  40. Fursova, O.V.; Pogorelko, G.V.; Tarasov, V.A. Identification of ICE2, a gene involved in cold acclimation which determines freezing tolerance in Arabidopsis thaliana. Gene 2009, 429, 98–103. [Google Scholar] [CrossRef]
  41. Ahmad, A.; Niwa, Y.; Goto, S.; Ogawa, T.; Shimizu, M.; Suzuki, A.; Kobayashi, K.; Kobayashi, H. bHLH106 Integrates Functions of Multiple Genes through Their G-Box to Confer Salt Tolerance on Arabidopsis. PLoS ONE 2015, 10, e0126872. [Google Scholar] [CrossRef] [PubMed]
  42. Gao, Y.; Jiang, W.; Dai, Y.; Xiao, N.; Zhang, C.; Li, H.; Lu, Y.; Wu, M.; Tao, X.; Deng, D.; et al. A maize phytochrome-interacting factor 3 improves drought and salt stress tolerance in rice. Plant Mol. Biol. 2015, 87, 413–428. [Google Scholar] [CrossRef] [PubMed]
  43. Sun, H.; Shi, Q.; Liu, N.Y.; Zhang, S.B.; Huang, W. Drought stress delays photosynthetic induction and accelerates photoinhibition under short-term fluctuating light in tomato. Plant Physiol. Biochem. 2023, 196, 152–161. [Google Scholar] [CrossRef] [PubMed]
  44. Bascuñán-Godoy, L.; Sanhueza, C.; Cuba, M.; Zuñiga, G.E.; Corcuera, L.J.; Bravo, L.A. Cold-acclimation limits low temperature induced photoinhibition by promoting a higher photochemical quantum yield and a more effective PSII restoration in darkness in the Antarctic rather than the Andean ecotype of Colobanthus quitensis Kunt Bartl (Cariophyllaceae). BMC Plant Biol. 2012, 12, 114. [Google Scholar] [CrossRef]
  45. Dodd, A.N.; Belbin, F.E.; Frank, A.; Webb, A.A. Interactions between circadian clocks and photosynthesis for the temporal and spatial coordination of metabolism. Front. Plant Sci. 2015, 6, 245. [Google Scholar] [CrossRef]
  46. Artimo, P.; Jonnalagedda, M.; Arnold, K.; Baratin, D.; Csardi, G.; de Castro, E.; Duvaud, S.; Flegel, V.; Fortier, A.; Gasteiger, E.; et al. ExPASy: SIB bioinformatics resource portal. Nucleic Acids Res. 2012, 40, W597–W603. [Google Scholar] [CrossRef]
  47. Zhou, L.; Feng, T.; Xu, S.; Gao, F.; Lam, T.T.; Wang, Q.; Wu, T.; Huang, H.; Zhan, L.; Li, L.; et al. ggmsa: A visual exploration tool for multiple sequence alignment and associated data. Brief Bioinform. 2022, 23, bbac222. [Google Scholar] [CrossRef]
  48. Katoh, K.; Misawa, K.; Kuma, K.; Miyata, T. MAFFT: A novel method for rapid multiple sequence alignment based on fast Fourier transform. Nucleic Acids Res. 2002, 30, 3059–3066. [Google Scholar] [CrossRef]
  49. Nguyen, L.T.; Schmidt, H.A.; von Haeseler, A.; Minh, B.Q. IQ-TREE: A fast and effective stochastic algorithm for estimating maximum-likelihood phylogenies. Mol. Biol. Evol. 2015, 32, 268–274. [Google Scholar] [CrossRef]
  50. Zhang, L.; Chen, W.; Liu, R.; Shi, B.; Shu, Y.; Zhang, H. Genome-wide characterization and expression analysis of bHLH gene family in physic nut (Jatropha curcas L.). PeerJ 2022, 10, e13786. [Google Scholar] [CrossRef]
  51. Hu, B.; Jin, J.; Guo, A.Y.; Zhang, H.; Luo, J.; Gao, G. GSDS 2.0: An upgraded gene feature visualization server. Bioinformatics 2015, 31, 1296–1297. [Google Scholar] [CrossRef] [PubMed]
  52. Hao, Z.; Lv, D.; Ge, Y.; Shi, J.; Weijers, D.; Yu, G.; Chen, J. RIdeogram: Drawing SVG graphics to visualize and map genome-wide data on the idiograms. PeerJ Comput. Sci. 2020, 6, e251. [Google Scholar] [CrossRef] [PubMed]
  53. Wang, Y.; Tang, H.; Debarry, J.D.; Tan, X.; Li, J.; Wang, X.; Lee, T.H.; Jin, H.; Marler, B.; Guo, H.; et al. MCScanX: A toolkit for detection and evolutionary analysis of gene synteny and collinearity. Nucleic Acids Res. 2012, 40, e49. [Google Scholar] [CrossRef] [PubMed]
  54. Zhuo, X.; Zheng, T.; Zhang, Z.; Zhang, Y.; Jiang, L.; Ahmad, S.; Sun, L.; Wang, J.; Cheng, T.; Zhang, Q. Genome-Wide Analysis of the NAC Transcription Factor Gene Family Reveals Differential Expression Patterns and Cold-Stress Responses in the Woody Plant Prunus mume. Genes 2018, 9, 494. [Google Scholar] [CrossRef] [PubMed]
  55. Lescot, M.; Déhais, P.; Thijs, G.; Marchal, K.; Moreau, Y.; Van de Peer, Y.; Rouzé, P.; Rombauts, S. PlantCARE, a database of plant cis-acting regulatory elements and a portal to tools for in silico analysis of promoter sequences. Nucleic Acids Res. 2002, 30, 325–327. [Google Scholar] [CrossRef]
  56. Gene Ontology, C. The Gene Ontology resource: Enriching a GOld mine. Nucleic Acids Res. 2021, 49, D325–D334. [Google Scholar] [CrossRef]
  57. Wu, T.; Hu, E.; Xu, S.; Chen, M.; Guo, P.; Dai, Z.; Feng, T.; Zhou, L.; Tang, W.; Zhan, L.; et al. clusterProfiler 4.0: A universal enrichment tool for interpreting omics data. Innovation 2021, 2, 100141. [Google Scholar] [CrossRef]
  58. Yuan, L.; Shu, S.; Sun, J.; Guo, S.; Tezuka, T. Effects of 24-epibrassinolide on the photosynthetic characteristics, antioxidant system, and chloroplast ultrastructure in Cucumis sativus L. under Ca(NO(3))(2) stress. Photosynth. Res. 2012, 112, 205–214. [Google Scholar] [CrossRef]
  59. Hatice, G.; Atilla, E. Some physiological changes in strawberry (Fragaria × ananassa ‘Camarosa’) plants under heat stress. J. Hort. Sci. Biotech. 2006, 78, 894–898. [Google Scholar] [CrossRef]
  60. Kim, D.; Paggi, J.M.; Park, C.; Bennett, C.; Salzberg, S.L. Graph-based genome alignment and genotyping with HISAT2 and HISAT-genotype. Nat. Biotechnol. 2019, 37, 907–915. [Google Scholar] [CrossRef]
  61. Liao, Y.; Smyth, G.K.; Shi, W. featureCounts: An efficient general purpose program for assigning sequence reads to genomic features. Bioinformatics 2014, 30, 923–930. [Google Scholar] [CrossRef] [PubMed]
  62. Chen, Z.; Liao, M.; Yang, Z.; Chen, W.; Wei, S.; Zou, J.; Peng, Z. Co-expression network analysis of genes and networks associated with wheat pistillody. PeerJ 2022, 10, e13902. [Google Scholar] [CrossRef] [PubMed]
  63. Li, X.; Huang, H.; Zhang, Z.Q. Characterization and expression analysis of bHLH transcription factors reveal their putative regulatory effects on nectar spur development in Aquilegia species. Gene 2023, 852, 147057. [Google Scholar] [CrossRef] [PubMed]
  64. Du, Z.; You, S.; Zhao, X.; Xiong, L.; Li, J. Genome-Wide Identification of WRKY Genes and Their Responses to Chilling Stress in Kandelia obovata. Front. Genet. 2022, 13, 875316. [Google Scholar] [CrossRef]
  65. Langfelder, P.; Horvath, S. WGCNA: An R package for weighted correlation network analysis. BMC Bioinform. 2008, 9, 559. [Google Scholar] [CrossRef]
  66. Shannon, P.; Markiel, A.; Ozier, O.; Baliga, N.S.; Wang, J.T.; Ramage, D.; Amin, N.; Schwikowski, B.; Ideker, T. Cytoscape: A software environment for integrated models of biomolecular interaction networks. Genome Res. 2003, 13, 2498–2504. [Google Scholar] [CrossRef]
Figure 1. Chromosomal location of 75 KobHLH genes. Left scale represents the size of the chromosome, and the red areas represent the density of the genes on the chromosomes.
Ijms 24 15942 g001
Figure 2. Conserved motifs and gene structures of the KobHLHs. (A) Ten motifs of KobHLH proteins are represented by different colored boxes. (B) Gene structure of KobHLH genes. The gray lines represent introns, red boxes represent the untranslated region (UTR), and blue boxes represent exons.
Ijms 24 15942 g002
Figure 3. Schematic diagrams of the conserved amino acids and multiple alignment of the KobHLH domains. (A) The conserved amino acids of the KobHLH domains shown with the lollipop. (B) Sequence logo for the KobHLH domains. Height of each stack represents conservation of the sequence at a position. (C) Multiple sequence alignment of the KobHLH domains. Different colors represent different amino acids, red for D and E, green for N, C, Q, S and T, blue for R, H and K, orange for A, G, I, L, M, P and V, and gold for F, W and Y.
Ijms 24 15942 g003
Figure 4. Phylogenetic analysis of KobHLH proteins from K. obovata and A. thaliana. (A) The unrooted phylogenetic tree of the KobHLH and AtbHLH proteins. Different subfamilies are marked with different colors. (B) Number of each subfamily in two species.
Ijms 24 15942 g004
Figure 5. Syntenic analysis of bHLH genes from K. obovata, Arabidopsis, rice, poplar. (A) The collinearity of K. obovata genome shown by the gray-banded regions in the circle. The red line represents segmental duplications of KobHLH gene pairs. (B) Synteny relationships of the KobHLH genes with the homologous genes from three representative plants (Arabidopsis, rice, poplar).
Ijms 24 15942 g005
Figure 6. Identification of cis-acting elements and GO annotation of KobHLH genes. (A) Number of cis-acting elements in 2 kb promoter region of each KobHLH gene. The bluer color in the grids means more cis-acting elements, and the greener the fewer. The cis-acting elements in the x-axis are divided into three categories, with cyan representing light-responsive elements, orange representing stress-related elements, and red representing growth and development-related elements. The right side of the figure shows the position of the cis-acting elements in the promoter region. (B) Biological process, cellular component, and molecular function of KobHLH genes.
Ijms 24 15942 g006
Figure 7. Expression patterns of the KobHLH genes. (A) Tissue expression patterns of the KobHLH genes. (B,C) The expression profiles of the KobHLH genes with cold or drought stress. (D) The expression profiles of the KobHLH genes in response to low temperature stress based on public transcriptomic data. The expression levels were normalized by row using a z-score method. The red and blue triangles indicate the genes that are significantly up-regulated and down-regulated, respectively, under cold and drought stress (p < 0.05).
Ijms 24 15942 g007
Figure 8. Gene modules and regulatory networks of KobHLHs associated with photosynthesis. (A) The net photosynthetic rate (Pn), actual photochemical efficiency of PSII (ΦPSII), maximum photochemical efficiency of PSII (FV/Fm), and total chlorophyll content (Chl) photosynthetic parameters in leaves of K. obovata seedlings under cold and drought conditions. The “**” represents statistically significant differences (p < 0.01) analyzed using Student’s t-test. (B) Heatmap of the correlation between the modules and photosynthesis. Each cell contains the corresponding Pearson correlation coefficient and p-value. Red represents a positive correlation, whereas blue represents a negative correlation. (C) Scatter plot of the blue module genes. The vertical and horizontal coordinate represent GS score and MM score for each gene. (D) The co-expression regulatory network of KobHLH genes associated with photosynthesis.
Ijms 24 15942 g008
Figure 9. Subcellular localization of KobHLH52 and KobHLH30 in tobacco leaves.
Ijms 24 15942 g009
Disclaimer/Publisher’s Note: The statements, opinions and data contained in all publications are solely those of the individual author(s) and contributor(s) and not of MDPI and/or the editor(s). MDPI and/or the editor(s) disclaim responsibility for any injury to people or property resulting from any ideas, methods, instructions or products referred to in the content.

