Abstract
Topoisomerase I (TopoI) in Streptococcus pneumoniae, encoded by topA, is a suitable target for drug development. Seconeolitsine (SCN) is a new antibiotic that specifically blocks this enzyme. We obtained the topARA mutant, which encodes an enzyme less active than the wild type (topAWT) and more resistant to SCN inhibition. Likely due to the essentiality of TopoI, we were unable to replace the topAWT allele by the mutant topARA version. We compared the in vivo activity of TopoIRA and TopoIWT using regulated overexpression strains, whose genes were either under the control of a moderately (PZn) or a highly active promoter (PMal). Overproduction of TopoIRA impaired growth, increased SCN resistance and, in the presence of the gyrase inhibitor novobiocin (NOV), caused lower relaxation than TopoIWT. Differential transcriptomes were observed when the topAWT and topARA expression levels were increased about 5-fold. However, higher increases (10–15 times), produced a similar transcriptome, affecting about 52% of the genome, and correlating with a high DNA relaxation level with most responsive genes locating in topological domains. These results confirmed that TopoI is indeed the target of SCN in S. pneumoniae and show the important role of TopoI in global transcription, supporting its suitability as an antibiotic target.
1. Introduction
Streptococcus pneumoniae is a major human pathogen. It is the most important etiological agent of community-acquired pneumonia, and main cause of meningitis, bacteremia and otitis media in children, being responsible annually for the death of one million children worldwide [1]. Resistance of this bacterium to beta-lactams and macrolides [2] has spread, which has resulted in recommending fluoroquinolones, which target type II topoisomerases, for treatment [3]. These enzymes, which cleave both strands of the DNA transiently, are topoisomerase IV (TopoIV) and gyrase. Although no worrying levels of resistance to fluoroquinolones have yet detected, they could increase in tandem with an increase in their use, either due to alterations in their targets [4,5,6] or to the action of active efflux [7,8]. In this situation, finding new drug targets against S. pneumoniae, and other pathogenic bacteria, is an urgent clinical need. Topoisomerase I (TopoI) is the only pneumococcal type I topoisomerase and cleaves only one strand of the DNA. TopoI and gyrase are the main enzymes that maintain DNA topology in this bacterium [9,10]. TopoI is a suitable new antibacterial target [11] and SCN is a catalytic inhibitor of the TopoI cleavage reaction of S. pneumoniae [12,13] and Mycobacterium tuberculosis [14]. SCN shows higher bactericidal activity than fluoroquinolones, against both planktonic bacteria and biofilms [13], and is effective against pneumococcal isolates resistant to fluoroquinolones in a murine sepsis model [15].
The regulation of the transcription of topoisomerase genes (gyrA and gyrB for gyrase; parE and parC for TopoIV, and topA for TopoI) controls homeostasis of supercoiling (Sc) in bacteria. In Escherichia coli, DNA relaxation causes a decrease in the transcription of the TopoI gene [16], and an increase in transcription of gyrase genes [17,18]. In addition, several nucleoid-associated proteins, through alteration of Sc [19,20], also affect the expression of E. coli topoisomerases. In S. pneumoniae, among the three nucleoid-associated proteins identified so far (HU [21], SMC [22], and StaR [23]), HU and StaR are involved in Sc regulation. In addition, in this bacterium, global transcriptomic responses have been detected under DNA relaxation [9] or hypernegative Sc [24], revealing Sc domains. Genes of these domains show a coordinated transcriptional response. DNA relaxation modulates the transcription of 37% of the genome, with a majority (>68%) of responsive genes clustered in 15 up-regulated (UP) or down-regulated (DOWN) domains [9]. On the other hand, hypernegative Sc modulates the transcription of 10% of the genome, with 25% of responsive genes grouped into 12 Sc domains [24]. Domains are enriched in specific functions [25], and their location is conserved in the Streptococcus genus [26], suggesting a topology-driven evolution.
Location of topoisomerase genes in Sc domains determines its transcriptional regulation [26]: topA is located in a DOWN-domain; gyrB is located in an UP-domain. In this way, Sc regulates transcription, and transcription is at the same time, a major contributor to the level of Sc. The twin supercoiled-domain model proposes that domains of negative and positive Sc are transiently generated behind and ahead of the moving RNA polymerase, respectively [27]. In vitro studies support both this model and a role for TopoI in removing R-loops, which would otherwise interfere with transcription elongation [28,29,30]. In addition, physical interaction of TopoI and RNA polymerase has been detected in vitro for E. coli [31] and S. pneumoniae [32]. Furthermore, ChIP-Seq experiments have shown in vivo co-localization of RNAP, TopoI and gyrase on the active transcriptional units of M. tuberculosis [33] and genome-wide proximity between TopoI and RNA polymerase in S. pneumoniae, supporting the interplay between transcription and Sc [32].
In the present study, to ascertain that TopoI is the target of SCN by genetic methods, we have obtained a mutant (topARA) of the TopoI coding gene. We analyzed the in vitro activity of TopoIRA and its resistance to SCN. We also compared the in vivo activity of TopoIRA and TopoIWT using regulated overexpression strains, by analyzing Sc and susceptibility to NOV and SCN. Giving the role of TopoI in transcription, we have also studied the transcriptome under over-expression conditions of the topARA and wild-type alleles and analyze the Sc domains under NOV treatment.
2. Results
2.1. A TopoI Mutant Enzyme Shows Decreased Activity and Increased SCN Resistance In Vitro
A BLAST was made with R6 TopoI against the S. pneumoniae sequences available in the NCBI data bank (accessed on 18 March 2022). Among the first 200 sequences producing significant alignments, 131, which had complete TopA and GyrA sequences, were selected for the analysis. The comparison of amino acid sequences of TopoI proteins available in the NCBI data bank revealed that, among 131 sequences, 127 showed variation with respect to the sequence of the R6 strain (Figure 1). Amino acid variations were from 1- to 5-residues of the 701-residue TopoI protein, representing a frequency lower than 0.8%, in agreement with the essential nature of the protein. Likewise, the variation in GyrA of the same strains was in the same range (lower than 0.5%), varying between 1- and 4- changes in the 823-residue GyrA protein.
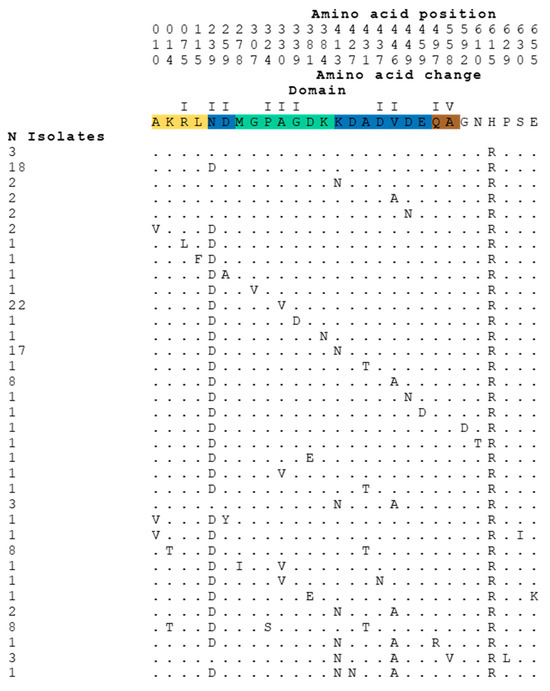
Figure 1.
Amino acid changes in TopoI enzymes of S. pneumoniae found in 131 sequences of the NCBI data Bank.
These changes were unevenly distributed in the TopoI sequence, where domain II showed the highest variation (184 changes in 9 out of 139 residues), perhaps because it does not form part of the gate strand binding site. The remaining domains, which are part of the DNA-binding site, showed lower variations: 2 changes in 2 out of 129 residues (domain I); 37 changes in 6 out of 129 residues (domain III), and 4 changes in 2 out of 106 residues (domain IV) (Figure 1 and Figure 2a).
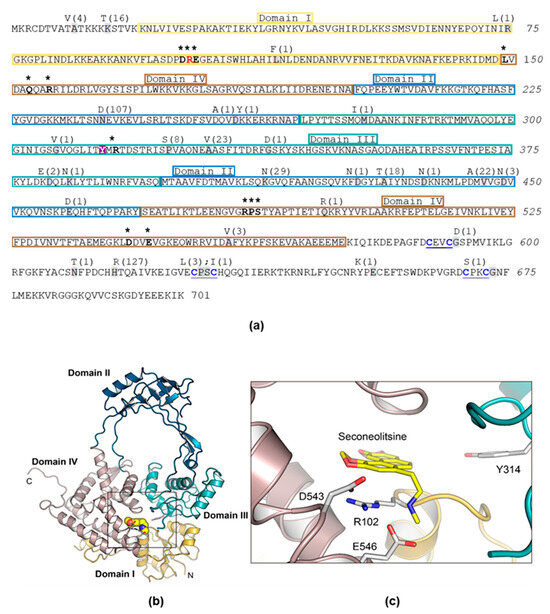
Figure 2.
Primary structure of S. pneumoniae TopoI, structural model, and modelling of the interaction with SCN. (a) Amino acid sequence showing structural domains illustrated in (b) and residues involved in nucleotide binding (written in boldface and labelled with asterisks). The catalytic Y-314 residue is shadowed in magenta. The R-102 residue is shown in red. Grey shadowed residues are those that varied in 137 clinical isolates accessible in the nucleotide databases, and letters above them are the residue changes observed in the number of isolates indicated in parentheses. (b) Overall structure of the 67 kDa fragment showing the four structural domains indicated in (a). (c) SCN bound to the nucleotide-binding site of TopoI. The residues forming the binding site are drawn as capped sticks.
We unsuccessfully attempted to obtain SCN-resistant mutants using a PCR/transformation approach that previously allowed us to obtain mutants resistant to several chemically unrelated antibiotics [34]. We chose to perform site-directed mutagenesis of topA cloned into pQE1 plasmid in E. coli followed by protein purification and an activity assay in the presence of SCN. Mutagenesis was directed to obtain four specific substitutions of three key TopoI residues involved in its interaction with SCN: R102A (domain I), D543A (domain IV), E546A, and E546K (domain IV) [12] (Figure 2b,c). In the structural model of the pneumococcal TopoI based on the structure of the E. coli enzyme, these three residues are located in the DNA-binding site. However, of the four substitutions, we were only able to obtain the R102A TopoI mutant. The rest of mutant genes contained internal stop codons. The topARA and topAWT alleles, carrying a 6×—His tail, were overexpressed and TopoIRA and TopoIWT were purified by affinity chromatography (Figure S1). Their enzymatic activities were compared using relaxation assays of pBR322. The amount of TopoIWT enzyme yielding 50% activity was 54.4 ± 22.8 ng (Figure 3a,c), while it was of 1084 ± 240 ng for the TopoIRA enzyme (Figure 3b,d). This means that the activity of TopoIRA is 20-fold lower than that of TopoIWT.
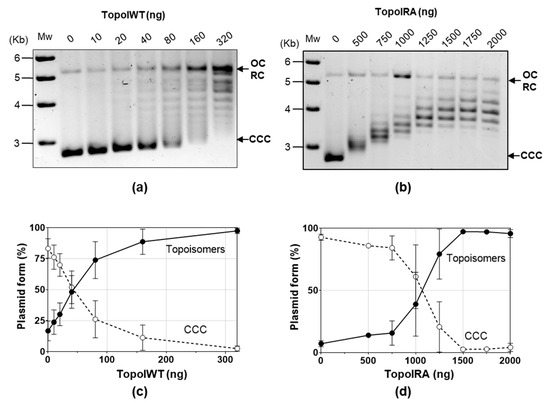
Figure 3.
TopoIRA is less active than TopoIWT. (a,b) Plasmid pBR322 (0.5 µg) was incubated with the indicated amounts of purified TopoI enzymes for 1 h at 37 °C. Mw, size of DNA markers. (c,d) Quantification of TopoI activity determined as increase of topoisomers (including OC/RC forms) and decrease of CCC form (mean ± SEM, n = 3).
Inhibition experiments were performed using purified enzymes at 50% activity (Figure 4). These experiments showed that SCN at a concentration of 6.8 ± 2.0 µM reduced the activity of the TopoIWT enzyme to 50%, while a concentration of 13.4 ± 5.2 µM of SCN was necessary for the same reduction of the TopoIRA enzyme activity, indicating that TopoIRA is 2-times more resistant to SCN inhibition.
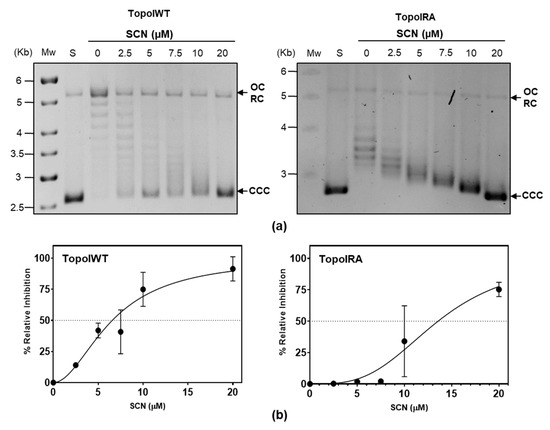
Figure 4.
TopoIRA showed increased SCN resistance in vitro. (a) pBR322 was treated with 1 unit of purified enzymes in reactions containing SCN at the concentrations indicated. S, pBR322 used as a substrate; Mw, molecular DNA marker size. Symbols: CCC, covalently closed circles; OC, relaxed open circles. (b) Quantification of the activity of TopoI determined as in Figure 3c.
2.2. Role of TopoIR102A in Cell Viability and NOV Resistance In Vivo
We were unable to replace the topAWT allele with topARA in the chromosome, likely due to the essential role of Topo I in cell viability. To ascertain the effect of topARA on viability, strains R6PZntopAWT and R6PZntopARA were constructed, which carried the wild-type topA gene and an ectopic copy of topAWT or topARA under the control of PZn promoter (Figure 5a). Growth of these strains in the absence or presence of ZnSO4 with or without subinhibitory NOV concentrations (0.5 × MIC) was studied. In the absence of ZnSO4, i.e. under conditions in which both strains express topA from the chromosomal copy, the strains carrying topAWT and topARA showed, as expected, equivalent growth rates (29.9 min ± 0.7 and 31.5 min ± 2.5, respectively, Figure 5b). However, under conditions of TopoI induction, the strain carrying topARA showed a higher duplication time (37.5 min ± 2.2) than that carrying topAWT (32.8 min ± 0.4), p = 0.022. Under these induction conditions, the amounts of TopoIWT and TopoIRA relative to RpoB detected by Western blot were equivalent (2.0 ± 0.5 and 2.4 ± 0.7, Figure 5c). These results support that the differences in growth between the strains overproducing TopoIWT and TopoIRA, could be attributed to the intrinsic activity of the enzymes, confirming the lower specific activity of TopoIRA in vivo. This effect was confirmed under NOV treatment, which induced down regulation of topA from its promoter. Then, under NOV treatment and in the presence of ZnSO4, the expression of topAWT and topARA alleles came mainly from PZn, as observed by Western blot (Figure 5b). In these conditions, strain R6PZntopARA grew with a higher duplication time than that of R6PZntopAWT (64.7 ± 3.6 versus 53.7 ± 2.1, p = 0.01), revealing a greater sensitivity to NOV.
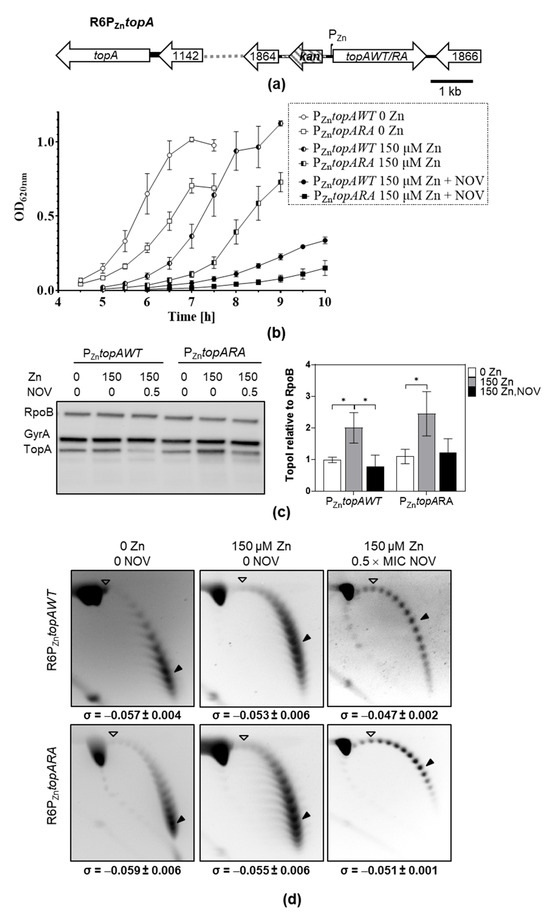
Figure 5.
Overproduction of TopoIRA increases lethality and NOV susceptibility. (a) Genetic organization of strain R6PZntopA in which PZntopAWT or PZntopARA fusions are located to spr1865. (b) Growth (mean ± SEM, n = 3) of strains. Overnight cultures in AGCH medium without ZnSO4 were diluted 1000-fold and grew under the indicated conditions. Values after reaching the stationary phase were excluded from the graphic for more clarity. (c) Western blot analysis of TopoI and GyrA relative to RpoB amount. After dilution, cultures were grown to OD620nm = 0.4, and samples containing 0.12 units of OD620nm were separated by SDS-PAGE, blotted, and membranes incubated with polyclonal anti-GyrA, anti-TopoI and anti-RpoB antibodies. A representative blot is showed together with the quantification of the amount of TopoI relative to RpoB (mean ± SD, n = 3). Statistical significance two-tailed Student’s t-test, * p < 0.05. (d) Distribution of topoisomers of plasmid pLS1 from the strains and growth conditions indicated. Samples were run in agarose gels in the presence of 1 and 2 µg/mL chloroquine in the first and second dimensions, respectively. A white arrowhead indicates the topoisomer that migrated with ΔLk = 0 in the second dimension and had a ΔWr = −14 (the number of positive supercoils introduced by 2 µg/mL chloroquine). A black arrowhead indicates the most abundant topoisomer. The corresponding σ value (mean ± SD, n = 3) is indicated below each panel.
To analyze the in vivo activities of TopoIWT and TopoIRA, we estimate Sc densities (σ) by analyzing pLS1 topoisomers (Figure 5d). This estimation of σ values in the plasmid correlates with nucleoid compaction levels estimated by super-resolution confocal microscopy [10]. The analysis of σ values showed a higher activity for TopoIWT, reflected in the higher relaxation (σ = −0.047 ± 0.002) in the presence of NOV when TopoIWT is expressed compared to TopoIRA (σ = −0.051 ± 0.001), p = 0.038.
2.3. TopoIR102A Showed SCN Resistance In Vivo
In order to study the effect of over-expressing TopoIRA and TopoIWT enzymes, their corresponding alleles fused to 6×—His tags were cloned into pLS1ROM, leading to pLS1ROMtopAWT and pLS1ROMtopARA. These recombinant plasmids carried topA under the control of PMal promoter, which is partially repressed by 0.8% sucrose (S) and moderately induced by 0.4% sucrose + 0.4% maltose (SM). These plasmids were introduced into strain ΔtopAPZntopA, which is as R6PZntopA (Figure 5a) but has a topA deletion in its native chromosomal location (Figure 6a). To compare the effect of the expression of topAWT or topARA on growth, cultures grown in the absence of ZnSO4 and in the presence of S to exponential phase (OD620nm = 0.4), were diluted 1000-fold in media without ZnSO4 containing either S or SM. Both strains grew with equivalent rates in both media. As expected, the addition of the TopoI inhibitor SCN at 0.5 × MIC or 1 × MIC caused growth inhibition, which was significantly higher in SM medium, when the TopoI enzymes were overexpressed. This result indicates that overproduction of either TopoIWT or TopoIRA enzymes is deleterious. However, the strain expressing topARA showed lower growth inhibition, having a lower doubling time (131.7 ± 3.0 min) than the strain carrying topAWT (173.2 min ± 21.7), p = 0.03 (Figure 6b). This result suggests that the TopoIRA enzyme is more resistant to SCN in vivo. Under these experimental conditions in the absence of ZnSO4, the only TopoI enzyme synthesized came from the recombinant plasmids, which showed some escape in S medium (Figure 6c). This is supported by the slightly larger size of the recombinant TopoI due to the 6×—His tail relative to the TopoI enzyme expressed from the chromosome in strain R6 pLS1ROM (Figure 6c, left panel). Quantification of Western blots confirmed the overproduction of the TopoI enzymes cloned into pLS1ROM. Expression values in SM inducing medium compared to the values in S medium were of 9.7- and 10.6-fold for TopoIWT and TopoIRA, respectively (Figure 6c, right panel). Compared to the values obtained with the R6pLS1ROM strain, the net increase in TopoI enzymes over the wild-type situation was of 8.8- (TopoIWT) and 9.1-fold (TopoIRA).
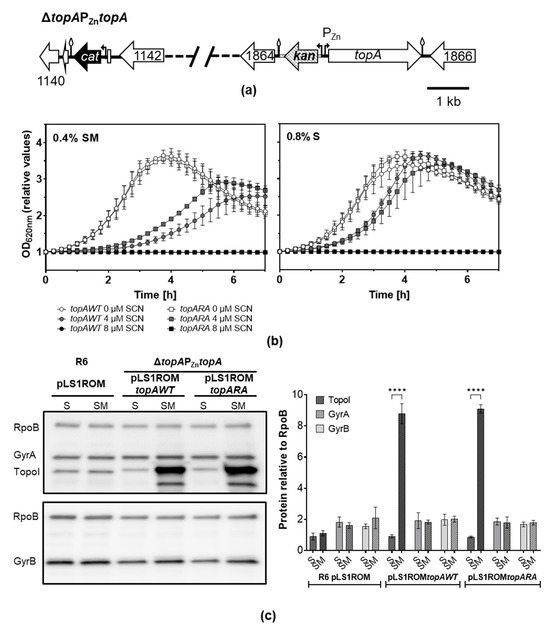
Figure 6.
Overproduction of TopoIRA increases SCN resistance. (a) Genetic map of strain ΔtopAPZntopA where the chromosomal topA gene was deleted by replacement with a cat cassette and a PZntopA fusion is located at spr1865. (b) Growth of strains ΔtopAPZntopA carrying pLS1ROMtopAWT or pLS1ROMtopARA on medium containing S or SM in the presence or absence of SCN. Values of OD620nm relative to time 0 are represented. Overnight cultures grown to OD620nm = 0.4 on medium depleted of ZnSO4 containing S were diluted 1000-fold in the indicated media without ZnSO4. Growth was monitored in a TECAN Infinite 200 PRO reader. Results shown are the mean ± SEM, n = 3. (c) Western blot analysis of TopoI, GyrA, and GyrB, relative to RpoB. Cultures were grown as in (a) to OD620nm = 0.4 (relative OD620nm value of 2.5) and proteins from samples containing 0.12 units of OD620nm were separated by SDS-PAGE and blotted. The membranes were incubated with polyclonal anti-GyrA, anti-TopoI, anti-GyrB and anti-RpoB antibodies. A representative blot is shown with the quantification of the amount of the proteins relative to that of RpoB (mean ± SD, n = 3). Statistical significance two-tailed Student’s t-test, **** p < 0.0001.
2.4. Transcriptomic Effects Triggered by Overproduction of TopoIWT and TopoIRA
We used RNA-Seq to compare the transcriptome of strain ΔtopAPZntopA, carrying pLS1ROMtopAWT or pLS1ROMtopARA, under induction conditions (SM medium) and compared it to their transcriptomes in the absence of induction (S medium). As expected, the expression of topA increased in both strains in SM medium, being of about 5-fold for topAWT and of 6-fold for topARA (Figure 7c). This is consistent with the changes in the protein amount detected by Western blot (Figure 6c, about 9-fold for both enzymes). At the same time, Sc density decreased with the overexpression of TopoIWT or TopoIRA, which changed from −0.064 to −0.054 for TopoIWT (p = 0.0002) and from −0.061 to −0.054 (p = 0.007) for TopoIRA (Figure 7a). No changes in Sc were observed in strain R6 carrying the pLS1ROM vector (−0.060 versus −0.059). That is, the increased amount of TopoI by induction of its expression was accompanied by the reduction of the values of σ. These differences were significant, compared to the values obtained with the pLS1ROM vector (p = 0.0003, for pLS1ROMtopAWT, and p = 0.006, for pLS1ROMtopARA).
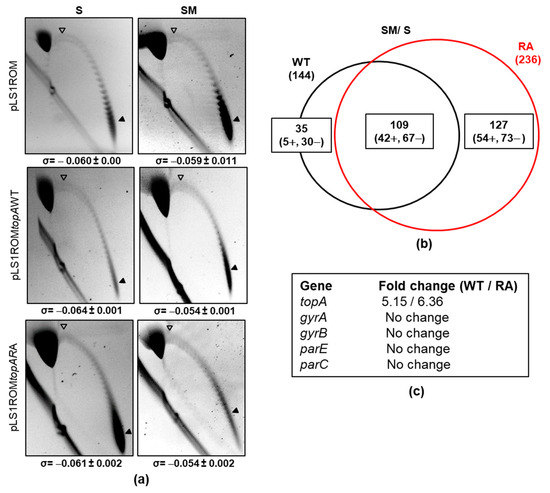
Figure 7.
Transcriptomic response and Sc in strain ΔtopAPZntopA carrying pLS1ROMtopAWT or pLS1ROMtopARA under overproduction of TopoI enzymes. (a) Distribution of topoisomers of plasmids pLS1ROM, pLS1ROMtopAWT or pLS1ROMtopARA under non-induction (S) or induction (SM) culture conditions grown as indicated in Figure 6. Samples were taken at OD620nm = 0.4 (relative OD620nm value of 2.5) and plasmids were run in agarose gels in the presence of 1 and 2 µg/mL chloroquine in the first and second dimensions, respectively. White arrowheads indicate the topoisomer that migrated with ΔLk = 0 in the second dimension. Therefore, this topoisomer migrated with ΔWr = −21 for pLS1ROM and −27 for the recombinant derivatives coding the TopoI enzymes. Black arrowheads indicate the most abundant topoisomer. The σ value (average ± SD, n = 3) is indicated. (b) Venn diagram showing DEGs upon treatment with SM. (c) Variations in the expression of genes coding DNA topoisomerases.
The described increases of TopAWT or TopARA enzymes triggered differential transcriptomic responses (Figure 7). A total of 144 (47 up-regulated, 97 down-regulated) differentially expressed genes (DEGs) were detected in the strain overproducing TopoIWT, while a higher number, 236 (96 up-regulated, 140 down-regulated), were detected in the TopoIRA overproducing strain (Figure 7b), being 109 DEGs common to both strains. The strain overproducing TopoIRA gave rise to a higher number of exclusive DEGs (127) than the one overproducing TopoIWT (35). Genes involved in DNA metabolism were more represented among DEGs under TopoIRA overexpression than under TopoIWT overexpression (9 in RA versus 1 in WT, p = 0.001). These included down-regulated genes involved in restriction-modification systems (operons coding spnIRSM and dpnCD), replication (recX), and chromosome segregation (spoOJ). It also included the recG gene involved in recombination, which was up-regulated. There was also a difference among genes coding hypothetical proteins (103 in TopoIRA versus 53 in TopoIWT, p < 0.001).
2.5. Transcriptomic Effects Triggered by Overproduction of TopoIWT and TopoIRA under Relaxation Induced by NOV
Relaxation of Sc by inhibition of DNA gyrase with NOV produces changes in the S. pneumoniae transcriptome that reveal the existence of domains whose genes are regulated by Sc [9]. To know the role of TopoI in this response to Sc, we analyzed the DEGs produced by NOV under conditions of non-induction (S medium) or induction (SM medium) of topoIWT or topoIRA (Figure 8). When the cultures overproducing TopoIWT and TopoIRA were treated with NOV, an extensive transcriptomic response was observed. The number of DEGs produced by NOV in S medium was similar in cells producing TopoIWT (874, ~43% transcriptome) or TopoIRA (866, ~42% transcriptome) and most of these genes were common (772) (Figure 8a). The total number of DGEs produced by NOV under TopoI overproduction conditions was higher than in S medium: 1134 for TopoIWT (~55%) and 1074 for TopoIRA (~53%). On the other hand, the relative numbers of DEGs were similar between the two strains and, as in S medium, most of the DEGs were common (965) (Figure 8b). No significant alterations in the genome distribution of DEGs were observed between the two strains (Figure S3).
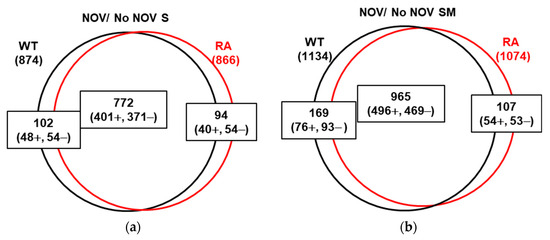
Figure 8.
Transcriptomic response to NOV treatment in strain ΔtopAPZntopA expressing topAWT or topARA. Venn diagram showing DEGs upon treatment with NOV (10 × MIC, 30 min) growing in S (a) or SM (b) media.
We were unable to perform consistent 2-D agarose gel electrophoresis of pLS1ROMtopAWT and pLS1ROMtopARA topoisomers in the presence of NOV. This could be due to the instability of the plasmids under these conditions. Alternatively, we estimated Sc levels using our super-resolution confocal microscopy method, recently described [10]. The estimated σ values for the samples were extrapolated from known σ values of control samples with different degrees of DNA relaxation (Figure 9a). As expected, NOV treatment produced a reduction in Sc, compared to the Sc observed in the absence of antibiotics (Figure 9a). This decrease in Sc was higher when TopoI was overproduced in SM medium. It varied from −0.054 to −0.010 for the strain overexpressing topAWT and from −0.029 to −0.006 for the strain overexpressing topARA (Figure 9b).
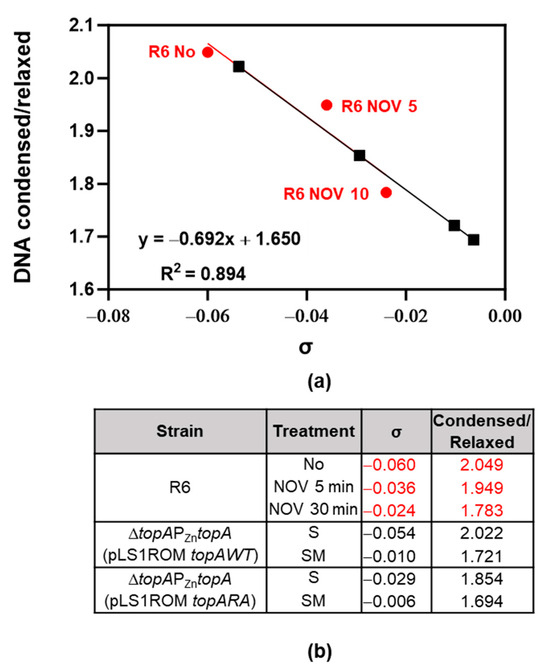
Figure 9.
Nucleoid compaction measurement by using super-resolution confocal microscopy. Bacterial DNA was stained by using Sytox Green, image analysis was performed with Cell profiler v4.2.1 with a customized pipeline to define DNA condensed/relaxed areas per cell. More than 1800 cells were quantified per sample. Ratio of condensed versus relaxed was calculated and graphed using Microsoft Excel software. (a) Correlation between values obtained by confocal microscopy vs. σ values estimated in 2D-agarose gels of strains and treatment indicated in (b). Red dots and red numbers are controls, black squares and black numbers are unknown values.
We have previously identified topological domains, which are constituted by genes showing a coordinated transcriptional response under topological stress (DNA relaxation with NOV treatment) [24]. Domains were identified considering they should contain at least 12 genes and ≥40% DEGs with the same response. Domains located at a distance ≤5 genes were fused into one and, in addition, clusters that exclusively contained genes belonging to a unique co-transcriptional unit were excluded. To identify topological domains in the transcriptome of strains ΔtopAPZntopA(pLS1ROMtopAWT) and ΔtopAPZntopA(pLS1ROMtopARA) in the presence of NOV and in conditions of topA induction (SM medium) or non-induction (S medium), we used the criteria described above, which we had established. This allowed the detection of Sc-regulated transcriptional domains, whose size was larger in cultures grown in the presence of SM than in the presence of S (Figure 10a), correlating with the level of TopoI production (Figure 10b). In fact, differences in TopoI expression were detected, being about 3-fold higher in SM media than in S media. However, changes in the genes of the other topoisomerases were equivalent in SM or S media. The distribution of topological domains varied depending of the levels of TopoI expression and the number of DEGs located in UP or DOWN domains increased with respect to those in R6 under physiological conditions. This reached about 37% of the genome in R6 [35], 38% in ΔtopAPZntopA(pLS1ROMtopA) in the presence of S, and 52% in the presence of SM. The number of DEGs located in UP-domains increased from 293 (R6) to 406/400 (TopoIWT/TopoIRA) in S-grown cultures and 541/544 (TopoIWT/TopoIRA) in SM-grown cultures. The increase in the number of DEGs was higher in DOWN-domains than in UP-domains. It changed from 279 (R6) to 366/375 (WT/RA) in S-treated cultures or 542/506 (TopoIWT/TopoIRA) in SM treated cultures. No significant changes in the transcriptomes of strains overproducing TopoIWT or TopoIRA were found.
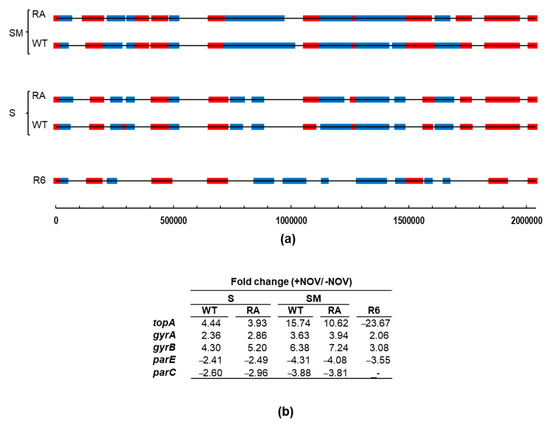
Figure 10.
Transcriptomic response after NOV treatment of strains overproducing TopoI. (a) Location of topological domains containing UP-regulated (red) or DOWN-regulated (blue) DEGs after NOV treatment (30 min 10 × MIC) in strains R6 (as taken from [9]), ΔtopAPZntopA carrying pLS1ROMtopAWT (WT), or pLS1ROMtopARA (RA). Strains were grown under induction (SM medium) or non-induction (S medium) conditions. DEGs showing a fold change ≥ 2 (absolute value) and a p-value-adjusted ≤ 0.01 were considered. DEGs are represented against the 5′ location of each open reading frame in R6. (b) Variations in the expression of genes coding DNA topoisomerases.
3. Discussion
The results of this study confirm by means of directed mutagenesis in S. pneumoniae topA that TopoI is indeed the target of SCN, as previously anticipated by our group, in both S. pneumoniae [12,23] and M. tuberculosis [14]. We were previously unable to obtain spontaneous mutants resistant to SCN, which suggests that the alteration of the single type I topoisomerase in S. pneumoniae could be lethal, especially if the alteration would be at the DNA-binding site, the site of interaction with SCN. The absence of changes at the DNA-binding site in clinical isolates supports the essentiality of these residues (Figure 1 and Figure 2). In E. coli, which possess two Type I topoisomerases (TopoI and TopoIII), a point mutation in TopoI (R168C change, equivalent to R156 of S. pneumoniae) located in the catalytic site of the enzyme has been obtained, although the mutant strain shows increased mutation frequencies [36]. However, E. coli cells lacking their two type I topoisomerases (TopA and TopB) are not viable [37]. In bacteria that have a single Type I topoisomerase, such as S. pneumoniae and M. tuberculosis, SCN is highly active [12,13,14].
By using directed mutagenesis, we were able to obtain a topARA mutant. The mutated residue (R102) is predicted to establish a cation-π interaction with SCN, which suggests that the R102A substitution would confer resistance by interfering this interaction. In accordance, TopoIRA protein showed 20-fold lower specific activity in vitro and 2-fold higher SCN resistance (Figure 3 and Figure 4). Although we were unable to substitute topAWT by topARA in the chromosome, we tested the in vivo activity of TopoIRA compared to TopoIWT by analyzing genetically constructed strains. We made a strain in which topARA and topAWT were located at an ectopic location under the control of the controllable PZn promoter (Figure 5A). Overexpression of TopoI enzymes with respect to R6 strain in the presence of Zn was modest, of about 2-fold. Even with the low expression levels, differences in NOV susceptibility between TopoIRA and TopoIWT overproduction were observed, the strain expressing TopoIRA more susceptible to NOV (Figure 5), which suggests that TopoIRA is less active in vivo than TopoIWT. Measurements of Sc densities in pLS1 topoisomers confirmed this point, since higher relaxation was observed in the presence of NOV when TopoIWT was overexpressed than when it was TopoIRA (Figure 5d). The main source of TopoI in the presence of NOV would be the PZntopA copy (either topAWT or topARA) given the decrease of the transcription of topAWT in its natural chromosomal location (a DOWN-regulated domain) [9]. This could provide an explanation for the increased NOV sensibility of the strain carrying the mutant allele, since the specific activity of TopoIRA is 20-fold lower than that of TopoIWT, treatment of this strain with NOV would result in a deficiency in TopoI activity, and impaired growth.
TopoIRA was more resistant to SCN in vivo (Figure 6). This was tested in strains that carried TopoI coding genes under the control of PMAL into recombinant plasmids pLS1ROM-topAWT or -topARA. These plasmids were introduced in a strain in which topA was under the control of PZn (Figure 6a). Under the growth conditions used in the experiments, the only TopoI enzyme synthesized came from the recombinant plasmids, which carry a 6×—His tail (Figure 6c), which has a lower mobility in the Western blots. The net increase in TopoI enzymes with respect to the wild-type strain R6 was of about 9-fold as detected by Western blot and of about 5-fold (TopoIWT) and 6-fold (TopoIRA) as detected by RNASeq. Sc densities of cultures overexpressing WT or RA enzymes showed significant decreases with respect to no overproduction (Figure 7a).
The role of TopoIWT and TopoIRA in global transcription was analyzed in cultures overproducing the enzymes. The analysis of the transcriptomic response to TopoIWT and TopoIRA overproduction revealed differences between the DEGs, when the increases were modest (of about 5-fold). However, in the presence of NOV, when the increases were higher (more than 10-fold), no differences in the DEGs were detected between the overproduction of the two enzymes (Figure 8 and Figure 10). The high relaxation reached with the combined effects of NOV (inhibition of gyrase activity) and TopoI overproduction (Figure 9) triggered a transcriptomic response into domains, which was more pronounced than that observed in R6 strain under the same conditions [9]. In fact, DNA relaxation was higher in the strains overproducing TopoI enzymes (−0.010 for TopoIWT and −0.006 for TopoIRA) than in those not overproducing. The high relaxation induced broader domains. This effect was observed in both TopoIWT and TopoIRA overproduction conditions. This transcriptomic pattern could be attributed to the high level of TopoI overproduction, since in R6, under the same NOV treatment, there is a decrease of topA transcription of about 23-fold. These results support the organization of the genome into topological domains, which are clearer under extreme DNA relaxation. Genes forming part of domains made up 38% in ΔtopAPZntopA (pLS1ROMtopA) in the presence of S, consistent with the 37% value in the R6 genome [9,26] under equivalent NOV treatment (10 × MIC, 30 min). These values are in accordance to the Sc density values in those strains under 10 × MIC of NOV: −0.024 (R6) and −0.023 (ΔtopAPZntopA (pLS1ROMtopA)). However, genes forming part of domains reached 52% of the genome in the presence of SM, i.e., in conditions of TopoI overproduction. These results support the essential role of TopoI in transcription, its suitability as an antibiotic target, and open the possibility to apply combination therapies with antibiotics targeting TopoI, such as SCN, and RNA polymerase inhibitors, such as rifampicin.
To summarize, this study corroborates that SCN is an inhibitor of TopoI. The topARA mutation, located at the DNA binding site in one of the SCN-interacting residues, codes for an enzyme 20-fold less active and 2-fold more resistant to SCN than TopAWT. Comparison of the in vivo activities of strains with regulated expression of topARA and topAWT showed higher SCN-resistance and lower Sc for TopoIRA. In addition, this study also reinforced the importance of TopoI in the global regulation of transcription. Transcriptome of NOV-treated cells augmented the size of the topological domains, associated to a high DNA relaxation, as estimated by super-resolution confocal microscopy.
4. Materials and Methods
4.1. Microbiological Methods and Genetic Constructions
S. pneumoniae was grown at 37 °C in a casein hydrolysate-based liquid medium (AGCH) containing 0.2% yeast extract and 0.3% sucrose [38]. To obtain topA mutants, the Phusion® Site-directed mutagenesis Kit (New England Biolabs, Boston, MA, USA) was used. Three pairs of complementary phosphorylated oligonucleotides were used to amplify the linearized plasmid pQE-topAWT-6His [12], which carries the wild-type topA with a 6His-tag at the N-terminus. The forward oligonucleotides were 5′-GCGAGTGACCCGGACGCTGAAGGAGAAGCG-3′ (to introduce the R102 (CGT) to A (GCT) change); 5′-GGAAGGTAAACTGGCTGATGTCGAAGTTGG-3′ (to introduce the D543 (GAT) to A (GCT) change); 5′-GGTAAACTGGATGATGTCGCA-3′ (to introduce the E546 (GAA) to A (GCA) change); 5′-GGTAAACTGGATGATGTCAAAGTTGGAAAAGAGCAGTGGCG-3′ (to introduce the E546 (GAA) to A (GCA) change). After amplification, plasmids were circularized by ligation. The plasmid carrying wild-type topA was transformed into E. coli M15 (pREP4), the plasmids carrying topA mutants were transformed into E. coli XL1-Blue.
Derivatives of plasmid pLS1ROM [39] carrying topA alleles were constructed as follows: fragments of 2149 Kb containing 6-HistopAWT or 6His-topARA were obtained by PCR using Pfu DNA polymerase (Promega), which renders blunt ends, using pQE-6HistopAWT and pQE-6HistopARA plasmids as templates, and using primers HisTopAUP (5′-CACACAGAATTCATTAAAGAGG) as forward and TopADown2BamHI ((5′-gcgcgcGGATCCTTATTTAATCTTTTCTTCCTC) as reverse. Restriction enzyme sites are shown underlined in all oligonucleotides. The resulting PCR products were digested with BamHI and ligated with pLS1ROM digested with SmaI and BamHI, resulting in recombinant plasmids pLS1ROMtopAWT and pLS1ROMtopARA, which were used to transform R6 competent cells. Transformants were selected by plating in AGCH-agar medium with 0.8% sucrose (to avoid overexpression of topA) containing 1 µg/mL erythromycin. pLS1ROMtopAWT and pLS1ROMtopARA plasmids were then used to transform strain ΔtopAPZntopA, constructed as previously described [10]. Transformants were selected by plating in AGCH-agar medium with 0.2% yeast extract, 0.8% sucrose, 150 µM ZnSO4, and 1 µg/mL erythromycin.
Strain R6PZntopAWT was constructed as described [10]. To construct R6PZntopARA a similar procedure was followed, except that the topARA allele was amplified from plasmid pQE-SPNtopARA.
4.2. Purification of Proteins
The pQE1 vector/E. coli M15 (pREP4) host cloning system permits the hyperproduction of proteins of genes placed under the control of a phage T5 promoter and two lac operator sequences. The host strain contains plasmid pREP4 that constitutively expresses the LacI repressor. Expression of proteins was induced by the addition of isopropyl-β-D-thiogalactoside (IPTG), which binds to the LacI protein and inactivates it. This inactivation allows the host cell’s RNA polymerase to transcribe the genes from the T5 promoter. Cultures of E. coli M15 (pREP4)/pQE-topA were grown at 37 °C in LB medium containing 250 μg/mL of ampicillin (to select pQE1) and 25 μg/mL kanamycin (to select pREP4) to DO600 = 0.6. IPTG (1 mM) was then added and incubation continued for 1 h. Cells were collected by centrifugation, lysed at 4 °C for 1 h in buffer A (Tris-HCl pH 8, 300 mM NaCl, 10 mM imidazole, 1 mM PMSF) containing lysozyme (1 mg/mL) and Triton X-100 (0.2%). They were then sonicated for 20 min (15 pulses of 20 s, with 1 min cooling between each sonication, 100% amplitude) using a Vibra cell sonicator (Sonics, Bristol, CT, USA). Debris was removed by centrifugation at 10,000× g at 4 °C for 15 min and the resulting supernatant filtered using a 0.45 µm syringe filter. TopA proteins were purified by affinity chromatography in Ni-NTA (QIAGEN) columns following manufacturer’s instructions as described previously [40]. Eluted proteins were dialyzed overnight at 4 °C against buffer B (50 mM Tris-HCl pH 8, 300 mM NaCl, 1 mM DTT).
4.3. Western Blot Assays
Assays were performed as described previously [10]. Briefly, whole cell lysates (~5 × 10⁵ cells) were obtained by centrifugation of 10 mL of culture (OD620nm = 0.4), suspended in 400 µL of phosphate buffered saline, and sonicated. Proteins from lysates (~2 × 10⁴ cells) were separated on polyacrylamide gels, transferred to 0.2 µm PVDF membranes, and incubated with anti-TopoI (diluted 1:500), anti-GyrA (diluted 1:2000) [24], anti-GyrB (diluted 1:2000), and anti-RpoB [32] (diluted 1:500). Molecular masses of RpoB, GyrA, GyrB and TopoI are 134.34 kDa, 92.04 kDa, 72.26 kDa, and 79.38 kDa, respectively. Determinations were performed in triplicate.
4.4. Analysis of the Topology of Plasmids
Assays were performed as described previously [10]. Plasmid DNA topoisomers were analyzed in neutral/neutral two-dimensional agarose gels. The first dimension was run at 1.5 V/cm in a 0.4% agarose (Seakem-Lonza, Basel, Switzerland) gel in 1 × Tris-borate-EDTA (TBE) buffer for 20 h at room temperature. The second dimension was run at 7.5 V/cm in 1% agarose gel in 1 × TBE buffer for 9 h at 4 °C for pLS1 plasmid and at 5 V/cm in 0.5% agarose gel for 18 h at 4 °C for pLS1ROM plasmid. Chloroquine (Sigma-Aldrich-Merck, Madrid, Spain) was added to the TBE buffer in both, the agarose and the running buffer. Gels were stained with 0.5 µg/mL ethidium bromide. Images were captured in a ChemiDoc Imaging System and analyzed with the Image Lab software (BioRad, Hercules, CA, USA).
The DNA linking number (Lk = Tw + Wr) was estimated by quantifying the amount of every topoisomer. The DNA supercoiling density (σ) was calculated using the equation σ = ΔLk/Lk0. Changes in the linking number (ΔLk) were determined using the equation Lk = Lk–Lk0, in which Lk0 = N/10.5, N is the length of the DNA strand in bp, and 10.5 the number of bp per complete turn in B-DNA. To simplify, σ = Lk of the the most abundant topoisomer/(N/10.5). The most abundant topoisomer was identified by densitometry and its Lk was calculated considering that the topoisomer that migrates with ΔLk = 0 in the second dimension has ΔWr = −14 (pLS1), −21 (pLS1ROM) or −27 (pLS1ROMtopA derivatives), given the positive supercoils introduced by 2µg/mL chloroquine.
4.5. Relaxation of pBR322 by TopoI
Relaxation reactions of pBR322 by TopoI were carried out exactly as described previously [12]. Reactions of 200 µL contained 0.5 µg of CCC pBR322 in 20 mM Tris-HCl pH 8, 100 mM KCl, 10 mM MgCl2, 1 mM DTT, 50 µg BSA/mL and TopoI at the indicated concentrations. Incubation with TopoI was at 37 °C during 1 h and reaction was terminated by 2 min incubation at 37 °C with 50 mM EDTA. Treatment with SCN was performed by preincubation of TopoI during 10 min at 4 °C in a final volume of 15 µL. Then, an additional incubation of 1 h at 37 °C with 1% SDS, 100 µg/mL proteinase K was performed. Reaction products were precipitated with ethanol, suspended in electrophoresis loading buffer and analyzed in 1% agarose gels run at 18 V for 18 h. DNA quantification of agarose gels was done by scanning densitometry after electrophoresis and ethidium bromide staining. Quantification of TopoI activity was calculated by gel densitometry using the Image Lab program (Bio-Rad laboratories, Hercules, CA, USA). To calculate activity, the OC and CCC forms amount was determined and divided by the total amount of DNA in each well. IC50 (mean of at least three independent determinations) was defined as the concentration of drug required for a 50% reduction of enzymatic activity.
4.6. RNA Extraction and RNA Library Preparation for RNA-Seq
Total RNA from 10 mL of cultures (2 to 4 × 10⁸ cells) was obtained using the RNeasy mini kit (Quiagen, Hilden, Germany). A total of 1 µg of RNA was used for library construction. The Illumina Stranded Total RNA Prep Ligation with Ribo-Zero Plus kit (San Diego, CA, USA) was used, according to the manufacturer’s instructions. RNA was processed to enzymatically remove ribosomal RNA. Briefly, depleted RNA was fragmented and denatured, and cDNA was synthetized. After adenylating 3′ ends and ligating pre-index anchors, anchor-ligated DNA fragments were enriched by 12 cycles of PCR and dual indexes were added to the library. Library quality control was assessed using a 2100 Bioanalyzer Instrument (Agilent, Santa Clara, CA, USA). NovaSeq 6000 Sequencing System was used to sequence the library.
4.7. RNA Seq Data Analysis
Analysis of RNA-Seq data was carried out using the Web-based platform Galaxy. Quality of raw sequence data was analysed with the FASQC tool. Sequencing reads were mapped against the S. pneumoniae R6 genome (ASM704v1) using BWA software package (Galaxy version 0.7.17.4) in simple Illumina mode. The number of reads overlapping each coding gene was obtained using program feature Count. Count tables were used as input in DESeq2 for the analysis of differential expression. A threshold p-value-adjusted of 0.01 was considered.
4.8. Nucleoid Staining and Confocal Microscopy
We followed our previously described procedure [10], except that nucleoids were stained with 2.5 µM Sytox Green Thermo Fisher (Waltham, MA, USA) instead Sytox™ Orange. Strains were grown to mid-log growth phase, samples (from 5 × 10⁷ to 2 × 10⁸ cells) were collected and about 6 × 10⁵ cells were suspended in buffered salt solution (10 mM Tris, pH 7.6; 137 mM NaCl; 5.4 mM KCl) and stained. Slides were observed using a confocal microscope STELLARIS 8 –FALCON/STED (Leica Microsystems, Wetzlar, Germany) with a HC PL APO 100 ×/1.40 NA × OIL immersion objective. Super resolution images were acquired by Stimulated Emission Depletion (STED) microscopy using 660 nm depletion laser. Image J software was used to analyse the images. Image analysis was performed with Cell profiler v4.2.1 with a customized pipeline to define DNA condensed/relaxed areas per cell. Analysis script first identify the full bacteria then, filters all incomplete or out of focus ones (area 0.125–1.375 µ2 and eccentricity below 0.75), condensed DNA was detected using size (below 0.125 µ2) and intensity contrast. More than 1800 cells were quantified per sample, relaxed DNA was segmented by subtracting condensed area to total positive region. Ratio of condensed versus relaxed was calculated and graphed using Microsoft Excel software.
Supplementary Materials
The following supporting information can be downloaded at: https://www.mdpi.com/article/10.3390/ijms242115800/s1.
Author Contributions
Conceptualization, A.G.d.l.C., M.-J.F. and P.H.; methodology, D.M., M.G.-L. and M.-J.F.; software, P.H.; formal analysis, A.G.d.l.C., M.-J.F., D.M. and P.H.; data curation, P.H.; writing—original draft preparation, A.G.d.l.C.; writing—review and editing M.-J.F. and P.H.; supervision, A.G.d.l.C., M.-J.F. and P.H.; project administration, A.G.d.l.C.; funding acquisition, A.G.d.l.C. All authors have read and agreed to the published version of the manuscript.
Funding
This research and the APC were funded by project PID2021-124738OB-100 to AGC, financed by MCIN/AEI/10.13039/501100011033/FEDER, UE. M.G.-L. is the beholder of a PhD Contract from Instituto de Salud Carlos III.
Data Availability Statement
The data discussed in this publication have been deposited in NCBI’s Gene Expression Omnibus and are accessible through GEO Series accession number GSE243041 (https://www.ncbi.nlm.nih.gov/geo/query/acc.cgi?acc=GSE243041, accessed on 26 October 2013). The following secure token has been created to allow review of record GSE243041 while it remains in private status: ibazowcanhqjvsz.
Acknowledgments
We thank María Teresa García for performing site-directed mutagenesis of topA. We thank Miguel Hernández-González (The Francis Crick Institute, London) and Pedro A. Lazo-Zbikowski (Instituto de Biologia Molecular y Celular del Cáncer, CSIC, Salamanca, Spain) for critical reading and editing.
Conflicts of Interest
The authors declare no conflict of interest.
References
- Word Health Organization. Pneumococcal conjugate vaccine for childhood immunization-WHO position paper. Wkly. Epidemiol. Rec. 2007, 82, 93–104. [Google Scholar]
- Jacobs, M.R.; Felmingham, D.; Appelbaum, P.C.; Grüneberg, R.N.; The Alexander Project Group. The Alexandre Project 1998-200: Susceptibility of pathogens isolated from community-acquired respiratory tract infection to commomnly used antimicrobial agents. J. Antimicrob. Chemother. 2003, 52, 229–246. [Google Scholar] [CrossRef]
- Mandell, L.A.; Wunderink, R.G.; Anzueto, A.; Bartlett, J.G.; Campbell, G.D.; Dean, N.C.; Dowell, S.F.; File, T.M., Jr.; Musher, D.M.; Niederman, M.S.; et al. Infectious Diseases Society of America/American Thoracic Society consensus guidelines on the management of community-acquired pneumonia in adults. Clin. Infect. Dis. 2007, 44, S27–S72. [Google Scholar] [CrossRef]
- Ardanuy, C.; de la Campa, A.G.; García, E.; Fenoll, A.; Calatayud, L.; Cercenado, E.; Perez-Trallero, E.; Bouza, E.; Liñares, J. Spread of Streptococcus pneumoniae serotype 8-ST63 multidrug-resistant recombinant Clone, Spain. Emerg. Infect. Dis. 2014, 20, 1848–1856. [Google Scholar] [CrossRef]
- Balsalobre, L.; Ferrándiz, M.J.; Liñares, J.; Tubau, F.; de la Campa, A.G. Viridans group streptococci are donors in horizontal transfer of topoisomerase IV genes to Streptococcus pneumoniae. Antimicrob. Agents Chemother. 2003, 47, 2072–2081. [Google Scholar] [CrossRef]
- de la Campa, A.G.; Ardanuy, C.; Balsalobre, L.; Pérez-Trallero, E.; Marimón, J.M.; Fenoll, A.; Liñares, J. Changes in fluoroquinolone-resistant Streptococcus pneumoniae after 7-valent conjugate vaccination, Spain. Emerg. Infect. Dis. 2009, 15, 905–911. [Google Scholar] [CrossRef]
- Alvarado, M.; Martín-Galiano, A.J.; Ferrándiz, M.J.; Zaballos, A.; de la Campa, A.G. Upregulation of the PatAB transporter confers fluoroquinolone resistance to Streptococcus pseudopneumoniae. Front. Microbiol. 2017, 8, 2074. [Google Scholar] [CrossRef]
- Amblar, M.; Zaballos, A.; de la Campa, A.G. Role of PatAB transporter in efflux of levofloxacin in Streptococcus pneumoniae. Antibiotics 2022, 11, 1837. [Google Scholar] [CrossRef]
- Ferrándiz, M.J.; Martín-Galiano, A.J.; Schvartzman, J.B.; de la Campa, A.G. The genome of Streptococcus pneumoniae is organized in topology-reacting gene clusters. Nucleic Acids Res. 2010, 38, 3570–3581. [Google Scholar] [CrossRef]
- García-López, M.; Megias, D.; Ferrándiz, M.J.; de la Campa, A.G. The balance between gyrase and topoisomerase I activities determines levels of supercoiling, nucleoid compaction, and viability in bacteria. Front. Microbiol. 2023, 13, 1094692. [Google Scholar] [CrossRef]
- Tse-Dinh, Y.C. Bacterial topoisomerase I as a target for discovery of antibacterial compounds. Nucleic Acids Res. 2009, 37, 731–737. [Google Scholar] [CrossRef]
- García, M.T.; Blázquez, M.A.; Ferrándiz, M.J.; Sanz, M.J.; Silva-Martín, N.; Hermoso, J.A.; de la Campa, A.G. New alkaloid antibiotics that target the DNA topoisomerase I of Streptococcus pneumoniae. J. Biol. Chem. 2011, 286, 6402–6413. [Google Scholar] [CrossRef]
- Valenzuela, M.V.; Domenech, M.; Mateos-Martínez, P.; González-Camacho, F.; de la Campa, A.G.; García, M.T. Antibacterial activity of a DNA topoisomerase I inhibitor versus fluoroquinolones in Streptococcus pneumoniae. PLoS ONE 2020, 15, e0241780. [Google Scholar] [CrossRef]
- García, M.T.; Carreño, D.; Tirado-Vélez, J.M.; Ferrándiz, M.J.; Rodrigues, L.; Gracia, B.; Amblar, M.; Ainsa, J.A.; de la Campa, A.G. Boldine-derived alkaloids inhibit the activity of DNA topoisomerase I and growth of Mycobacterium tuberculosis. Front. Microbiol. 2018, 9, 1659. [Google Scholar] [CrossRef]
- Tirado-Vélez, J.M.; Carreño, D.; Sevillano, D.; Alou, L.; Yuste, J.; de la Campa, A.G. Seconeolitsine, the novel inhibitor of DNA topoisomerase I, protects against invasive pneumococcal disease caused by fluoroquinolone-resistant strains. Antibiotics 2021, 10, 573. [Google Scholar] [CrossRef]
- Tse-Dinh, Y.-C. Regulation of the Escherichia coli DNA topoisomerase I gene by DNA supercoiling. Nucleic Acids Res. 1985, 13, 4751–4763. [Google Scholar] [CrossRef]
- Menzel, R.; Gellert, M. Regulation of the genes for E. coli DNA gyrase: Homeostatic control of DNA supercoiling. Cell 1983, 34, 105–113. [Google Scholar] [CrossRef]
- Menzel, R.; Gellert, M. Modulation of transcription by DNA supercoiling: A deletion analysis of the Escherichia coli gyrA and gyrB promoters. Proc. Natl. Acad. Sci. USA 1987, 84, 4185–4189. [Google Scholar] [CrossRef]
- Vora, T.; Hottes, A.K.; Tavazoie, S. Protein occupancy landscape of a bacterial genome. Mol. Cell 2009, 35, 247–253. [Google Scholar] [CrossRef]
- Travers, A.; Muskhelishvili, G. DNA supercoiling—A global transcriptional regulator for enterobacterial growth? Nat. Rev. Microbiol. 2005, 3, 157–169. [Google Scholar] [CrossRef]
- Ferrándiz, M.J.; Carreño, D.; Ayora, S.; de la Campa, A.G. HU of Streptococcus pneumoniae is essential for the preservation of DNA supercoiling. Front. Microbiol. 2018, 9, 493. [Google Scholar] [CrossRef] [PubMed]
- Minnen, A.; Attaiech, L.; Thon, M.; Gruber, S.; Veening, J.-W. SMC is recruited to oriC by ParB and promotes chromosome segregation in Streptococcus pneumoniae. Mol. Microbiol. 2011, 81, 676–688. [Google Scholar] [CrossRef] [PubMed]
- de Vasconcelos Junior, A.A.; Tirado-Vélez, J.M.; Martín-Galiano, A.J.; Megias, D.; Ferrándiz, M.J.; Hernández, P.; Amblar, M.; de la Campa, A.G. StaR is a positive regulator of topoisomerase I activity involved in supercoiling maintenance in Streptococcus pneumoniae. Int. J. Mol. Sci. 2023, 24, 5973. [Google Scholar] [CrossRef] [PubMed]
- Ferrándiz, M.J.; Martín-Galiano, A.J.; Arnanz, C.; Camacho-Sogüero, I.; Tirado-Vélez, J.M.; de la Campa, A.G. An increase in negative supercoiling in bacteria reveals topology-reacting gene clusters and a homeostatic response mediated by the DNA topoisomerase I gene. Nucleic Acids Res. 2016, 44, 7292–72303. [Google Scholar] [CrossRef] [PubMed]
- Martín-Galiano, A.J.; Ferrándiz, M.J.; de la Campa, A.G. Bridging chromosomal architecture and pathophysiology of Streptococcus pneumoniae. Genome Biol. Evol. 2017, 9, 350–361. [Google Scholar] [CrossRef]
- Ferrándiz, M.J.; Arnanz, C.; Martín-Galiano, A.J.; Rodríguez-Martín, C.; de la Campa, A.G. Role of global and local topology in the regulation of gene expression in Streptococcus pneumoniae. PLoS ONE 2014, 9, e101574. [Google Scholar] [CrossRef]
- Liu, L.F.; Wang, J.C. Supercoiling of the DNA template during transcription. Proc. Natl. Acad. Sci. USA 1987, 84, 7024–7027. [Google Scholar] [CrossRef]
- Drolet, M.B.; Bi, X.; Liu, L.F. Hypernegative supercoiling of the DNA template during transcription elongation in vitro. J. Biol. Chem. 1994, 269, 2068–2674. [Google Scholar] [CrossRef]
- Phoenix, P.; Raymond, M.A.; Massé, E.; Drolet, M. Roles of DNA topoisomerases in the regulation of R-loop formation in vitro. J. Biol. Chem. 1997, 272, 1473–1479. [Google Scholar] [CrossRef]
- Massé, E.; Phoenix, P.; Drolet, M. DNA topoisomerases regulate R-loop formation during transcription of the rrnb operon in Escherichia coli. J. Biol. Chem. 1997, 272, 12816–12823. [Google Scholar] [CrossRef]
- Cheng, B.; Zhu, C.-X.; Ji, C.; Ahumada, A.; Tse-Dinh, Y.-C. Direct interaction between Escherichia coli RNA polymerase and the zinc ribbon domains of DNA topoisomerase I. J. Biol. Chem. 2003, 278, 30705–30710. [Google Scholar] [CrossRef] [PubMed]
- Ferrándiz, M.J.; Hernández, P.; de la Campa, A.G. Genome-wide proximity between RNA polymerase and DNA topoisomerase I supports transcription in Streptococcus pneumoniae. PLoS Genet. 2021, 17, e1009542. [Google Scholar] [CrossRef] [PubMed]
- Ahmed, W.; Sala, C.; Hegde, S.R.; Jha, R.K.; Cole, S.T.; Nagaraja, V. Transcription facilitated genome-wide recruitment of topoisomerase I and DNA gyrase. PLoS Genet. 2017, 13, e1006754. [Google Scholar] [CrossRef] [PubMed]
- Martín-Galiano, A.J.; de la Campa, A.G. High-efficiency generation of antibiotic-resistant strains of Streptococcus pneumoniae by PCR and transformation. Antimicrob. Agents Chemother. 2003, 47, 1257–1261. [Google Scholar] [CrossRef] [PubMed][Green Version]
- de la Campa, A.G.; Ferrándiz, M.J.; Martín-Galiano, A.J.; García, M.T.; Tirado-Vélez, J.M. The transcriptome of Streptococcus pneumoniae induced by local and global changes in supercoiling. Front. Microbiol. 2017, 8, 1447. [Google Scholar] [CrossRef]
- Bachar, A.; Itzhaki, E.; Gleizer, S.; Shamshoom, M.; Milo, R.; Antonovsky, N. Point mutations in topoisomerase I alter the mutation spectrum in E. coli and impact the emergence of drug resistance genotypes. Nucleic Acids Res. 2020, 48, 761–769. [Google Scholar] [CrossRef]
- Stupina, V.A.; Wang, J.C. Viability of Escherichia coli topA mutants lacking DNA topoisomerase I. J. Biol. Chem. 2005, 280, 355–360. [Google Scholar] [CrossRef]
- Lacks, S.A.; López, P.; Greenberg, B.; Espinosa, M. Identification and analysis of genes for tetracycline resistance and replication functions in thr broad-host-range plasmid pLS1. J. Mol. Biol. 1986, 192, 753–765. [Google Scholar] [CrossRef]
- Ruiz-Masó, J.A.; López-Aguilar, C.; Nieto, C.; Sanz, M.; Buron, P.; Espinosa, M.; del Solar, G. Construction of a plasmid vector based on the pMV158 replicon for cloning and inducible gene expression in Streptococcus pneumoniae. Plasmid 2012, 67, 53–59. [Google Scholar] [CrossRef]
- Balsalobre, L.; Ferrándiz, M.J.; de Alba, G.; de la Campa, A.G. Nonoptimal DNA topoisomerases allow maintenance of supercoiling levels and improve fitness of Streptococcus pneumoniae. Antimicrob. Agents Chemother. 2011, 55, 1097–1105. [Google Scholar] [CrossRef]
Disclaimer/Publisher’s Note: The statements, opinions and data contained in all publications are solely those of the individual author(s) and contributor(s) and not of MDPI and/or the editor(s). MDPI and/or the editor(s) disclaim responsibility for any injury to people or property resulting from any ideas, methods, instructions or products referred to in the content. |
© 2023 by the authors. Licensee MDPI, Basel, Switzerland. This article is an open access article distributed under the terms and conditions of the Creative Commons Attribution (CC BY) license (https://creativecommons.org/licenses/by/4.0/).