Abstract
Bacterial surface proteins assembled into amyloids contribute to biofilm formation and host immune evasion. Streptococcus sanguinis, a pioneer colonizer of teeth commonly involved in cardiovascular infections, expresses about thirty-three proteins anchored to the cell wall by sortase A. Here, we characterized the production of amyloid in S. sanguinis strains differing in biofilm and immune evasion phenotypes and investigated the role of sortase A in amyloidogenesis. Amyloid was identified in biofilms formed by nine strains, using Congo red (CR) staining and cross-polarized light microscopy. Additionally, EGCG, an amyloid inhibitor, impaired biofilm maturation in a strain-specific fashion. The amounts of amyloid-like components quantified in culture fluids of nine strains using thioflavin T and fluorimetry negatively correlated with bacterial binding to complement-activating proteins (SAP, C1q), C3b deposition and rates of opsonophagocytosis in PMNs, implying amyloid production in immune evasion. The deletion of the sortase A gene (srtA) in strain SK36 compromised amyloid production and sucrose-independent biofilm maturation. The srtA mutant further showed increased susceptibility to C3b deposition and altered interactions with PMNs as well as reduced persistence in human blood. These findings highlight the contribution of amyloids to biofilm formation and host immune evasion in S. sanguinis strains, further indicating the participation of sortase A substrates in amyloidogenesis.
1. Introduction
Streptococcus sanguinis is a pioneer commensal colonizer of tooth surfaces of humans, which promotes the homeostasis of dental biofilms by inhibiting the colonization by oral pathogens, such as Streptococcus mutans and Porphyromonas gingivalis [1,2]. On the other hand, S. sanguinis is commonly involved in infective endocarditis (IE) in susceptible hosts, and eventually, in immunocompetent young adults [3,4,5,6]. This species is also frequently detected in atheromatous plaques, further indicating a particular capacity to promote cardiovascular infections [6]. As compared to other streptococci of the oral cavity and oropharynx, the S. sanguinis genome harbors a remarkable number of cell surface proteins [7]. These include thirty-three proteins with an LPxTG motif recognized by sortase transpeptidases, which anchors target precursor proteins to the peptideoglycan [7,8]. When compared to other commensal streptococci, S. sanguinis further shows increased capacity to evade immune components abundant in whole saliva and in gingival crevicular fluid, which include proteins of the complement system, a major defense arm of the cardiovascular system [9,10]. The large number of cell surface proteins expressed by S. sanguinis might underlie its increased competitiveness for colonizing the dental pellicle (formed mostly by salivary and host tissue components) [11] as well as extra-oral tissues. However, the molecular mechanisms involved in S. sanguinis contribution to initial and maturing phases of biofilm formation in dental surfaces and/or cardiovascular tissues must still be better understood.
Streptococcus sanguinis ability to produce H2O2 under O2 availability contributes to the initial phases of biofilm formation, because H2O2 inhibits competitor species, e.g., the caries pathogen Streptococcus mutans [12,13], further promoting the lytic-independent production of extracellular DNA (eDNA) [14], which is required for biofilm initiation [15]. Under sucrose availability, S. sanguinis also synthesizes glucan, but these exopolysaccharides do not confer sufficient strength to biofilms at maturing phases, due to their reduced stability when compared to glucan produced by S. mutans [12,15,16]. Binding to sucrose-derived glucan is, on the other hand, significantly associated with S. sanguinis evasion to complement deposition in a strain-specific fashion [17], linking glucan-binding to S. sanguinis capacity to evade host immune functions. However, whether S. sanguinis strains produce additional extracellular components involved in glucan interaction, biofilm formation and/or host immune evasion remains to be addressed.
Multiple eukaryotic and microbial proteins may be self-assembled into amyloid fibrils under certain conditions. Although in humans, different types of amyloid fibrils are associated with diseases [18], amyloid formation is currently recognized as a common physiological process in eukaryotic and prokaryotic organisms; thus, the term “functional amyloid” was assigned [19]. Generally, these protein-derived exopolymers are formed of layers of repetitive cross β-sheet organized perpendicularly to the axis of the maturing fibril, a conformation responsible for unique traits of amyloid fibrils regardless of the type of the protein sub-unit. These include proteolytic resistance and affinity to thioflavin T (ThT) and to Congo red (CR) dyes [20,21,22]. Importantly, functional amyloids produced by microorganisms have functions in the adhesion to and invasion of host tissues, in biofilm maturation, in binding to exopolysaccharides, and in the evasion of the host immune system [20,21,22]. In this study, we investigated the production of functional amyloid by S. sanguinis strains and explored its roles in biofilm formation and in evasion to complement-mediated immunity. In addition, by analyzing an isogenic mutant of the sortase A gene (srtA), we addressed the potential roles of cell wall anchored proteins in amyloid production and related phenotypes of biofilm formation and virulence.
2. Results
2.1. Streptococcus sanguinis Strains Produce Amyloid Fibrils in Biofilms
Amyloid fibrils are produced by S. mutans strains and seems to contribute to biofilm structure [23,24,25]. Thus, we assessed the presence of amyloid fibrils in biofilms formed on 24-well plates in chemically defined medium (CDM) supplemented or not supplemented with 1% sucrose in three S. sanguinis strains (SK36, SK49 and SK353), which were previously shown to have different biofilm phenotypes [17]. Because functional amyloids are typically resistant to proteases [26], biofilms analyzed were previously treated or not treated with proteinase K. For reference, the production of amyloid fibrils was also assessed in the S. mutans strains UA159 and OMZ175, which were previously shown to form amyloids in similar assays [25,27]. As shown in Figure 1, 72 h biofilms formed by all the three S. sanguinis strains showed typical proteinase K-resistant fibrous aggregates of approximately 10 µm in width, as detected by CR-staining and polarized light microscopy. In addition, although the biofilms formed in 1% sucrose CDM showed increased biomass when compared to biofilms formed in CDM, we were notable to detect differences either in the presence or amounts of amyloid fibrils between biofilms formed in the presence or absence of sucrose. As expected, fibril birefringence was not detected when samples were analyzed under bright field microscopy. Similar amyloid fibrils were also detected in biofilms formed by the S. mutans control strains UA159 and OMZ157. Therefore, mature biofilms of S. sanguinis strains produce protease-resistant amyloid-like fibrils, regardless of the presence of glucan synthesized from sucrose.
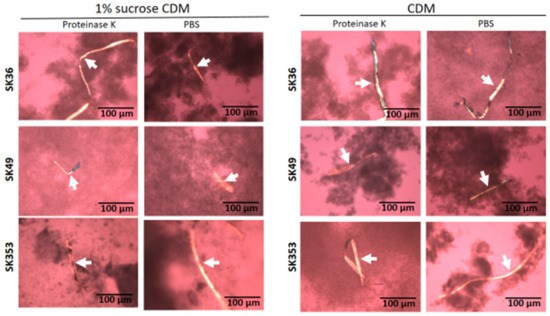
Figure 1.
Detection of amyloid fibrils in S. sanguinis biofilms. Biofilms were formed by strains SK36, SK49 and SK353 in CDM with or without 1% sucrose over 72 h. After treatment with proteinase K or PBS (control), the biofilms were stained with CR and analyzed under cross-polarized light microscopy. Digital images of apple-green amyloid fibrils (arrows) were obtained using bright field microscopy and under a cross-polarized filter with the help of a coupled digital camera, Leica DMLP (200× total magnification). Strain identities are indicated to the left of the horizontal panels.
2.2. Streptococcus sanguinis Strains Produce Amyloid-like Components in Culture Fluids and in Macrocolonies
We next applied a fluorimetric assay to quantify amyloid-like components in samples of concentrated supernatants (1 µg/mL of protein) prepared from CDM cultures of nine S. sanguinis strains. As shown in Figure 2A, the culture supernatant samples of all the strains analyzed showed amyloid-like components emitting fluorescence in the presence of ThT. There was, however, significant diversity in the amounts of these components among strains, and particular strains (SK353 and SK678) produced reduced levels of amyloid-like components (Figure 2A). Because there is no streptococcal strain known to be devoid of amyloid production, which could be used under the same culture conditions, we used BSA (1 µg/mL) as negative controls in these quantitative assays. Amyloid production was further investigated in macrocolonies formed in BHI agar supplemented with CR (CR-BHI). As shown in Figure 2B, macrocolonies formed on CR-BHI agar by all the S. sanguinis strains sequestered CR from media, as observed via the formation of dark red edges. The two S. mutans reference strains (UA159 and OMZ175) formed darker macrocolonies when compared to S. sanguinis strains (Figure 2B). Thus, S. sanguinis produces amyloid-like components that bind to ThT and to CR, but there is diversity among strains regarding the amounts of these components in culture fluids.
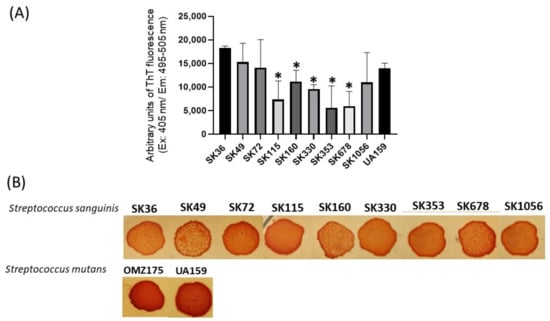
Figure 2.
Profiles of amyloid-like components produced by S. sanguinis strains. (A) Samples of concentrated culture supernatants were incubated (4 °C; 48 h) for amyloid formation, and ThT was added to measure fluorescent intensities in a GloMax®® Discover System (AFC filter; excitation: 405 nm; emission: 495–505 nm). Data were expressed as arbitrary units of ThT fluorescence. Columns indicate the mean of data obtained in three independent cultures; bars indicate standard deviation. Asterisks indicate significant difference in relation to the SK36 strain (Mann–Whitney U-test; p < 0.01). (B) CR-binding phenotypes of macrocolonies grown within 72 h on BHI agar supplemented with CR. Digital images of the macrocolonies were obtained under bright light. The S. mutans strains UA159 and OMZ175 were used as reference.
2.3. EGCG Inhibits Biofilm Formation by S. sanguinis at Specific Concentrations
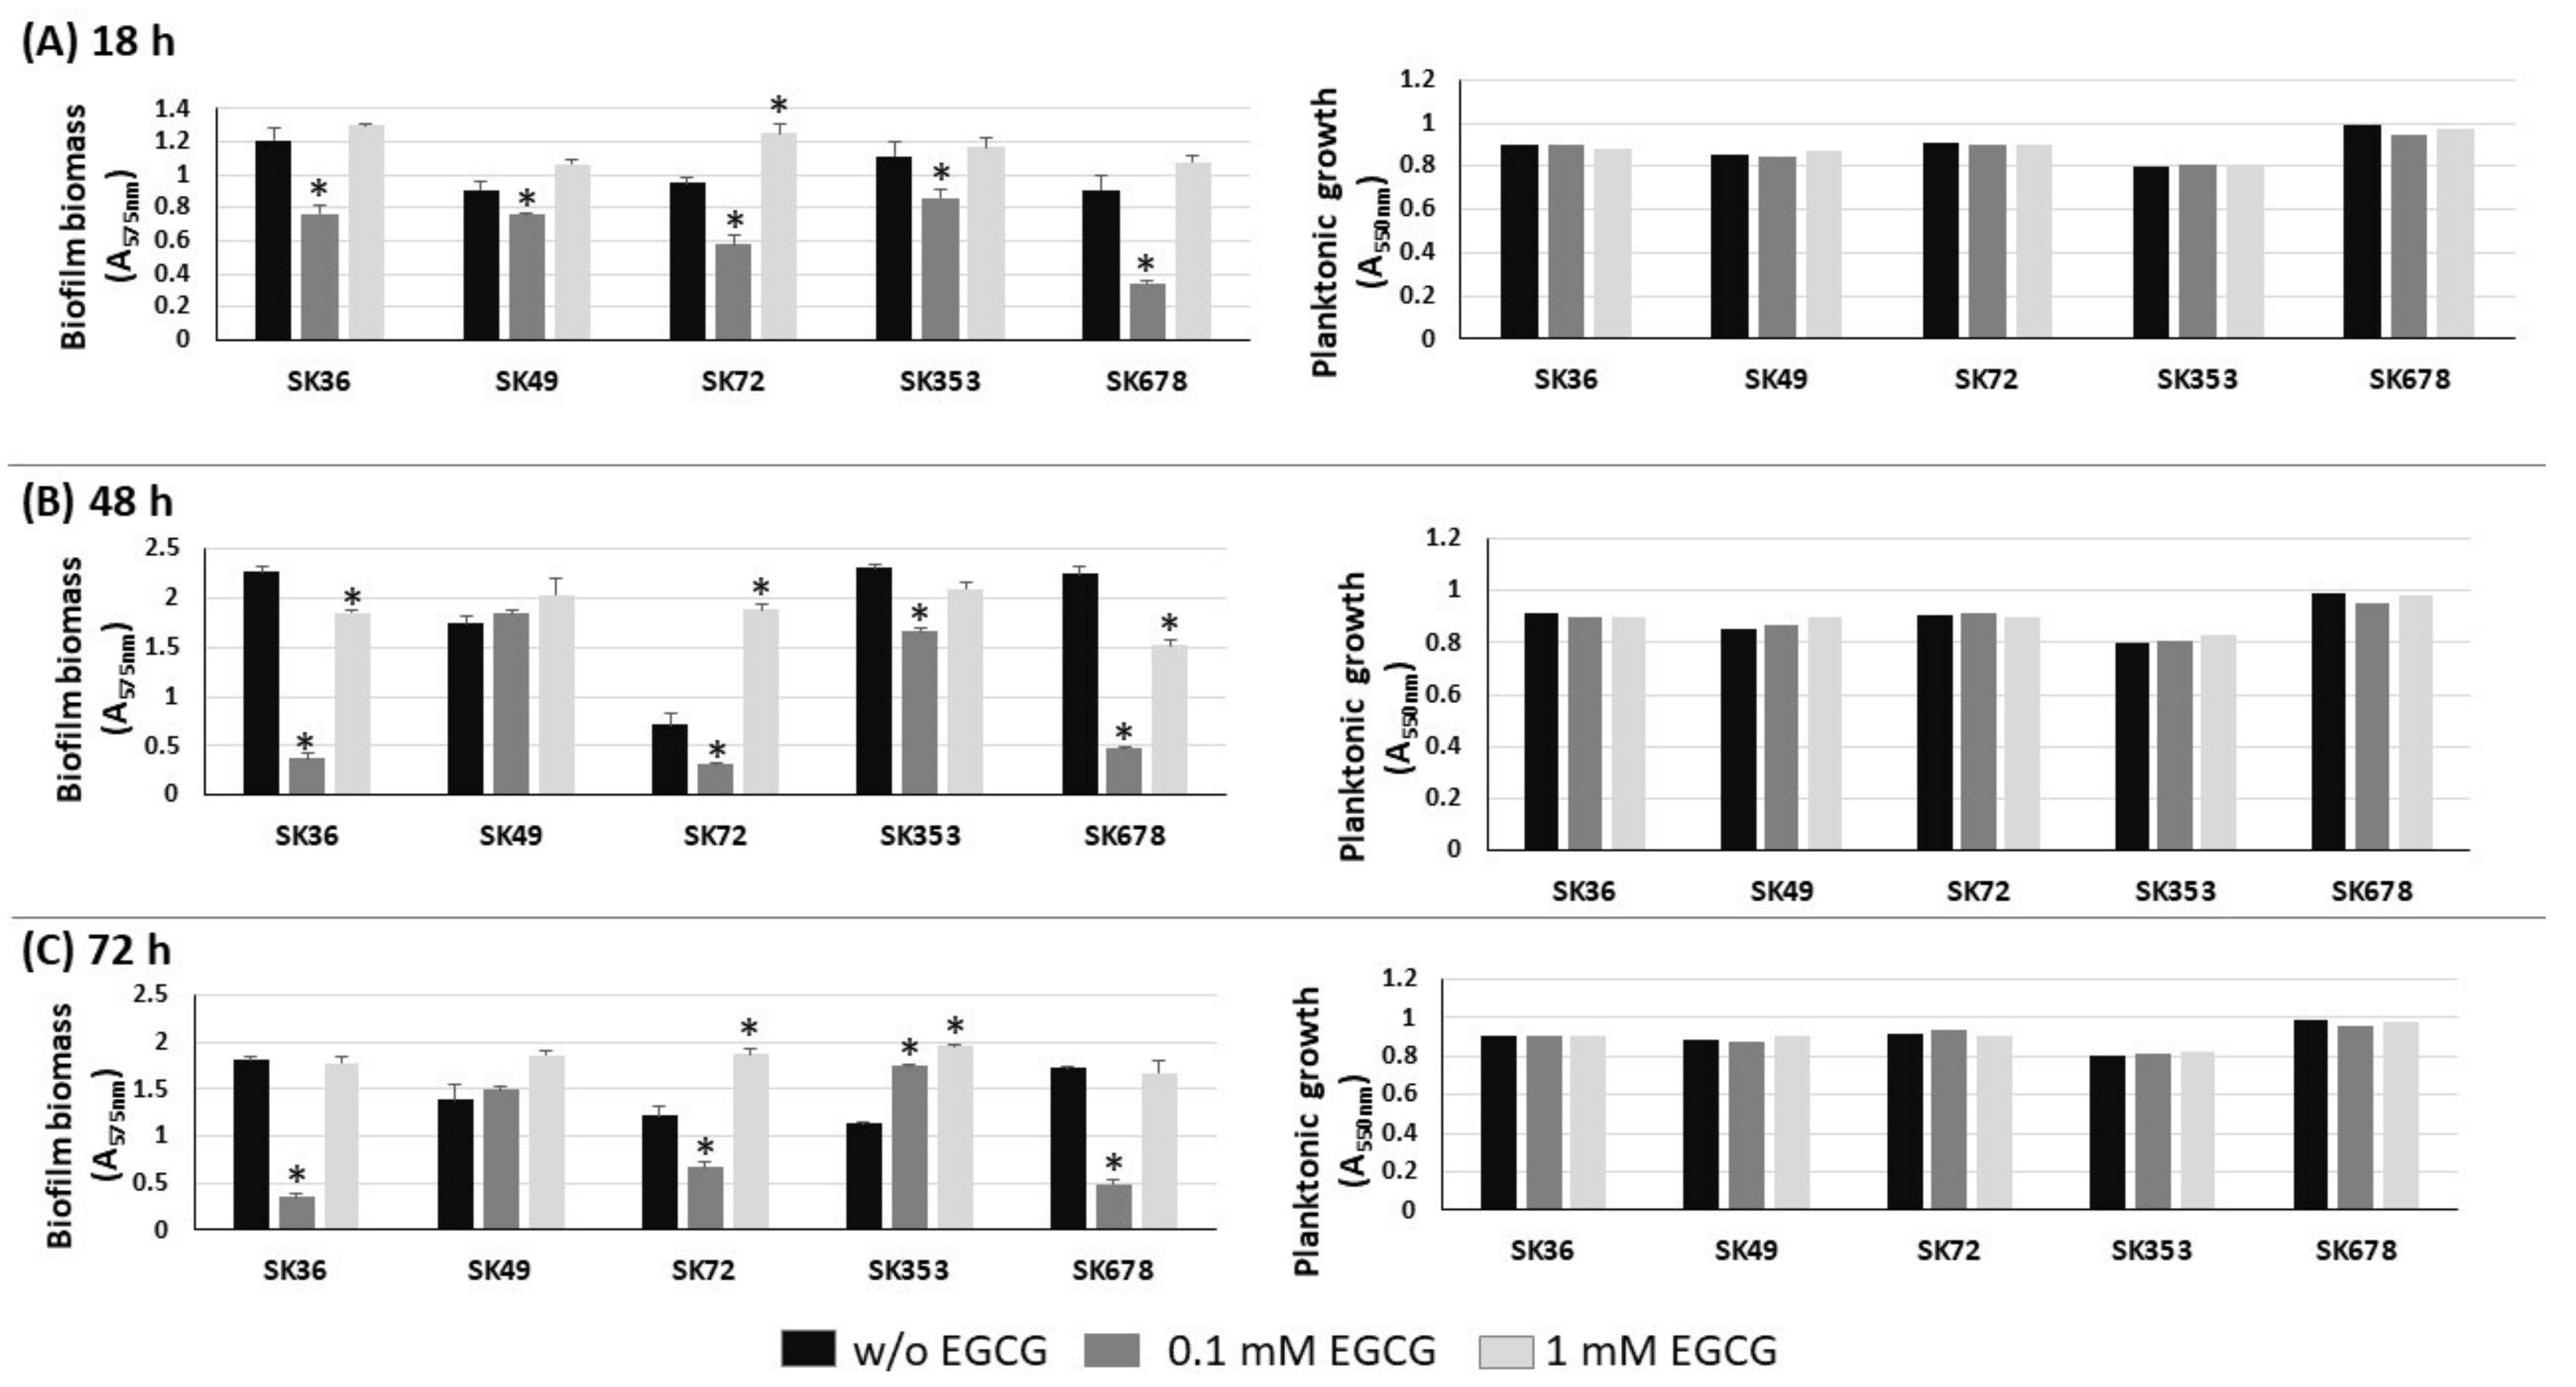
Biofilm formation by S. mutans strains is significantly inhibited by EGCG, an inhibitor of amyloid production [23,28]. Therefore, we investigated the influence of EGCG on biofilm phenotypes of nine S. sanguinis strains after 18, 48 and 72 h of incubation in 1% sucrose BHI supplemented or not with EGCG. As shown in Figure 3, medium supplementation with 0.1 mM EGCG significantly inhibited biofilm formation in most strains at all the stages of biofilm maturation (18 to 72 h of growth), except for strain SK49. On the other hand, at a 10-fold higher concentration (1 mM), EGCG did not affect biofilm formation. Importantly, medium supplementation with EGCG at either 0.1 or 1 mM did not affect the planktonic growth of the strains (Figure 3, right panels). Strains did not grow in CDM supplemented with EGCG, precluding the analysis of EGCG on biofilm formation in this culture medium. Thus, EGCG significantly inhibits biofilm maturation in most S. sanguinis strains when at a specific concentration range in a complex BHI medium.

Figure 3.
Effects of EGCG on biofilm formation by S. sanguinis strains. Biofilms were formed on 96-well plates in BHI 1% sucrose supplemented or not with EGCG for 18 (A), 48 (B) and 72 h (C) (at 37 °C; 10% CO2). The absorbances of the ethanol eluates of biofilms previously stained with crystal violet were expressed as indirect measures of biofilm biomass. Planktonic growth of the same cultures monitored at the same incubation periods (respective right panels in A–C). Columns represent means of triplicates of one representative experiment; bars indicate standard deviations. Asterisk indicates statistically significant differences in relation to the same strain grown in medium without EGCG (Kruskal–Wallis with Dunn’s post hoc test; p < 0.05).
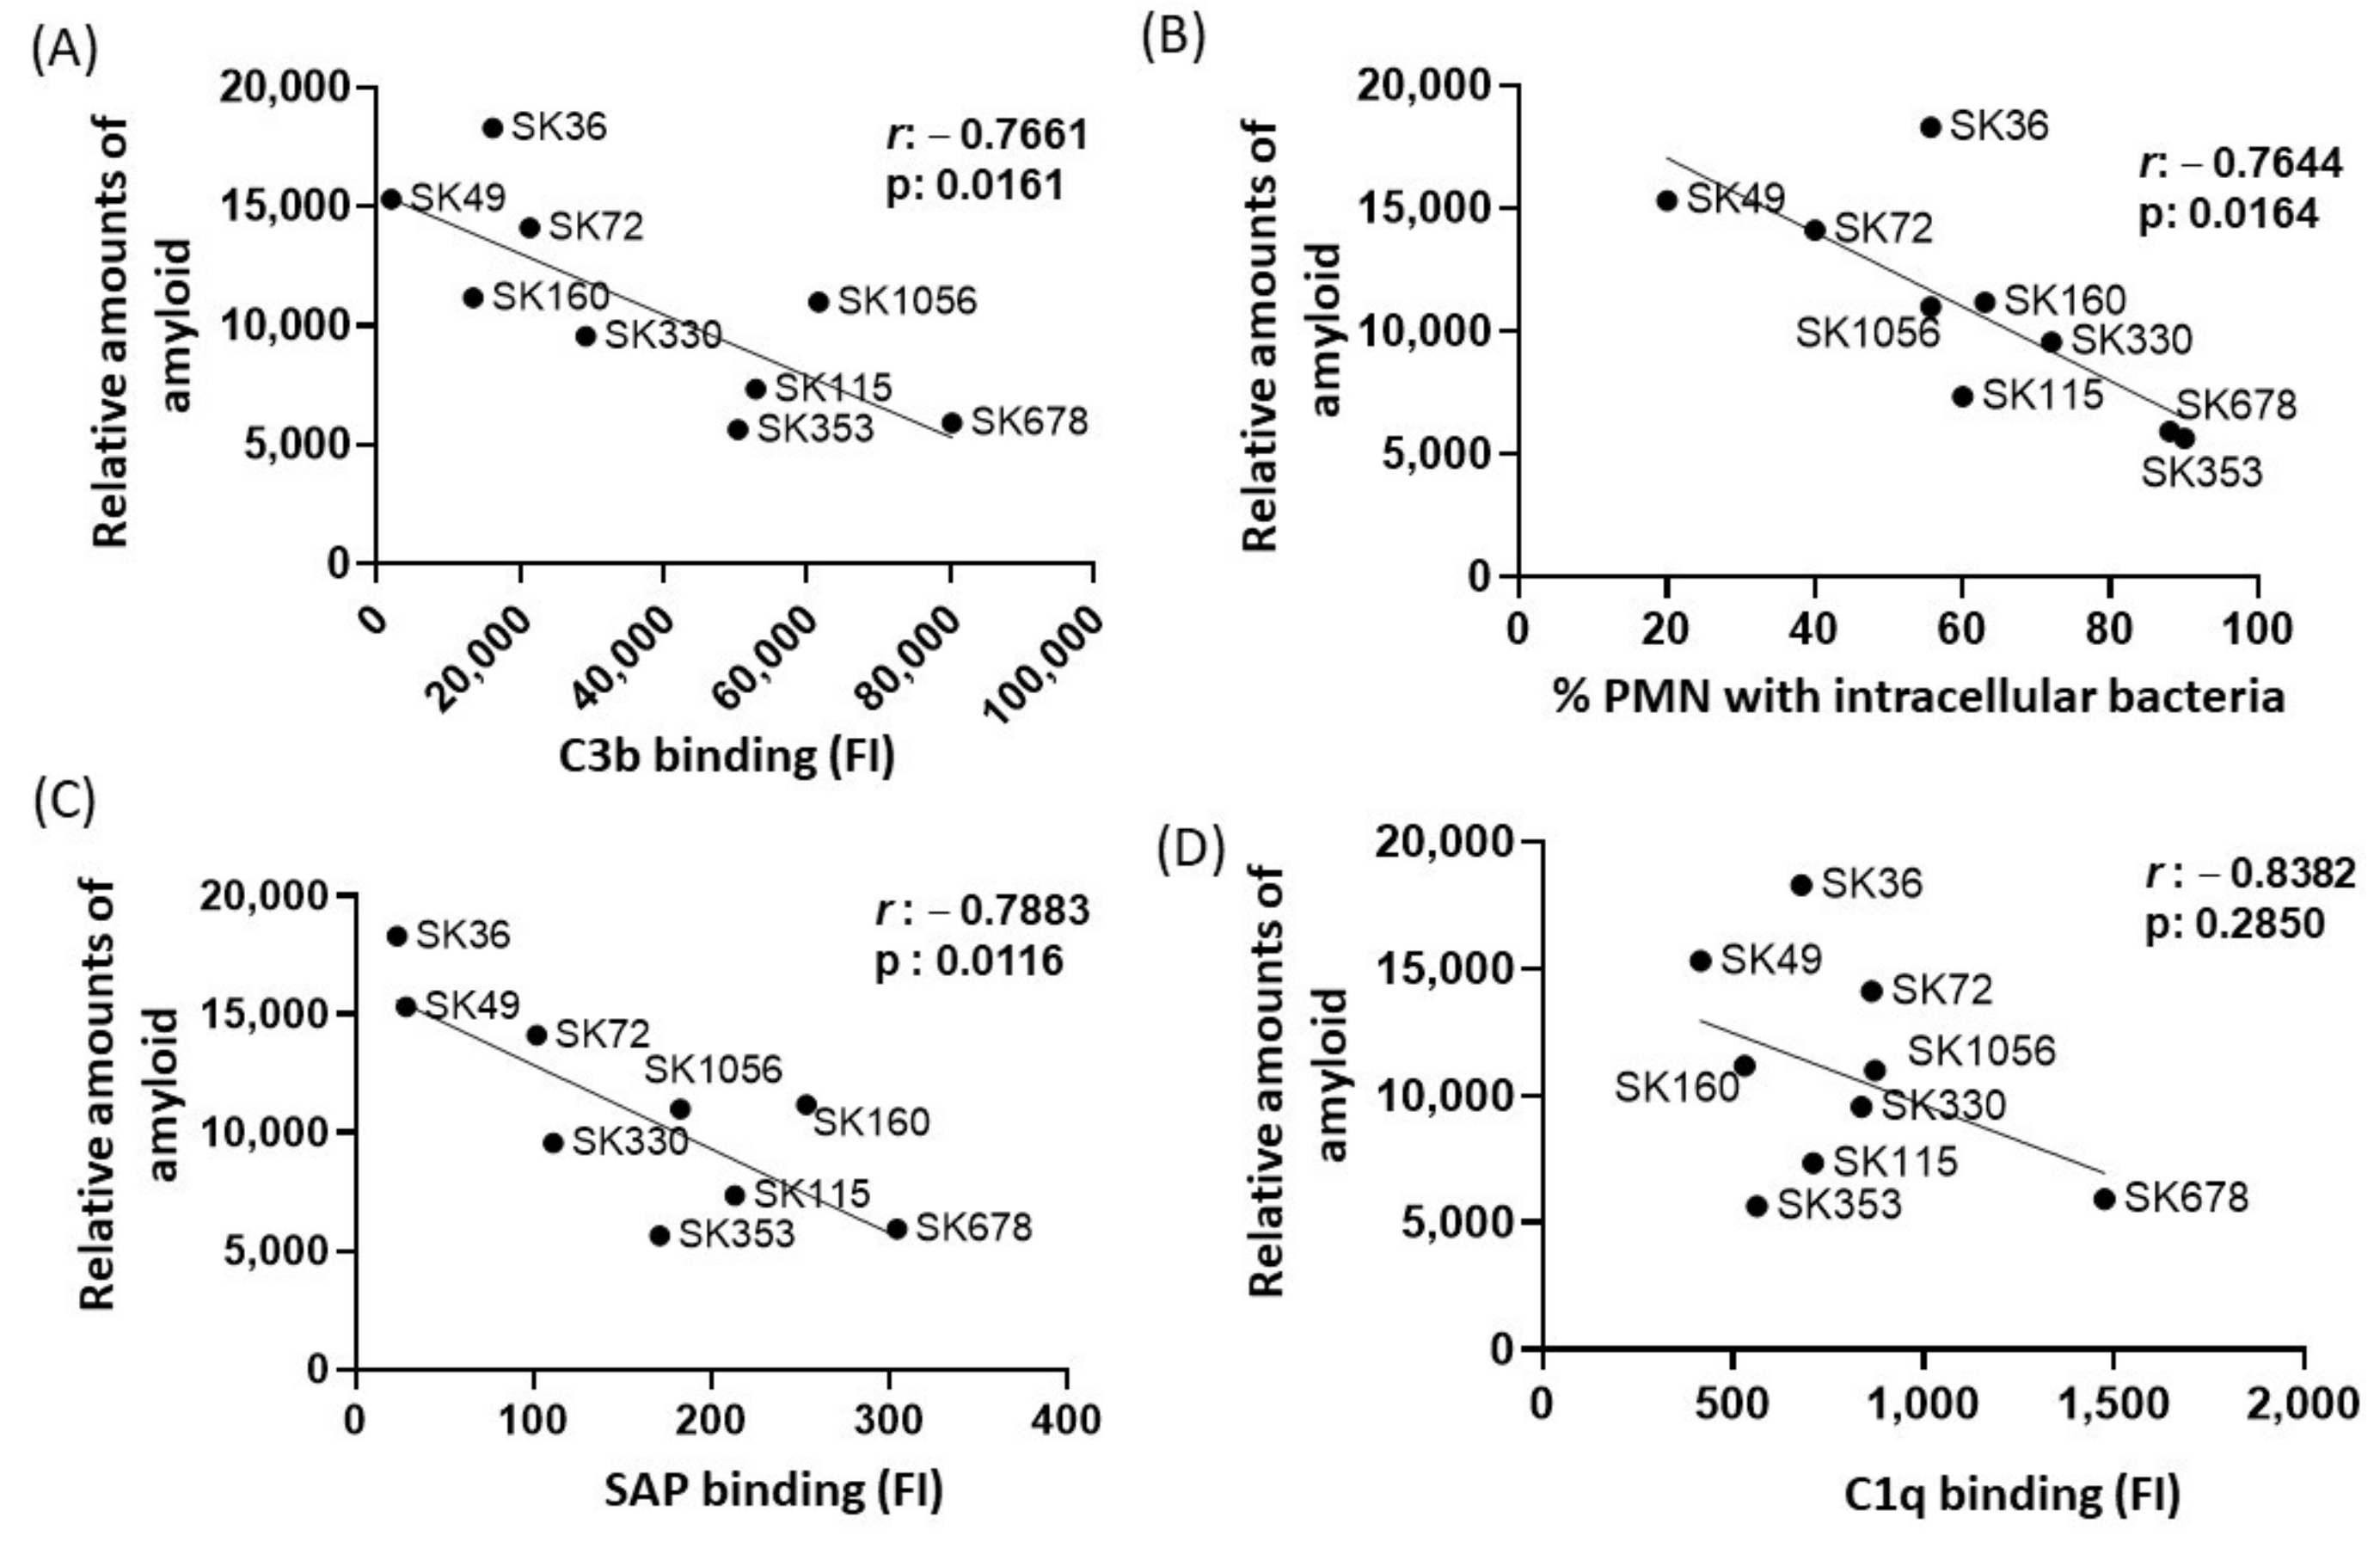
2.4. Amyloid Production Negatively Correlates with Binding to Serum Amyloid P Component (SAP), C3b Deposition and Opsonophagocytosis by PMNs among S. sanguinis Strains
In E. coli, functional amyloid curli increases bacterial survival in human serum, apparently through amyloid binding to C1q and the inhibition of the classical pathway of complement system [29]. Previously, we reported marked differences in binding to C3b and serum-mediated phagocytosis by PMNs among the same studied S. sanguinis strains, in a fashion associated with the strain-specific capacities of binding to major recognition proteins of the classical pathway, C1q and SAP [17]. Diversity in binding to the complement the downregulators C4-binding protein (C4BP) and factor H (FH) was also reported in the same strains [17]. Therefore, we compared the relative amounts of amyloid-like components quantified in culture fluids in the nine strains with previously published data of intensities of strain binding to C3b, C1q, SAP, C4BP and FH or frequency of opsonophagocytosis by PMNs [17]. By applying Pearson’s correlation analysis, we found clear negative correlation between the amounts of amyloid in culture fluids with binding to C3b (Figure 4A) or with the frequencies of opsonophagocytosis by PMNs (Figure 4B). In addition, amounts of amyloid in the culture fluids showed strong negative correlation with SAP binding (Figure 4C) but did not correlate with amounts of C1q binding (Figure 4D). No significant correlation between amyloid production and binding to C4BP was found (Pearson’s correlation; r: −0.0838, p: 0.820), but a significant negative correlation between amyloid production with FH binding was detected for a reduced proportion of the strains (r: −0.3634; p < 0.02). Therefore, S. sanguinis strains with increased production of extracellular amyloid components are less susceptible to SAP binding, C3b deposition and opsonophagocytosis by PMNs.
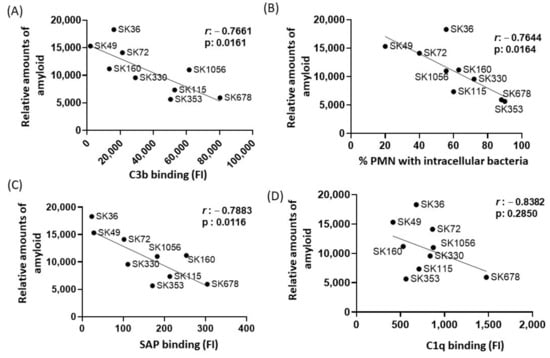
Figure 4.
Correlation analysis between amyloid production and profiles of binding to complement proteins or opsonophagocytosis by PMNs. Pearson’s correlation was applied to analyze the associations between the intensities of binding to C3b (A), SAP (C) and C1q (D) or frequencies of opsonophagocytosis by PMNs (B) (determined in a previous study [17] with the amounts of amyloid detected in culture supernatants in nine S. sanguinis strains. The r coeficients and p values are shown for each correlation scatter plot.
2.5. Deletion of srtA Impairs Amyloid Formation during Different Forms of S. sanguinis Growth
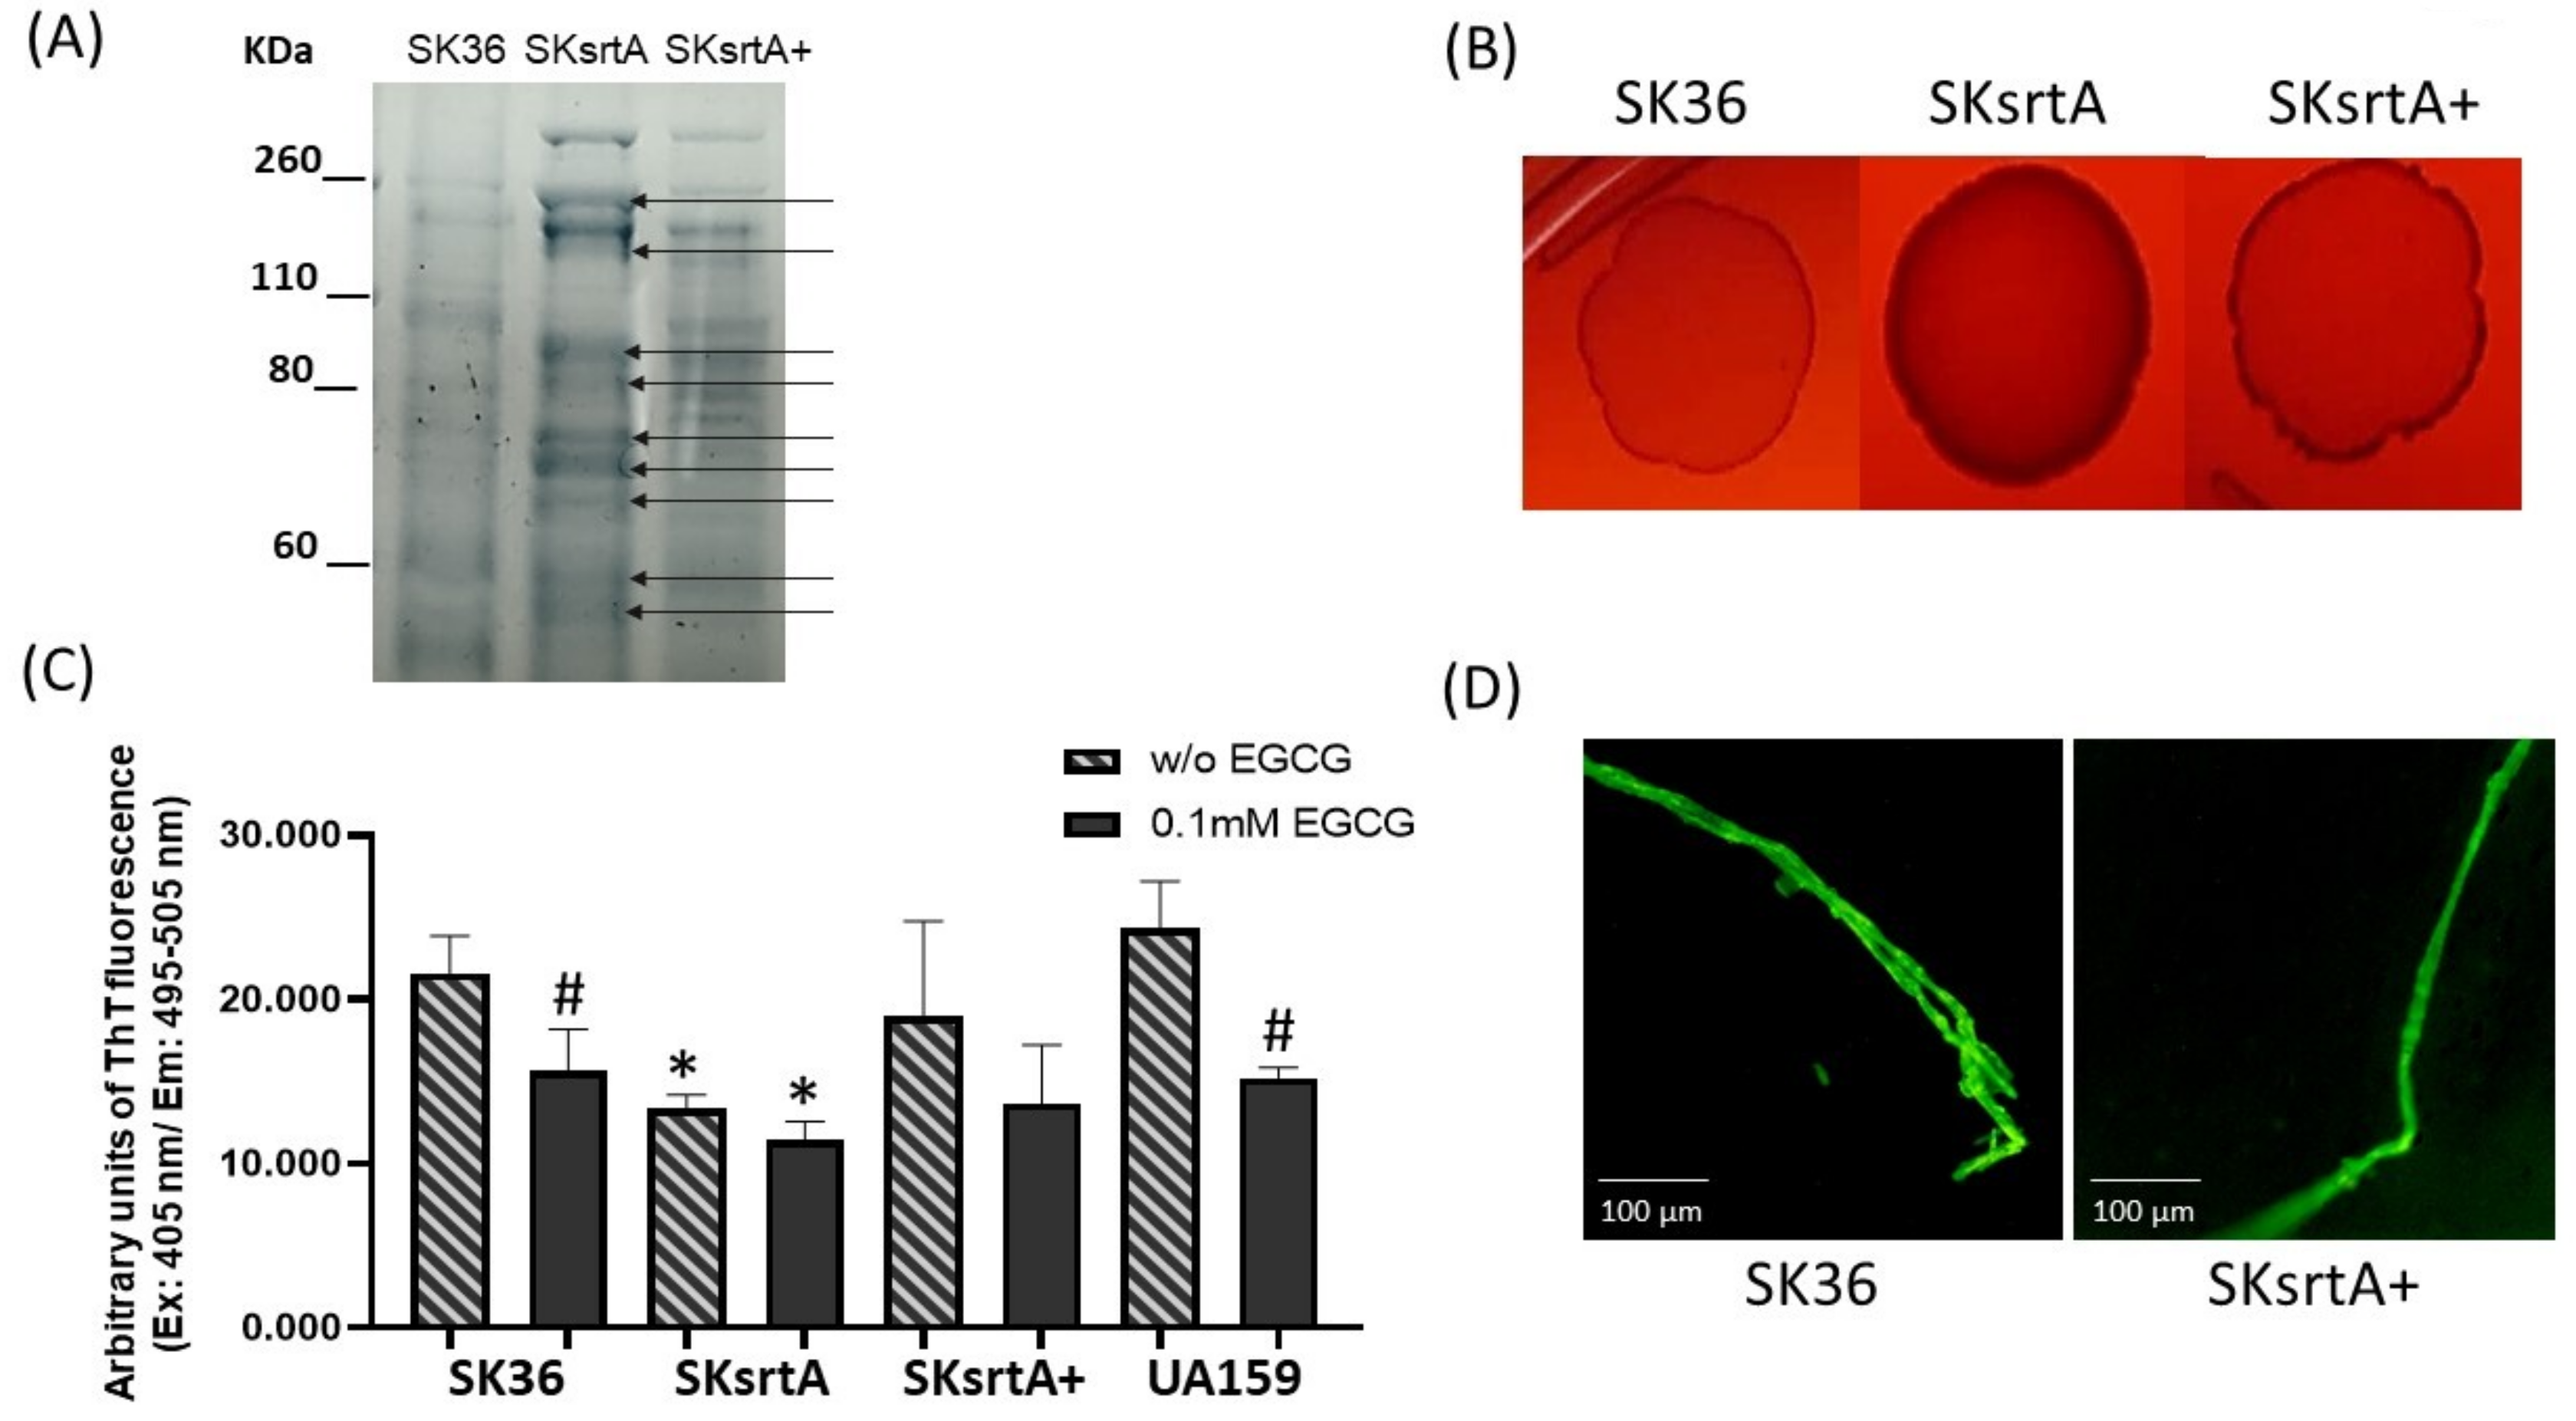
The sortase A protein targets expressed by S. mutans (P1 and WapA) and Streptomyces coelicolor (chaplins) are amyloidogenic proteins [27,30,31]. Moreover, in S. mutans, sortase A expression is required for amyloid polymerization during biofilm growth [23]. Thus, we assessed the effect of sortase A gene (srtA) deletion in SK36 on amyloid production phenotypes under different forms of bacterial growth (planktonic, growth in solid media and biofilm). Initially, we monitored the protein band profiles of cell-fee samples of culture supernatants in the srtA mutant (SKsrtA), parent strain (SK36) and complemented mutant (SKsrtA+) using 8% SDS-PAGE gels. As expected, the SKsrtA samples showed a more complex band profile when compared to SK36 and SKsrtA+, indicating an increased number of proteins being released into the culture medium (Figure 5A). We next compared the CR-binding phenotypes of macrocolonies formed by these strains over 72 h of incubation in BHI agar supplemented with CR. As shown in Figure 5B, the SKsrtA macrocolony showed increased binding to CR, when compared to macrocolonies formed by SK36, whereas the CR-binding phenotype was restored in SKsrtA+ (Figure 5B). We then quantified amounts of amyloid-like components in concentrated samples of culture supernatants with equivalent amounts of protein (1 µg/mL), after incubation (4 °C; 48 h) with 0.1 mM EGCG (or PBS), using ThT and fluorimetry (Figure 5C). The results from three independent cultures obtained per strain are shown in Figure 5C, and they indicate that culture fluids of SKsrtA had significantly lower levels of fluorescent components than supernatants of SK36. Amounts of fluorescent components were restored in SKsrtA+, although in larger variations when compared to SK36, which could reflect the instability of plasmid pDL278::srtA in cultures not supplemented with spectinomycin, the antibiotic for maintaining plasmids (Figure 5C). Finally, EGCG significantly inhibited amyloid production in SK36, although it had limited effects on samples of SKsrtA and SKsrtA+ (Figure 5C). As expected, EGCG significantly inhibited amyloid production in culture fluids of the reference S. mutans strain UA159 (Figure 5C). Amyloid-like components detected in ThT-stained samples of culture supernatant were also evaluated via fluorescence microscopy (Figure 5D). Compatible with the fluorimetric quantitative analysis, samples of SK36 and SKsrtA+ showed fluorescent fibrous aggregates (Figure 5D), which were infrequent in SKsrtA samples and not detected BSA control samples. Therefore, srtA deletion influences S. sanguinis binding to CR and reduces the formation of amyloid-like components in culture fluids.

Figure 5.
Effects of srtA deletion on CR-binding and amyloid production. (A) Protein band profiles of samples of culture supernatants obtained from SK36, SKsrtA and SKsrtA+. Equivalent amounts of protein (10 µg/lane) were resolved in 8% SDS-PAGE gels and stained with Coomassie blue. Arrows indicate band proteins detected in SKsrtA but not in SK36 and SKsrtA+. (B) Macrocolonies of SK36, SKsrtA and SKsrtA+ formed over 72 h on BHI agar supplemented with CR. (C) Samples with equivalent amounts of protein (1 µg/mL) of concentrated culture supernatant were incubated (4 °C; 48 h) with 0.1 mM EGCG or PBS (without EGCG), ThT was added and the fluorescent intensities were measured in a GloMax®® Discover System (AFC filter; excitation: 405 nm; emission: 495–505 nm). Columns represent means of data obtained from three independent cultures; bars indicate standard deviation. Asterisks indicate significant differences in relation to SK36 under the same condition; hashtags indicate significant differences in relation to samples without EGCG obtained from the same strain (Kruskal–Wallis with Dunn’s post hoc test; p < 0.05). (D) Representative fluorescence microscopy images of fibrous aggregates detected in samples of culture supernatants stained with ThT obtained from SK36 and SKsrtA+.
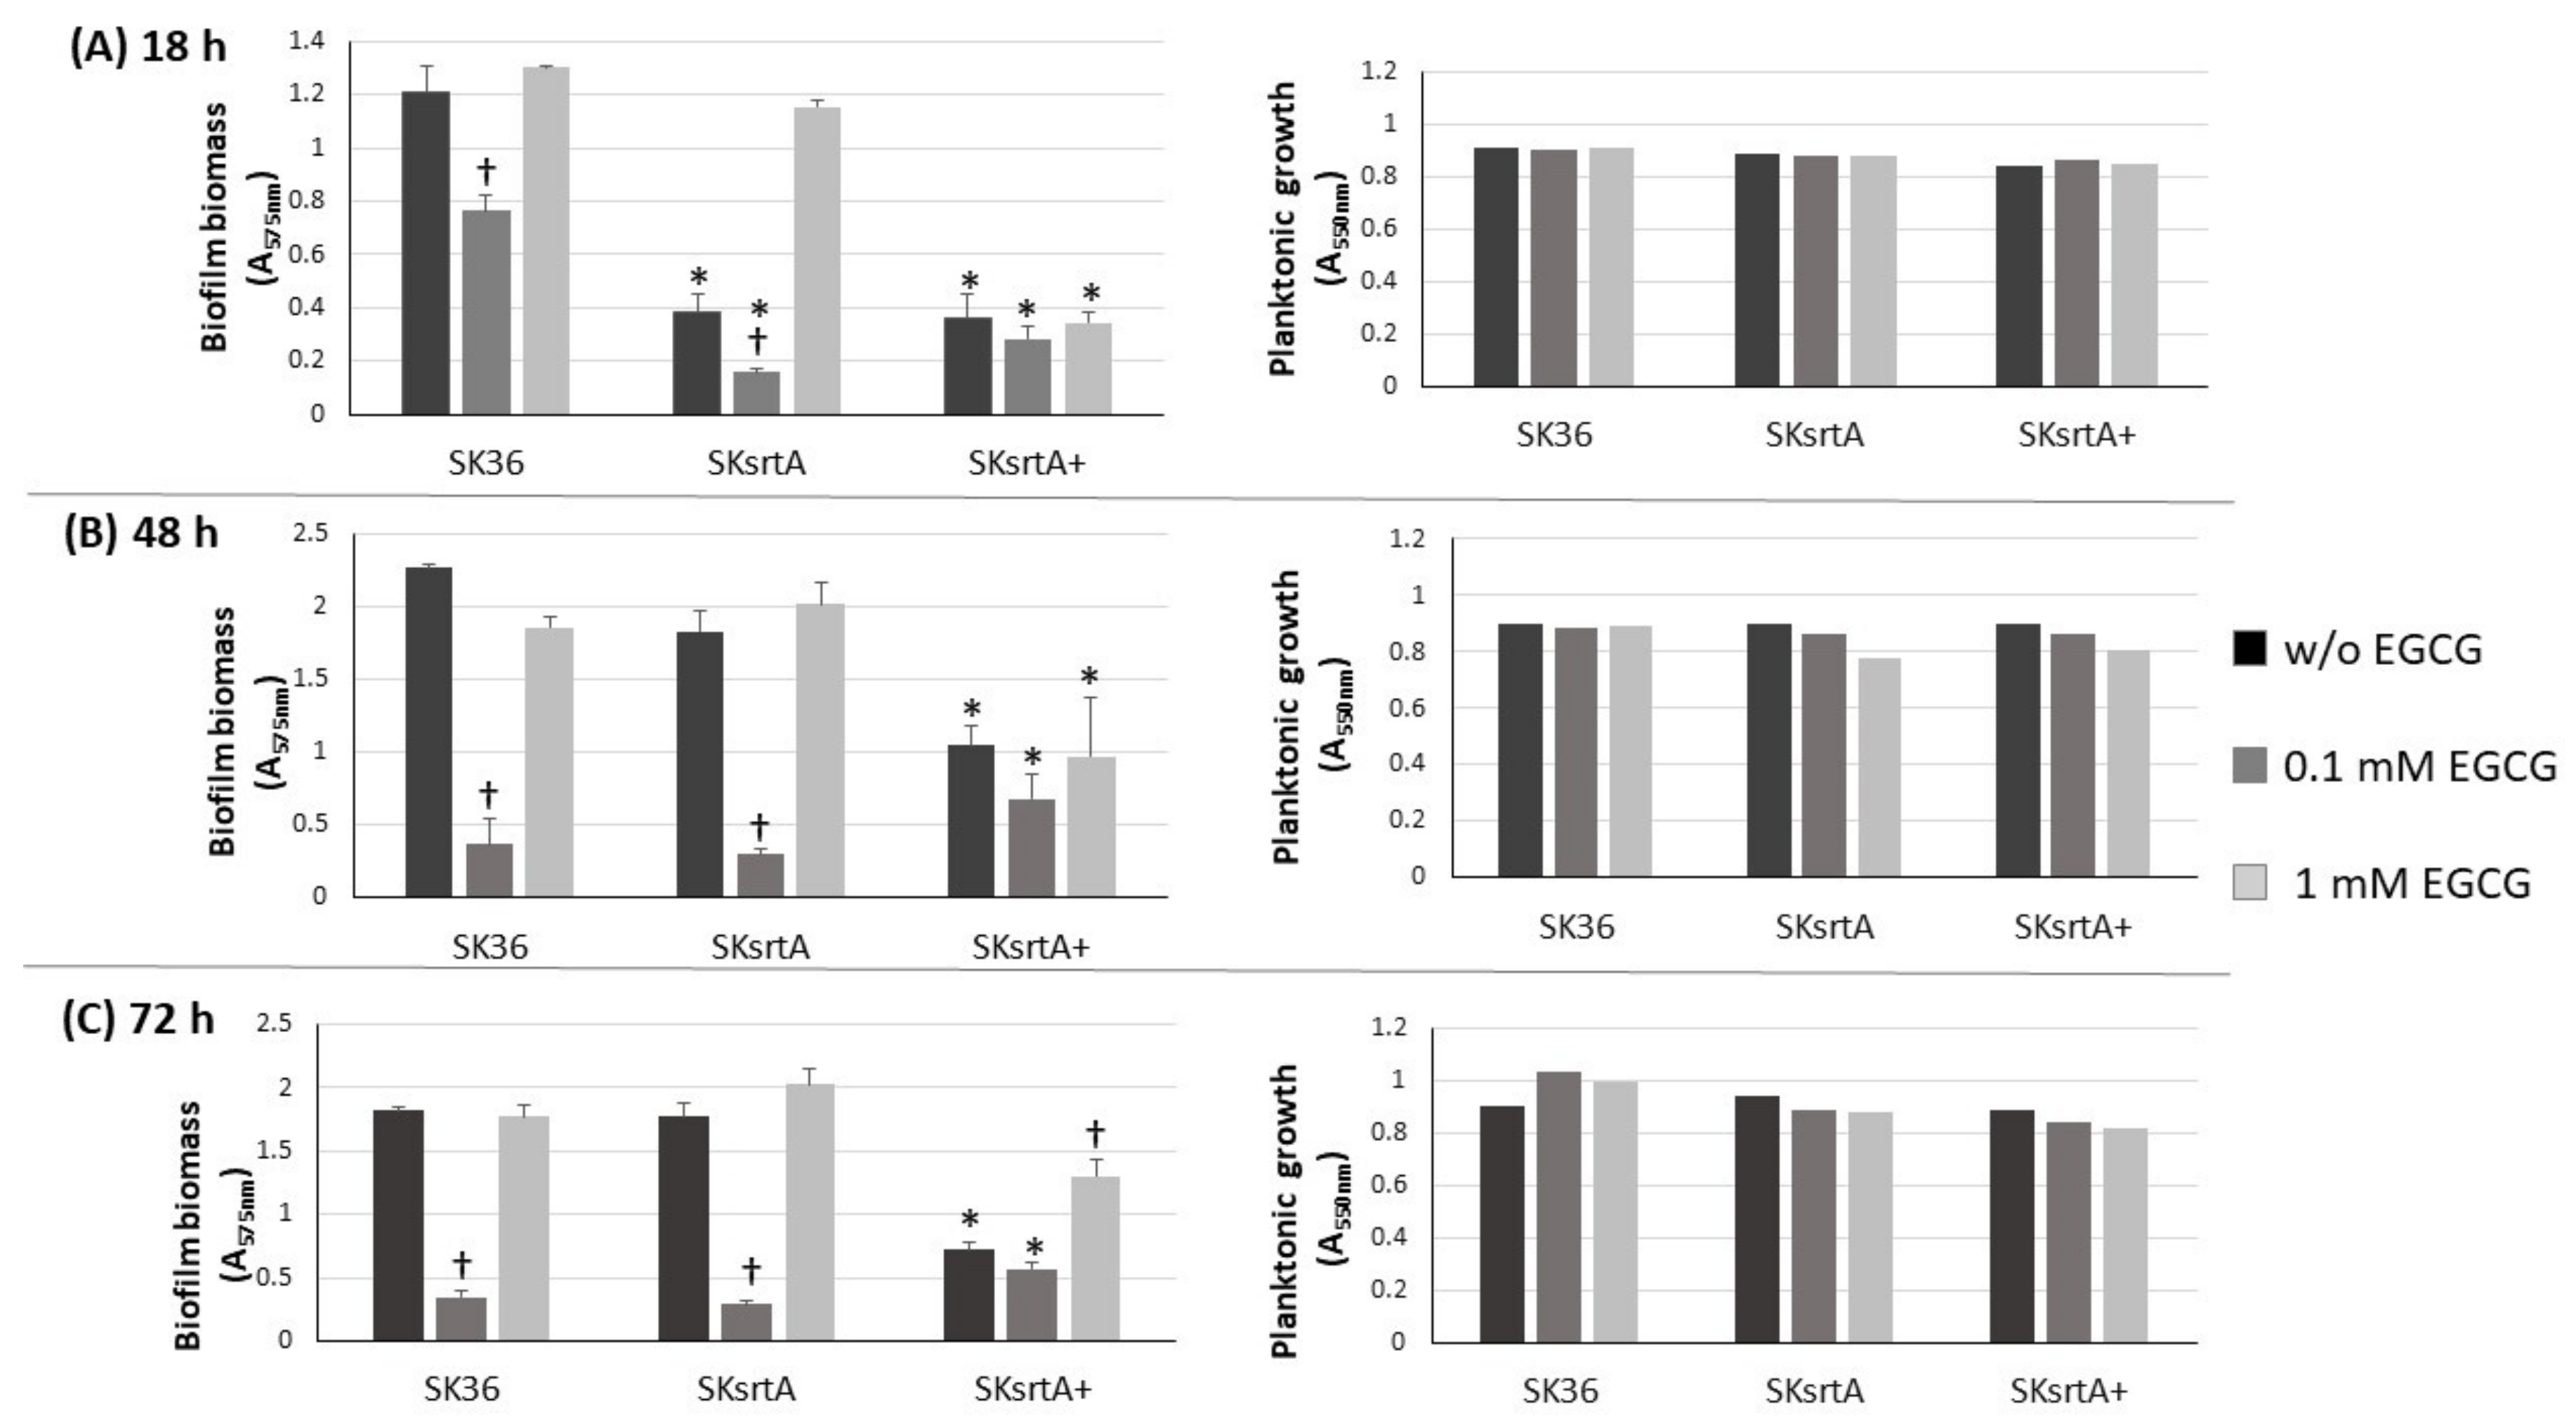
We also investigated the effect of srtA deletion on biofilm formation in the presence and absence of EGCG by comparing the biomass of biofilms formed in 96-well plates in 1% sucrose BHI with or without EGCG (at 0.1 and 1 mM) in the same assays used for comparisons of clinical strains (Figure 3). As shown in Figure 6, the SKsrtA mutant showed reduced biofilm formation either in medium with or in medium without 0.1 mM EGCG when compared to SK36 grown under the same conditions over 18 h (upper panel). However, significant differences in biofilm biomass between SKsrtA and SK36 could not be detected after 48 and 72 h of growth (Figure 6, lower panels). The addition of 0.1 mM EGCG to BHI further reduced biofilm formation in SKsrtA as compared to BHI without EGCG, whereas EGCG at 1.0 mM did not influence the biofilm formation of SKsrtA (Figure 6), as observed for other strains (Figure 3). Biofilm phenotype was not restored in SKsrtA+, which again could be due to the instability of plasmid pDL278::srtA during biofilm maturation. As expected, EGCG did not influence the planktonic growth of the tested strains (Figure 6, right panels). Because differences in amyloid production could be masked by other exopolymers (including eDNA and exopolysaccharides) and/or by BHI tissue components, which would bind at different extents to the tested strains, it was thus difficult to identify amyloid contribution to biofilm biomass phenotypes of SK36, SKsrtA and SKsrtA+ in 1% sucrose BHI.

Figure 6.
Effect of srtA deletion on biofilm formation in the presence or absence of EGCG. Biofilms were formed on 96-well plates in 1% sucrose BHI supplemented or not with EGCG (0.1 or 1 mM) over 18 (A), 48 (B) and 72 h (C) of incubation (indicated in horizontal panels). The absorbances (A757 nm) of ethanol eluates of the biofilms previously stained with crystal violet were used as measures of biofilm biomass. Planktonic growth of the same cultures (A550 nm) monitored at the respective incubation periods are shown on the right (A–C). Columns represent means of triplicates of one representative experiment; bars indicate standard deviations. Asterisks indicate significant difference in relation to SK36 under the same conditions; crosses indicate significant differences in relation to the same strain grown in medium without EGCG (Kruskal–Wallis with Dunn’s post hoc test; p < 0.05).
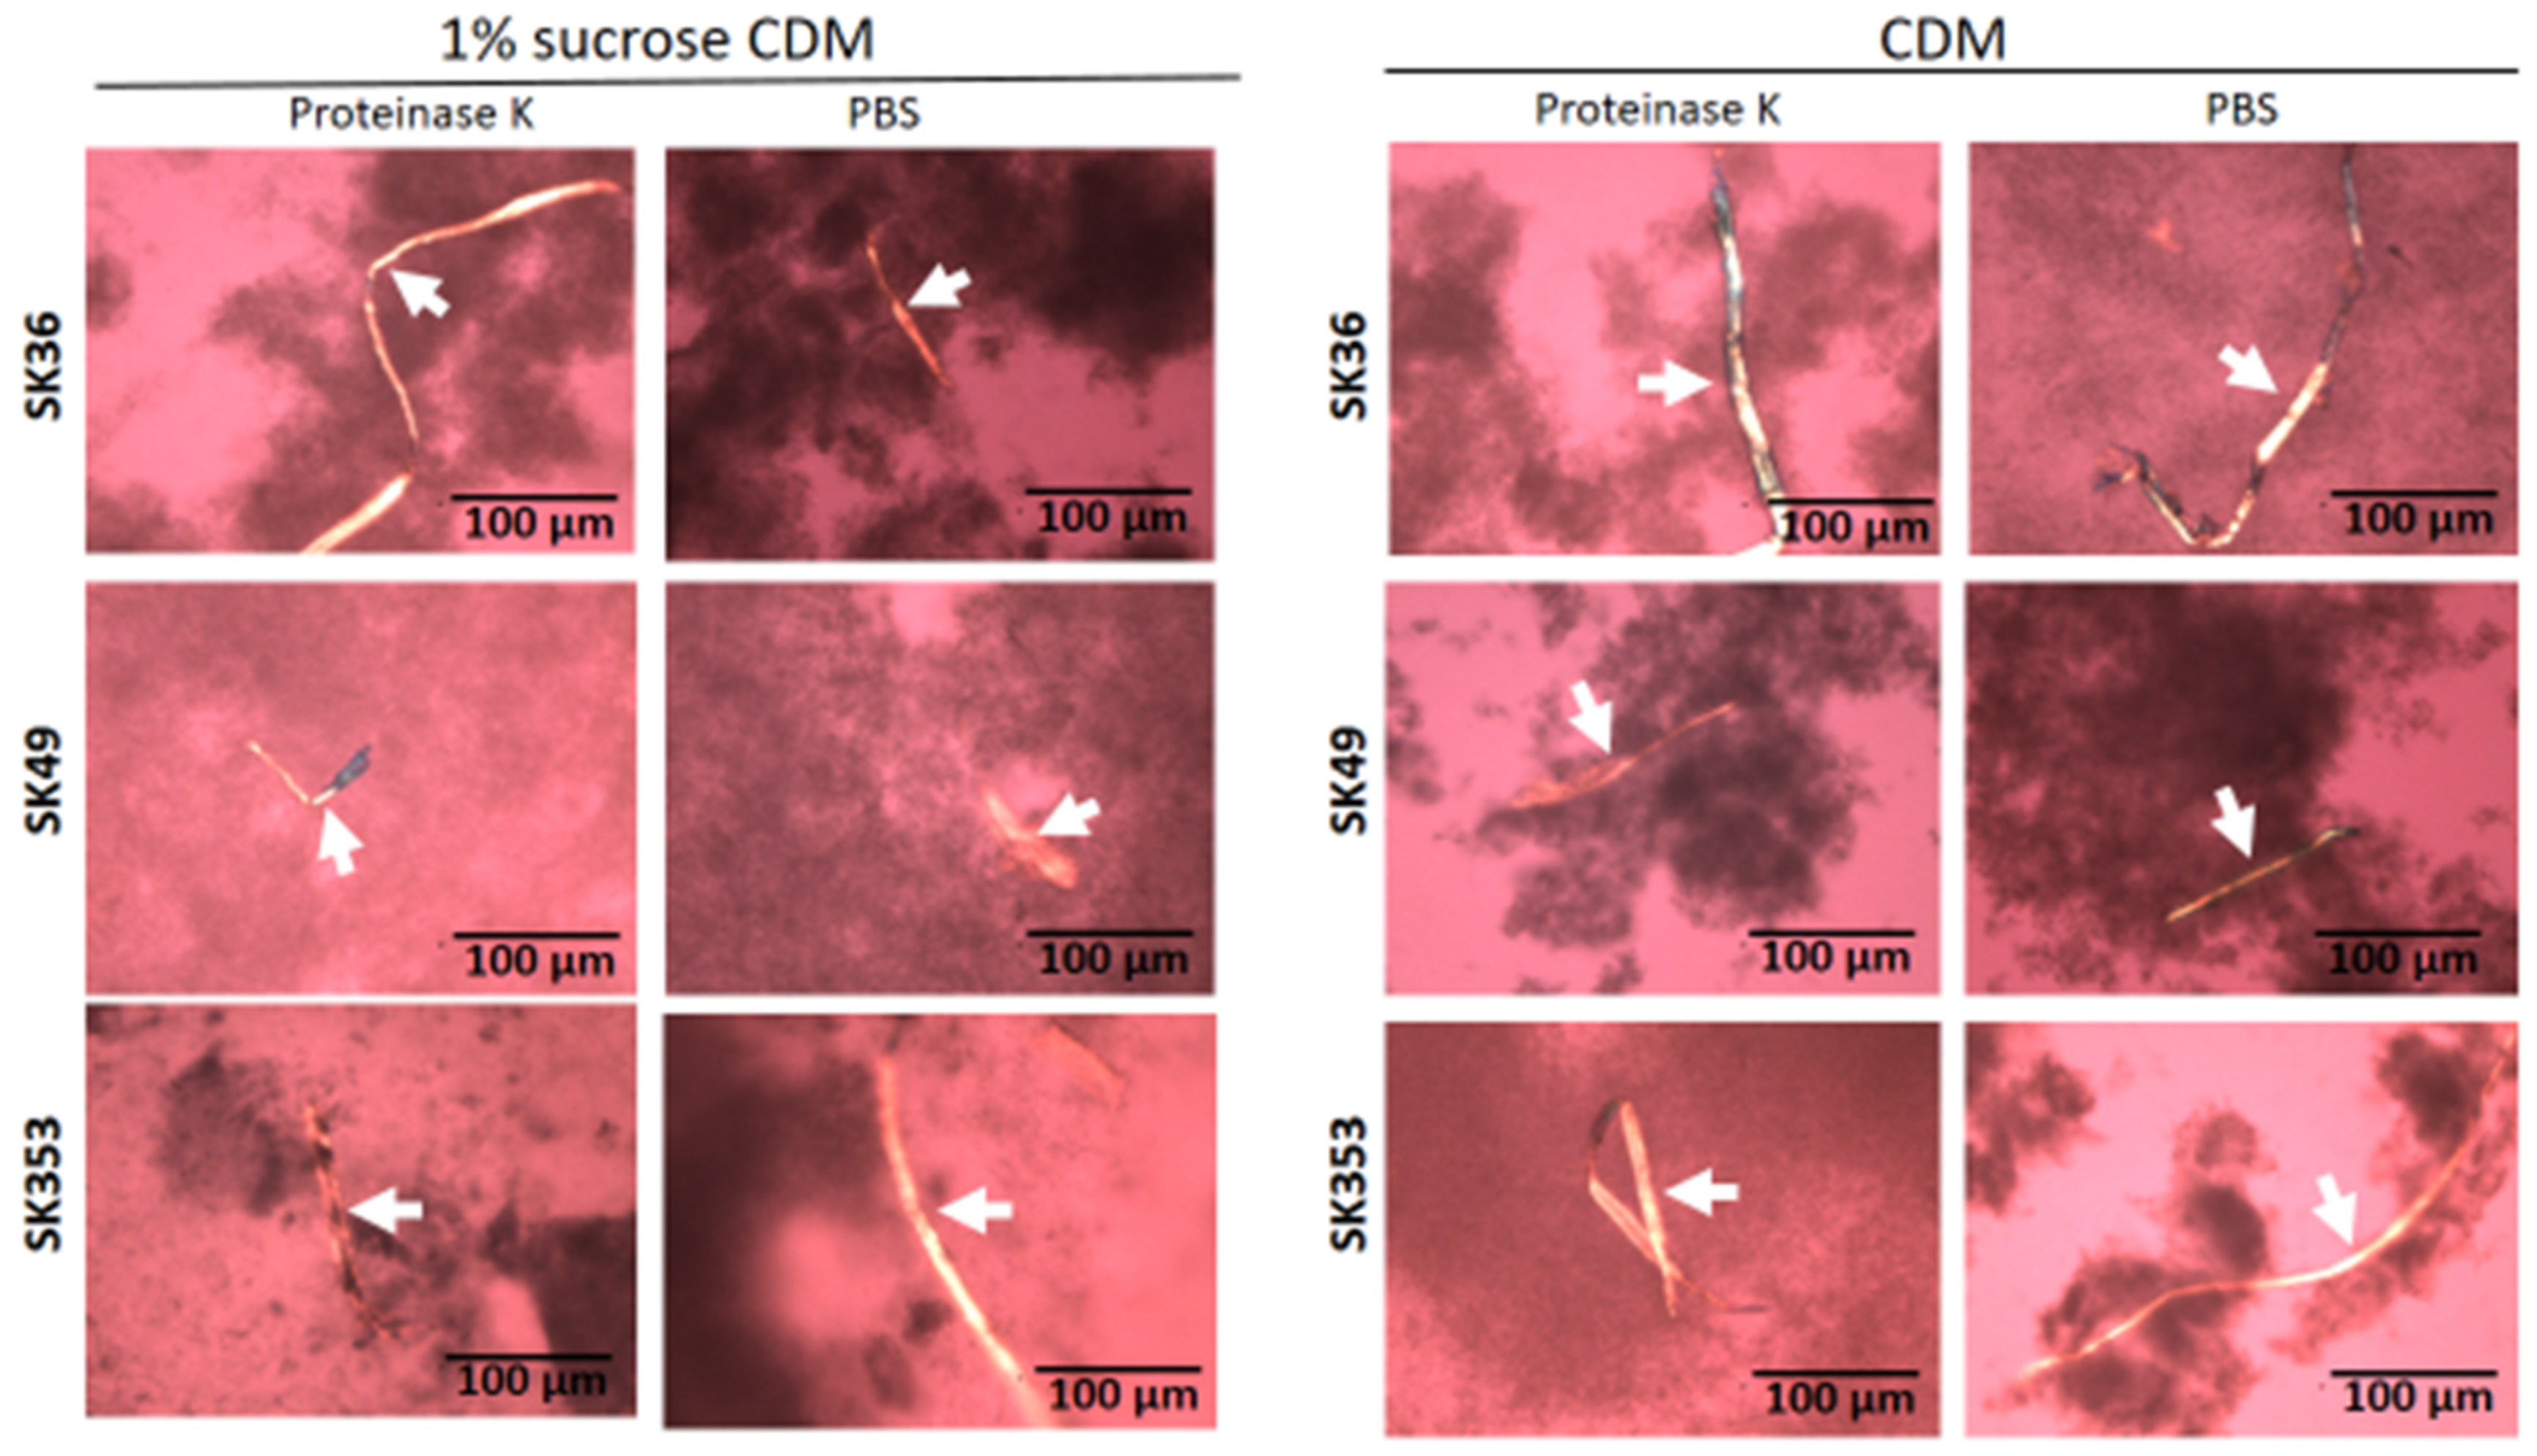
To circumvent the potential influence of BHI components and sucrose-derived glucan in the assessment of amyloid production in biofilms formed by SKsrtA, SK36 and SKsrtA+, we next investigated the production of amyloid components in biofilms formed over 72 h in CDM supplemented or not with 1% sucrose (in 24-well plates). Biofilms were then treated with proteinase K (or PBS as control) and stained with CR for cross-polarized light microscopy to allow amyloid detection. As shown in Figure 7, the SK36 and the complemented strain SKsrtA+ formed biofilms containing birefringent amyloid fibrous aggregates, which were resistant to proteinase K, as observed by CR staining and cross-polarized light microscopy. These fibrils were formed either in the presence or absence of sucrose, indicating that glucan does not impair the assembly of amyloid fibrils. Importantly, amyloid aggregates could not be detected in biofilms formed by SKsrtA (Figure 7). To further confirm the amyloid nature of the fibrous aggregates detected in CR-stained biofilms, we analyzed the binding of these component to ThT. Thus, samples of biofilms formed by the same strains (and under the same conditions used for CR staining) were treated with proteinase K, stained with ThT, and analyzed via fluorescence microscopy. As shown in Figure S1, fluorescent aggregates of similar morphology of those detected via cross-polarized light microscopy (Figure 7) were detected in biofilms formed by SK36 and SKsrtA+ but not in biofilms formed by the SKsrtA mutant. Therefore, S. sanguinis produces amyloid aggregates during biofilm formation, in a fashion dependent on srtA expression.
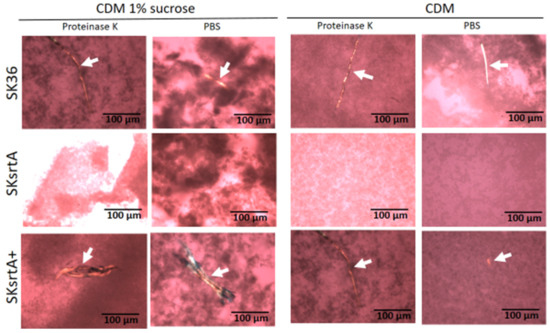
Figure 7.
Effect of srtA deletion on amyloid fibril production in biofilms. Biofilms formed by strains SK36, SKsrtA and SKsrtA+ in 1% sucrose CDM or in CDM without sucrose over 72 h, were collected, treated with proteinase K (or PBS), stained with CR and analyzed under cross-polarized light. Digital images were obtained at 200× magnification. Arrows indicate birefringent fibrils. Strain identities are indicated to the left of the horizontal panels.
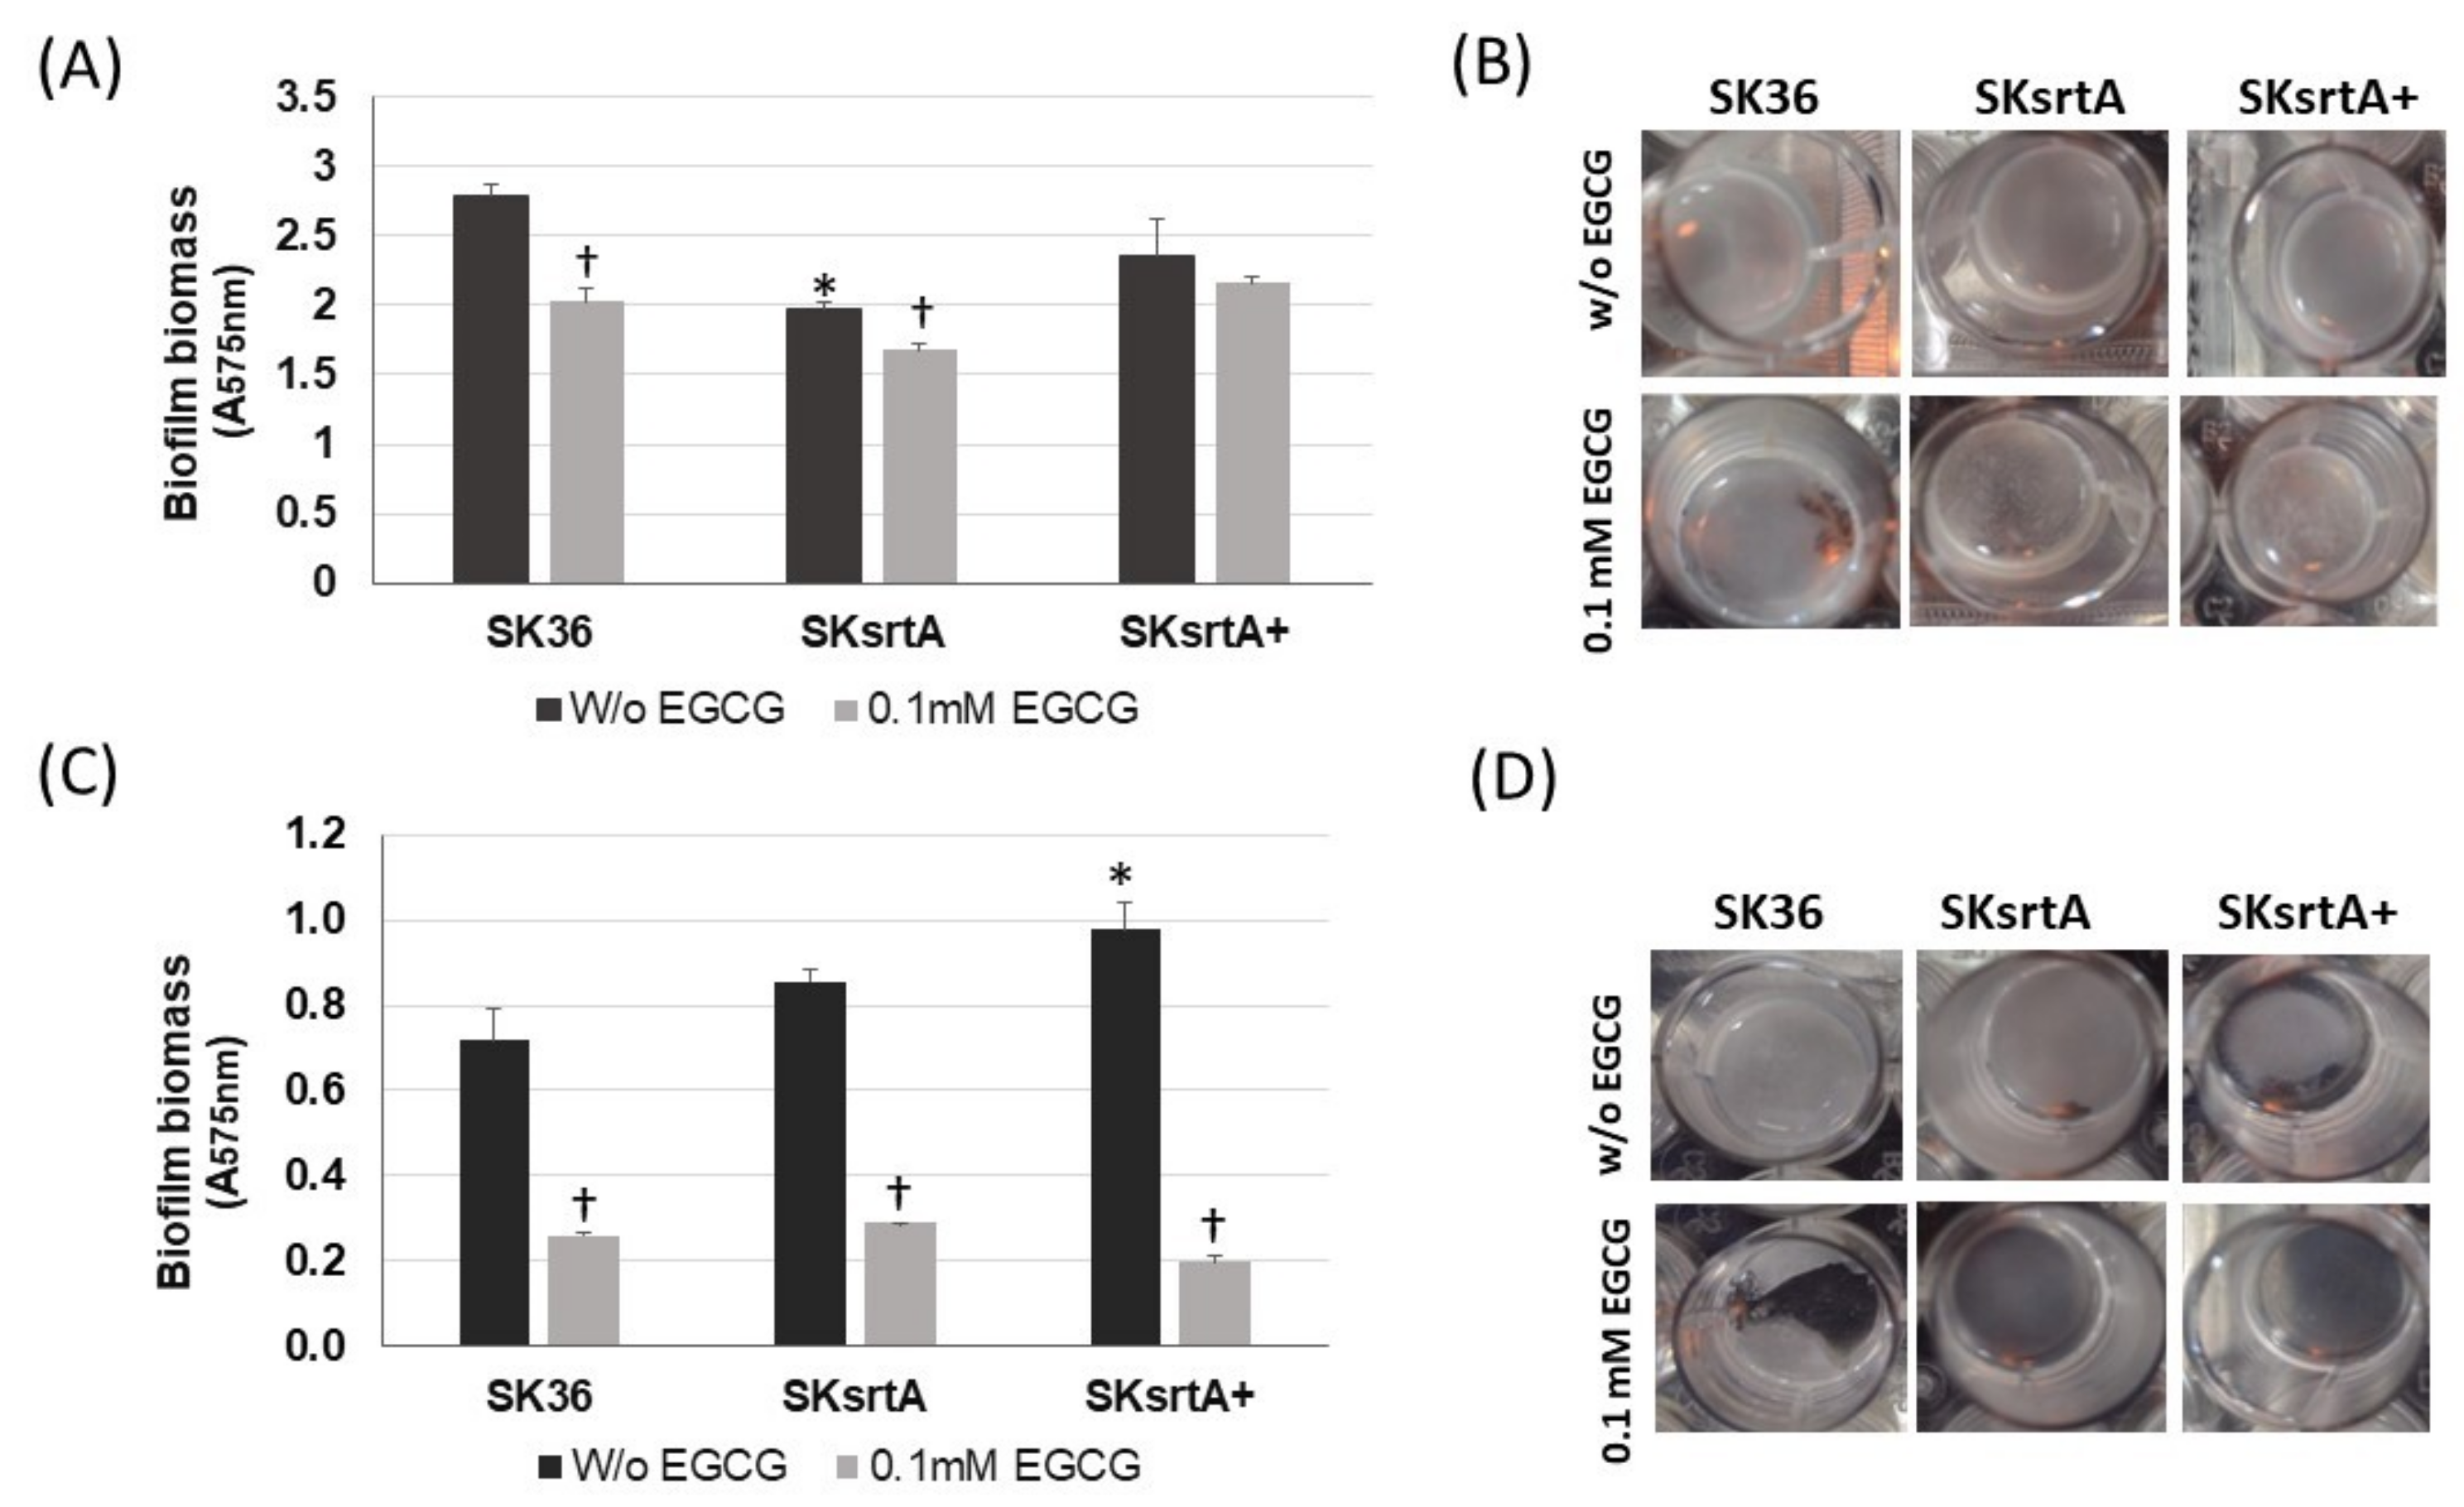
To explore the effects of amyloid on the stability of biofilms, we next quantified biofilms formed under the same conditions in the presence and absence of 0.1 mM EGCG. As shown in Figure 8A,B, biofilms formed by SKsrtA in CDM (without sucrose) were less stable and more easily detached during the gentle washing steps, when compared to biofilms formed by SK36 or SKsrtA+ under the same conditions. Moreover, EGCG reduced the stability of SK36 biofilms, but had limited effects on the stability of biofilms formed by SKsrtA. Supplementation of CDM with 1% sucrose increased the biofilm biomass in all strains regardless of the addition of EGCG, as observed by visual inspection of the 24-well plates (Figure 8D). However, these increases could not be precisely quantified (Figure 8C), because these robust biofilms more easily detached from the 24-well plates during the washing steps, especially when formed in the presence of EGCG (Figure 8D). Of note, when visually compared before the washing steps, the biofilms formed by SKsrtA in 1% sucrose CDM appeared to be of reduced biomass as compared to SK36 in the same medium.
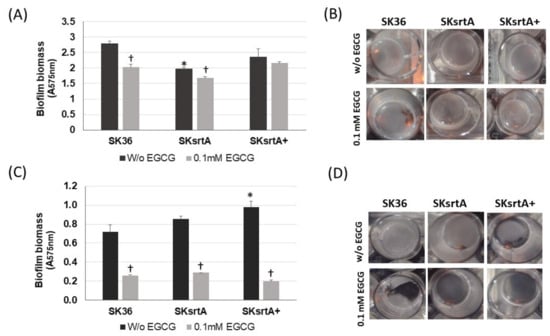
Figure 8.
Effects of srtA deletion in S. sanguinis biofilm phenotypes. Biofilms were formed over 18 h by strains SKsrtA, SK36 and SKsrtA+ in 24-well microtiter plates with CDM (without sucrose) or 1% sucrose CDM, in the presence or absence of 0.1 mM EGCG. Biofilms were gently washed and stained with crystal violet. The absorbances of ethanol eluates of the stained biofilms (A575 nm) were used as measures of biofilm biomass. (A) Biomass of biofilms formed in CDM. (B) Images of biofilms formed in CDM. (C) Biomass of biofilms formed in 1% sucrose CDM. (D) Images of biofilms formed in 1% sucrose CDM. Asterisk indicates significant difference in relation to SK36 under the same conditions; cross indicates significant difference in relation to biofilm formed in the absence of EGCG by the same strain (Kruskal–Wallis with Dunn’s post hoc test).
2.6. Deletion of srtA Increases S. sanguinis Susceptibility to C3b Deposition, Affects Its Interaction with PMNs and Impairs Persistence in Human Blood
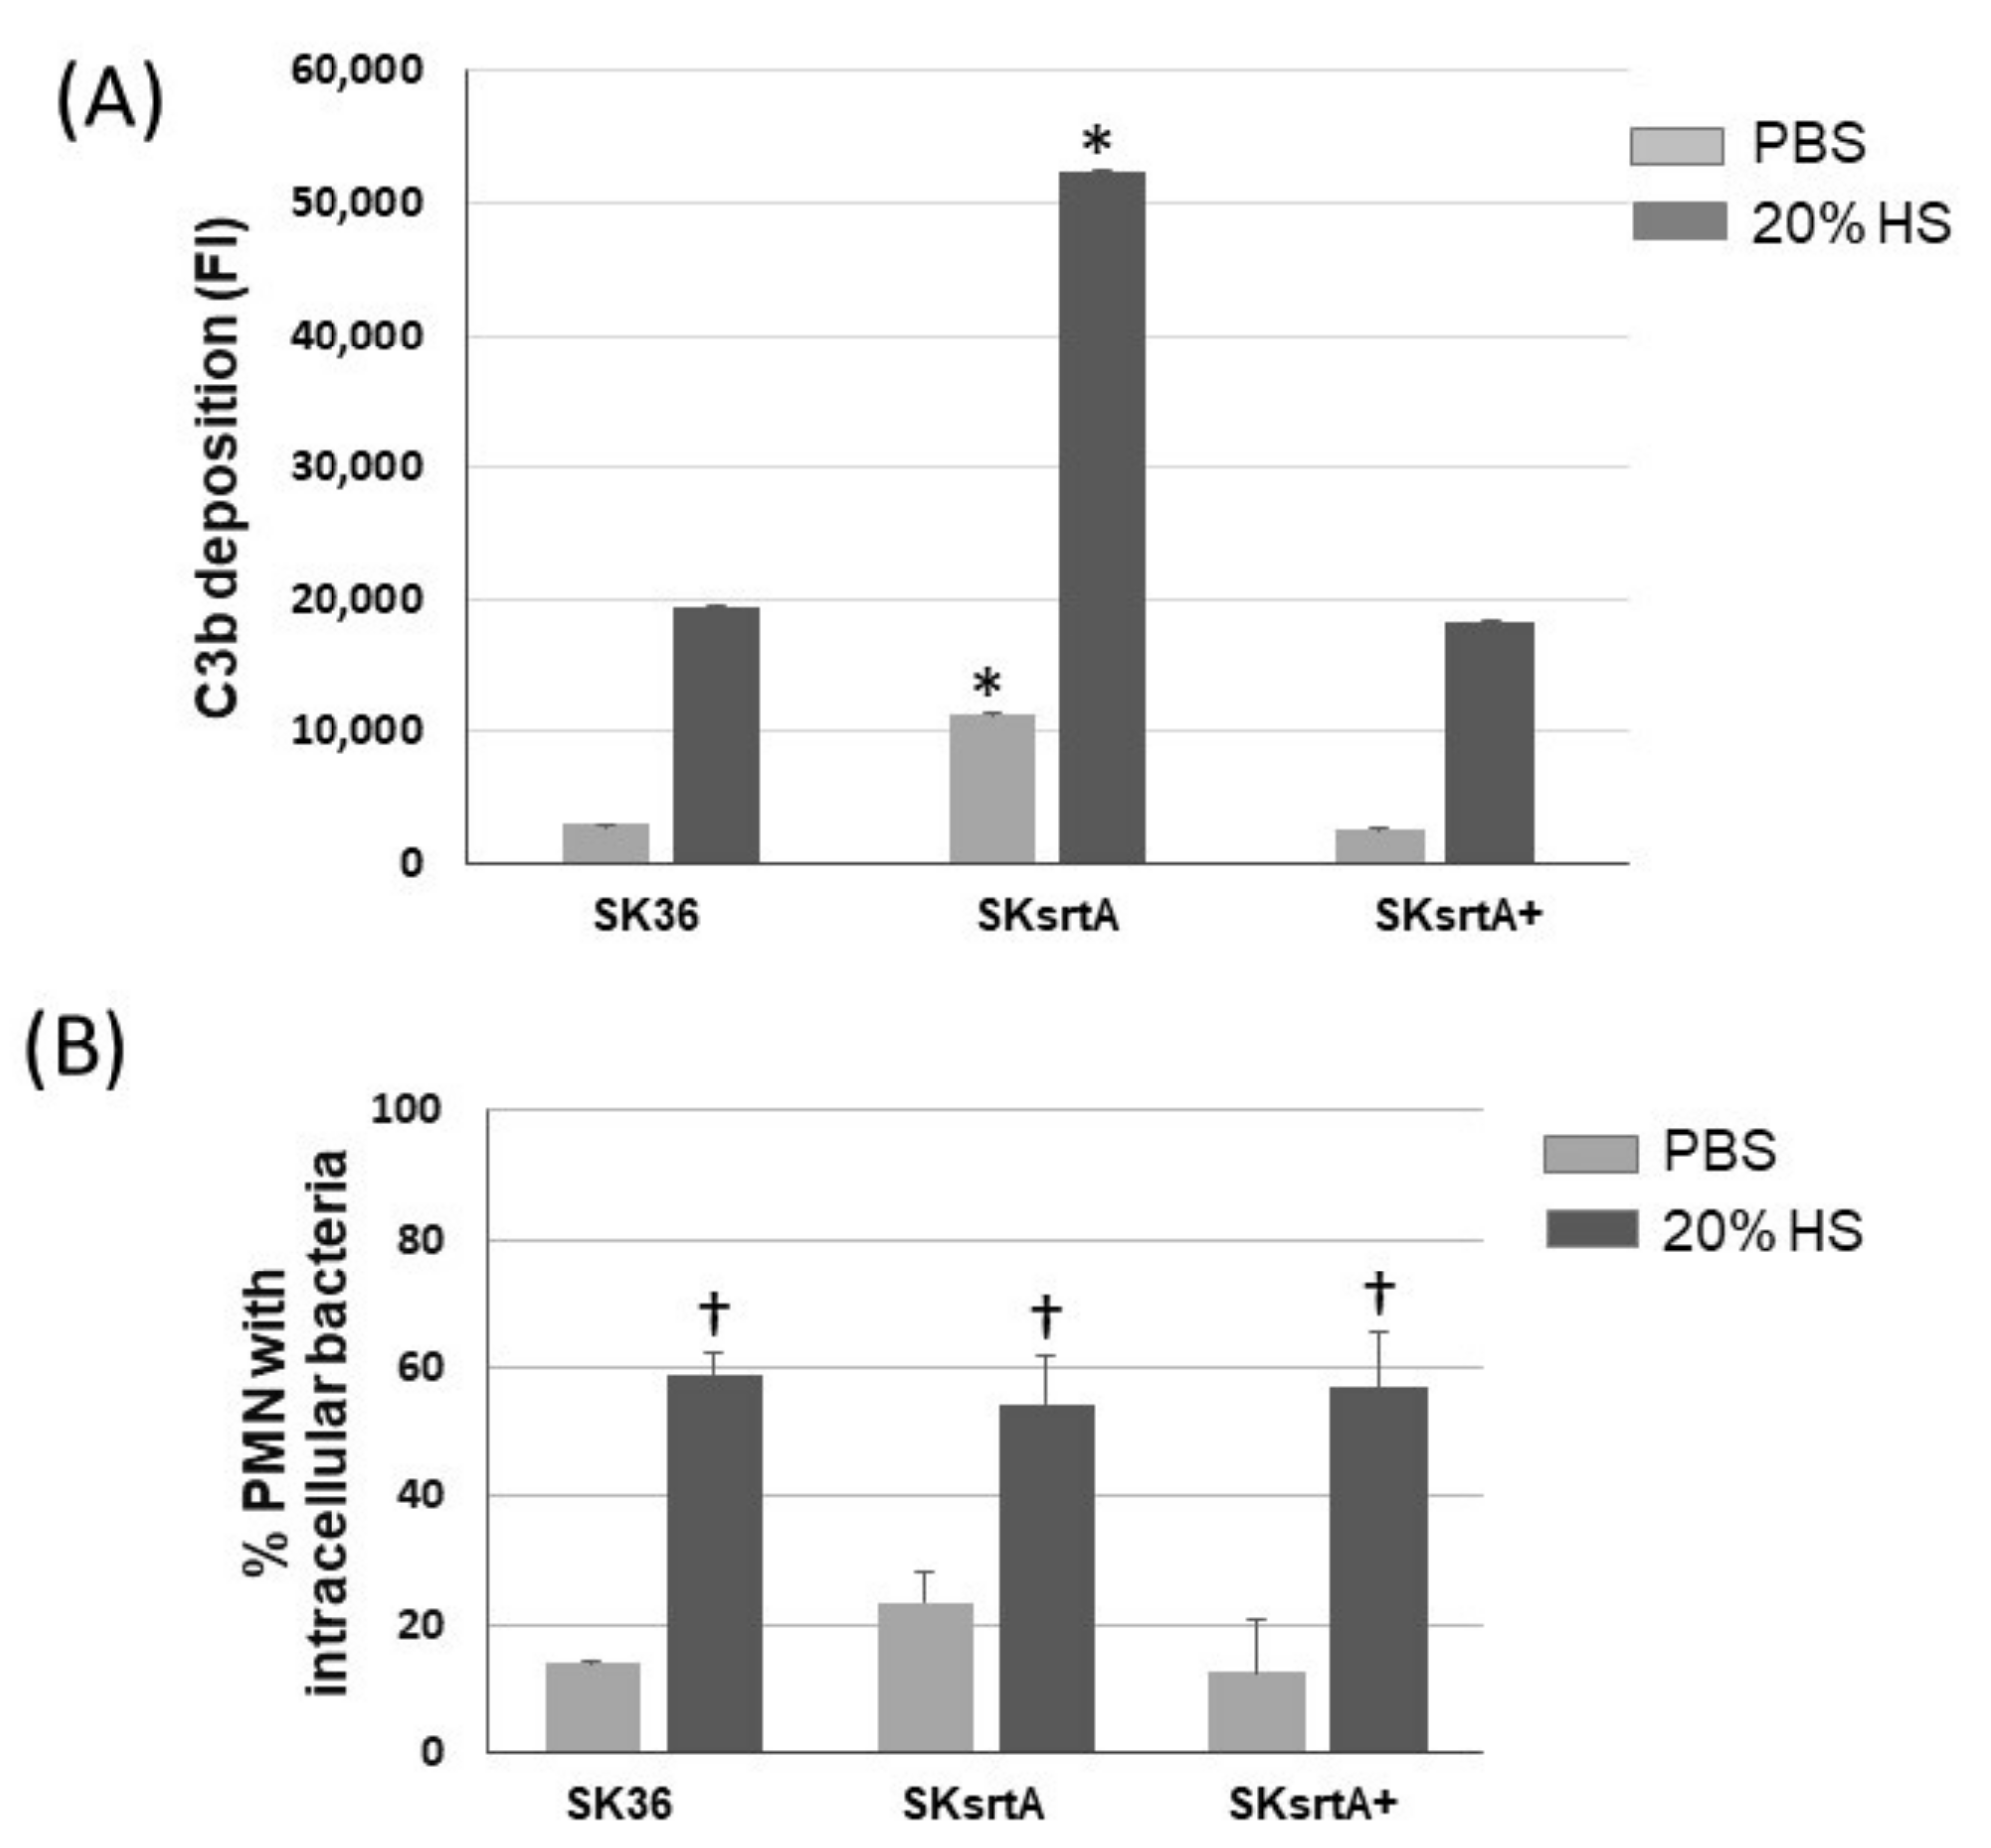
Because there was a negative correlation between the amounts of amyloid-like compounds in culture fluids and C3b deposition in the set of nine S. sanguinis strains (Figure 4), we further assessed the effects of srtA deletion in the susceptibility of SK36 to C3b deposition and opsonophagocytosis by PMNs. As shown in Figure 9A, there was a significant increase in C3b deposition on the surface of the SKsrtA mutant treated with human serum (HS) as compared to SK36. In addition, the C3b deposition phenotype was fully restored in the SKsrtA+. Unexpectedly, no increase in the frequency of opsonophagocytosis was detected in the SKsrtA as compared to SK36 in our flow cytometry assays (Figure 9B). Although SKsrtA formed longer chains when compared to SK36 in overnight cultures (18 h), no significant differences in chain length could be detected between these strains when at the growth phase used for phenotypic comparisons (A550 nm 0.3).

Figure 9.
Deposition of C3b and opsonophagocytosis by human PMNs in S. sanguinis strains. (A) The intensities of C3b deposition (FI) on strains SK36, SKsrtA and SKsrtA+ (at A550 nm 0.3) treated with 20% human serum (HS) or PBS (negative control) were determined using flow cytometry. Columns represent the means of triplicates of one representative experiment; bars indicate standard deviations. Asterisks indicate significant differences in relation to SK36 under the same conditions (Kruskal–Wallis with Dunn’s post hoc test; p < 0.05). (B) Frequencies of bacterial phagocytosis by PMNs isolated from peripheral blood determined via flow cytometry. PMNs were exposed to FITC-labeled bacteria in the presence of PBS or 20% HS. Columns represent means of data obtained in three independent experiments; bars indicate standard deviation. No significant differences were observed between strains under the two conditions tested; cross indicates significant difference (p < 0.05) in relation to the same strain in PBS (Kruskal–Wallis with Dunn’s post hoc test).
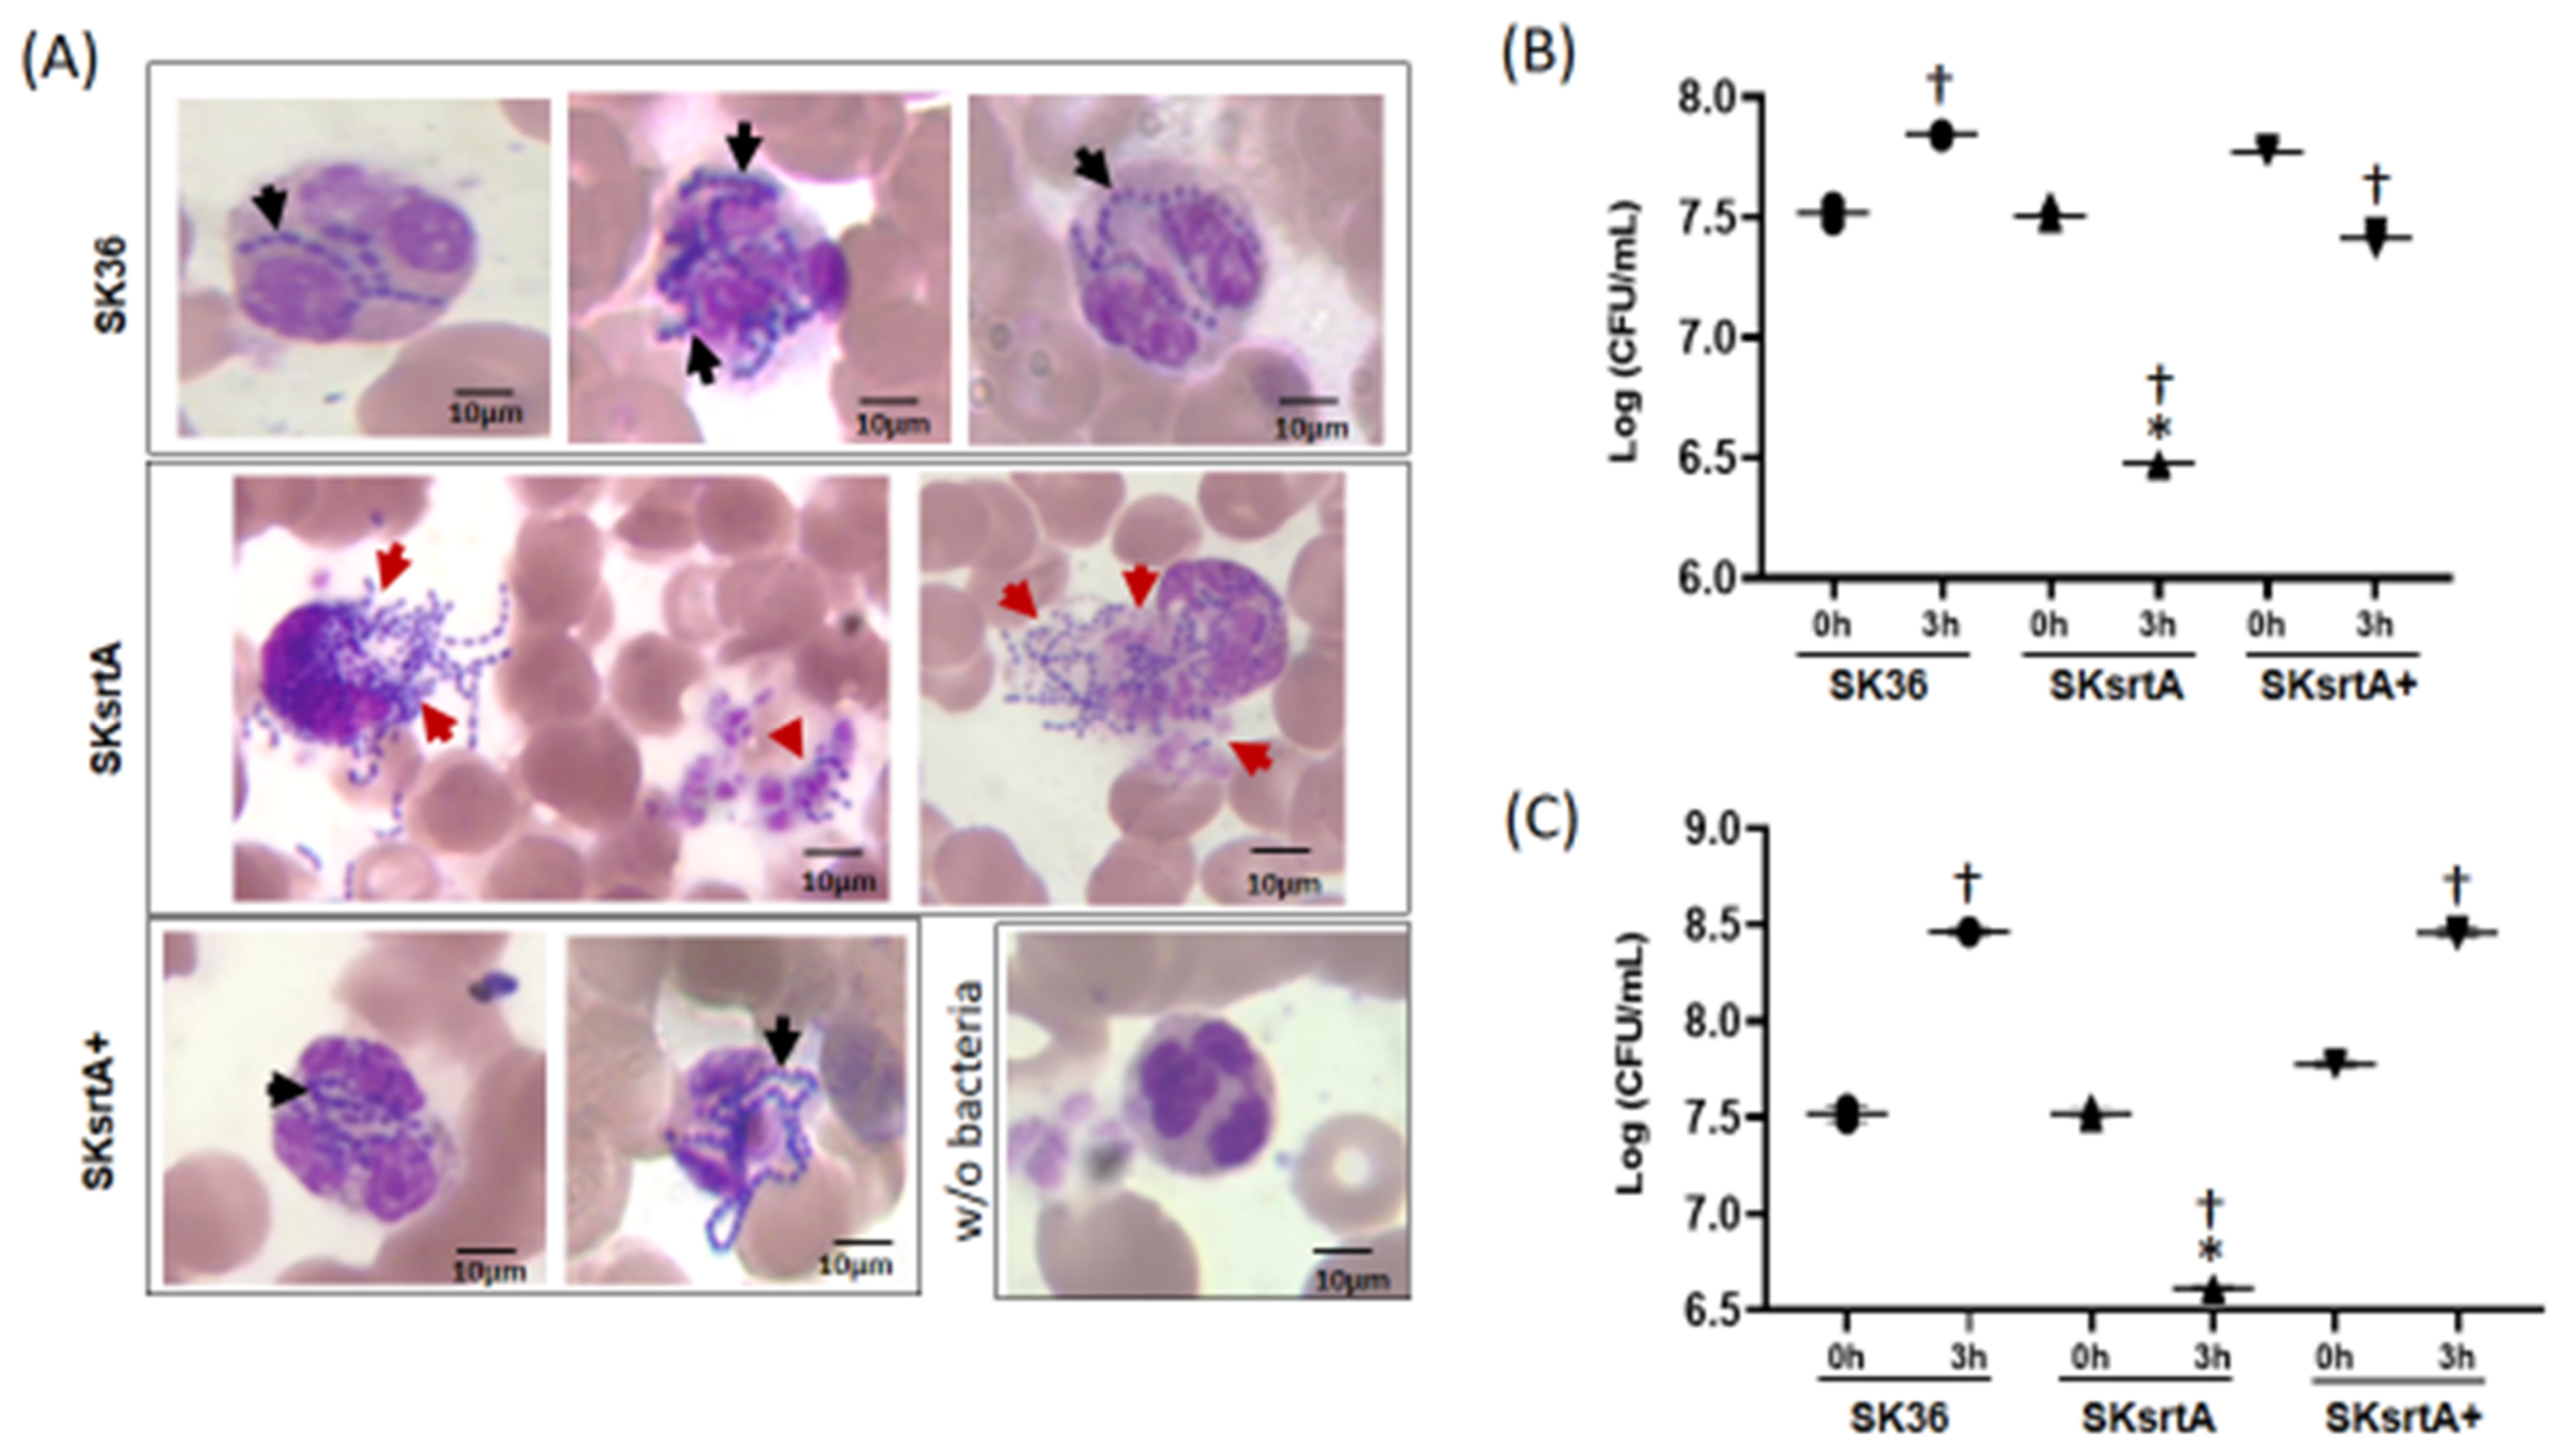
To further investigate the killing of S. sanguinis by PMNs mediated by serum/blood components, we analyzed Giemsa-stained samples of SK36, SKsrtA and SKsrtA+ incubated with fresh peripheral blood, using light microscopy. As shown in Figure 10A, unlike the SK36 chains, which could be clearly observed inside PMNs, the SKsrtA were frequently associated with a diffuse material apparently resulted from the release of PMNs intra-cellular content, suggesting the production of neutrophil extracellular traps (NETs). In addition, PMNs challenged with SKsrtA+ showed phenotypes similar to those observed in PMNs exposed to SK36. The SKsrtA mutant also showed reduced capacity to persist in human blood after 3 h of incubation under orbital rotation (for increased contact with PMNs) when compared to SK36 and SKsrtA+ (Figure 10B). In addition, while SK36 was able to grow in blood suspensions under static incubation, the SKsrtA showed a significant reduction in cell counts under this condition (Figure 10C). Moreover, the blood persistence phenotype was rescued in the complemented strain (Figure 10C). Thus, srtA deletion increases S. sanguinis susceptibility to complement-mediated immunity, affects its interactions with PMNs and reduces its persistence in human blood.

Figure 10.
Effects of srtA on S. sanguinis interactions with PMNs and persistence in human blood. (A) The strains SK36, SKsrtA and SKsrtA+ (at A550 nm 0.3) were harvested, suspended in human blood and incubated (37 °C) for 5 min. Bacterial interactions with PMNs were then analyzed via light microscopy in samples stained with May–Grunwald Giemsa stain. Digital images were obtained at 1000× magnification. Strains SK36 and SKsrtA+ were clearly associated with intact PMNs (black arrows), whereas PMNs associated with SKsrtA typically showed release of intracellular content suggestive of degranulation and/or NETosis (red arrows). (B,C) Bacterial survival in human blood. Equivalent number of strains (at A550 nm 0.3) were suspended in fresh blood and incubated (37 °C; 3 h) under orbital rotation (B) or statically (C). The numbers of viable bacteria (log CFU/mL) were determined in BHI agar plates just after bacterial suspension in blood (0 h) and after 3 h of incubation. Asterisks indicate significant difference in relation to SK36 at the same time point; cross indicates significant difference in relation to t0 h for the same strain (ANOVA with Tukey’s post hoc test; p < 0.05).
3. Discussion
The roles of S. sanguinis as a key beneficial organism of dental biofilms and important cardiovascular pathogen emphasize the need for deciphering the mechanisms through which this species forms biofilms and copes with host immune functions present in the oral cavity and in extra-oral tissues. A high diversity of phenotypes associated with biofilm formation, host persistence and cardiovascular infection has been reported among strains [17,32], and might reflect strain-specific capacities to produce and interact with exopolymers modulating these processes [17]. Although functional amyloid is a ubiquitous class of bacterial exopolymers involved in biofilm formation and host immune evasion [19,20], there are no studies addressing the roles of these exopolymers in S. sanguinis biology. Here, we show that amyloid-like aggregates are produced by several S. sanguinis strains and provide evidence that these polymers are linked to biofilm formation and to evasion to the complement system, a major branch of immune surveillance of the cardiovascular system. Moreover, we show that S. sanguinis relies on the expression of sortase A to produce amyloid exopolymers in biofilms, implying the contribution of sortase A and as yet unidentified sortase A substrates in amyloidogenesis.
Surface-associated functional amyloid generally contributes to bacterial adhesion and biofilm formation through its interaction with eDNA and exopolysaccharides [33,34,35,36]. The production of eDNA by S. sanguinis is required for bacterial aggregation and biofilm initiation [14,15], whereas the presence of sucrose, the unique substrate for the synthesis of glucan, is also required for biofilm maturation [7,15,37]. Glucan produced by S. sanguinis shows, however, lower stability than glucan produced by the competitor cariogenic species, S. mutans [12,16,17], which explains the prominent role of sucrose on S. mutans virulence, as compared to other commensal streptococci, in dental communities [38]. Thus, biofilms formed by S. sanguinis likely have shorter lifecycles when coexisting in homeostasis with host immune functions. Our findings indicate that independently of the presence of sucrose-derived glucan, S. sanguinis produces fibrous aggregates with multiple traits typical of amyloid, including protease resistance, CR-promoted birefringence under cross-polarized light and binding to ThT. These aggregates are also quite similar to amyloid polymers reported in S. mutans biofilms [23,25], which are further produced in a fashion dependent on sortase A expression [23,28].
Normally, amyloid aggregates are formed by multiple amyloid fibrils (with 5 to 20 nm in width) composed by one to multiple laterally associated protofilaments, each consisting of self-assembled stacks of monomeric peptide subunits polymerized in cross-β structures (β-strands stacked perpendicularly to the filament longer axis) [39]. Purified fragments of protein substrates of sortase A expressed by S. mutans are assembled into amyloid fibrils under certain in vitro conditions [23,28]. These include P1 (also known as SpaP, AgI/II or Pac) and WapA [23,28]. However, full-length P1 or WapA or the natural fragments of these proteins fail to form detectable amyloid components during biofilm formation in a S. mutans srtA deletion mutant [23,28]. A hypothesis to explain these findings suggested that peptideoglycan-anchored forms of P1 and WapA would be necessary as nucleator proteins for triggering the polymerization of additional monomers (amyloid fibril elongation) on the bacterial surface [23,28]. This process would be analogous to the nucleation-precipitation mechanism established for curli amyloids produced in vivo by E. coli [40]. Our findings in S. sanguinis are compatible with previous studies in S. mutans [23,28] and strengthens the need for studies clarifying the function of sortase A in the biogenesis of surface-associated amyloid polymers in S. sanguinis, as well as in other Gram-positive bacteria, during biofilm formation.
Besides P1 and WapA polypeptides, S. mutans expresses another two amyloidogenic proteins, the secreted protein Smu.63 and the serotype-restricted collagen- and laminin-binding protein Cnm, which are, respectively, required for sucrose-independent biofilm formation [23,28,41] and cardiovascular virulence [25]. Using BLASTp analysis, we confirmed that S. sanguinis genomes harbor genes encoding for P1 homologues (52% identity with S. mutans P1) but not for WapA, Smu63c or Cnm. However, whereas the S. mutans genome harbors only six genes encoding proteins with an LPxTG motif [42], a much larger number of sortase A substrates (thirty-three) was identified in the S. sanguinis SK36 genome [8]. Therefore, future studies are needed to identify which of these substrates are involved in amyloid production by S. sanguinis; purified proteins could be applied in the analyses of the hierarchical structure of these polymers and kinetics of amyloid aggregation.
The fibrilization of the C-terminal fragment of S. mutans P1 is inhibited by EGCG at 0.1 mM. Compatible with this effect, this flavonoid inhibits sucrose-independent biofilm formation in wild-type strain but not in P1-deficient mutant [28]. EGCG interferes with the amyloid fibrilization of multiple proteins [43,44,45,46], affecting not only the initial phases of amyloid polymerization but disassembling pre-formed amyloid fibers into smaller aggregates [47]. The anti-amyloidogenic effects of EGCG might therefore be detected in different strains, despite potential differences in the expression of amyloidogenic proteins, which would influence on kinetics of amyloid polymerization. Our findings that 0.1 mM EGCG inhibits biofilm formation in several S. sanguinis strains is thus compatible with the hypothesis that the P1 homologue and/or other sortase A substrates expressed by S. sanguinis contribute to amyloidogenesis. Apart from its anti-amyloidogenic properties, EGCG also modulates additional bacterial functions at different concentration ranges, including cell wall synthesis, the activity of metabolic enzymes, the synthesis of DNA and fatty acids and quorum sensing [45], which might explain the inverse effects of EGCG on the biofilm maturation of the S. sanguinis when at 1 mM.
Whether S. sanguinis amyloids also contribute to cardiac vegetations and/or atherogenesis needs to be addressed, because human and bacterial amyloid fibrils can bind to plasminogen, fibronectin and laminin [48,49,50,51]. Moreover, SAP (and/or C1q) binding to amyloid modulates inflammation and tissue damage in multiple diseases, including cardiovascular, Alzheimer’s disease, systemic amyloidosis and systemic candidiasis [52,53,54,55]. SAP (also known as pentraxin 2) is abundant in blood and binds to C1q, promoting the activation of the classical pathway of the complement in streptococci and other microorganisms [56,57]. Here, we showed a strong negative association between the amounts of amyloid-like components in the culture fluids of S. sanguinis strains, with the intensities of strain binding to SAP, C1q and C3b having been previously reported [8]. We thus speculate that extracellular amyloid could sequester the complement activating proteins (SAP and C1q), avoiding complement activation on the bacterial cell wall.
Consistent with our findings, the production of curli amyloid fibrils promotes the evasion of the classical pathway of complement activation in Escherichia coli [32]. Interestingly, two strains (SK353 and SK678) producing reduced levels of amyloid associated with high-binding levels to SAP are also defective in expressing pepO [58], the gene encoding for the metallo-endopeptidase PepO required for complement evasion in S. mutans and S. sanguinis [58,59], as well as in other pathogenic streptococci [60,61]. It is of note that PepO is part of the M13 family of zinc metallo-endopeptidases, which includes mammalian peptidases capable of degrading amyloid beta peptides [62]. Further studies will be thus necessary to investigate whether PepO modulates amyloid fibril polymerization in S. sanguinis.
Strengthening the associations between amyloid production with reduced binding to SAP/C1q/C3b in wild type strains, the SKsrtA mutant showed a significant increase in binding to C3b, which would ultimately account for reduced systemic virulence. Unexpectedly, the increased C3b deposition on SKsrtA did not reflect on its increased interaction with PMNs measured in flow cytometry assays, despite the major role of C3b in S. sanguinis opsonization [9,17]. Similarly, another S. sanguinis srtA mutant obtained in strain DSS-10 showed a modest increase in opsonophagocytic rates, despite its increased sensitivity to blood-mediated killing [63]. Because effector molecules generated by complement activation on bacterial species, e.g., C3a, C5a and CAM, stimulate PMN activation and NETosis [64,65,66], we speculate that the increased complement activation on SKsrtA enhanced bacterial killing and NETosis by PMNs, compromising the flow cytometry detection of PMNs associated with SKsrtA. This hypothesis was consistent with the microscopy analysis of PMNs challenged with SKsrtA, SK36 and SKsrtA+. Further studies will be performed to confirm the SKsrtA induction of NETosis and the potential participation of the complement system in this process.
The reduced persistence of SKsrtA in human blood as compared to SK36 further indicates an increased sensitivity of SKsrtA to blood antimicrobial components (either derived from PMNs or not) and/or defects in blood fitness, as reported for srtA mutants obtained in Streptococcus pyogenes [67]. Interestingly, another srtA mutant obtained in SK36 showed only a two-fold reduction in competitiveness in a competitive rabbit model of IE [8]. Moreover, the screening of third one single mutants obtained in SK36 which were defective in sortase A protein substrates could not identify individual genes contributing to virulence in this same model [8]. Apart from these issues, our findings that srtA deletion promotes defects in amyloid production, affecting complement activation, interaction with human PMNs and persistence in blood, highlight the complexity of srtA roles in the S. sanguinis capacities to evade and to modulate host immunity in the bloodstream and/or in infected tissues.
In summary, here we described the production of amyloid fibrils by S. sanguinis strains and provided evidence that these exopolymers contribute to strain-specific phenotypes of biofilm formation and complement evasion. We further provided evidence that the deletion of srtA impairs amyloid production by S. sanguinis, affecting its capacity to form biofilm in the absence of sucrose and to evade blood-mediated immunity. These findings highlight the need for identifying amyloidogenic cell wall-anchored proteins of S. sanguinis, a topic of our future studies.
4. Materials and Methods
4.1. Strains, Culture and Staining Conditions
Strains used in this study are described in Table 1 [7,68,69]. Streptococcal strains were routinely grown in brain heart infusion (BHI) agar (BD Difco, Franklin Lakes, NJ, USA) at 37 °C in an aerobic atmosphere with 10% CO2 in air. When needed, growth media were supplemented with appropriate antibiotics (erythromycin (10 μg/mL) or spectinomycin (200 μg/mL) (Merck Labs, Darmstadt, Germany). For phenotypic analyses, overnight cultures with adjusted absorbances were prepared in BHI, diluted 1:100 into fresh BHI or chemically defined medium (CDM) [70] supplemented or not supplemented with 1% sucrose. For some experiments, medium was also supplemented with freshly prepared solution of 20 mM epigallocatechin-3-gallate (EGCG) (Sigma-Aldrich, St. Louis, MO, USA) in dH2O, which were filtered through polyethersulfone filters with pores of 0.22 µm in diameter (Kasvi K18-230). Escherichia coli was grown in a 37 °C shaker incubator in Luria–Bertani broth (BD Difco, USA) supplemented with ampicillin (100 µg/mL). Solutions of CR (Sigma-Aldrich) and thioflavin T (ThT; Sigma-Aldrich) were prepared, as previously described [23] and according to the supplier. Briefly, 80 mL of CR solution (0.5 g in 80 mL of 100% ethanol) were mixed with 20 mL of NaCl solution (2.0 g in 20 mL of dH2O) and filtered using polyethersulfone membranes with pores of 0.22 µm in diameter; Kasvi). ThT 20 mM stock solution was prepared by dissolving 0.0064 g of ThT (Sigma-Aldrich) in 1 mL of phosphate buffer (10 mM Na2HPO4; 150 mM NaCl; pH 7.0).

Table 1.
Streptococcal strains included in this study.
4.2. Construction of the srtA Isogenic Mutants and Complemented Strain
The srtA nonpolar deletion mutant was obtained in SK36 using a PCR-ligation strategy, as previously described [71]. Primers used for the construction of mutant and complement strains and for RT-qPCR analysis are shown in Table 2. Briefly, a recombinant allele (2245 bp) was constructed by replacing the srtA gene (SSA_1219; 756 bp) with an erythromycin resistance cassette (Ermr) obtained from plasmid pVA838 [72]. The recombinant allele was transformed into SK36 to generate the mutant strain SKsrtA, which was placed on BHI agar supplemented with erythromycin. The SKsrtA was confirmed via PCR and DNA sequencing analysis. The srtA-complemented strain (SKsrtA+) was obtained by transforming SKsrtA with plasmid pDL278::srtA harboring a spectinomycin resistance gene [73] and a full-length copy of srtA with its promoter region (1529 pb), which was amplified from the SK36 genomic DNA with primers C1 and C2 (Table 2). RT-qPCR analysis was performed, as described in previous studies [59], to confirm srtA transcription in SKsrtA+, using specific primers for srtA and 16S rRNA gene as reference (Table 2).
Table 2.
Oligonucleotides used in this study.
4.3. Detection of Amyloid Fibrils in Biofilms by Cross-Polarized Light Microscopy and Fluorescence Microscopy
Amyloid fibrils in mature biofilms were analyzed as described elsewhere [27], with some modifications. Briefly, bacterial strains were grown in CDM (37 °C, 10% CO2 in air for 18 h) and these cultures were diluted into fresh CDM with and without 1% sucrose to an adjusted absorbance (A550 nm 0.03). The culture dilutions were then transferred to 24-well plates (Kasvi) (1.5 mL/well), which were incubated for 72 h under the same conditions. Afterwards, the biofilms were suspended in their culture fluids and these samples were harvested (6000× g, 3 min., 4 °C). The biofilm pellets were then suspended in a proteinase K solution (10 µg/uL; ThermoFisher) or PBS (negative control), incubated for 3 h at 37 °C and the enzyme reaction was halted by adding phenylmethylsulfonyl fluoride (PMSF; 2 mM) [27]. The biofilm samples were harvested again (6000× g; 3 min.; 4 °C) and suspended in 100 µL of 0.5% CR solution. Aliquots of these suspensions (20 µL) were transferred to glass slides and analyzed using a polarized light microscope (Leica DMLP). Birefringence was detected by applying the polarizer at 90°. Digital images were obtained under polarized light at 200× total magnification. Alternatively, the harvested samples of biofilms were suspended in 500 µL of PBS with 2.5 uM ThT and transferred to glass slides for analysis in a fluorescence microscope equipped with a digital camera (Zeiss Axiovert 40 CFL; filter set 09-Ex BP 450–490; Em LP 515). Digital images were then obtained at 200× total magnification.
4.4. Macrocolony Phenotype
The macrocolony morphology of strains was analyzed as previously described [34] with modifications. Briefly, strains were grown in BHI for 18 h (37 °C; 10% CO2in air), and aliquots of 10 µL of these cultures with adjusted absorbance were spotted on BHI agar supplemented with CR (40 µg/mL) and incubated under the same conditions for 1 to 3 days. Digital images of macrocolony morphologies were obtained each day. All the strains were placed in the same agar plate for comparison.
4.5. Preparation of Culture Supernatants
Amyloid formation was assessed in samples of concentrated supernatants of S. sanguinis cultures obtained in sucrose-free CDM with or without EGCG. The samples were prepared as previously described [74] with minor modifications. Briefly, aliquots of 18 h cultures in CDM [70] with an adjusted numbers of cells were diluted (1:10) into 40 mL of fresh CDM and incubated for 18 h (37 °C; 10% CO2 in air). The A550 nm of the cultures were monitored, and 50 mL of the cultures centrifuged twice (6000× g; 4 °C; 4 min.) for collection of culture supernatants. Samples were then filtered through polyethersulfone membranes (0.22 µm-pore diameter; Kasvi) for the removal of remaining cells. The pH of these culture fluids were then neutralized by adding 1 M NaOH, and phenylmethylsulfonyl fluoride (PMSF) was added to a final concentration of 10 µM for protease inhibition. The samples were then dialyzed for 18 h at 4 °C against cold phosphate buffer (Na2HPO4; NaH2HPO4; 0.2 M; pH 6.5) and then against cold 1:100 diluted Tris-HCl buffer (0.125 M; pH 6.8). Afterwards, the samples were 100-fold concentrated by freeze-drying. The protein concentration of samples were then determined using a Bradford assay (BioRad, Darmstadt, Germany) and the integrity of protein samples monitored in 8% SDS-PAGE gels stained with Coomassie blue.
4.6. Quantitative Analysis of Amyloid through Spectrofluorimetry
To assess the amounts of amyloid fibrils in culture supernatants, samples of concentrated culture fluids (1 µg/mL diluted in 50 mM NaH2PO4, 300 mM NaCl; pH 8.0) and 2.5 µM of ThT were added and incubated at rt for 30 min. The samples were then transferred to black polystyrene 96-well microtiter plates (Corning, New York, NY, USA) (100 µL/well in quadruplicates) and the intensities of fluorescence were determined using a spectrofluorometer (Promega GloMax®® Discover System, Madison, WI, USA) at 425 nm excitation wavelength and emission spectra collected at 495 to 505 nm. Serial dilutions of BSA were used as negative control. A standard curve of the concentrated culture supernatant of S. mutans UA159 (0.125; 0.5; 0.75; 1; 1.25; 1.5 and 2 µg/µL) was also used as reference in all the experiments to ensure ThT fluorescence under a linear range of detection. Similar assays were performed with strains SKsrtA, SKsrtA+ and SK36 using samples of similarly prepared culture fluids obtained in CDM supplemented or not with 0.1 mM EGCG and stirred for 24 h at 4 °C. Samples were collected from cultures obtained on three different days for each strain analyzed. To monitor the presence of amyloid-like aggregates, aliquots of ThT-stained samples were also analyzed using fluorescence microscopy as described above.
4.7. Biofilm Formation Assays
Biofilm formation in the presence or absence of EGCG was analyzed using 96-well microtiter plate assays as previously described [17] with minor modifications. Briefly, 18 h BHI cultures with adjusted absorbances were diluted (1:10) in fresh 1% sucrose BHI or 1% sucrose BHI supplemented with EGCG at 0.1 and 1 mM [23]. Aliquots of the culture dilutions were then transferred to polystyrene 96-well plates (CralPlast) (200 µL/well), which were then incubated (37 °C, aerobiosis under gentle agitation-80 rpm) for 18 h. Afterwards, biofilm fluids were removed, and the plates were gently washed twice via immersion in water. Biofilms were then stained with 1% crystal violet for 30 min (rt), washed twice with water and dried for 1 to 2 h at rt. Then, the stain was eluted from biofilms via incubation with ethanol (200 µL/well; 30 min, rt), and the absorbances (A575 nm) of the eluates were expressed as indirect measures of biofilm biomass. The planktonic growth of strains was monitored in the same culture dilutions, which were incubated under similar conditions. Three independent experiments were performed in triplicate.
Biofilms were also formed in 24-well plates using cultures in CDM and in 1% sucrose CDM, which were supplemented or not supplemented with EGCG. Briefly, 18 h cultures in CDM were diluted (to A550 nm 0.03) into fresh CDM or 1% sucrose CDM (with and without 0.1 mM EGCG) and transferred to 24-well polystyrene plates (Kasvi). After incubation (37 °C; 10% CO2) for 72 h, the biofilm fluids were carefully removed by pipetting and gently washed by pipetting with distilled water. The biofilms were then stained with 1% crystal violet and processed, as previously described for quantification of biofilm biomass.
4.8. C3b Deposition
The deposition of C3b on S. sanguinis strains was determined as previously described [17]. Briefly, approximately 107 CFU of bacteria collected from culture at mid-log phase (A550 nm 0.3) via centrifugation (10,000× g, 4 °C) were washed twice with PBS (pH 7.4), resuspended in 20 µL of 20% serum in PBS and incubated at 37 °C for 30 min. Cells were then washed twice with PBS Tween 0.05% (PBST) and incubated on ice with fluorescein isothiocyanate (FITC)-conjugated polyclonal goat anti-human C3 IgG antibody (ICN, Seattle, CA, USA) (1:300 in PBST). Afterwards, cells were washed twice in PBST and fixed in 3% paraformaldehyde for flow cytometry analysis using a FACSCalibur flow cytometer (BD Biosciences). At least 25,000 bacteria were gated using forward- and side-scatter parameters for the determination of the geometric mean of fluorescent intensity (MFI) in positive cells. The intensities of C3b deposition were expressed using a fluorescent index (FI), which was calculated by multiplying the MFI values by the percentage of C3b-positive cells. Bacterial cells treated only with PBS were used as negative control in all the assays. Bacterial strains treated with heat-inactivated serum (56 °C for 20 min) were also used in preliminary experiments as negative controls to confirm that non-complement serum components had irrelevant effects on strain comparisons.
4.9. PMN Isolation and Phagocytosis Assay
Human PMNs were isolated from fresh heparinized blood collected from a healthy volunteer under the approval of the Ethics Committee of the Piracicaba Dental School, State University of Campinas (CEP/FOP-UNICAMP; CONEP protocol no. 58699622.4.0000.5418). PMNs were isolated using double gradient (1119 and 1083 density Histopaque; Sigma-Aldrich) followed by the removal of red blood cells via hypotonic lysis. The isolated PMNs were suspended in RPMI 1640 medium (GIBCO, Life Technologies, Waltham, NY, USA) supplemented with inactivated 10% fetal bovine serum. Cell viability (>98%) and purity (>95%) were monitored using trypan blue exclusion and May–Grunwald Giemsa staining, respectively. For the phagocytosis assay, bacteria were labeled with FITC as previously described [17]. Briefly, bacteria were harvested via centrifugation from cultures at A550 nm 0.3, washed twice with PBS, suspended in FITC (Sigma) solution (1.7 mg/mL in carbonate buffer (Na2CO3 0.15 M, 0.9% NaCl; pH 9) and incubated at rt in the dark for 1 h. Bacteria were then collected via centrifugation, washed three times with PBST for application in the phagocytosis assays or stored overnight in 10% glycerol at −70 °C until use. Phagocytosis assays were performed on 96-well plates containing (per well) 107 CFU of FITC-labeled bacteria and 2 × 10⁵ PMNs (to a multiplicity of infection (MOI) of 200 bacteria per PMN) in RPMI medium or RPMI medium supplemented with 20% human serum.
4.10. Microscopy Analysis of Bacterial Phagocytosis in Human Blood
Bacteria from cultures in BHI at log phase (A550 nm 0.3) were harvested via centrifugation (10,000× g; 5 min, 4 °C), washed with PBS, gently suspended in 500 µL of heparinized human peripheral blood collected from one healthy donor as previously described [59], under approval of the Committee of the Piracicaba Dental School, State University of Campinas (CEP/FOP-UNICAMP; CAAE 58699622.4.0000.5418). Samples were then incubated at 37 °C for 5 min [75] and duplicate blood smears with aliquots of these suspensions were stained using May–Grunwald Giemsa and analyzed using light microscopy. Digital images were obtained at 1000× total magnification. Three experiments were performed on blood samples collected on different days.
4.11. Bacterial Persistence in Human Blood
The survival of S. sanguinis strains in human blood was analyzed in ex vivo assays. Briefly, strains were grown in BHI to A550 nm 0.3, harvested via centrifugation (11,000× g, 2 min), washed twice in PBS and resuspended in 1 mL of fresh peripheral blood. Aliquots of these suspensions were collected just after bacterial suspension (time 0 h) and after 3 h of incubation at 37 °C under orbital rotation, serially diluted and plated onto BHI agar for the determination of bacterial counts (log of CFU/mL). Similar assays were performed with the difference that blood suspensions were incubated without rotation to allow the PMNs to sink at the bottom of the tube [67]. Three independent experiments were performed in duplicate.
4.12. Data Analyses
Biofilm formation and flow cytometry data were compared between strains using Kruskal–Wallis with Dunns’s post hoc test. Pearson’s correlation analysis was applied to compare the amounts of amyloid detected in culture fluids determined in the wild-type strains with previously published data of strain binding to complement proteins and opsonophagocytosis by neutrophils (PMNs). Bacterial viability in human blood were compared using ANOVA with Tukey’s post hoc test.
Supplementary Materials
The supporting information can be downloaded at: https://www.mdpi.com/article/10.3390/ijms242115686/s1.
Author Contributions
R.O.M.-G., L.A.A. and E.M.F. conceived and designed experiments. E.M.F. and L.A.A. performed microscopy analyses of amyloid fibrils in biofilms and profiles of amyloid binding to CR. E.M.F. analyzed biofilm formation under diverse experimental conditions. E.M.F., L.A.A. and V.A.A.F. performed fluorimetric assays for the quantification of amyloid components in bacterial culture supernatants. E.M.F., L.A.A. and H.N. constructed the srtA mutant and complemented strain. E.M.F., L.A.A., D.C.B. and H.N. performed the flow cytometry analyses of complement deposition on bacterial strains and the analyses of bacterial persistence in human blood. E.M.F., V.A.A.F. and D.C.B. performed flow cytometry analyses of phagocytosis of the bacterial strains by PMNs. E.M.F. performed the light microscopy analysis of PMNs. R.O.M.-G., E.M.F. and L.A.A. analyzed and interpreted the data. R.O.M.-G. and E.M.F. wrote the manuscript. All the authors revised the manuscript and approved its final version. All authors have read and agreed to the published version of the manuscript.
Funding
This study was supported by the Fundação de Amparo à Pesquisa do Estado de São Paulo (FAPESP; grants no. 2018/02054-4 and 2021/13074-9). ROMG was also supported by the Conselho Nacional de Desenvolvimento Científico e Tecnológico (CNPq; grant no. 303896/2022-1). DB was supported by the Coordenação de Aperfeiçoamento de Pessoal de Nível Superior-Brasil (CAPES; PNPD 8887.352647/2019–0). LAA was supported by FAPESP (fellowship no. 2017/19899-4 and grant no. 2023/02087-8). VAF was supported by FAPESP (fellowship no. 2018/12248-0). HN and EMF were supported by CAPES. This study was also partially financed by CAPES-Finance Code 001.
Institutional Review Board Statement
This study was carried out in strict accordance with the Committee of the Piracicaba Dental School, State University of Campinas, SP, Brazil (CEP/FOP-UNICAMP; CAAE 58699622.4.0000.5418).
Informed Consent Statement
Informed consent was obtained from all subjects involved in the study as donors of blood samples.
Data Availability Statement
The data that support the findings of this study are openly available in https://doi.org/10.25824/redu/M34NUY (accessed on 16 June 2023).
Acknowledgments
We thank Mogens Kilian for providing the S. sanguinis clinical strains and Jacqueline Abranches for providing the S. mutans strain OMZ175. We thank Flávia Sammartino Mariano Rodrigues and Eliane Melo Franco de Souza for their kind assistance during cross-polarized light microscopy and fluorescence microscopy analyses. We also thank Marlise Inêz Klein for helpful discussions and critical reading of this manuscript.
Conflicts of Interest
The authors declare no conflict of interest.
References
- Kreth, J.; Giacaman, R.; Raghavan, R.; Merritt, J. The Road Less Traveled—Defining Molecular Commensalism with Streptococcus sanguinis. Mol. Oral Microbiol. 2017, 32, 181–196. [Google Scholar] [CrossRef] [PubMed]
- Zhu, B.; Macleod, L.C.; Kitten, T.; Xu, P. Streptococcus sanguinis Biofilm Formation & Interaction with Oral Pathogens. Future Microbiol. 2018, 13, 915–932. [Google Scholar] [PubMed]
- VON Reyn, C.F.; Levy, B.S.; Arbeit, R.D.; Friedland, G.; Crumpacker, C.S. Infective Endocarditis: An Analysis Based on Strict Case Definitions. Ann. Intern. Med. 1981, 94, 505–518. [Google Scholar] [CrossRef]
- Douglas, C.W.I.; Heath, J.; Hampton, K.K.; Preston, F.E. Identity of viridans streptococci isolated from cases of infective endocarditis. J. Med. Microbiol. 1993, 39, 179–182. [Google Scholar] [CrossRef] [PubMed]
- Kovuri, P.; Kumaran, S.S.; Chatterjee, T. Streptococcus sanguinis Endocarditis of Bicuspid Aortic Valve Presenting as Septic Arthritis of Lumbar Facet Joint. Cureus 2022, 14, e24189. [Google Scholar] [CrossRef] [PubMed]
- Nakano, K.; Inaba, H.; Nomura, R.; Nemoto, H.; Takeda, M.; Yoshioka, H.; Matsue, H.; Takahashi, T.; Taniguchi, K.; Amano, A.; et al. Detection of Cariogenic Streptococcus mutans in Extirpated Heart Valve and Atheromatous Plaque Specimens. J. Clin. Microbiol. 2006, 44, 3313–3317. [Google Scholar] [CrossRef]
- Xu, P.; Alves, J.M.; Kitten, T.; Brown, A.; Chen, Z.; Ozaki, L.S.; Manque, P.; Ge, X.; Serrano, M.G.; Puiu, D.; et al. Genome of the Opportunistic Pathogen Streptococcus sanguinis. J. Bacteriol. 2007, 189, 3166–3175. [Google Scholar] [CrossRef]
- Turner, L.S.; Kanamoto, T.; Unoki, T.; Munro, C.L.; Wu, H.; Kitten, T. Comprehensive Evaluation of Streptococcus sanguinis Cell Wall-Anchored Proteins in Early Infective Endocarditis. Infect. Immun. 2009, 77, 4966–4975. [Google Scholar] [CrossRef]
- Alves, L.A.; de Carli, T.R.; Harth-Chu, E.N.; Mariano, F.S.; Höfling, J.F.; Stipp, R.N.; Mattos-Graner, R.O. Oral streptococci show diversity in resistance to complement immunity. J. Med. Microbiol. 2019, 68, 600–608. [Google Scholar] [CrossRef]
- Salam, M.A.; Nakao, R.; Yonezawa, H.; Watanabe, H.; Senpuku, H. Human T-cell responses to oral streptococci in human PBMC-NOD/SCID mice. Oral Microbiol. Immunol. 2006, 21, 169–176. [Google Scholar] [CrossRef]
- Lee, Y.H.; Zimmerman, J.N.; Custodio, W.; Xiao, Y.; Basiri, T.; Hatibovic-Kofman, S.; Siqueira, W.L. Proteomic Evaluation of Acquired Enamel Pellicle during In Vivo Formation. PLoS ONE 2013, 8, e67919. [Google Scholar] [CrossRef] [PubMed]
- Díaz-Garrido, N.; Lozano, C.P.; Kreth, J.; Giacaman, R.A. Competition and Caries on Enamel of a Dual-Species Biofilm Model with Streptococcus mutans and Streptococcus sanguinis. Appl. Environ. Microbiol. 2020, 86, e01262-20. [Google Scholar] [CrossRef] [PubMed]
- Kreth, J.; Merritt, J.; Shi, W.; Qi, F. Competition and Coexistence between Streptococcus mutans and Streptococcus sanguinis in the Dental Biofilm. J. Bacteriol. 2005, 187, 7193–7203. [Google Scholar] [CrossRef] [PubMed]
- Kreth, J.; Vu, H.; Zhang, Y.; Herzberg, M.C. Characterization of Hydrogen Peroxide-Induced DNA Release by Streptococcus sanguinis and Streptococcus gordonii. J. Bacteriol. 2009, 191, 6281–6291. [Google Scholar] [CrossRef]
- Moraes, J.J.; Stipp, R.N.; Harth-Chu, E.N.; Camargo, T.M.; Höfling, J.F.; Mattos-Graner, R.O. Two-Component System VicRK Regulates Functions Associated with Establishment of Streptococcus sanguinis in Biofilms. Infect. Immun. 2014, 82, 4941–4951. [Google Scholar] [CrossRef]
- Yoshida, Y.; Konno, H.; Nagano, K.; Abiko, Y.; Nakamura, Y.; Tanaka, Y.; Yoshimura, F. The influence of a glucosyltransferase, encoded by gtfP, on biofilm formation by Streptococcus sanguinis in a dual-species model. APMIS 2014, 122, 951–960. [Google Scholar] [CrossRef]
- Alves, L.A.; Salvatierra, G.C.; Freitas, V.A.; Höfling, J.F.; Bastos, D.C.; Araujo, T.L.S.; Mattos-Graner, R.O. Diversity in Phenotypes Associated With Host Persistence and Systemic Virulence in Streptococcus sanguinis Strains. Front. Microbiol. 2022, 13, 875581. [Google Scholar] [CrossRef]
- Eisenberg, D.; Jucker, M. The Amyloid State of Proteins in Human Diseases. Cell 2012, 148, 1188–1203. [Google Scholar] [CrossRef]
- Levkovich, S.A.; Gazit, E.; Bar-Yosef, D.L. Two Decades of Studying Functional Amyloids in Microorganisms. Trends Microbiol. 2021, 29, 251–265. [Google Scholar] [CrossRef]
- Salinas, N.; Povolotsky, T.L.; Landau, M.; Kolodkin-Gal, I. Emerging Roles of Functional Bacterial Amyloids in Gene Regulation, Toxicity, and Immunomodulation. Microbiol. Mol. Biol. Rev. 2021, 85, e00062-20. [Google Scholar] [CrossRef]
- Mikhail Belousov Prokaryotic Amyloids in Interspecies Interactions. Encyclopedia. 2023, pp. 1–14. Available online: https://encyclopedia.pub/entry/2620 (accessed on 4 October 2023).
- Tursi, S.A.; Tükel, Ç. Curli-Containing Enteric Biofilms Inside and Out: Matrix Composition, Immune Recognition, and Disease Implications. Microbiol. Mol. Biol. Rev. 2018, 82, e00028-18. [Google Scholar] [CrossRef] [PubMed]
- Oli, M.W.; Otoo, H.N.; Crowley, P.J.; Heim, K.P.; Nascimento, M.M.; Ramsook, C.B.; Lipke, P.N.; Brady, L.J. Functional amyloid formation by Streptococcus mutans. Microbiology 2012, 158, 2903–2916. [Google Scholar] [CrossRef] [PubMed]
- Chen, D.; Cao, Y.; Yu, L.; Tao, Y.; Zhou, Y.; Zhi, Q.; Lin, H. Characteristics and influencing factors of amyloid fibers in S. mutans biofilm. AMB Express 2019, 9, 31. [Google Scholar] [CrossRef] [PubMed]
- di Cologna, N.M.; Samaddar, S.; Valle, C.A.; Vargas, J.; Aviles-Reyes, A.; Morales, J.; Ganguly, T.; Pileggi, R.; Brady, L.J.; Lemos, J.A.; et al. Amyloid Aggregation of Streptococcus mutans Cnm Influences Its Collagen-Binding Activity. Appl. Environ. Microbiol. 2021, 87, e0114921. [Google Scholar] [CrossRef] [PubMed]
- Van Gerven, N.; Van der Verren, S.E.; Reiter, D.M.; Remaut, H. The Role of Functional Amyloids in Bacterial Virulence. J. Mol. Biol. 2018, 430, 3657–3684. [Google Scholar] [CrossRef]
- Barran-Berdon, A.L.; Ocampo, S.; Haider, M.; Morales-Aparicio, J.; Ottenberg, G.; Kendall, A.; Yarmola, E.; Mishra, S.; Long, J.R.; Hagen, S.J.; et al. Enhanced purification coupled with biophysical analyses shows cross-β structure as a core building block for Streptococcus mutans functional amyloids. Sci. Rep. 2020, 10, 5138. [Google Scholar] [CrossRef]
- Besingi, R.N.; Wenderska, I.B.; Senadheera, D.B.; Cvitkovitch, D.G.; Long, J.R.; Wen, Z.T.; Brady, L.J. Functional amyloids in Streptococcus mutans, their use as targets of biofilm inhibition and initial characterization of SMU_63c. Microbiology 2017, 163, 488–501. [Google Scholar] [CrossRef]
- Biesecker, S.G.; Nicastro, L.K.; Wilson, R.P.; Tükel, Ç. The Functional Amyloid Curli Protects Escherichia coli against Complement-Mediated Bactericidal Activity. Biomolecules 2018, 8, 5. [Google Scholar] [CrossRef]
- Claessen, D.; Rink, R.; De Jong, W.; Siebring, J.; De Vreugd, P.; Boersma, F.G.H.; Dijkhuizen, L.; Wösten, H.A.B. A Novel Class of Secreted Hydrophobic Proteins Is Involved in Aerial Hyphae Formation in Streptomyces coelicolor by Forming Amyloid-like Fibrils. Genes Dev. 2003, 17, 1714–1726. [Google Scholar] [CrossRef]
- Bokhove, M.; Claessen, D.; de Jong, W.; Dijkhuizen, L.; Boekema, E.J.; Oostergetel, G.T. Chaplins of Streptomyces coelicolor self-assemble into two distinct functional amyloids. J. Struct. Biol. 2013, 184, 301–309. [Google Scholar] [CrossRef]
- Baker, S.P.; Nulton, T.J.; Kitten, T. Genomic, Phenotypic, and Virulence Analysis of Streptococcus sanguinis Oral and Infective-Endocarditis Isolates. Infect. Immun. 2019, 87, e00703-18. [Google Scholar] [CrossRef] [PubMed]
- Branda, S.S.; Chu, F.; Kearns, D.B.; Losick, R.; Kolter, R. A major protein component of the Bacillus subtilis biofilm matrix. Mol. Microbiol. 2006, 59, 1229–1238. [Google Scholar] [CrossRef]
- Serra, D.O.; Richter, A.M.; Hengge, R.; Stahlhut, S.G.; Chattopadhyay, S.; Kisiela, D.I.; Hvidtfeldt, K.; Clegg, S.; Struve, C.; Sokurenko, E.V.; et al. Cellulose as an Architectural Element in Spatially Structured Escherichia coli Biofilms. J. Bacteriol. 2013, 195, 5540–5554. [Google Scholar] [CrossRef]
- Gunn, J.S.; Bakaletz, L.O.; Wozniak, D.J. What’s on the Outside Matters: The Role of the Extracellular Polymeric Substance of Gram-Negative Biofilms in Evading Host Immunity and as a Target for Therapeutic Intervention. J. Biol. Chem. 2016, 291, 12538–12546. [Google Scholar] [CrossRef] [PubMed]
- Payne, D.E.; Boles, B.R. Emerging interactions between matrix components during biofilm development. Curr. Genet. 2016, 62, 137–141. [Google Scholar] [CrossRef]
- Ge, X.; Kitten, T.; Chen, Z.; Lee, S.P.; Munro, C.L.; Xu, P. Identification of Streptococcus sanguinis Genes Required for Biofilm Formation and Examination of Their Role in Endocarditis Virulence. Infect. Immun. 2008, 76, 2551–2559. [Google Scholar] [CrossRef] [PubMed]
- Lemos, J.A.; Palmer, S.R.; Zeng, L.; Wen, Z.T.; Kajfasz, J.K.; Freires, I.A.; Abranches, J.; Brady, L.J. The Biology of Streptococcus mutans. Microbiol Spectr. 2019, 7, 1–25. [Google Scholar] [CrossRef]
- Taylor, A.I.P.; Staniforth, R.A. General Principles Underpinning Amyloid Structure. Front. Neurosci. 2022, 16, 878869. [Google Scholar] [CrossRef]
- Evans, M.L.; Chapman, M.R. Curli biogenesis: Order out of disorder. Biochim. Biophys. Acta BBA Mol. Cell Res. 2014, 1843, 1551–1558. [Google Scholar] [CrossRef] [PubMed]
- Yarmola, E.; Yarmola, E.; Ishkov, I.P.; Ishkov, I.P.; di Cologna, N.M.; di Cologna, N.M.; Menashe, M.; Menashe, M.; Whitener, R.L.; Whitener, R.L.; et al. Amyloid Aggregates Are Localized to the Nonadherent Detached Fraction of Aging Streptococcus mutans Biofilms. Microbiol. Spectr. 2022, 10, e0166122. [Google Scholar] [CrossRef] [PubMed]
- Lévesque, C.M.; Voronejskaia, E.; Huang, Y.-C.C.; Mair, R.W.; Ellen, R.P.; Cvitkovitch, D.G. Involvement of Sortase Anchoring of Cell Wall Proteins in Biofilm Formation by Streptococcus mutans. Infect. Immun. 2005, 73, 3773–3777. [Google Scholar] [CrossRef] [PubMed]
- Fernandes, L.; Messias, B.; Pereira-Neves, A.; Azevedo, E.P.; Araújo, J.; Foguel, D.; Palhano, F.L. Green Tea Polyphenol Microparticles Based on the Oxidative Coupling of EGCG Inhibit Amyloid Aggregation/Cytotoxicity and Serve as a Platform for Drug Delivery. ACS Biomater. Sci. Eng. 2020, 6, 4414–4423. [Google Scholar] [CrossRef] [PubMed]
- Stenvang, M.; Dueholm, M.S.; Vad, B.S.; Seviour, T.W.; Zeng, G.; Geifman-Shochat, S.; Søndergaard, M.T.; Christiansen, G.; Meyer, R.L.; Kjelleberg, S.; et al. Epigallocatechin Gallate Remodels Overexpressed Functional Amyloids in Pseudomonas aeruginosa and Increases Biofilm Susceptibility to Antibiotic Treatment. J. Biol. Chem. 2016, 291, 26540–26553. [Google Scholar] [CrossRef] [PubMed]
- Renzetti, A.; Betts, J.W.; Fukumoto, K.; Rutherford, R.N. Antibacterial green tea catechins from a molecular perspective: Mechanisms of action and structure–activity relationships. Food Funct. 2020, 11, 9370–9396. [Google Scholar] [CrossRef] [PubMed]
- Matilla-Cuenca, L.; Taglialegna, A.; Gil, C.; Toledo-Arana, A.; Lasa, I.; Valle, J. Bacterial biofilm functionalization through Bap amyloid engineering. NPJ Biofilms Microbiomes 2022, 8, 62. [Google Scholar] [CrossRef]
- Fernandes, L.; Cardim-Pires, T.R.; Foguel, D.; Palhano, F.L. Green Tea Polyphenol Epigallocatechin-Gallate in Amyloid Aggregation and Neurodegenerative Diseases. Front. Neurosci. 2021, 15, 718188. [Google Scholar] [CrossRef]
- DeBeer, F.; Baltz, M.; Holford, S.; Feinstein, A.; Pepys, M. Fibronectin and C4-binding protein are selectively bound by aggregated amyloid P component. J. Exp. Med. 1981, 154, 1134–1149. [Google Scholar] [CrossRef]
- Olsén, A.; Jonsson, A.; Normark, S. Fibronectin binding mediated by a novel class of surface organelles on Escherichia coll. Nature 1989, 338, 652–655. [Google Scholar] [CrossRef]
- Kibbey, M.C.; Jucker, M.; Weeks, B.S.; Neve, R.L.; E Van Nostrand, W.; Kleinman, H.K. β-Amyloid precursor protein binds to the neurite-promoting IKVAV site of laminin. Proc. Natl. Acad. Sci. USA 1993, 90, 10150–10153. [Google Scholar] [CrossRef]
- Sjöbring, U.; Pohl, G.; Olsén, A. Plasminogen, absorbed by Escherichia coli expressing curli or by Salmonella enteritidis expressing thin aggregative fimbriae, can be activated by simultaneously captured tissue-type plasminogen activator (t-PA). Mol. Microbiol. 1994, 14, 443–452. [Google Scholar] [CrossRef]
- Rahman, M.M.; Lendel, C. Extracellular protein components of amyloid plaques and their roles in Alzheimer’s disease pathology. Mol. Neurodegener. 2021, 16, 59. [Google Scholar] [CrossRef] [PubMed]
- A Tennent, G.; Lovat, L.B.; Pepys, M.B. Serum amyloid P component prevents proteolysis of the amyloid fibrils of Alzheimer disease and systemic amyloidosis. Proc. Natl. Acad. Sci. USA 1995, 92, 4299–4303. [Google Scholar] [CrossRef] [PubMed]
- Klotz, S.A.; Lipke, P.N. The Paradoxical Effects of Serum Amyloid-P Component on Disseminated Candidiasis. Pathogens 2022, 11, 1304. [Google Scholar] [CrossRef] [PubMed]
- Xi, D.; Luo, T.; Xiong, H.; Liu, J.; Lu, H.; Li, M.; Hou, Y.; Guo, Z. SAP: Structure, Function, and Its Roles in Immune-Related Diseases. Int. J. Cardiol. 2015, 187, 20–22. [Google Scholar] [CrossRef] [PubMed]
- Yuste, J.; Botto, M.; Bottoms, S.E.; Brown, J.S. Serum Amyloid P Aids Complement-Mediated Immunity to Streptococcus pneumoniae. PLoS Pathog. 2007, 3, 30120. [Google Scholar] [CrossRef] [PubMed]
- Doni, A.; Parente, R.; Laface, I.; Magrini, E.; Cunha, C.; Colombo, F.S.; Lacerda, J.F.; Campos, A.; Mapelli, S.N.; Petroni, F.; et al. Serum Amyloid P Component Is an Essential Element of Resistance against Aspergillus fumigatus. Nat. Commun. 2021, 12, 3739. [Google Scholar] [CrossRef]
- Alves, L.A.; Naveed, H.; Franco, E.M.; Garcia, M.T.; Freitas, V.A.; Junqueira, J.C.; Bastos, D.C.; Araujo, T.L.S.; Chen, T.; Mattos-Graner, R.O. PepO and CppA modulate Streptococcus sanguinis susceptibility to complement immunity and virulence. Virulence 2023, 14, 2239519. [Google Scholar] [CrossRef]
- Alves, L.A.; Ganguly, T.; Harth-Chú, É.N.; Kajfasz, J.; Lemos, J.A.; Abranches, J.; Mattos-Graner, R.O. PepO is a target of the two-component systems VicRK and CovR required for systemic virulence of Streptococcus mutans. Virulence 2020, 11, 521–536. [Google Scholar] [CrossRef]
- Honda-Ogawa, M.; Sumitomo, T.; Mori, Y.; Hamd, D.T.; Ogawa, T.; Yamaguchi, M.; Nakata, M.; Kawabata, S. Streptococcus pyogenes Endopeptidase O Contributes to Evasion from Complement-Mediated Bacteriolysis via Binding to Human Complement Factor C1q. J. Biol. Chem. 2017, 292, 4244–4254. [Google Scholar] [CrossRef]
- Agarwal, V.; Riesbeck, K.; Fulde, M.; Bergmann, S.; Blom, A. Streptococcus pneumoniae: Endopeptidase O (PepO): A Novel C1q Binding Complement Inhibitor. Mol. Immunol. 2013, 56, 243. [Google Scholar] [CrossRef]
- Chen, G.F.; Xu, T.H.; Yan, Y.; Zhou, Y.R.; Jiang, Y.; Melcher, K.; Xu, H.E. Amyloid beta: Structure, Biology and Structure-Based Therapeutic Development. Acta Pharmacol. Sin. 2017, 38, 1205–1235. [Google Scholar] [CrossRef] [PubMed]
- Yamaguchi, M.; Terao, Y.; Ogawa, T.; Takahashi, T.; Hamada, S.; Kawabata, S. Role of Streptococcus sanguinis Sortase A in Bacterial Colonization. Microbes Infect. 2006, 8, 2791–2796. [Google Scholar] [CrossRef] [PubMed]
- De Bont, C.M.; Boelens, W.C.; Pruijn, G.J.M. NETosis, Complement, and Coagulation: A Triangular Relationship. Cell. Mol. Immunol. 2019, 16, 19–27. [Google Scholar] [CrossRef]
- Liu, X.; Wang, Y.; Bauer, A.T.; Kirschfink, M.; Ding, P.; Gebhardt, C.; Borsig, L.; Tüting, T.; Renné, T.; Häffner, K.; et al. Neutrophils Activated by Membrane Attack Complexes Increase the Permeability of Melanoma Blood Vessels. Proc. Natl. Acad. Sci. USA 2022, 119, e2122716119. [Google Scholar] [CrossRef] [PubMed]
- Wu, X.; You, D.; Cui, J.; Yang, L.; Lin, L.; Chen, Y.; Xu, C.; Lian, G.; Wan, J. Reduced Neutrophil Extracellular Trap Formation During Ischemia Reperfusion Injury in C3 KO Mice: C3 Requirement for NETs Release. Front. Immunol. 2022, 13, 781273. [Google Scholar] [CrossRef]
- Raz, A.; Tanasescu, A.-M.; Zhao, A.M.; Serrano, A.; Alston, T.; Sol, A.; Bachrach, G.; Fischetti, V.A. Streptococcus pyogenes Sortase Mutants Are Highly Susceptible to Killing by Host Factors Due to Aberrant Envelope Physiology. PLoS ONE 2015, 10, e0140784. [Google Scholar] [CrossRef]
- Kilian, M.; Mikkelsen, L.; Henrichsen, J. Taxonomic Study of Viridans Streptococci: Description of Streptococcus gordonii Sp. Nov. and Emended Descriptions of Streptococcus sanguis (White and Niven 1946), Streptococcus oralis (Bridge and Sneath 1982), and Streptococcus mitis (Andrewes and Horder 1906). Int. J. Syst. Bacteriol. 1989, 39, 471–484. [Google Scholar] [CrossRef]
- Abranches, J.; Miller, J.H.; Martinez, A.R.; Simpson-Haidaris, P.J.; Burne, R.A.; Lemos, J.A. The Collagen-Binding Protein Cnm Is Required for Streptococcus mutans Adherence to and Intracellular Invasion of Human Coronary Artery Endothelial Cells. Infect. Immun. 2011, 79, 2277–2284. [Google Scholar] [CrossRef]
- Biswas, I.; Drake, L.; Biswas, S. Regulation of gbpC Expression in Streptococcus mutans. J. Bacteriol. 2007, 189, 6521–6531. [Google Scholar] [CrossRef]
- Camargo, T.M.; Stipp, R.N.; Alves, L.A.; Harth-Chu, E.N.; Höfling, J.F.; Mattos-Graner, R.O. Novel Two-Component System of Streptococcus sanguinis Affecting Functions Associated with Viability in Saliva and Biofilm Formation. Infect. Immun. 2018, 86, e00942-17. [Google Scholar] [CrossRef]
- Macrina, F.L.; Tobian, J.A.; Jones, K.R.; Evans, R.; Clewell, D.B. A Cloning Vector Able to Replicate in Escherichia coli and Streptococcus sanguis. Gene 1982, 19, 345–353. [Google Scholar] [CrossRef] [PubMed]
- Dunny, G.M.; Lee, L.N.; LeBlanc, D.J. Improved Electroporation and Cloning Vector System for Gram-Positive Bacteria. Appl. Environ. Microbiol. 1991, 57, 1194–1201. [Google Scholar] [CrossRef]
- Harth-Chu, E.N.; Alves, L.A.; Theobaldo, J.D.; Salomão, M.F.; Höfling, J.F.; King, W.F.; Smith, D.J.; Mattos-Graner, R.O. PcsB Expression Diversity Influences on Streptococcus mitis Phenotypes Associated with Host Persistence and Virulence. Front. Microbiol. 2019, 10, 2567. [Google Scholar] [CrossRef] [PubMed]
- Negrini, T.; Duque, C.; Vizoto, N.; Stipp Mariano, F.; Höfling, J.; Graner, E.; Mattos-Graner, R. Influence of VicRK and CovR on the Interactions of Streptococcus mutans with Phagocytes. Oral Dis. 2012, 18, 485–493. [Google Scholar] [CrossRef] [PubMed]


Disclaimer/Publisher’s Note: The statements, opinions and data contained in all publications are solely those of the individual author(s) and contributor(s) and not of MDPI and/or the editor(s). MDPI and/or the editor(s) disclaim responsibility for any injury to people or property resulting from any ideas, methods, instructions or products referred to in the content. |
© 2023 by the authors. Licensee MDPI, Basel, Switzerland. This article is an open access article distributed under the terms and conditions of the Creative Commons Attribution (CC BY) license (https://creativecommons.org/licenses/by/4.0/).